TEAD1 is crucial for developmental myelination, Remak bundles, and functional regeneration of peripheral nerves
- Department of Neural Sciences, Shriners Hospitals Pediatric Research Center, Lewis Katz School of Medicine, Temple University, United States
- Department of Bioengineering, Temple University, United States
- Department of Pharmacology & Toxicology, Medical College of Georgia, Augusta University, United States
Figures
Figure 1 with 1 supplement
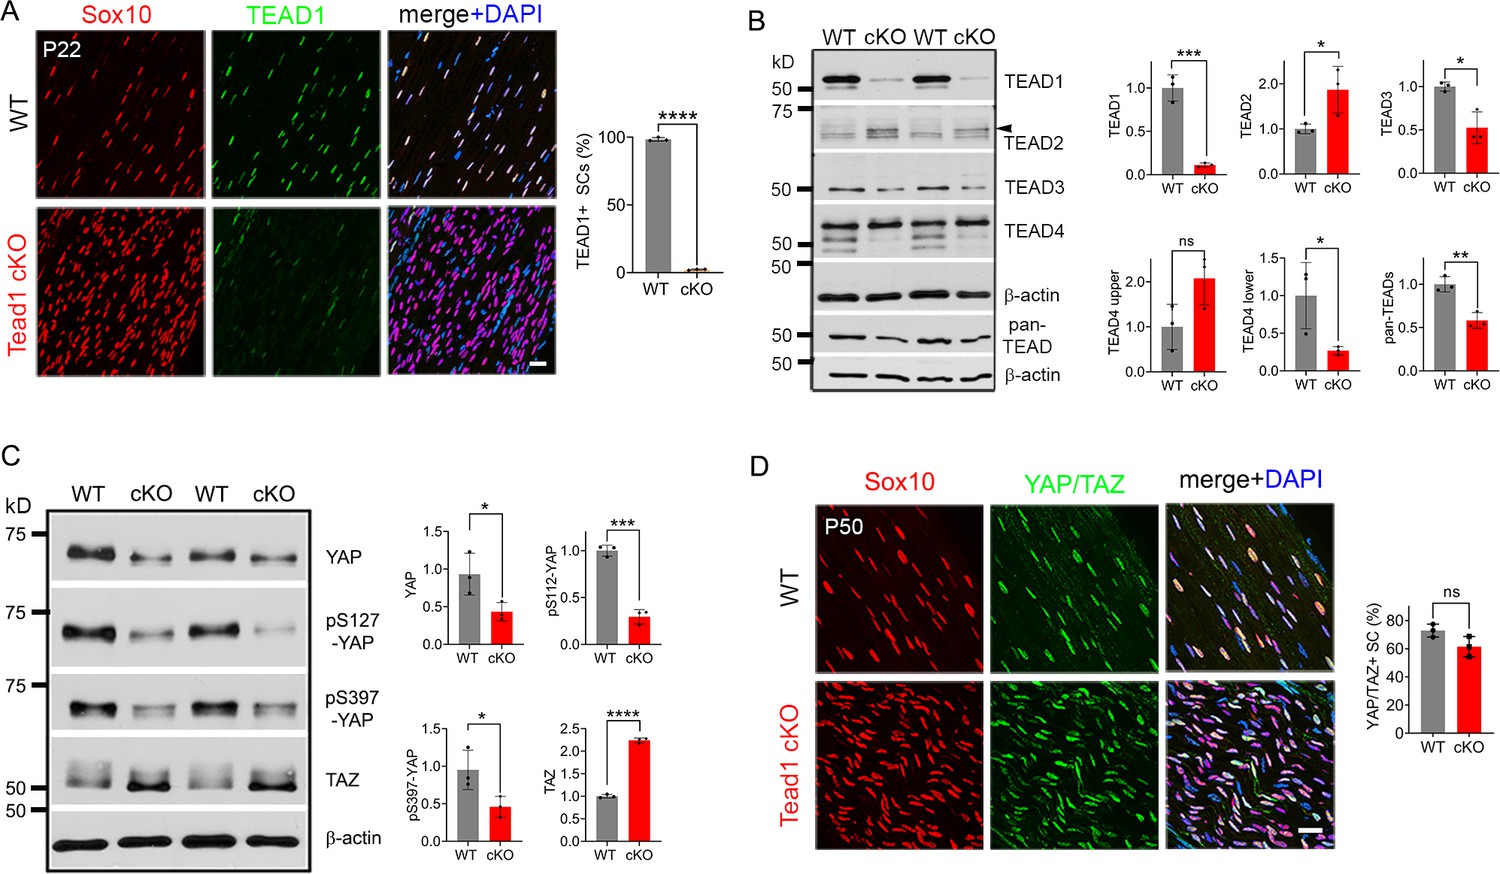
Multiple TEADs are expressed in Schwann cells of WT and Tead1 cKO mice.
(A) Immunostaining and quantification of TEAD1 +SCs on longitudinal sections of P22 WT and Tead1 cKO SNs. SC nuclei are identified by Sox10. All cell nuclei are marked by DAPI. n=3 mice per genotype, ****p<0.0001, Student’s unpaired t-test. Scale bar: 20 μm. (B) Western blotting of P50 WT and Tead1 cKO SN lysates with anti-TEAD1, -TEAD2, -TEAD3, -TEAD4, and -pan TEAD. TEAD expression is normalized to that of β-actin as an internal control, and WT expression is arbitrarily given the value 1. n=3 mice per genotype. ns, p>0.05; *p≤0.05, **p≤0.005, ***p≤0.001, Student’s unpaired t-test. (C) Western blotting of P50 WT and Tead1 cKO SN lysates with anti-YAP, -phospho-YAPs (Ser127 and Ser397), and -TAZ. YAP/TAZ expression is normalized to that of β-actin as an internal control, and WT expression is arbitrarily given the value 1. n=3 mice per genotype. *p≤0.05, ***p≤0.001, ****p<0.0001, Student’s unpaired t-test. (D) Immunostaining of YAP/TAZ +SCs on longitudinal sections of P50 WT and Tead1 cKO SNs. SC nuclei are identified by Sox10. All cell nuclei are marked by DAPI. n=3 mice per genotype, ns, p>0.05, Student’s unpaired t-test. Scale bar: 20 μm.
-
Figure 1—source data 1
This zip archive contains source files for graphs in Figure 1A, B, C and D and uncropped labeled or unlabeled blots of Figure 1B and D.
- https://cdn.elifesciences.org/articles/87394/elife-87394-fig1-data1-v2.zip
Figure 1—figure supplement 1
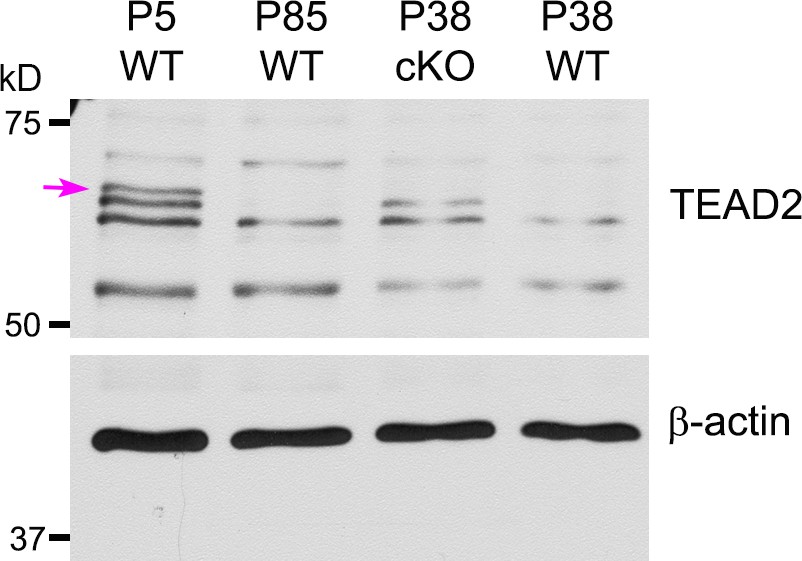
Western blotting of P5, P38, P85 WT, and P38 Tead1 cKO SN lysates with anti-TEAD2.
TEAD2 expression is normalized to that of β-actin as an internal control. Arrow denotes ~65 kD TEAD2 band that was diminished with age.
-
Figure 1—figure supplement 1—source data 1
This zip archive contains uncropped labeled or unlabeled blots in Figure 1—figure supplement 1.
- https://cdn.elifesciences.org/articles/87394/elife-87394-fig1-figsupp1-data1-v2.zip
Figure 2 with 1 supplement
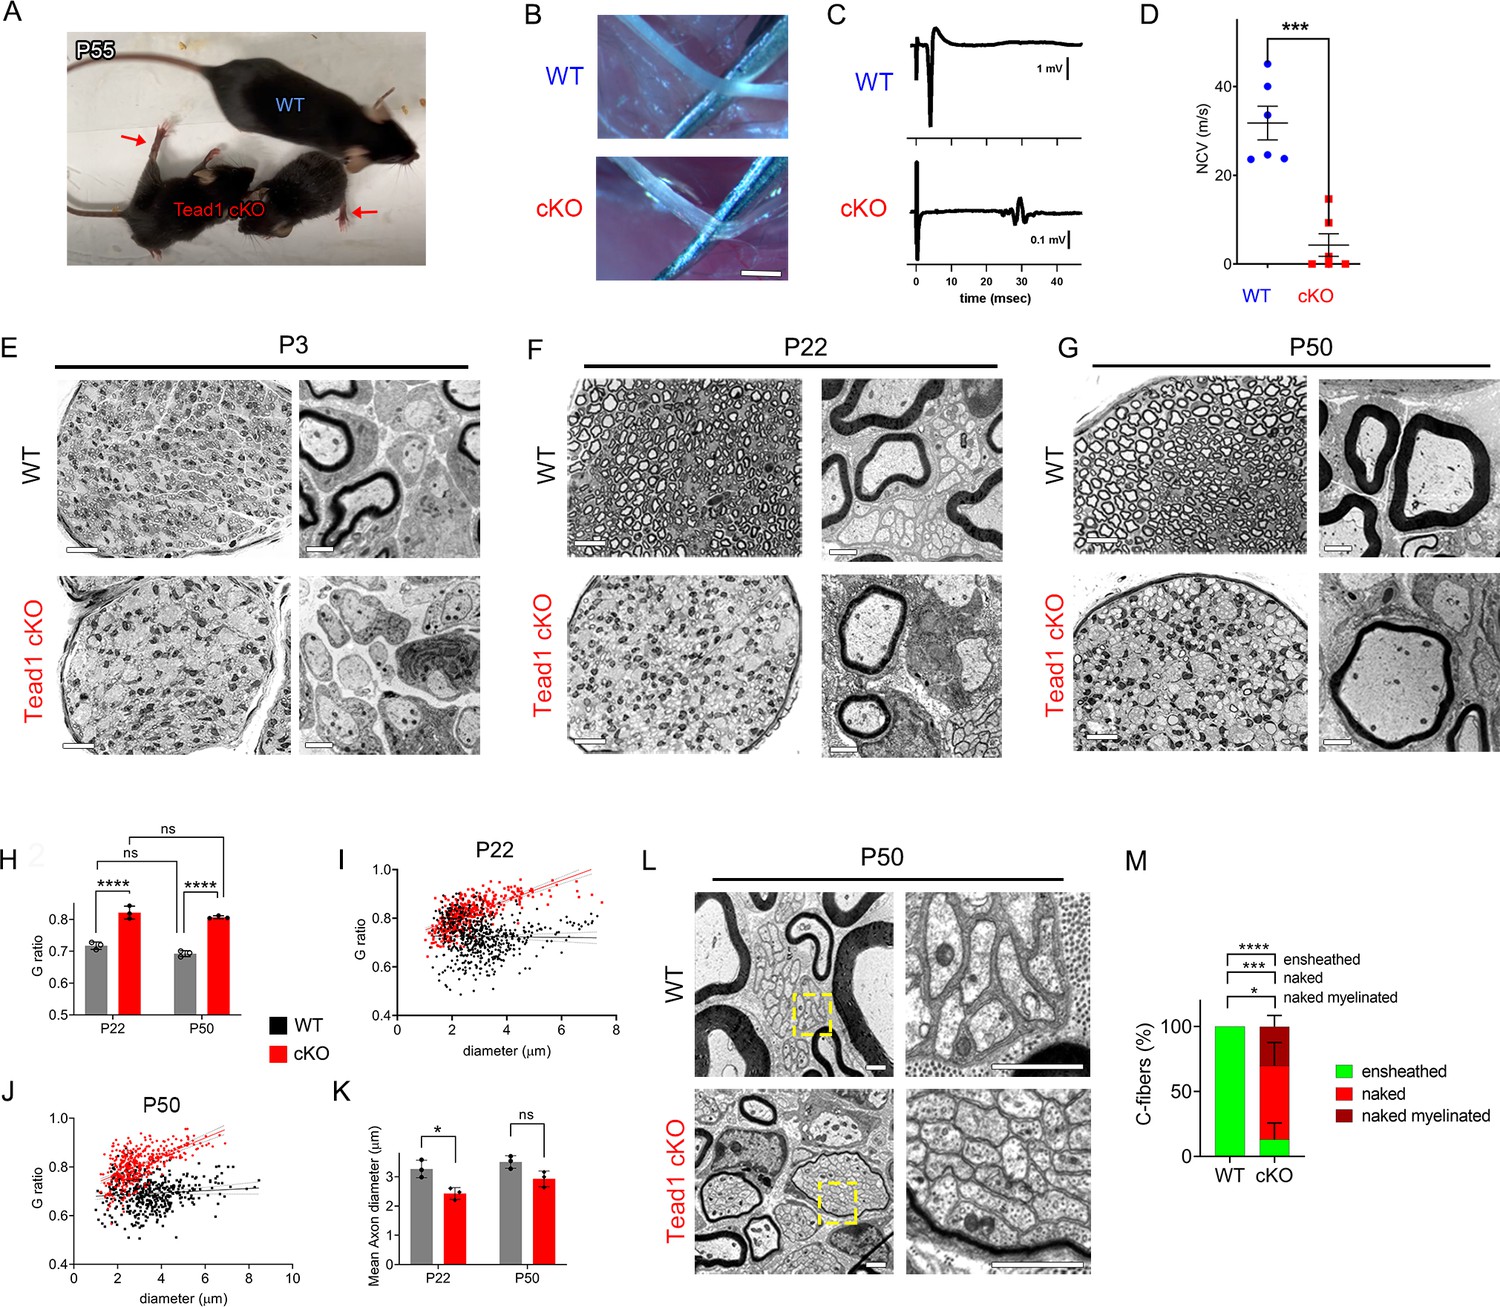
TEAD1 is required for myelin sheath formation and growth.
(A) A living control (WT) and two Tead1 cKO mice from one litter at P55. Arrows point to splayed paralyzed hindlimbs. (B) Exposed SNs of WT and Tead1 cKO mice during dissection. Scale bar: 1 mm (C) Representative images of CMAPs generated by stimulation of WT and Tead1 cKO Sns. (D) Quantification of NCV in WT and Tead1 cKO. n=6 mice per genotype. ***p<0.001, Student’s unpaired t-test. (E) Representative images of semithin (left panels) and TEM (right panels) of transverse sections of WT and Tead1 cKO SNs at P3. Scale bar: 20 μm (left panels), 1 μm (right panels) (F) Representative images of semithin (left panels) and TEM (right panels) of transverse sections of WT and Tead1 cKO SNs at P22. Scale bar: 20 μm (left panels), 1 μm (right panels) (G) Representative images of semithin (left panels) and TEM (right panels) of transverse sections of WT and Tead1 cKO SNs at P50. Scale bar: 20 μm (left panels), 1 μm (right panels) (H) Quantification of G-ratio for axons in WT and Tead1 cKO SNs at P22 and at P50. n=3 mice per group. ns, p>0.05 (P22 WT versus P50 WT, P22 cKO versus P50 cKO), ****p<0.0001 (P22 WT versus P22 cKO, P50 WT versus P50 cKO). (I) Scatter plot graph displaying G-ratio in relation to axon diameter in WT and Tead1 cKO SNs at P22. n=1063 axons from 3 mice per each genotype. (J) Scatter plot graph displaying G-ratio in relation to axon diameter in WT and Tead1 cKO SNs at P50. n=880 axons from 3 mice per each genotype. (K) Quantitative comparison of mean axon diameter in WT and Tead1 cKO SNs at P22 and at P50. n=3 mice per group. ns, p>0.05, *p≤0.05, two-way ANOVA with Tukey’s multiple comparisons test. (L) Representative TEM images of transverse sections of P50 WT and Tead1 cKO SNs. Right panels are enlarged images of the boxed area in left panels. Scale bar: 1 μm (M) Quantification of normal and abnormal C-fibers in P50 WT and Tead1 cKO SNs. C-fibers normally ensheathed by SC cytoplasm are marked as ‘ensheathed’, whereas those not ensheathed are denoted as ‘naked’. Naked C-fibers located in a myelinated bundle are denoted as ‘naked myelinated’. Relative percentage of each type of C-fiber is plotted. N>500 C-fibers from 3 mice per each genotype. *p≤0.05, ***p≤0.001, ****p<0.0001, two-way ANOVA Tukey’s multiple comparisons test.
-
Figure 2—source data 1
This zip archive contains source files for graphs in Figure 2D, H, I, J, K and M.
- https://cdn.elifesciences.org/articles/87394/elife-87394-fig2-data1-v2.zip
Figure 2—figure supplement 1
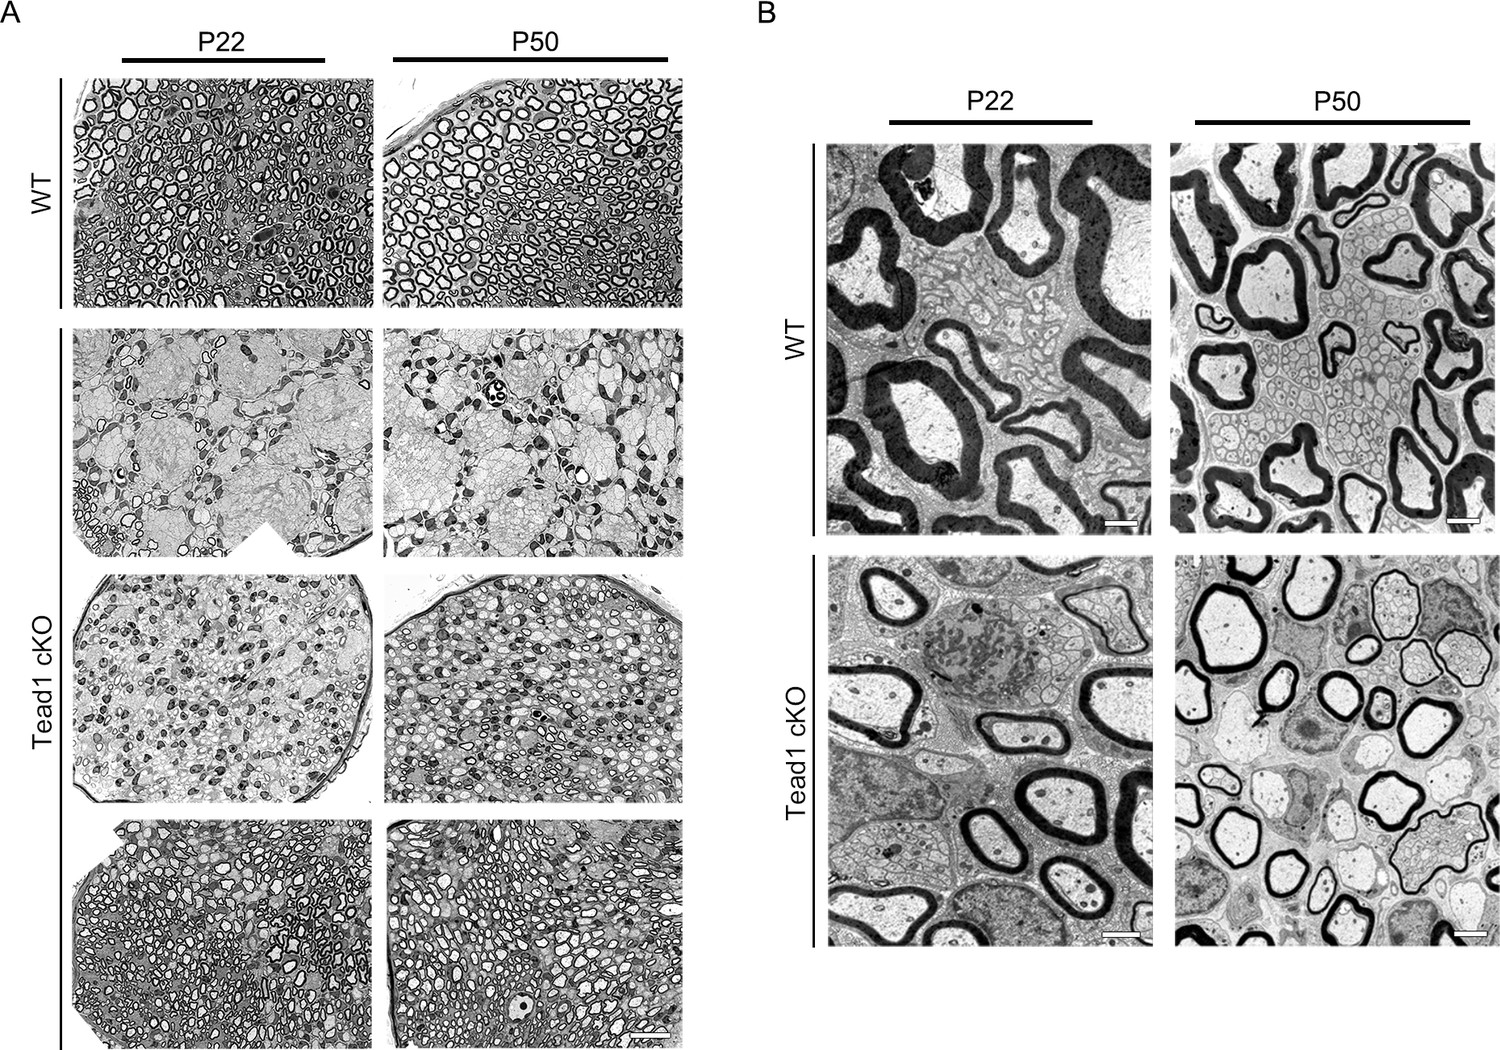
Additional semi-thin and TEM images of WT and Tead1 cKO.
(A) Representative images of semi-thin sections of various areas of WT and Tead1 cKO SNs at P22 and P50. Scale bar: 20 μm (B) Representative TEM images of transverse sections of WT and Tead1 cKO SNs at P22 and P50. Scale bar: 1 μm (P22 panels), 2 μm (P50 panels).
Figure 3
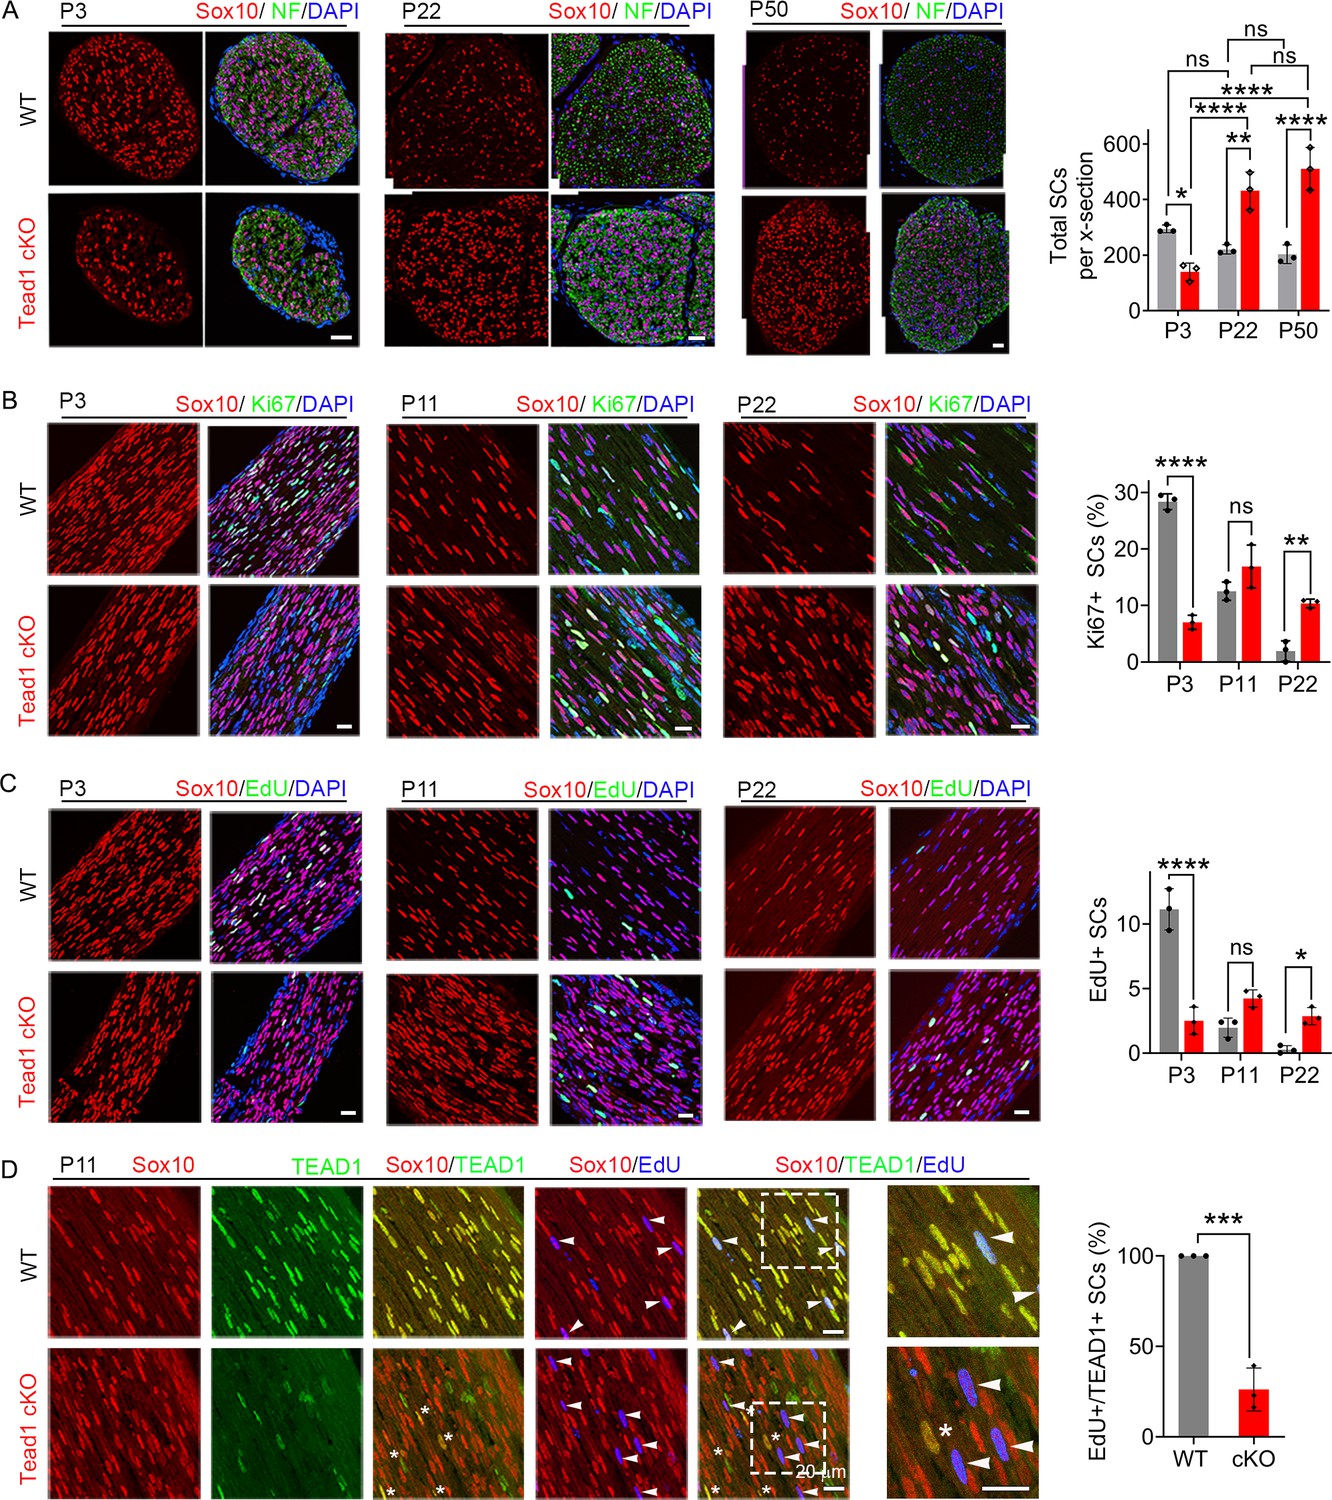
TEAD1 regulates SC proliferation both positively and negatively.
(A) Immunostaining and quantification of SCs on transverse sections of WT and Tead1 cKO SNs at P3, P22, and P52. SC nuclei and all cell nuclei are marked by Sox10 and DAPI. Axons are marked by Neurofilaments (NF). n=3 mice per genotype, ns, p>0.05, *p≤0.05, **p≤0.01, ****p<0.0001, two-way ANOVA with Tukey’s multiple comparisons test. Scale bar: 30 μm (B) Immunostaining and quantification of Ki67 +SCs on longitudinal sections of WT and Tead1 cKO SNs at P3, P11, and P22. SC nuclei and all cell nuclei are marked by Sox10 and DAPI. n=3 mice per genotype, ns, p>0.05, **p≤0.01, ****p<0.0001, two-way ANOVA with Tukey’s multiple comparisons test. Scale bar: 30 μm (P3 panels), 20 μm (P11 and P22 panels) (C) Immunostaining and quantification of EdU +SCs on longitudinal sections of WT and Tead1 cKO SNs at P3, P11, and P22. SC nuclei and all cell nuclei are marked by Sox10 and DAPI. n=3 mice per genotype, ns, p>0.05, *p≤0.05, ****p<0.0001, two-way ANOVA with Tukey’s multiple comparisons test. Scale bar: 30 μm (P3 panels), 20 μm (P11 and P22 panels) (D) Immunostaining and quantification of EdU+/TEAD1+SCs on longitudinal sections of WT and Tead1 cKO SNs at P11. SC nuclei are marked by Sox10. Asterisks denote Tead1 cKO SCs in which TEAD1 is not deleted and which are not EdU+. Arrowheads denote EdU +SCs which are TEAD1+in WT but TEAD1- in Tead1 cKO. n=3 mice per genotype, ***p<0.001, Student’s unpaired t-test. Scale bar:20 μm.
-
Figure 3—source data 1
This zip archive contains source files for graphs in Figure 3A, B, C and D.
- https://cdn.elifesciences.org/articles/87394/elife-87394-fig3-data1-v2.zip
Figure 4
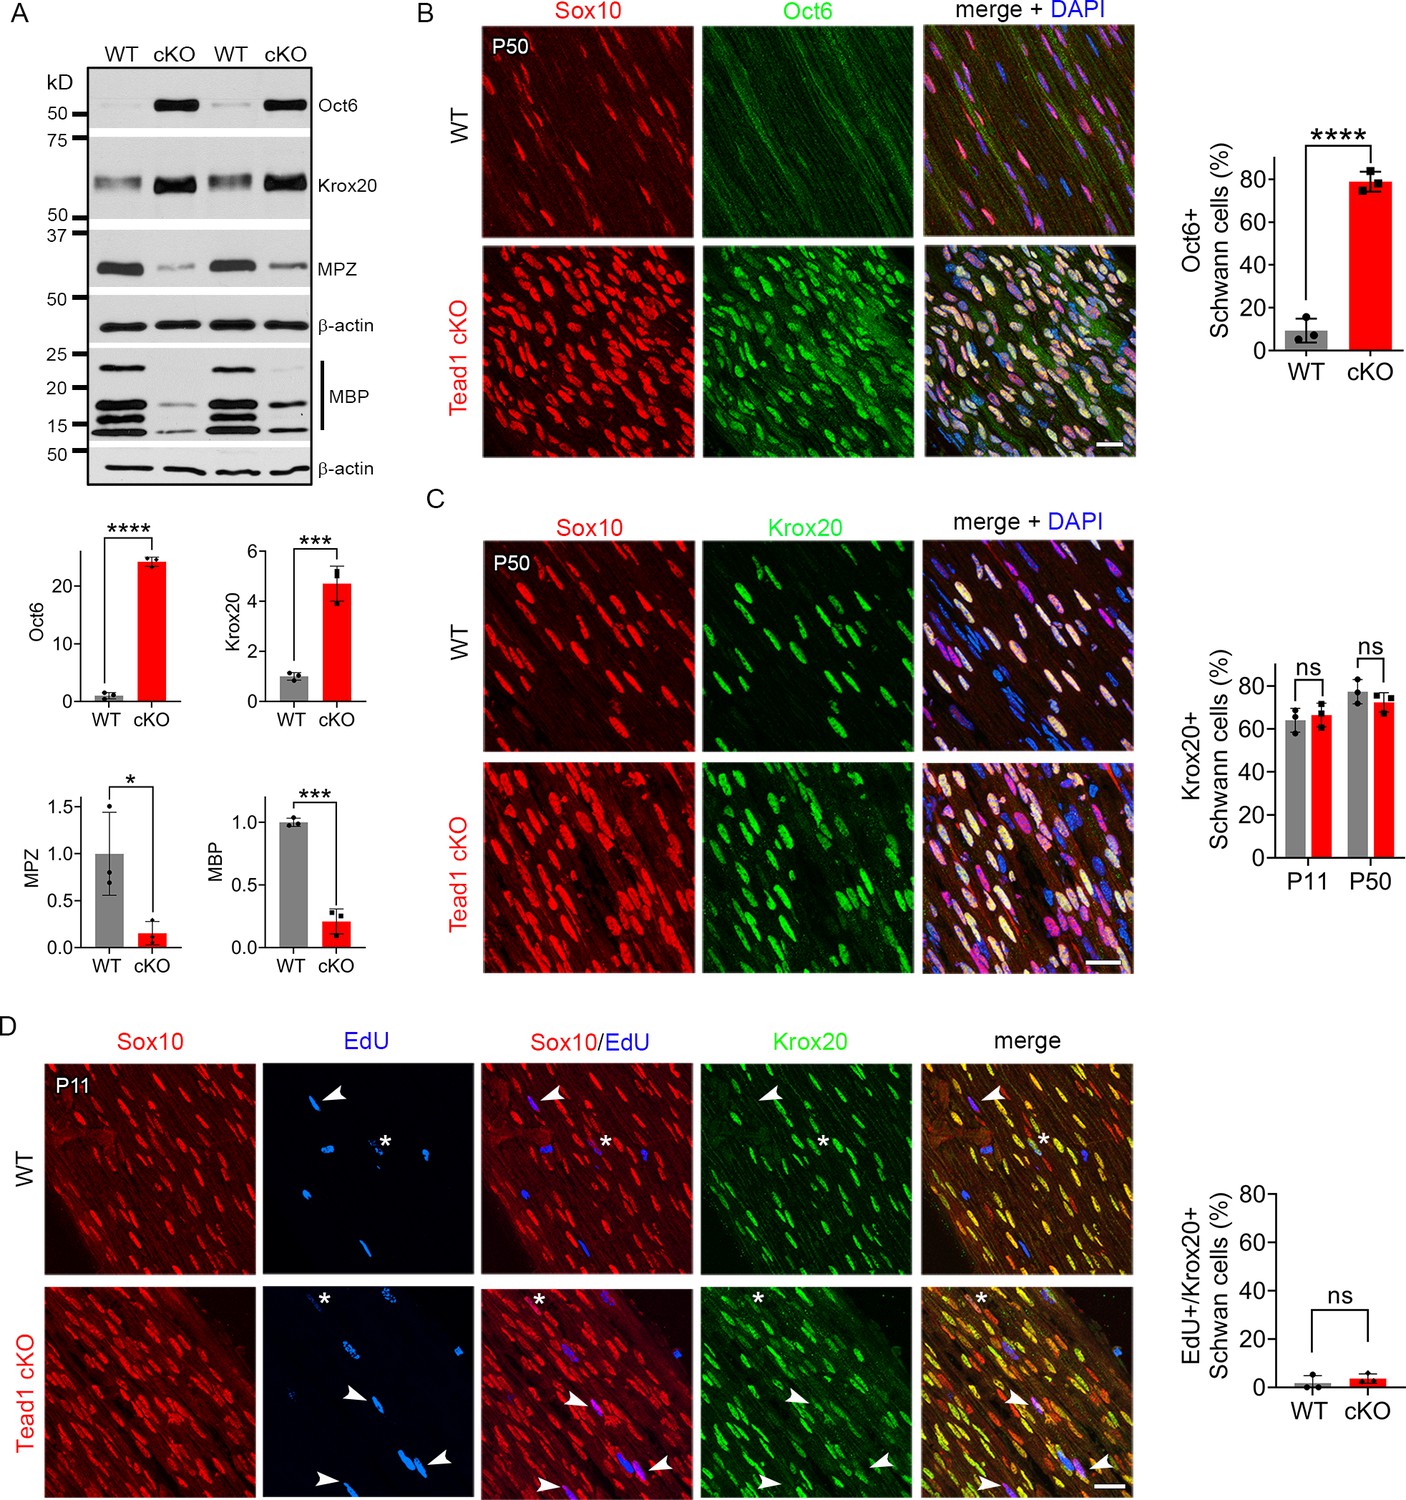
TEAD1 is required for Krox20 to upregulate myelin proteins during development.
(A) Western blotting of P50 WT and Tead1 cKO SN lysates with anti-Oct6, -Krox20, -MPZ, and -MBP. Protein expression is normalized to that of β-actin as an internal control, and WT expression is arbitrarily given the value 1. n=3 mice per genotype. *p≤0.05, ***p≤0.001, ***p≤0.0001, Student’s unpaired t-test. (B) Immunostaining and quantification of Oct6 +SCs on longitudinal sections of P50 WT and Tead1 cKO SNs. SC nuclei are identified by Sox10. All cell nuclei are marked by DAPI. n=3 mice per genotype, ****p<0.0001, Student’s unpaired t-test. Scale bar: 20 μm (C) Immunostaining and quantification of Krox20 +SCs on longitudinal sections of WT and Tead1 cKO SNs at P11 and P50. SC nuclei are identified by Sox10. All cell nuclei are marked by DAPI. n=3 mice per each group, ns, p>0.05, Student’s unpaired t-test. Scale bar: 20 μm (D) Immunostaining and quantification of EdU+/Krox20 +SCs on longitudinal sections of WT and Tead1 cKO SNs at P11. SC nuclei are identified by Sox10. Arrowheads denote examples of EdU +SCs which are Krox20-. Asterisks denote rarely observed EdU +SCs which are Krox20+. n=3 mice per genotype, ns, p>0.05, Student’s unpaired t-test. Scale bar: 20 μm.
-
Figure 4—source data 1
This zip archive contains source files for graphs in Figure 4A, B, C and D and uncropped labeled or unlabeled blots of Figure 4A.
- https://cdn.elifesciences.org/articles/87394/elife-87394-fig4-data1-v2.zip
Figure 5
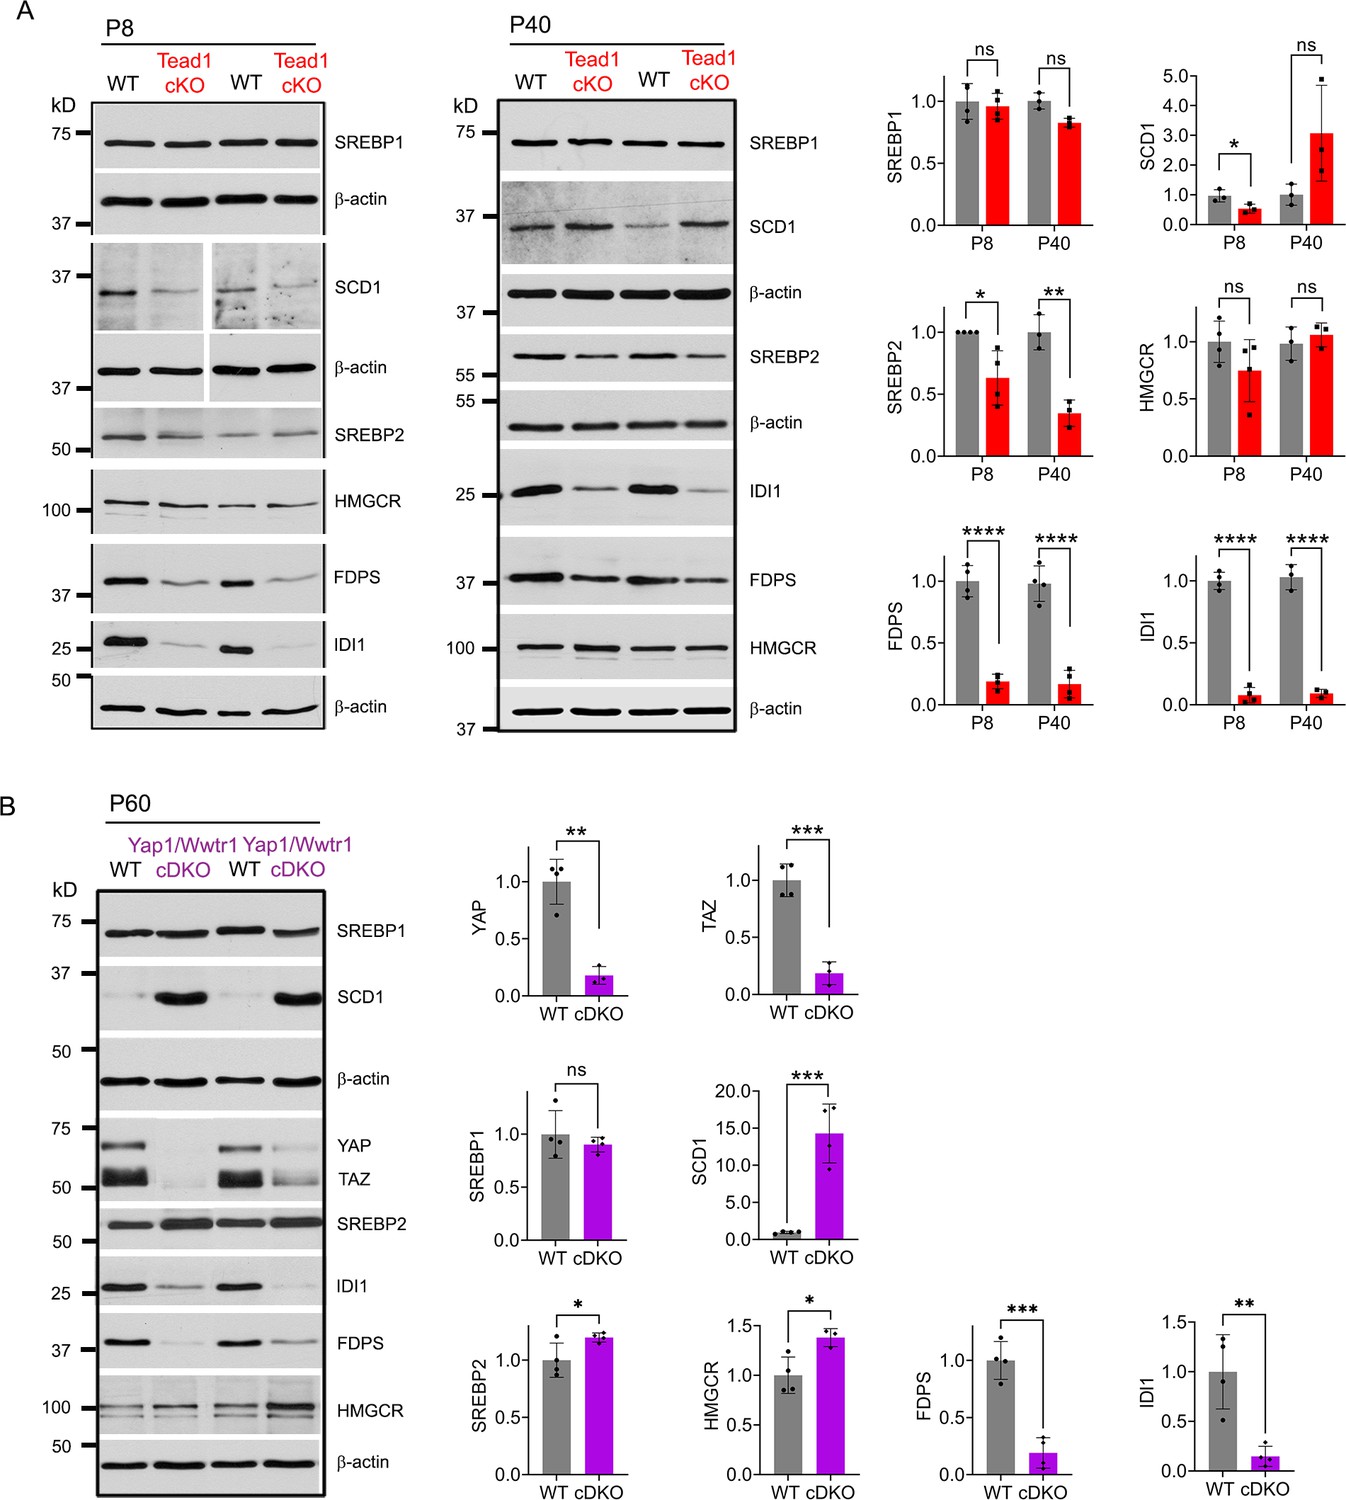
TEAD1 and YAP/TAZ upregulate cholesterol synthesis enzymes: FDPS and IDI1.
(A) Western blotting of P8 and P40 WT and Tead1 cKO SN lysates with anti-SREBP1, -SCD1, -SREBP2, -HMGCR, -FDPS, and -IDI1. Protein expression is normalized to that of β-actin as an internal control, and WT expression is arbitrarily given the value 1. n=3 or 4 mice per genotype. ns, p>0.05, *p≤0.05, **p≤0.01, ****p<0.0001, Student’s unpaired t-test. (B) Western blotting of P60 WT and Yap1/Wwtr1 cDKO SN lysates with anti-YAP, -TAZ, -SREBP1, -SCD1, -SREBP2, -HMGCR, -FDPS, and -IDI1. Protein expression is normalized to that of β-actin as an internal control, and WT expression is arbitrarily given the value 1. n=3 or 4 mice per genotype. ns, p>0.05, *p≤0.05, **p≤0.01, ***p<0.001, Student’s unpaired t-test.
-
Figure 5—source data 1
This zip archive contains uncropped labeled or unlabeled blots of P8 WT and Tead1 cKO SNs in Figure 5A.
- https://cdn.elifesciences.org/articles/87394/elife-87394-fig5-data1-v2.zip
-
Figure 5—source data 2
This zip archive contains source files for graphs in Figure 5A and B, and uncropped labeled or unlabeled blots of P40 WT and Tead1 cKO SNs in Figure 5A and P60 SNs of WT and YAP/TAZ cDKO in Figure 5B.
- https://cdn.elifesciences.org/articles/87394/elife-87394-fig5-data2-v2.zip
Figure 6 with 1 supplement
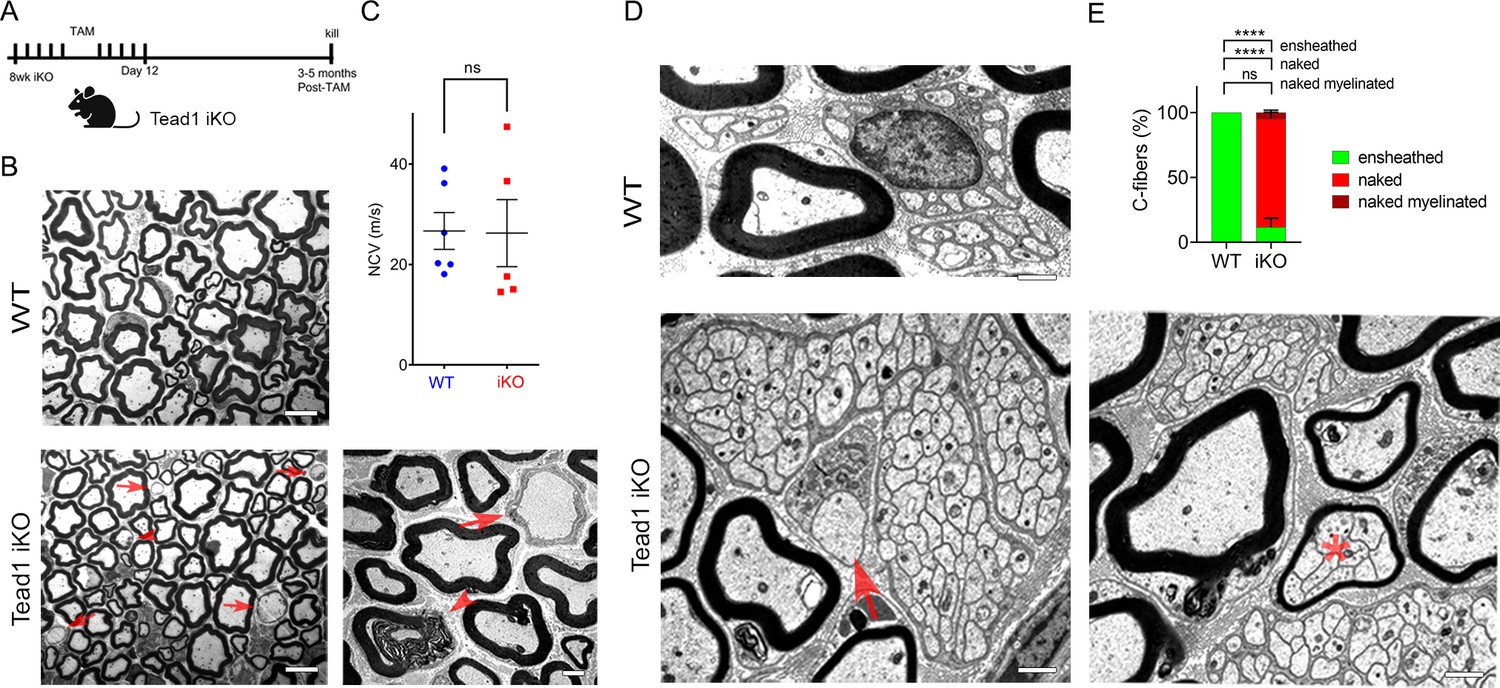
TEAD1 is largely dispensable for myelin maintenance, but required for Remak bundle integrity.
(A) Cartoon showing timeline of tamoxifen (TAM) injection and time of sacrifice of Tead1 iKO mice. (B) Representative TEM images of P150 WT and Tead1 iKO SNs showing occasional large axons undergoing demyelination (arrowheads) or completely demyelinated (arrows). Scale bar: 6 μm (left panels), 2 μm (right panel) (C) Quantification of NCV in P90-P150 WT and Tead1 iKO mice. n=5 or 6 mice per genotype. ns, p>0.05, Student’s unpaired t-test. (D) Representative TEM images of P97 WT and Tead1 iKO SNs showing Remak bundles. Asterisk denotes a bundle of thinly myelinated C-fibers. Arrow denotes demyelinated axon. Scale bar: 1 μm (E) Quantification of normal and abnormal C-fibers in P150 WT and Tead1 iKO SNs. Relative percentage of each type of C-fiber is plotted. N>500 C-fibers from 3 mice per each genotype. ns, p>0.05, ****p<0.0001, two-way ANOVA with Tukey’s multiple comparisons test.
-
Figure 6—source data 1
This zip archive contains source files for graphs in Figure 6C and E.
- https://cdn.elifesciences.org/articles/87394/elife-87394-fig6-data1-v2.zip
-
Figure 6—source data 2
This zip archive contains source files for graphs in Figure 6A–G and uncropped labeled or unlabeled blots of Figure 6A.
- https://cdn.elifesciences.org/articles/87394/elife-87394-fig6-data2-v2.zip
Figure 6—figure supplement 1
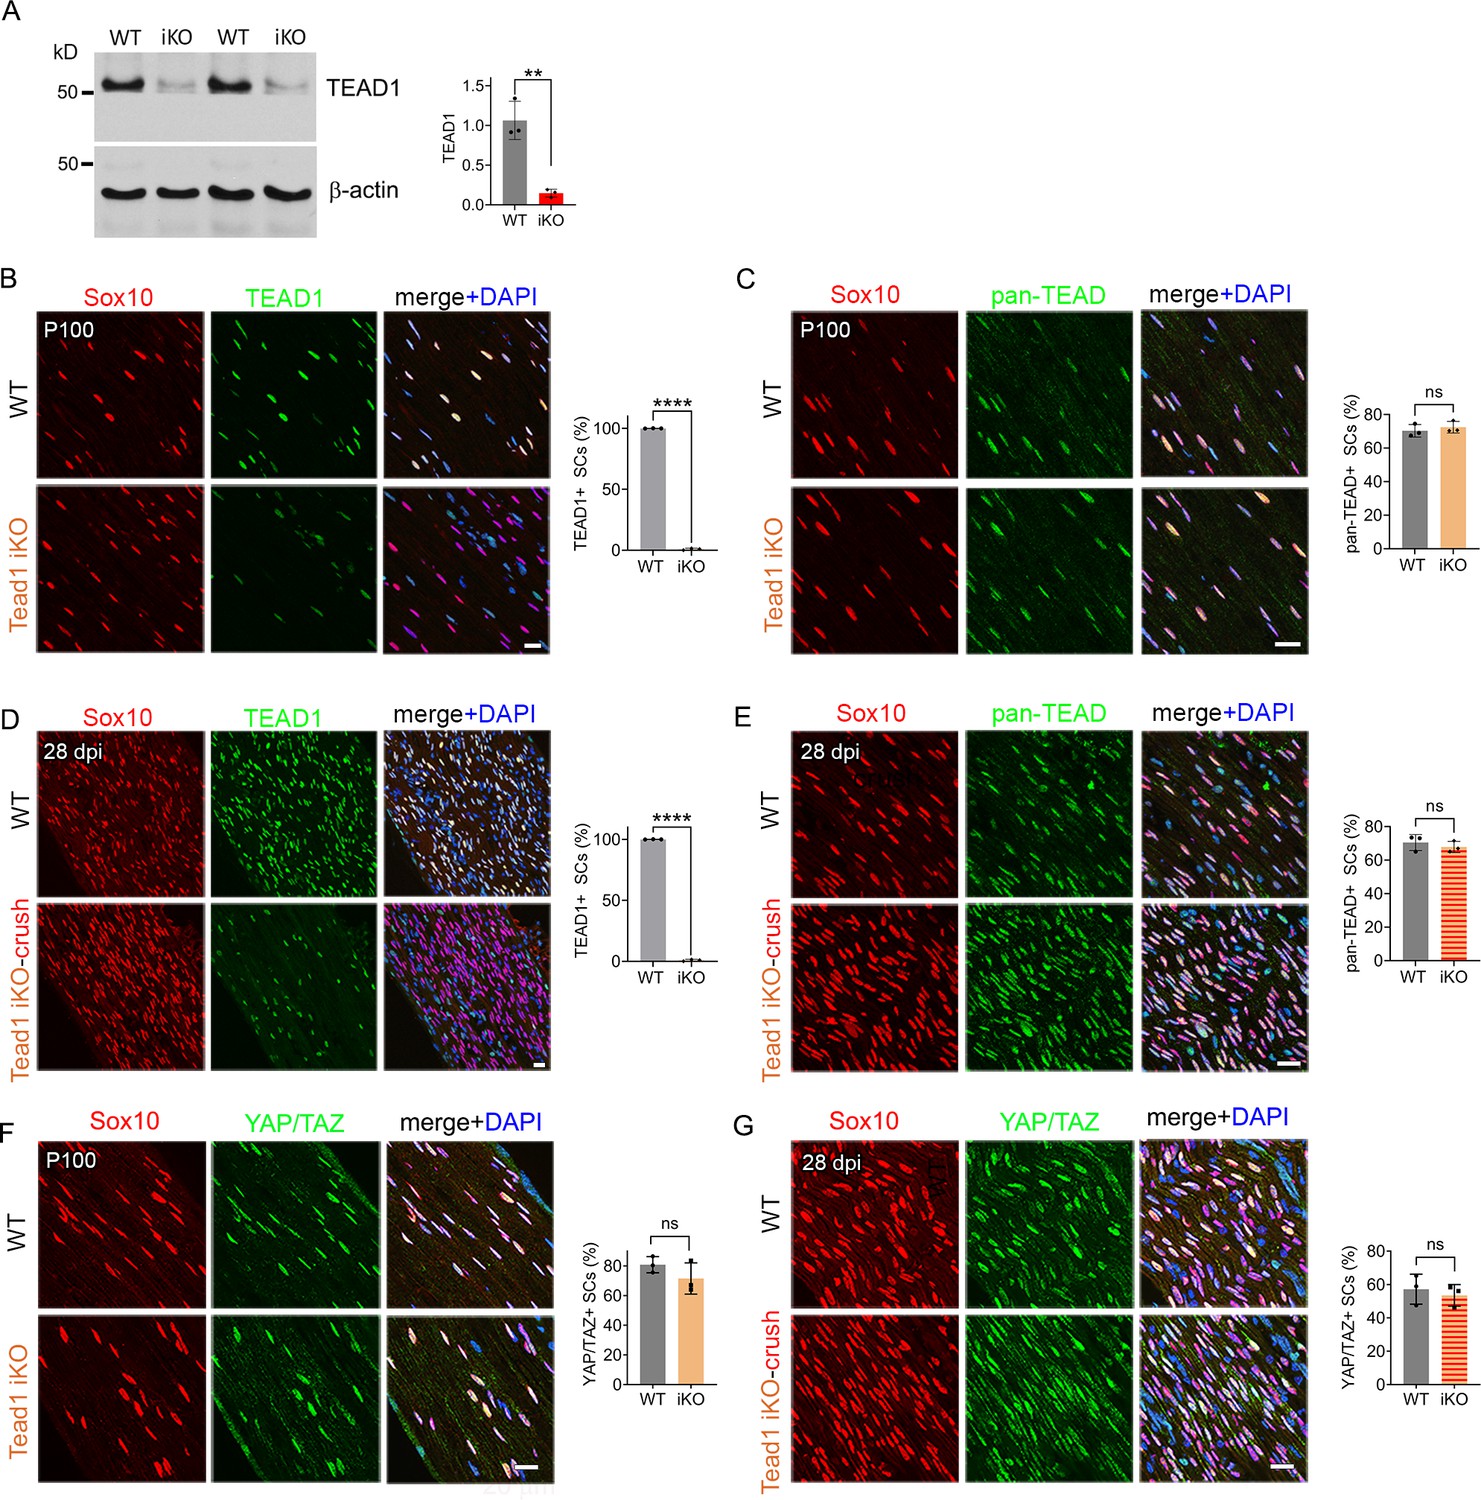
Expression of TEAD1, pan-TEAD and YAP/TAZ in intact and regenerating nerves of WT and Tead1 iKO mice.
(A) Western blotting of adult WT and Tead1 iKO SN lysates with anti-TEAD1. TEAD1 expression is normalized to that of β-actin as an internal control, and WT expression is arbitrarily given the value 1. n=3 mice per genotype. **p≤0.01, Student’s unpaired t-test. (B) Immunostaining and quantification of TEAD1 +SCs on longitudinal sections of P100 WT and Tead1 iKO SNs 3 months after tamoxifen administration. SC nuclei are identified by Sox10. All cell nuclei are marked by DAPI. n=3 mice per genotype, ****p<0.0001, Student’s unpaired t-test. Scale bar: 20 μm (C) Immunostaining and quantification of pan-TEAD +SCs on longitudinal sections of P100 WT and Tead1 iKO SNs. SC nuclei are identified by Sox10. All cell nuclei are marked by DAPI. n=3 mice per genotype. ns, p>0.05, Student’s unpaired t-test. Scale bar: 20 μm (D) Immunostaining and quantification of TEAD1 +SCs on longitudinal sections of WT and Tead1 iKO SNs 28 days after nerve crush. SC nuclei are identified by Sox10. All cell nuclei are marked by DAPI. n=3 mice per genotype, ****p<0.0001, Student’s unpaired t-test. Scale bar: 20 μm (E) Immunostaining and quantification of pan-TEAD +SCs on longitudinal sections of P100 WT and Tead1 iKO SNs 28 days after nerve crush. SC nuclei are identified by Sox10. All cell nuclei are marked by DAPI. n=3 mice per genotype. ns, p>0.05, Student’s unpaired t-test. Scale bar: 20 μm (F) Immunostaining of YAP/TAZ +SCs on longitudinal sections of P100 WT and Tead1 iKO SNs. SC nuclei are identified by Sox10. All cell nuclei are marked by DAPI. n=3 mice per group. ns, p>0.05, Student’s unpaired t-test. Scale bar: 20 μm (G) Immunostaining of YAP/TAZ +SCs on longitudinal sections of WT and Tead1 iKO SNs 28 days after nerve crush. SC nuclei are identified by Sox10. All cell nuclei are marked by DAPI. n=3 mice per group. ns, p>0.05, Student’s unpaired t-test. Scale bar: 20 μm.
Figure 7
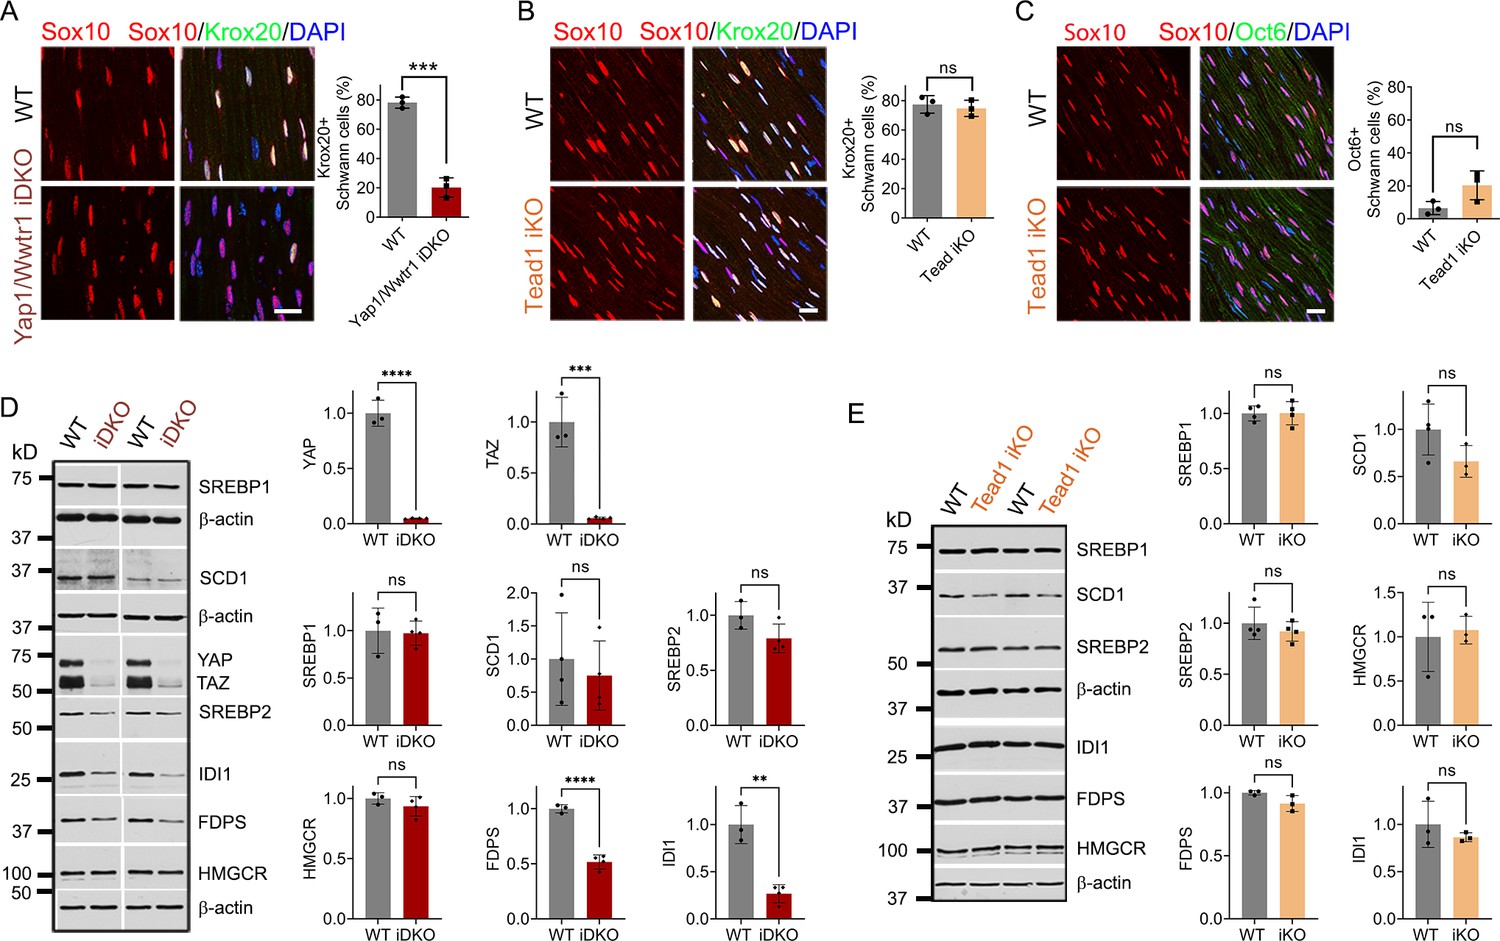
TEAD1 is dispensable for YAP/TAZ to maintain Krox20, FDP and IDI1 expression.
(A) Immunostaining and quantification of Krox20 +SCs on longitudinal sections of WT and Yap1/Wwtr1 iDKO SNs 2 weeks after 1st tamoxifen injection. SC nuclei are marked by Sox10. All cell nuclei are marked by DAPI. n=3 mice per genotype, ***p<0.001, Student’s unpaired t-test. Scale bar: 20 μm (B) Immunostaining and quantification of Krox20 +SCs on longitudinal sections of WT and Tead1 iKO SNs 6 weeks after 1st tamoxifen injection. SC nuclei are marked by Sox10. All cell nuclei are marked by DAPI. n=3 mice per genotype, ns, p>0.05, Student’s unpaired t-test. Scale bar: 20 μm (C) Immunostaining and quantification of Oct6 +SCs on longitudinal sections of WT and Tead1 iKO SNs 6 weeks after 1st tamoxifen injection. SC nuclei are marked by Sox10. All cell nuclei are marked by DAPI. n=3 mice per genotype, ns, p>0.05, Student’s unpaired t-test. Scale bar: 20 μm (D) Western blotting of WT and Yap1/Wwtr1 iDKO SN lysates with anti-YAP, -TAZ, -SREBP1, -SCD1, -SREBP2, -HMGCR, -FDPS, and -IDI1. Protein expression is normalized to that of β-actin as an internal control, and WT expression is arbitrarily given the value 1. n=3 or 4 mice per genotype. ns, p>0.05, **p≤0.01, ***p<0.001, ****p<0.0001, Student’s unpaired t-test. (E) Western blotting of WT and Tead1 iKO SN lysates with anti-SREBP1, -SCD1, -SREBP2, -HMGCR, -FDPS, and -IDI1. Protein expression is normalized to that of β-actin as an internal control, and WT expression is arbitrarily given the value 1. n=3 or 4 mice per genotype. ns, p>0.05, Student’s unpaired t-test.
-
Figure 7—source data 1
This zip archive contains source files for graphs in Figure 7A–E and uncropped labeled or unlabeled blots of Figure 7D and E.
- https://cdn.elifesciences.org/articles/87394/elife-87394-fig7-data1-v2.zip
Figure 8
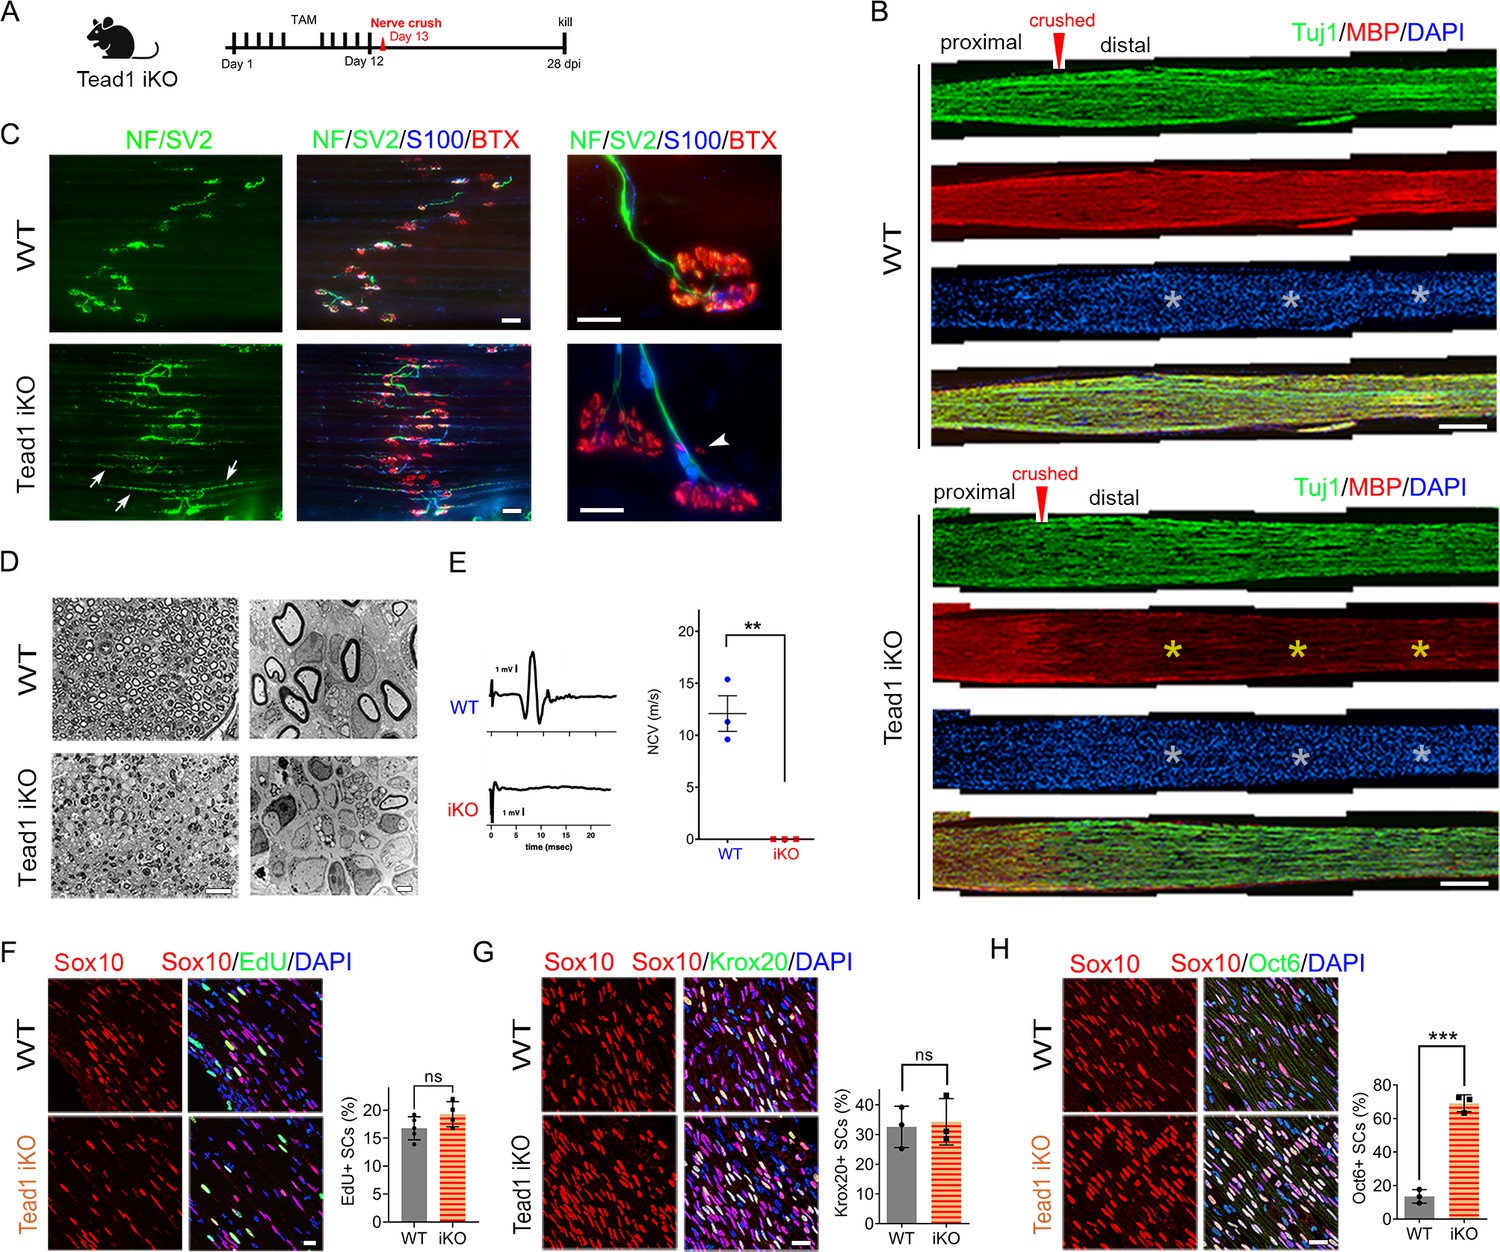
TEAD1 is required for functional regeneration of peripheral nerve.
(A) Cartoon showing timeline of tamoxifen (TAM) injection and time of sacrifice of Tead1 iKO mice after nerve crush. (B) Low magnification images of longitudinal sections of ~4 mm long SN segments of WT and Tead1 iKO mice 28 days after nerve crush. Arrowheads denote crush site. Axons and myelin are marked by Tuj1 and MBP, respectively. All cell nuclei are marked by DAPI. Yellow asterisks denote the distal nerve segment of Tead1 iKO, which almost completely lacks myelin. White asterisks denote distal segments of both WT and Tead1 iKO, which exhibit more cells than proximal segments due to SC proliferation after injury. Scale bar: 500 μm (C) Representative low and high magnification NMJ images of WT and Tead1 iKO 28 days after nerve crush. Axon and axon terminals are marked by neurofilament (NF) and SV2 staining. SCs are marked by S100. Muscle acetylcholine receptors are marked by α-Bungarotoxin. Arrows denote examples of axon terminals that grew past NMJs in iKO. Arrowheads denote examples of extrasynaptic AChR clusters in iKO. Scale bar: 50 μm (low magnification panels), 20 μm (high magnification panels) (D) Representative semi-thin and TEM images of transverse sections of WT and Tead1 iKO 28 days after nerve crush. Scale bar: 20 μm (left semi-thin panels), 2 μm (right TEM panels) (E) Representative CMAP recordings and NCV measurements of WT and Tead1 iKO at 28 days after nerve crush. n=3 mice per genotype, **p≤0.01, Student’s unpaired t-test. (F) Immunostaining and quantification of EdU +SCs on longitudinal sections of WT and Tead1 iKO SNs at 28 days after nerve crush. SC nuclei are marked by Sox10. All cell nuclei are marked by DAPI. n=4–5 mice per genotype, ns, p>0.05, Student’s unpaired t-test. Scale bar: 20 μm (G) Immunostaining and quantification of Krox20 +SCs on longitudinal sections of WT and Tead1 iKO SNs at 28 days after nerve crush. SC nuclei are marked by Sox10. All cell nuclei are marked by DAPI. n=3 mice per genotype, ns, p>0.05, Student’s unpaired t-test. Scale bar: 20 μm (H) Immunostaining and quantification of Oct6 +SCs on longitudinal sections of WT and Tead1 iKO SNs at 28 days after nerve crush. SC nuclei are marked by Sox10. All cell nuclei are marked by DAPI. n=3 mice per genotype, ns, ***p<0.001, Student’s unpaired t-test. Scale bar: 20 μm.
-
Figure 8—source data 1
This zip archive contains source files for graphs in Figure 8E, F, G and H.
- https://cdn.elifesciences.org/articles/87394/elife-87394-fig8-data1-v2.zip
Videos
Video 1
A movie showing a P55 WT and two littermates Tead1 cKO mic.
Tables
Key resources table
| Reagent type (species) or resource | Designation | Source or reference | Identifiers | Additional information |
|---|---|---|---|---|
| Strain, strain background (Mus musculus) | C57Bl/6 | Jackson Laboratory | Stock #: 000664; RRID:IMSR JAX:000664 | |
| Genetic reagent (M. musculus) | Plp1-Cre-ERT2 | Leone et al., 2003 | MGI:2663093 | |
| Antibody | anti-Yap/Taz (rabbit monoclonal) | Cell Signaling Technology | D24E4, #8418 RRID:AB_10950494 | IHC 1:200 Western 1:1000 |
| Antibody | anti-SCG10 (rabbit monoclonal) | Novus Biologicals | NBP1-49461 RRID:AB_10011569 | IHC 1:5000 |
| Antibody | anti-Yap (rabbit monoclonal) | Cell Signaling Technology | D8H1X, #14074 RRID:AB_2650491 | IHC 1:200 |
| Antibody | anti-Sox10 (goat polyclonal) | R&D Systems | #AF-2864 RRID:AB_442208 | IHC 1:100 |
| Antibody | anti-Sox10 (rabbit monoclonal) | Abcam | EPR4007, #ab155279 RRID:AB_2650603 | IHC 1:250 |
| Antibody | anti-Egr2 (rabbit polyclonal) | Professor Dies Meijer, University of Edinburgh | IHC 1:4000 | |
| Antibody | anti-Oct6 (rabbit monoclonal) | Abcam | EP5421, #ab126746 RRID:AB_11130256 | WB 1:1000 |
| Antibody | Anti-Oct6 (rabbit polyclonal) | Abcam | #ab31766 RRID:AB_776899 | IHC 1:800 |
| Antibody | Anti-c-Jun (mouse monoclonal) | BD Transduction Laboratories | #610326 RRID:AB_397716 | IHC 1:500 |
| Antibody | Anti-c-Jun (rabbit monoclonal) | Cell Signaling Technology | 60 A8, #9165 RRID:AB_2130165 | WB 1:1000 |
| Antibody | Anti-pS63-c-Jun (rabbit polyclonal) | Cell Signaling Technology | #9261 RRID:AB_2130162 | IHC 1:100 |
| Antibody | anti-Ki67 (rabbit polyclonal) | Abcam | #ab15580 RRID:AB_443209 | IHC 1:200 |
| Antibody | anti-p75NGFR (goat polyclonal) | Neuromics | #GT15057 RRID:AB_2737189 | IHC 1:400 |
| Antibody | anti-Tubulin β3 (rabbit polyclonal) | Biolegend | #802001 RRID:AB_2564645 | IHC 1:1000 |
| Antibody | IRDye-680 (goat anti-mouse) | LI-COR | #926–32220 RRID:AB_621840 | WB 1:15,000 |
| Antibody | HRP-Goat anti-mouse secondary antibody | Jackson Immunoresearch | #715-035-150 RRID:AB_2340770 | WB 1:12,000 |
| Antibody | HRP-Goat anti-rabbit secondary antibody | Jackson Immunoresearch | #115-055-062 RRID:AB_2338533 | WB 1:12,000 |
| Chemical compound, drug | Araldite 6005 | EMS | #10920 | |
| Chemical compound, drug | DDSA | EMS | #13710 | |
| Chemical compound, drug | DBP | EMS | #13101 | |
| Chemical compound, drug | BDMA | EMS | #11400–25 | |
| Other | Coated grids (100 mesh) | EMS | #FF100-Cu | |
| Chemical compound, drug | Osmium tetroxide (4% solution) | EMS | #19170 | |
| Chemical compound, drug | Lead nitrate | EMS | #17900 | |
| Chemical compound, drug | Sodium citrate | EMS | #21140 | |
| Chemical compound, drug | Uranyl acetate | EMS | #22400 | |
| Chemical compound, drug | Sodium borate | EMS | #21130 | |
| Chemical compound, drug | Toluidine blue | EMS | #22050 | |
| Chemical compound, drug | Paraformaldehyde | Sigma-Aldrich | #158127 | |
| Commercial assay or kit | Click-It EdU Alexa Fluor 594 kit | ThermoFisher Scientific | #C10339 | |
| Chemical compound, drug | EdU | ThermoFisher Scientific | #E10187 | |
| Chemical compound, drug | Tamoxifen | Sigma-Aldrich | #T5648 | |
| Other | DAPI stain | Invitrogen | #D1306 | IHC 1:250 |
| Antibody | Alexa 488, 568 or 647 secondaries | Jackson Immunoresearch | IHC 1:250 to 1:1000 | |
| Software, algorithm | Image Studio Lite | LI-COR, Inc | ||
| Software, algorithm | Prism | GraphPad Software, Inc | ||
| Software, algorithm | Stata | StataCorp LP | Mann-Whitney test |
Additional files
Download links
A two-part list of links to download the article, or parts of the article, in various formats.
Downloads (link to download the article as PDF)
Open citations (links to open the citations from this article in various online reference manager services)
Cite this article (links to download the citations from this article in formats compatible with various reference manager tools)
TEAD1 is crucial for developmental myelination, Remak bundles, and functional regeneration of peripheral nerves
eLife 13:e87394.
https://doi.org/10.7554/eLife.87394


