Hepatic conversion of acetyl-CoA to acetate plays crucial roles in energy stress
- State Key Laboratory of Cellular Stress Biology, School of Life Sciences, Faculty of Medicine and Life Sciences, Xiamen University, China
- Department of Endocrinology and Diabetes, Xiamen Diabetes Institute, Fujian Province Key Laboratory of Translational Research for Diabetes, The First Affiliated Hospital of Xiamen University, China
- High-Field NMR Center, College of Chemistry and Chemical Engineering, Xiamen University, China
- Department of Chemical Biology, College of Chemistry and Chemical Engineering, Xiamen University, China
Figures
Figure 1 with 2 supplements
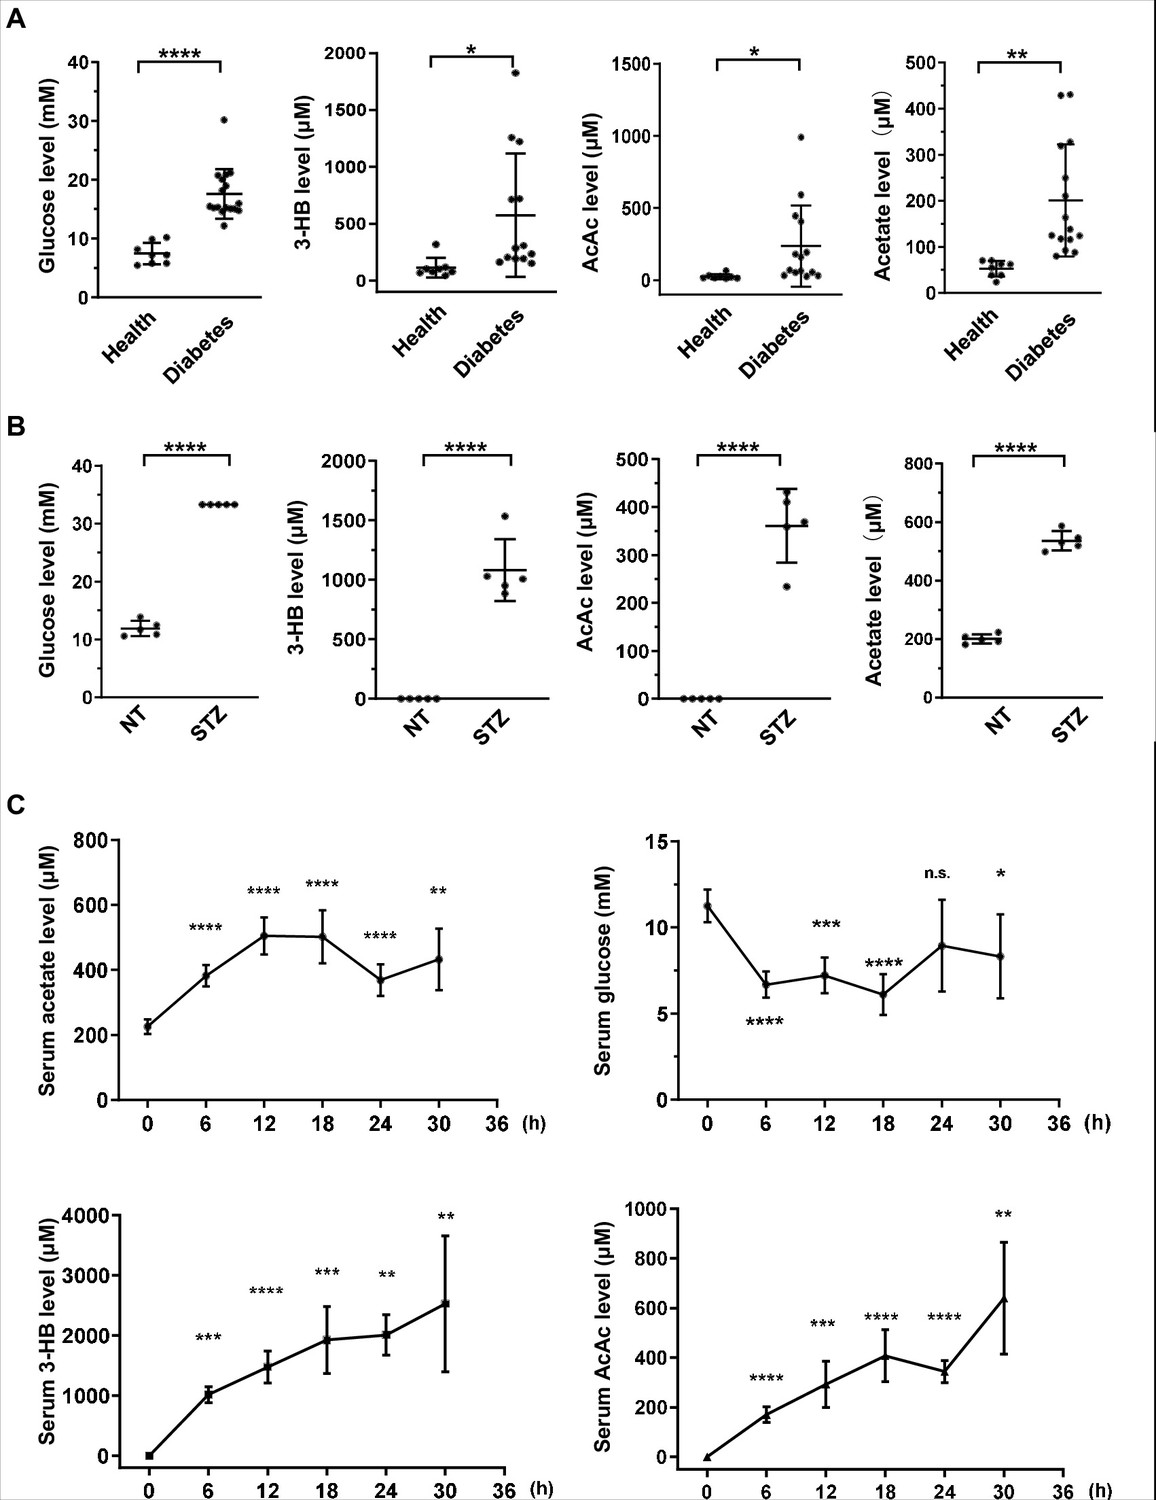
Acetate is produced at a levels comparable to those of ketone bodies in energy stress conditions.
(A) Enrichment of glucose, 3-HB, AcAc, and acetate in clinical serum samples from healthy volunteers and patients with diabetes mellitus (Healthy, n = 8; Diabetes, n = 17). (B) Enrichment of glucose, 3-HB, AcAc, and acetate in the serum of STZ-induced diabetic mice (C57BL/6, n = 5). (C) The levels of acetate, 3-HB, AcAc, and glucose in the serum of C57BL/6 mice (n = 5) starved for the indicated time course. Abbreviations: 3-HB, 3-hydroxybutyrate; AcAc, acetoacetate; NT, untreated control; STZ, streptozotocin. Values are expressed as mean ± standard deviation (SD) and analyzed statistically by two-tailed unpaired Student’s t-test (*p < 0.05, **p < 0.01, ***p < 0.001, ****p < 0.0001, n.s., no significant difference).
-
Figure 1—source data 1
Information describing the patient and healthy volunteers for the clinical data depicted in Figure 1.
- https://cdn.elifesciences.org/articles/87419/elife-87419-fig1-data1-v1.xlsx
Figure 1—figure supplement 1
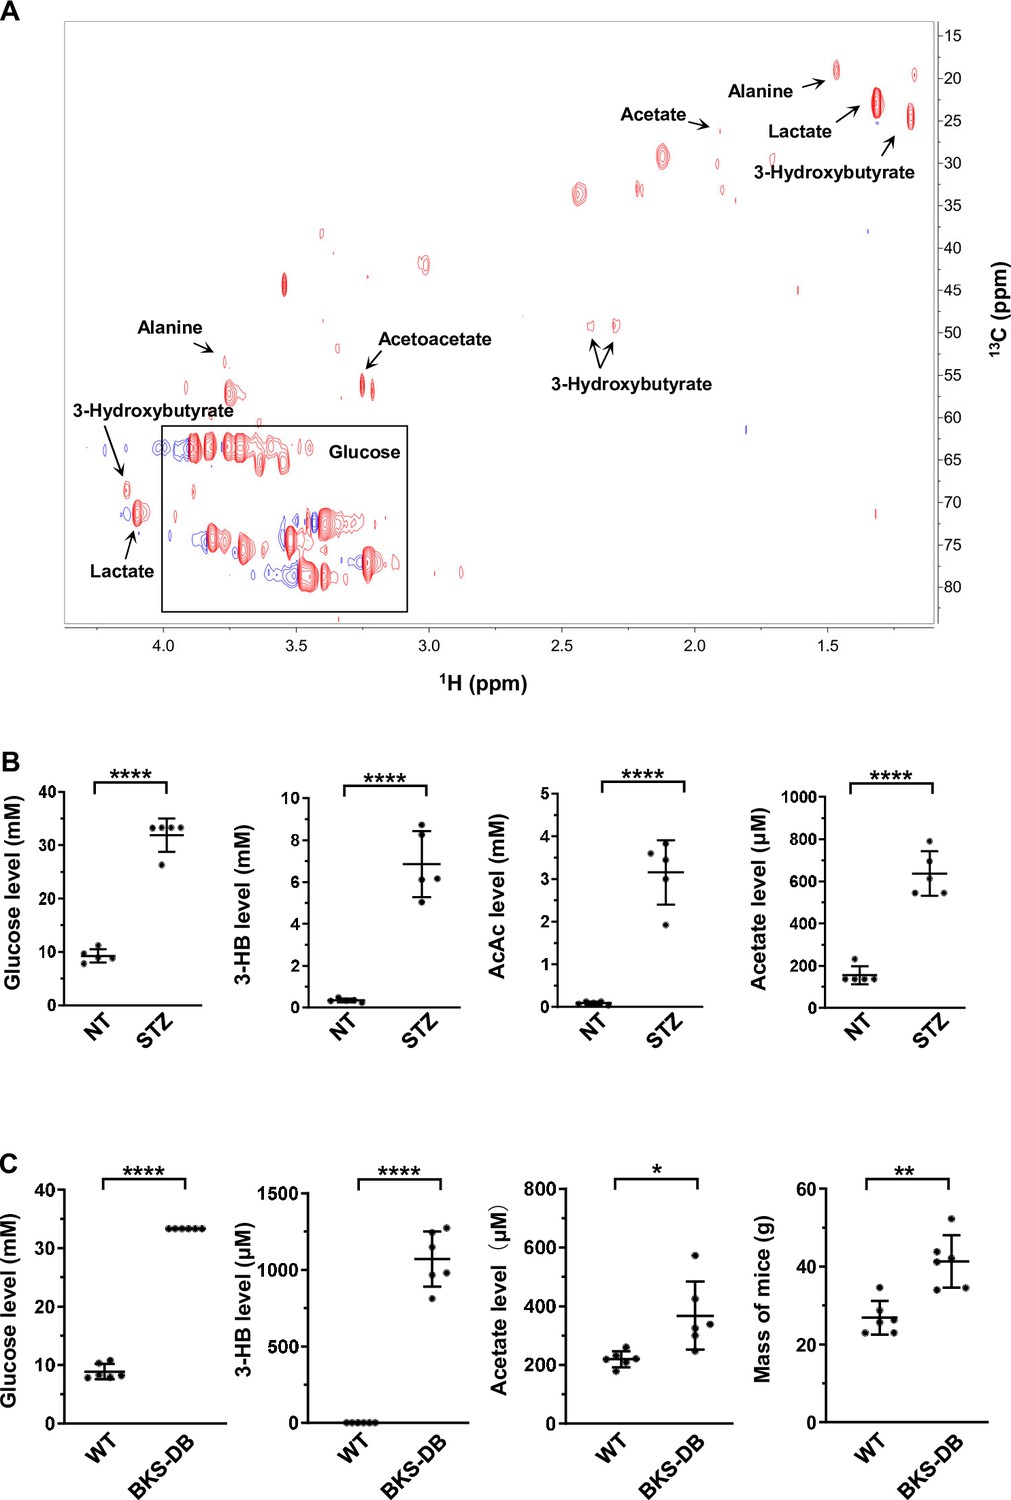
Increased concentration of acetate in diabetes mellitus.
(A) Typical 2D 1H-13C heteronuclear single quantum coherence (HSQC) spectrum of a clinical serum sample. (B) The levels of serum glucose, 3-HB, AcAc, and acetate in STZ-induced diabetic mice (BALB/c, n = 5 per group). (C) The levels of serum glucose, 3-HB, and acetate in db/db mice (C57BL/6, n = 6 per group). Abbreviations: 3-HB, 3-hydroxybutyrate; AcAc, acetoacetate; STZ, streptozotocin. Values in (B, C) are expressed as mean ± standard deviation (SD) and analyzed statistically by two-tailed unpaired Student’s t-test (*p < 0.05, **p < 0.01, ****p < 0.0001, n.s., no significant difference).
Figure 1—figure supplement 2
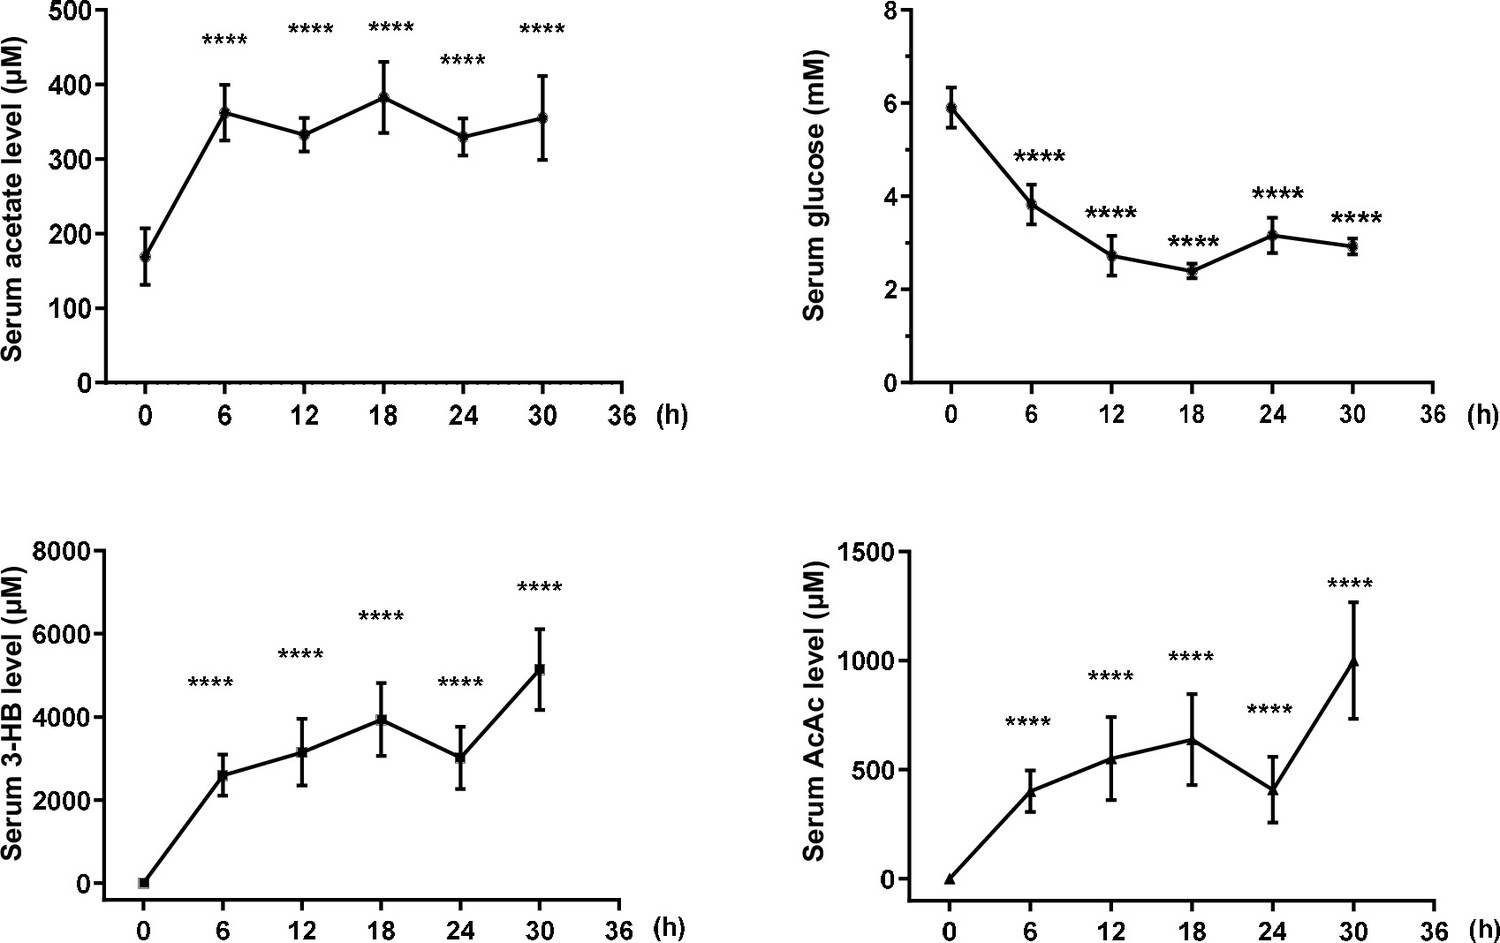
Increased level of acetate in fasting mice.
The levels of acetate, 3-hydroxybutyrate (3-HB), acetoacetate (AcAc), and glucose in the serum of BALB/c mice starved for the indicated time course. Values are presented as mean ± standard deviation (SD) (n = 5). Statistical analysis was performed by employing two-tailed unpaired Student’s t-tests ( ****p < 0.0001, n.s., no significant difference).
Figure 2 with 4 supplements
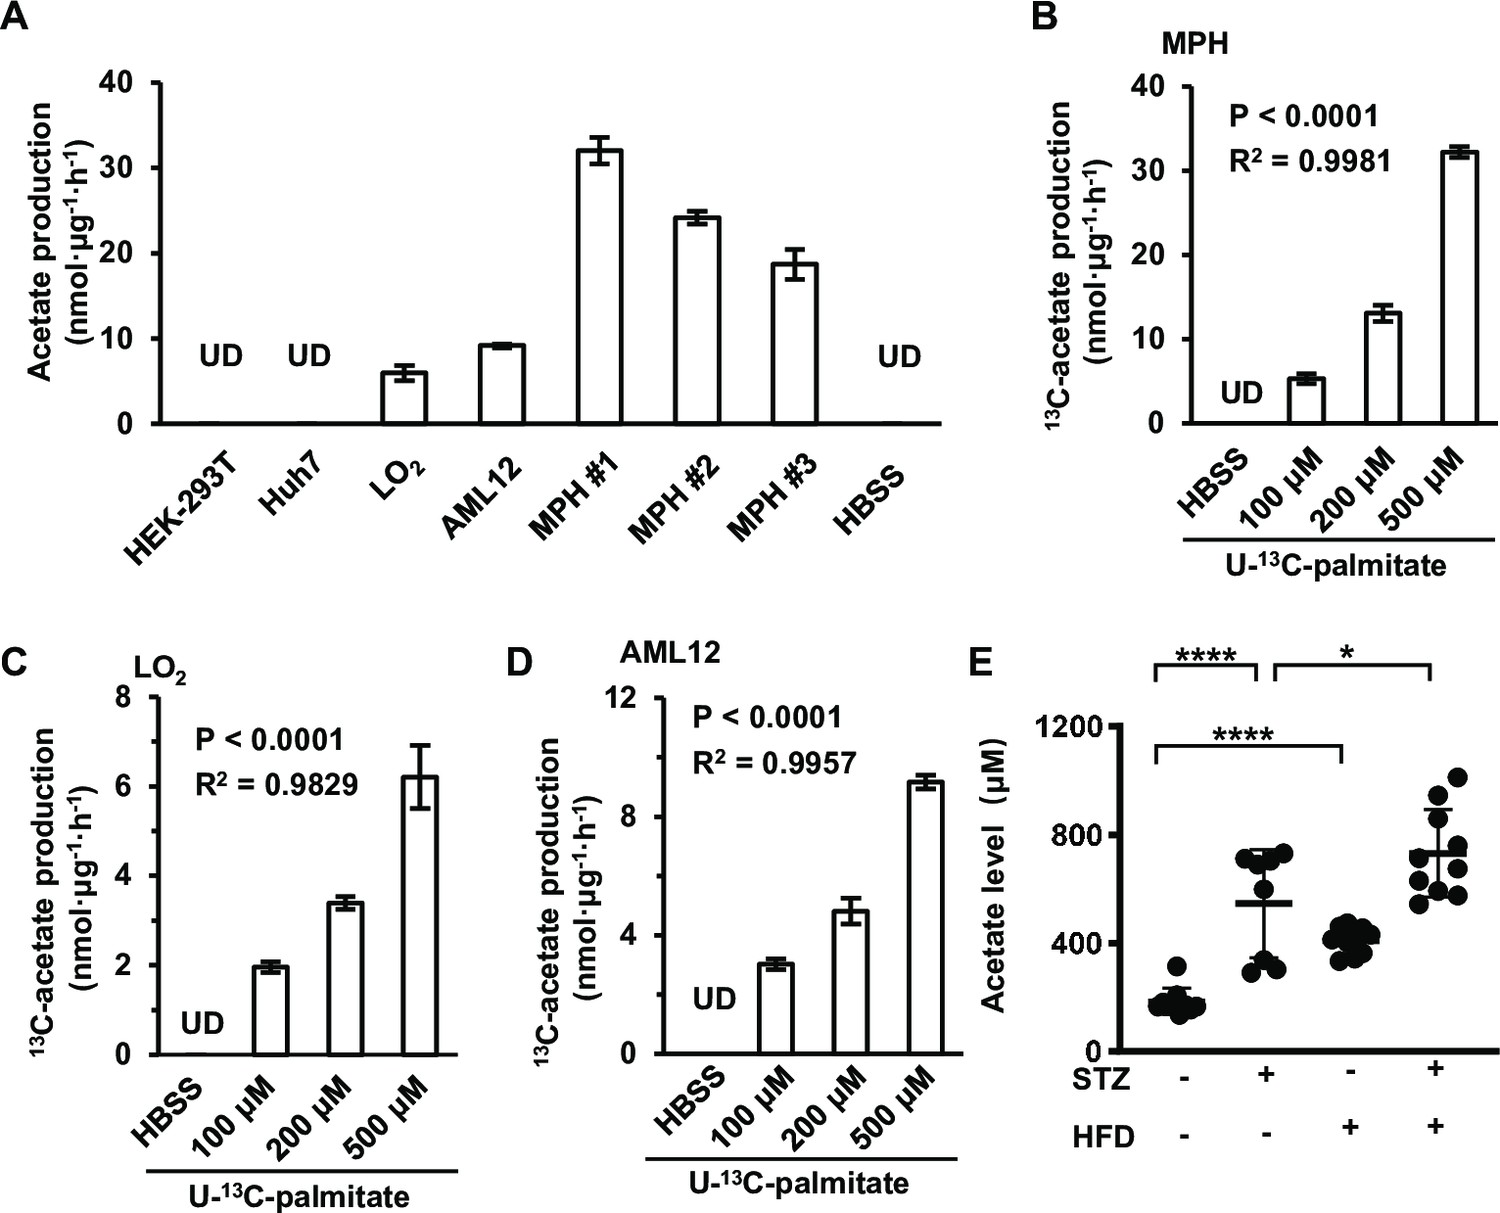
Acetate is derived from free fatty acids (FFAs) in mammalian cells.
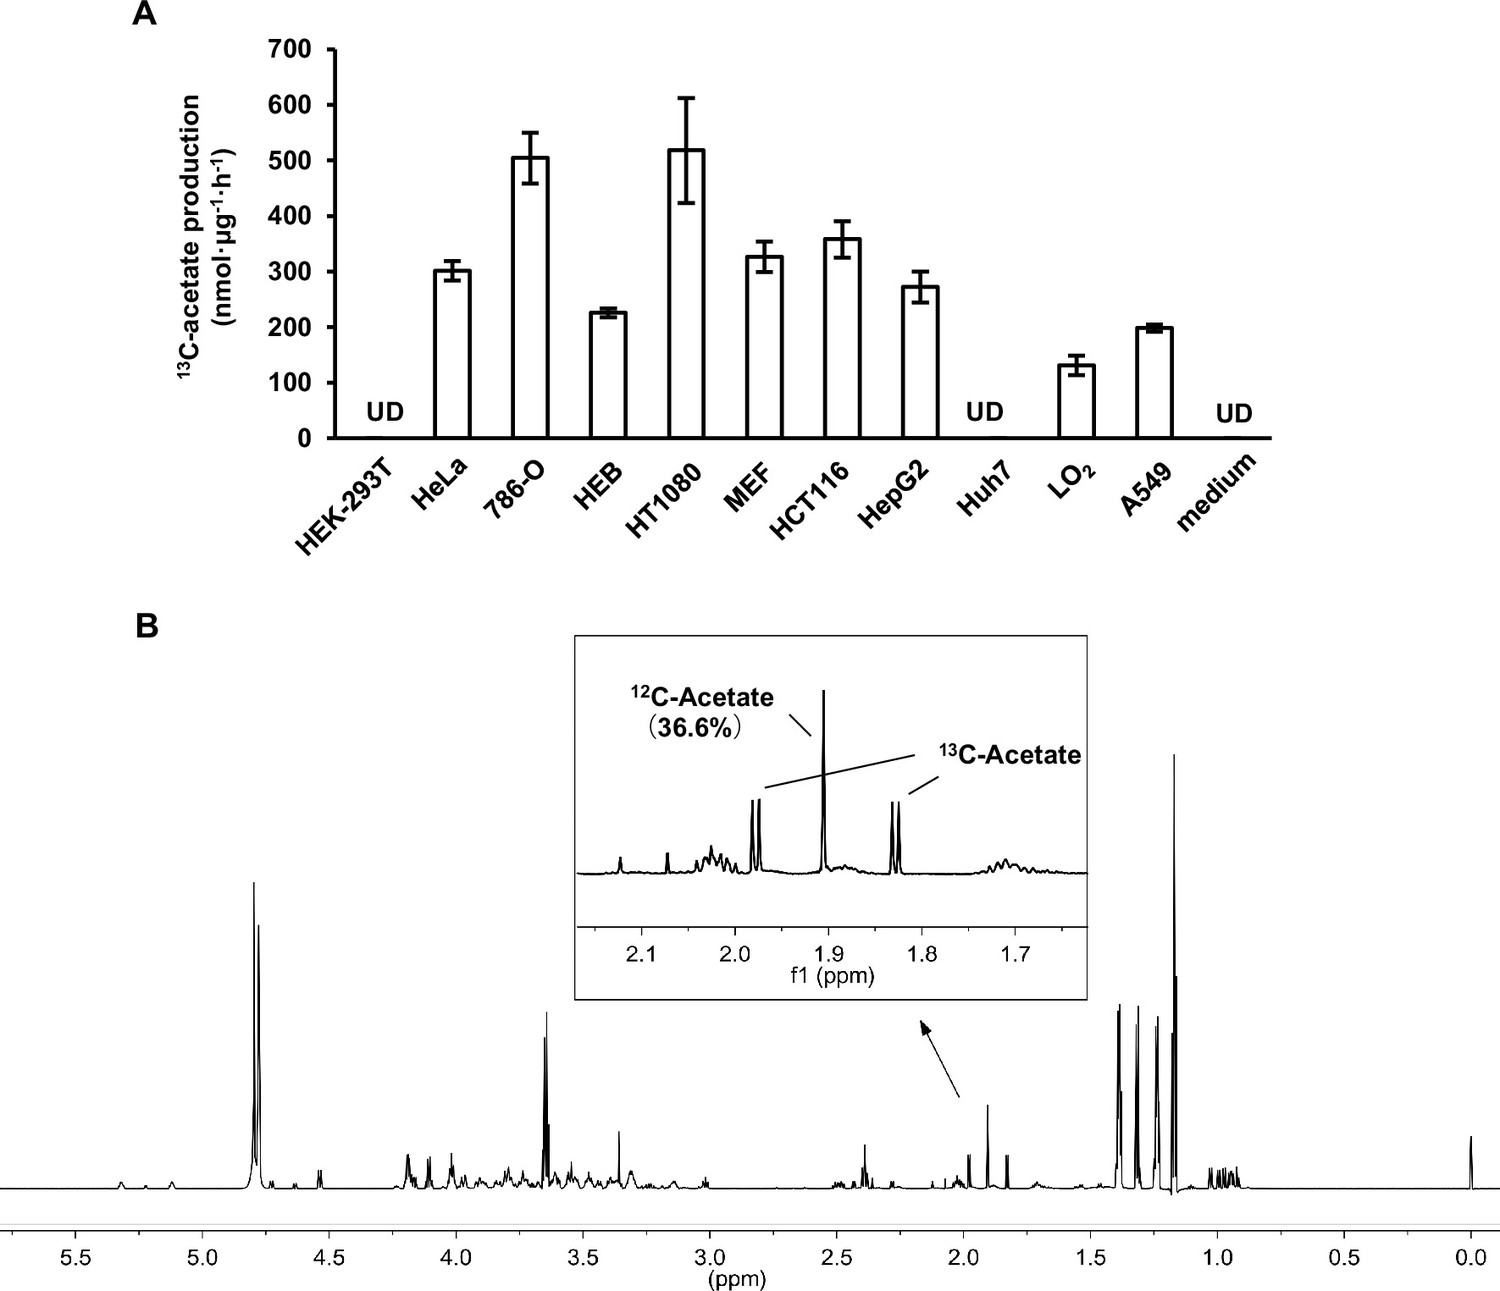
(A) The amount of U-13C-acetate secreted by the indicated cell lines cultured in U-13C-palmitate-containing Hanks’ balanced salt solution (HBSS) for 20 hr (n = 3). (B–D) The amount of U-13C-acetate secreted by MPH (B), LO2 (C), and AML12 (D) cells cultured in HBSS supplemented with increasing doses of U-13C-palmitate for 20 hr (n = 3). (E) Enrichment of acetate in the serum of untreated or STZ-induced diabetic C57BL/6 mice (n = 10) fed with a high-fat diet (HFD) or a control diet. Abbreviations: MPH, mouse primary hepatocyte; STZ, streptozotocin; UD, undetectable. Values are expressed as mean ± standard deviation (SD) and were analyzed statistically using a two-tailed unpaired Student’s t-test (A, E) or one-way analysis of variance (ANOVA) (B–D) (*p < 0.05, ****p < 0.0001, n.s., no significant difference).
Figure 2—figure supplement 1
Acetate is increased independently of gut microbiota upon energy stress.
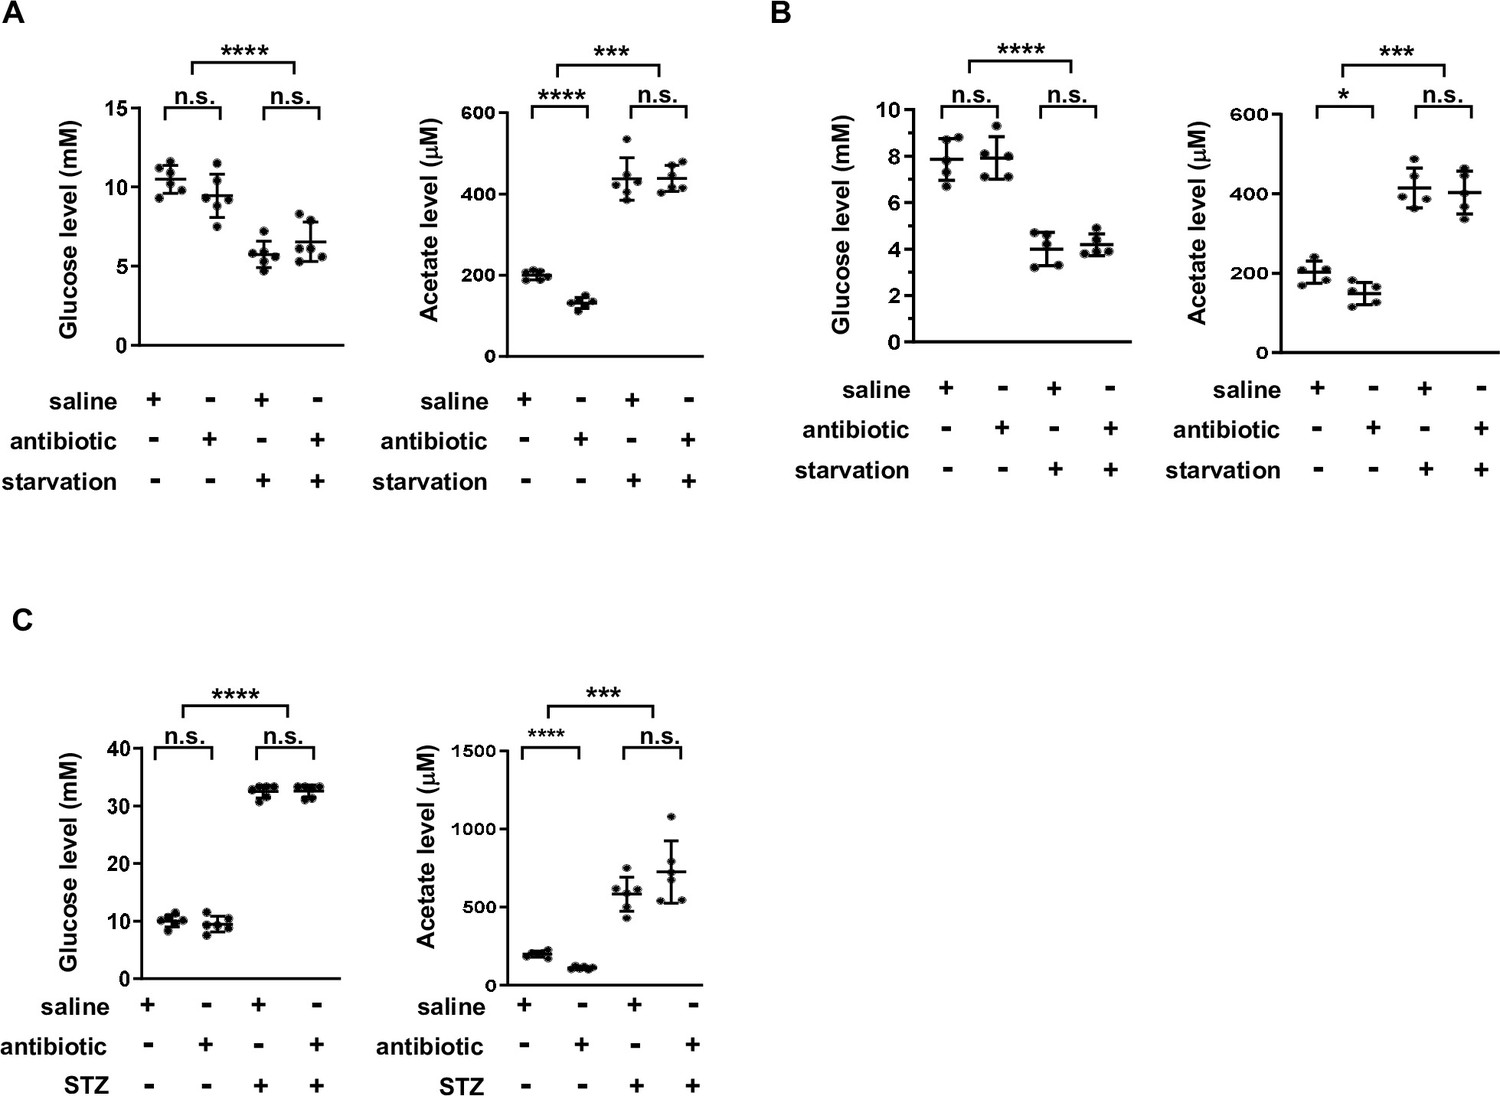
(A) The levels of serum glucose and acetate for C57BL/6 mice pretreated with antibiotics for 3 weeks and then starved for an additional 24 hr period (n = 5). (B) The levels of serum glucose and acetate for BALB/c mice pretreated with antibiotics for 3 weeks and then starved for another 12 hr (n = 5). (C) Serum glucose and acetate levels for streptozotocin (STZ)-induced diabetic mice pretreated with antibiotics for 3 weeks (C57BL/6, n = 5). Values are expressed as mean ± standard deviation (SD). Statistical analyses were carried out using two-tailed unpaired Student’s t-tests (*p < 0.05, ***p < 0.001, ****p < 0.0001, n.s., no significant difference).
Figure 2—figure supplement 2
Acetate is secreted by in vitro cultured mammalian cells.
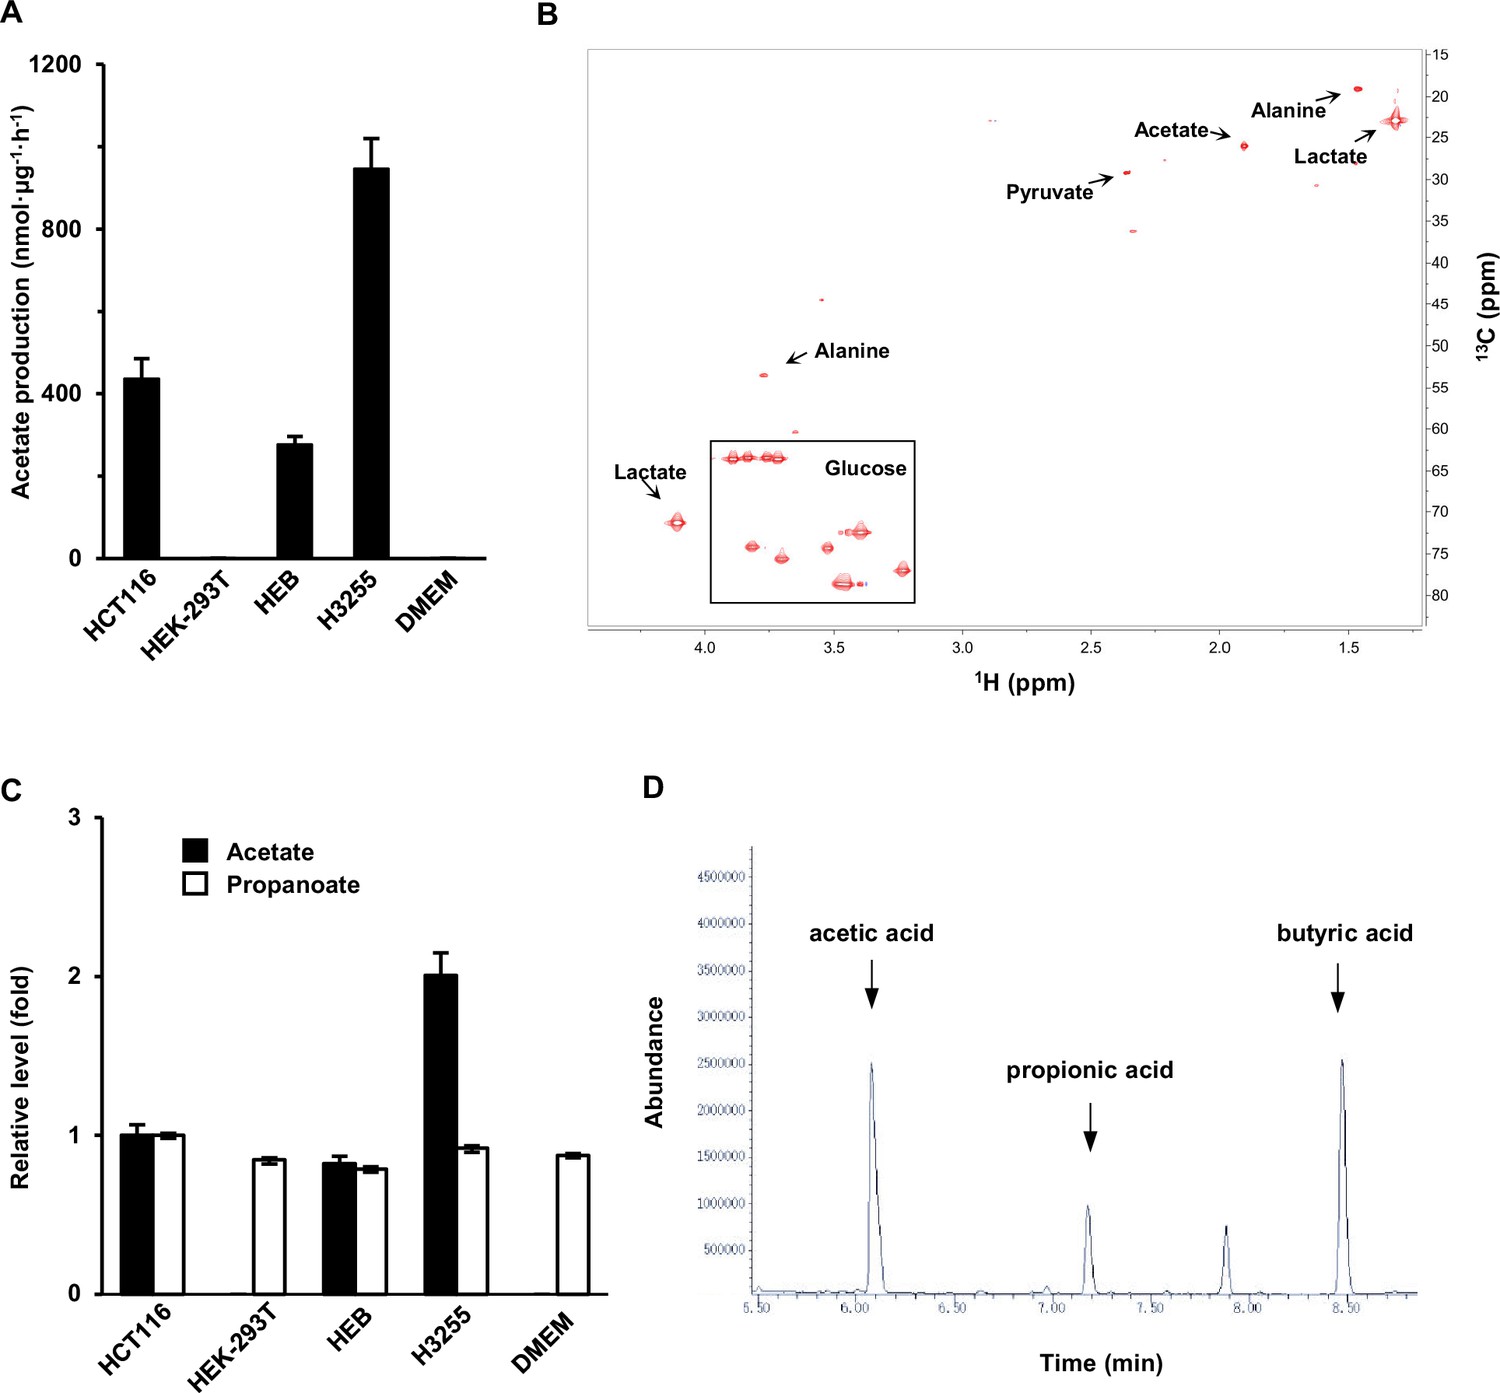
(A) Acetate secreted by various cell lines cultured in fresh DMEM medium for 20 hr was detected by NMR. (B) A typical NMR 2D 1H-13C heteronuclear single quantum coherence (HSQC) spectrum of culture medium in which HCT116 cells were cultured for 20 hr. (C, D) The production (M + 0) of acetate, propanoate, and butyrate by the cells lines shown in (A) was detected by gas chromatography–mass spectrometry (GC–MS). Propanoate and butyrate were used as an internal control. DMEM, Dulbecco's Modified Eagle Medium. Values in (A, C) are expressed as the mean ± standard deviation (SD) (n = 3) of three independent experiments.
Figure 2—figure supplement 3
Acetate is derived from other nutrients besides glucose.
(A) The amounts of U-13C-acetate secreted by the indicated cell lines cultured in U-13C-glucose-containing medium for 20 hr. Values are expressed as mean ± standard deviation (SD) (n = 3) of three independent experiments. UD, undetectable. (B) 1D 1H NMR CPMG spectra of aqueous extracts from the medium of LO2 cells cultured with U-13C-glucose for 20 hr.
Figure 2—figure supplement 4
ES-acetate is mainly derived from free fatty acids (FFAs).
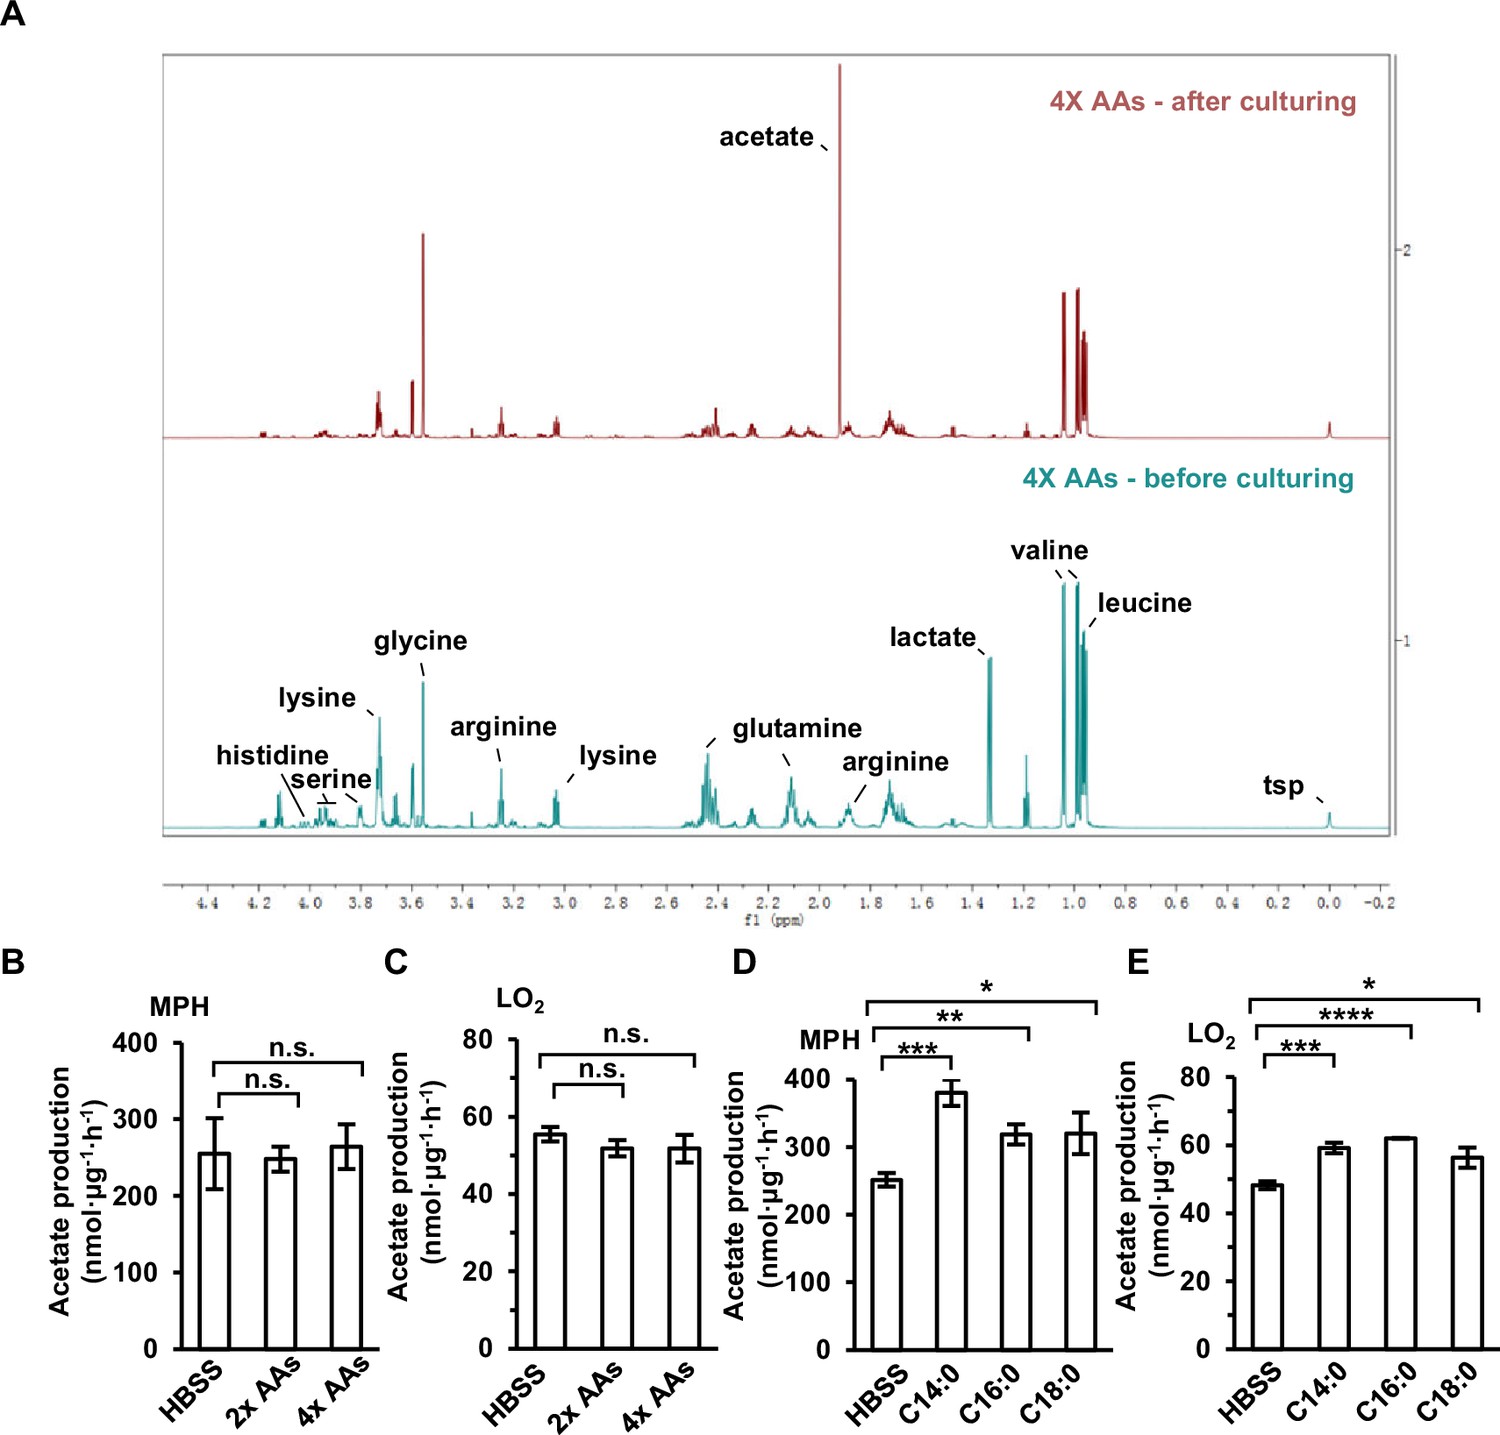
(A) A representative 1D 1H NMR CPMG spectra of aqueous extracts from the DMEM medium with 4× amino acids (AAs) in which LO2 cells were cultured for 20 hr. (B,C) The acetate production of primary hepatocyte (MPH) (B) and LO2 (C) cells cultured in Hanks’ balanced salt solution (HBSS, free of glucose, fatty acids, and amino acids) supplemented with or without the indicated doses of AAs for 20 hr. (D,E) The acetate production of MPH (D) and LO2 (E) cells cultured in HBSS with or without 500 μM of the indicated FFAs (C14:0, myristate; C16:0, palmitate; C18:0, stearate) for 20 hr. Values are expressed as mean ± standard deviation (SD) (n = 3) of three independent measurements for (B–E). Statistics in (B–E) were analyzed using two-tailed unpaired Student’s t-tests (*p < 0.05, **p < 0.01, ***p < 0.001, ****p < 0.0001, n.s., no significant difference).
Figure 3 with 1 supplement
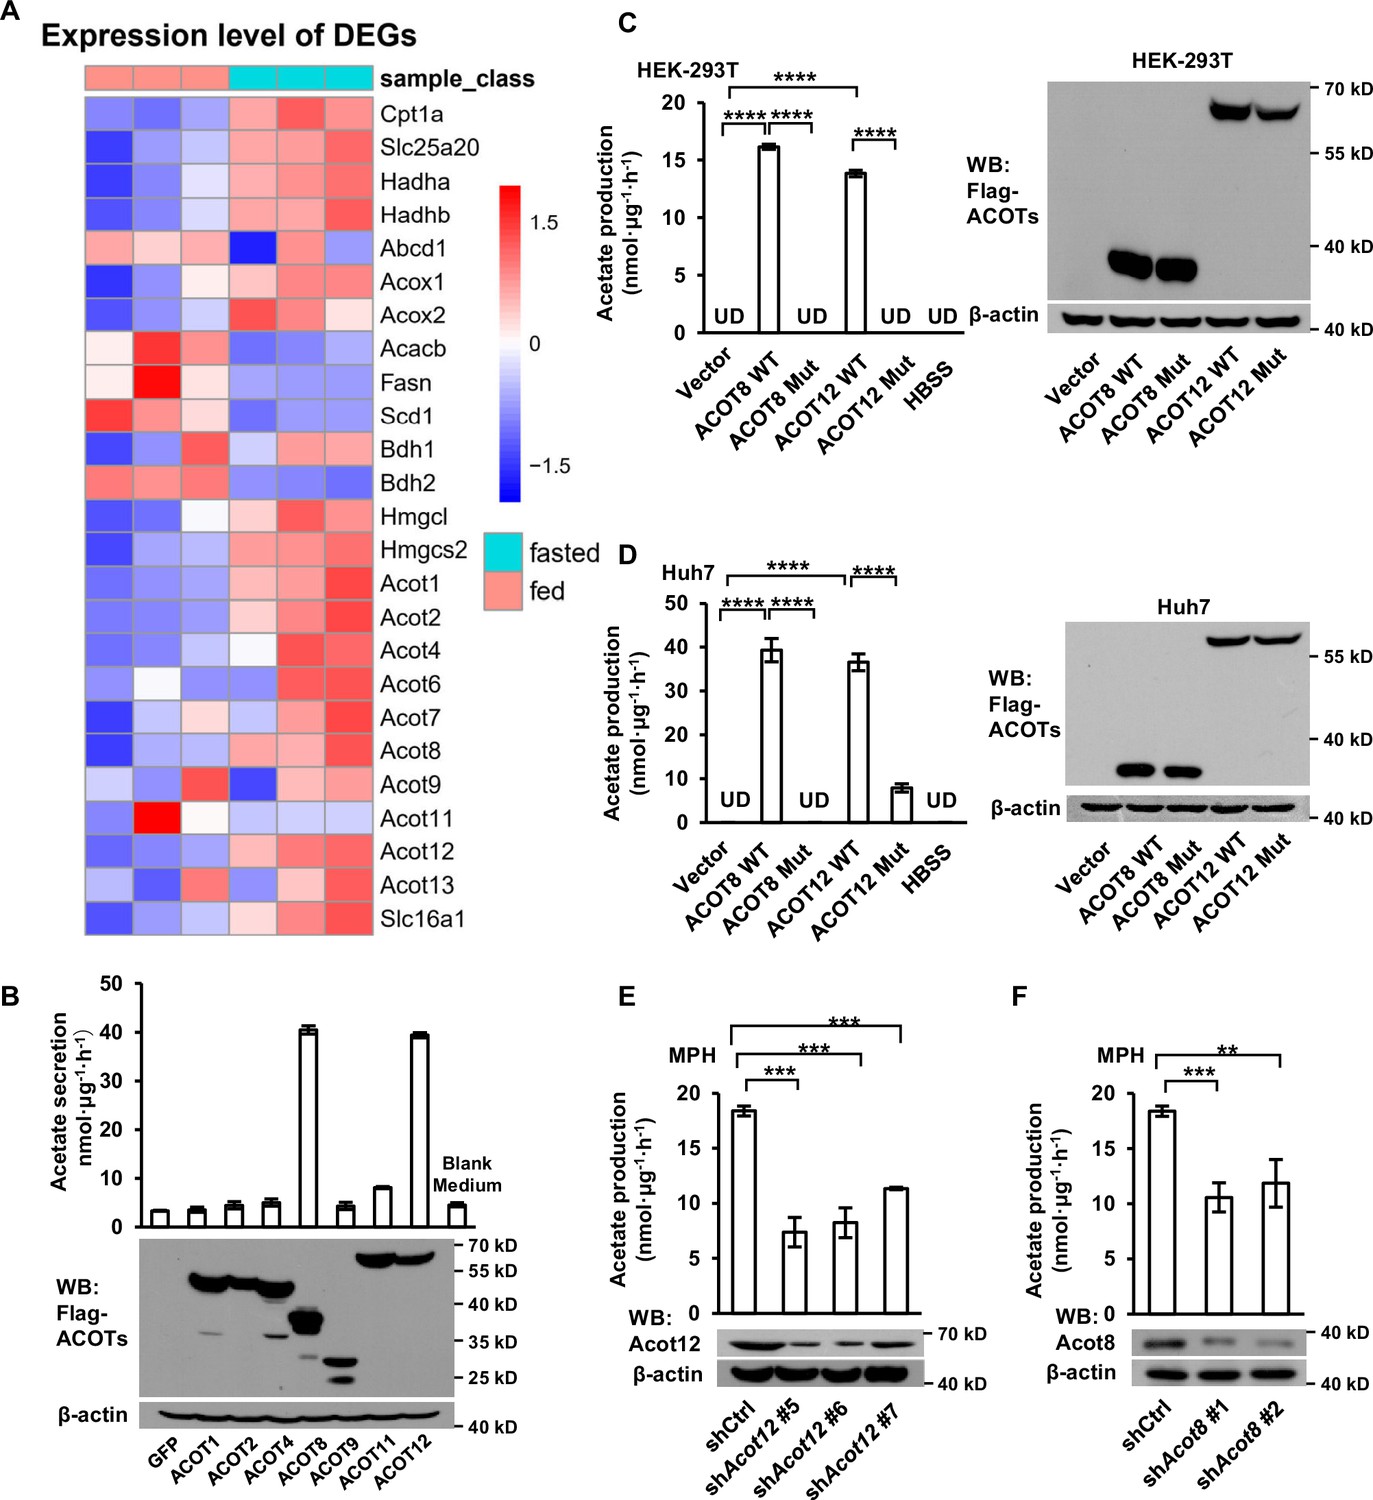
ACOT12 and ACOT8 are involved in acetate production in mammalian cells.
(A) Heatmap showing the differential hepatic expression of genes in the fed and fasted groups. RNAseq analysis data from Goldstein et al., 2017. (B) The secretion of acetate (upper panel) by HEK-239T cell lines overexpressing various ACOTs, and the protein levels of expressed ACOTs (lower panel). (C,D) HEK-293T (C) and Huh7 (D) cell lines overexpressing control vector, wildtype (WT) ACOT12 and ACOT8 or enzyme activity-dead mutants (Mut) of these two enzymes were cultured in Hanks’ balanced salt solution (HBSS) containing U-13C-palmitate for 20 hr, before U-13C-acetate was detected. (E, F) U-13C-acetate secreted by Acot12- or Acot8-knockdown mouse primary hepatocytes (MPH) after incubation in U-13C-palmitate-containing HBSS for 20 hr. Abbreviations: ACOT8 Mut, ACOT8 H78A mutant; ACOT12 Mut, ACOT12 R312E mutant; shAcot8, short hairpin RNA targeting mouse Acot8 gene; shAcot12, short hairpin RNA targeting mouse Acot12 gene; UD, undetectable. Values are expressed as mean ± standard deviation (SD) (n = 3) of three independent experiments and analyzed using unpaired Student’s t-tests (**p < 0.01, ***p < 0.001, ****p < 0.0001, n.s., no significant difference).
-
Figure 3—source data 1
Complete, unedited immunoblots, as well as immunoblots including sample and band identification, are provided for the immunoblots presented in Figure 3.
- https://cdn.elifesciences.org/articles/87419/elife-87419-fig3-data1-v1.zip
Figure 3—figure supplement 1
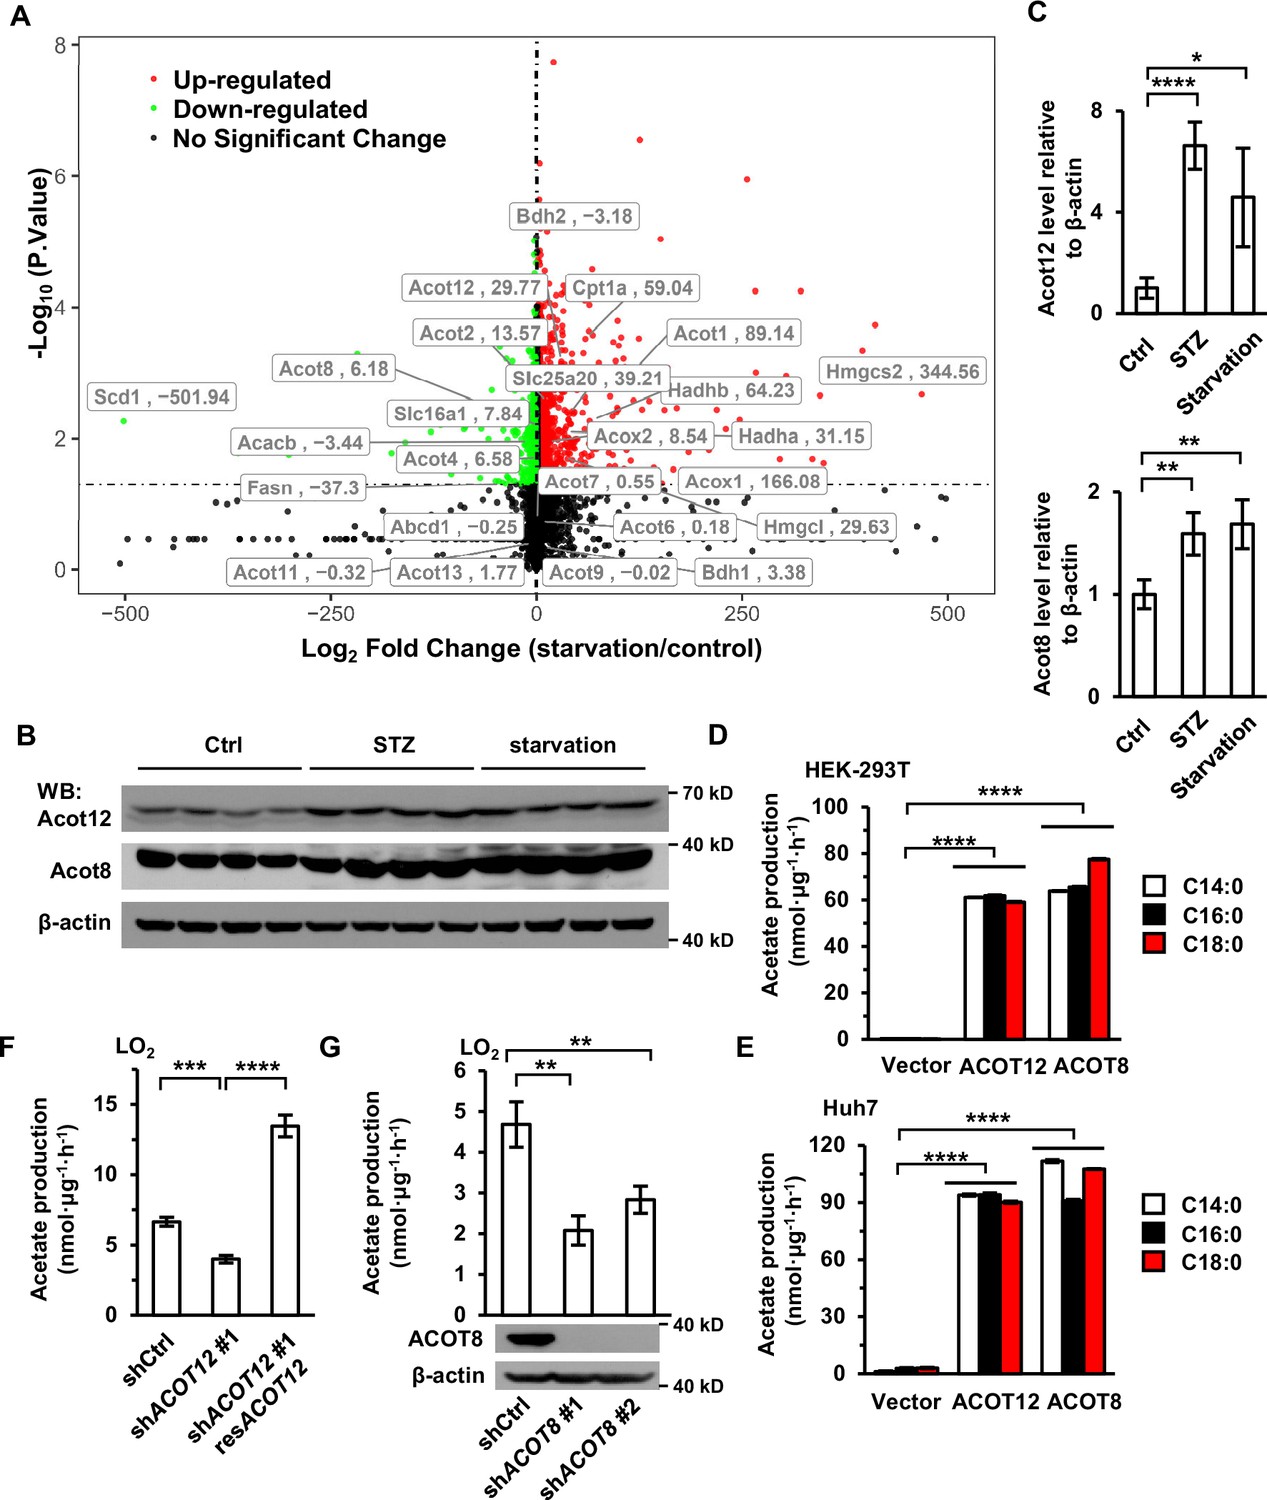
ACOT12 and ACOT8 are responsible for acetate production during energy stress.
(A) Volcano plot of RNAseq analysis data from Goldstein et al., 2017. Taxa with fold change >2 and p-value <0.05 are labeled in red and taxa with fold change <−2 and p-value <0.05 are labeled in green. (B, C) Acot12 and Acot8 in the livers of C57BL/6 mice with streptozotocin (STZ)-induced type I diabetes or 48 hr starvation were detected by Western Blot (B), and their protein levels relative to β-actin were analyzed (C). ACOT, acyl-CoA thioesterase. (D, E) HEK-293T (D) and Huh7 (E) cell lines overexpressing ACOT12 or ACOT8 were cultured in medium containing the indicated free fatty acids (FFAs) for 20 hr, before the secreted acetate was detected (n = 3). (F) The enrichment of U-13C-acetate in LO2 cells in which ACOT12 expression was knocked down or knocked down and rescued, before culturing in medium supplemented with U-13C-palmitate for 20 hr (n = 3) (compared to controls). (G) The enrichment of U-13C-acetate in LO2 cell lines in which ACOT8 is knocked down and cultured in medium containing U-13C-palmitate for 20 hr (n = 3). Values are expressed as mean ± standard deviation (SD) of three independent experiments. Statisical comparisons were made by two-tailed unpaired Student’s t-tests. *p < 0.05, **p < 0.01, ***p < 0.001, ****p < 0.0001.
-
Figure 3—figure supplement 1—source data 1
Complete, unedited immunoblots, as well as immunoblots including sample and band identification, are provided for the immunoblots presented in Figure 3—figure supplement 1.
- https://cdn.elifesciences.org/articles/87419/elife-87419-fig3-figsupp1-data1-v1.zip
Figure 4 with 3 supplements
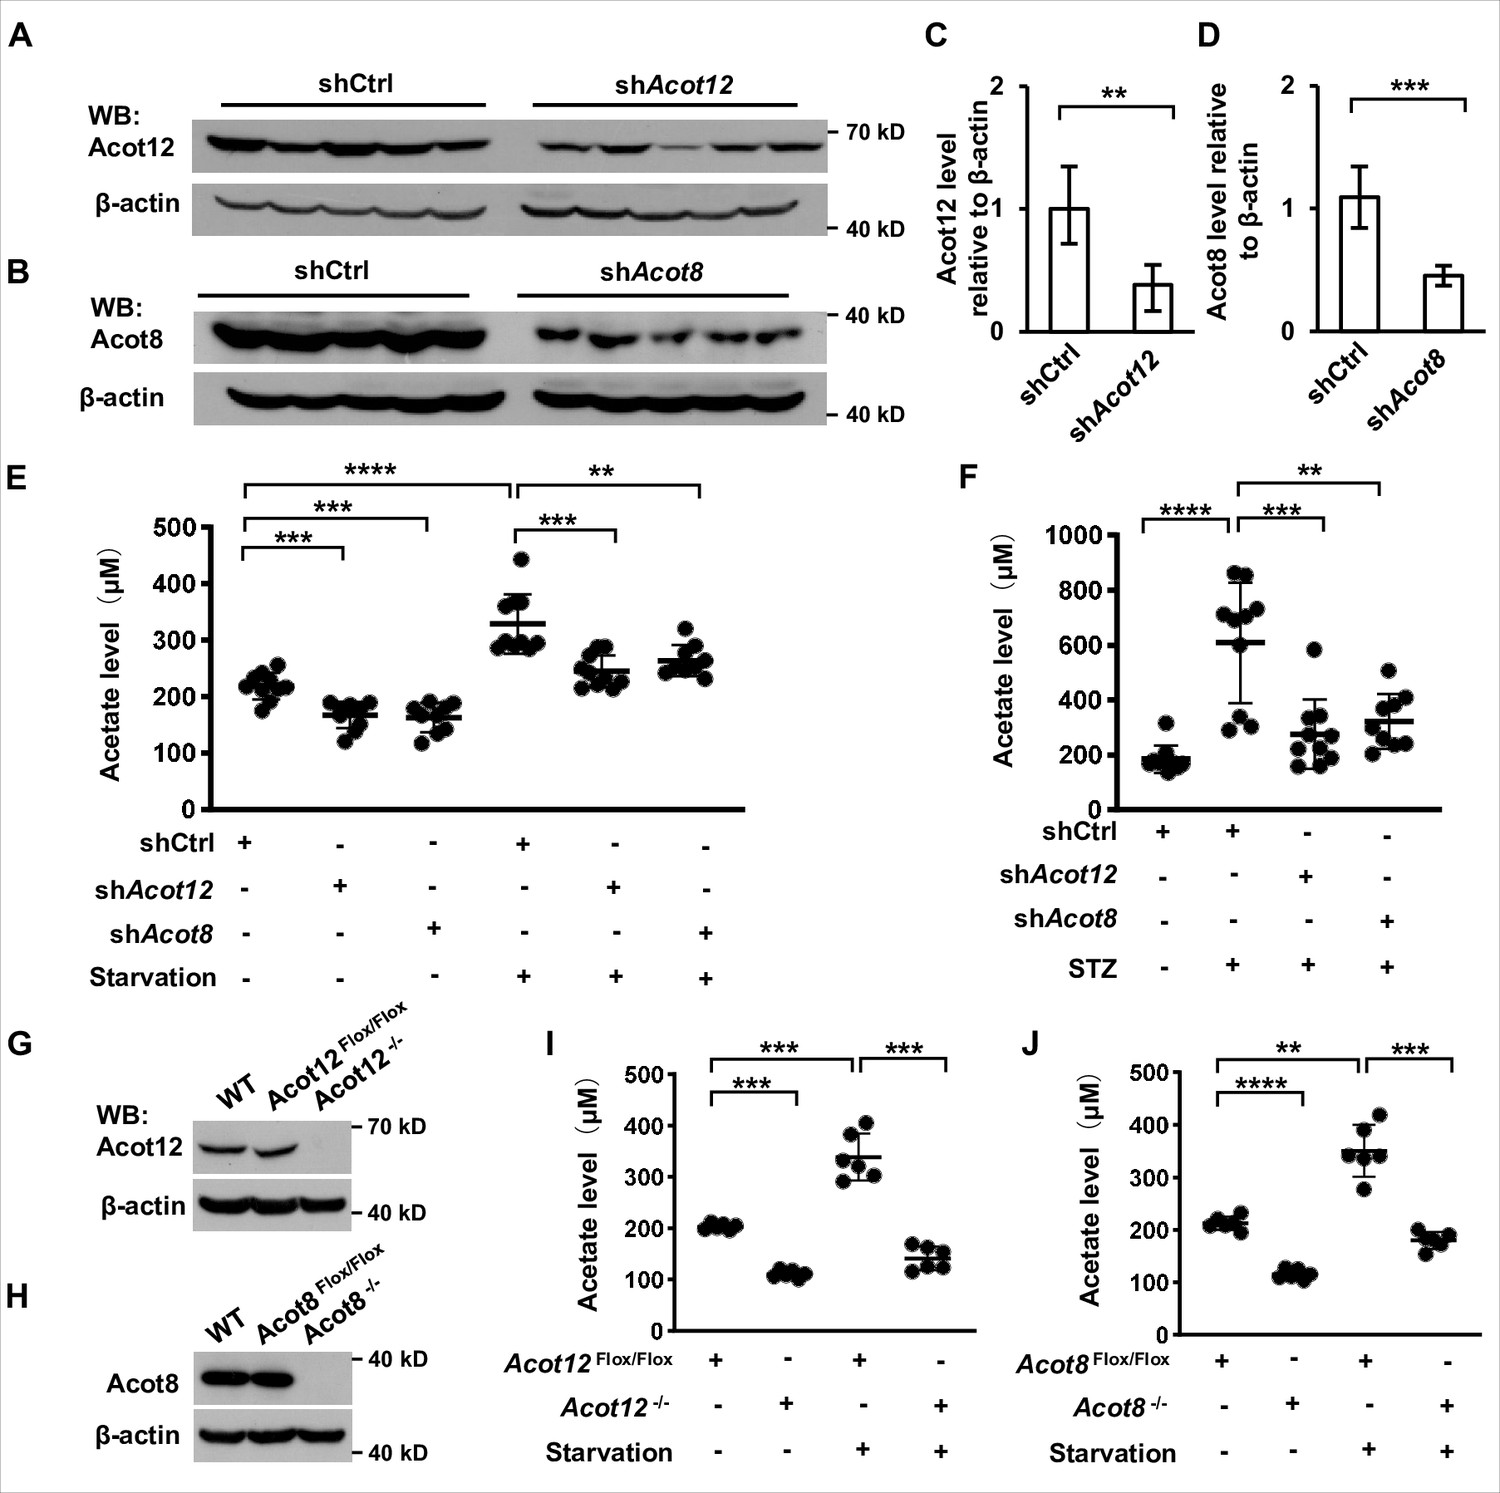
ACOT12 and ACOT8 are responsible for acetate production in energy stress conditions.
(A, C) Acot12 in mice (C57BL/6) liver was knocked down by adenovirus-based shRNA, followed by detection of Acot12 protein with Western Blot (A) and evaluation of knockdown efficiency by calculating Acot12 level relative to β-actin (C). (B, D) The knockdown efficiency of Acot8 was determined in the same way as that of Acot12. (E) Enrichment of serum acetate in normal diet and 16 hr fasted mice (C57BL/6) with adenovirus-mediated knockdown of Acot12 or Acot8 in the liver. (F) Enrichment of serum acetate in streptozotocin (STZ)-induced diabetic mice (C57BL/6) with adenovirus-mediated knockdown of Acot12 or Acot8 in the liver. (G, H) Acot12 (G) or Acot8 (H) was conditionally deleted in the liver of mice (C57BL/6) by Cre-Loxp in liver, followed by detection of Acot12 and Acot8 protein with Western Blot. (I, J) Enrichment of serum acetate in normal diet and 16 hr fasted mice (C57BL/6) with Cre-Loxp-mediated conditional deletion of Acot12 (I) or Acot8 (J) in liver. Results are expressed as mean ± standard deviation (SD) of three independent experiments in (C, D), n = 10 mice per group in (E, F) and n = 6 mice per group in (I, J). Results were analyzed by unpaired Student’s t-tests (**p < 0.01, ***p < 0.001, ****p < 0.0001, n.s., no significant difference).
-
Figure 4—source data 1
Complete, unedited immunoblots, as well as immunoblots including sample and band identification, are provided for the immunoblots presented in Figure 4.
- https://cdn.elifesciences.org/articles/87419/elife-87419-fig4-data1-v1.zip
Figure 4—figure supplement 1
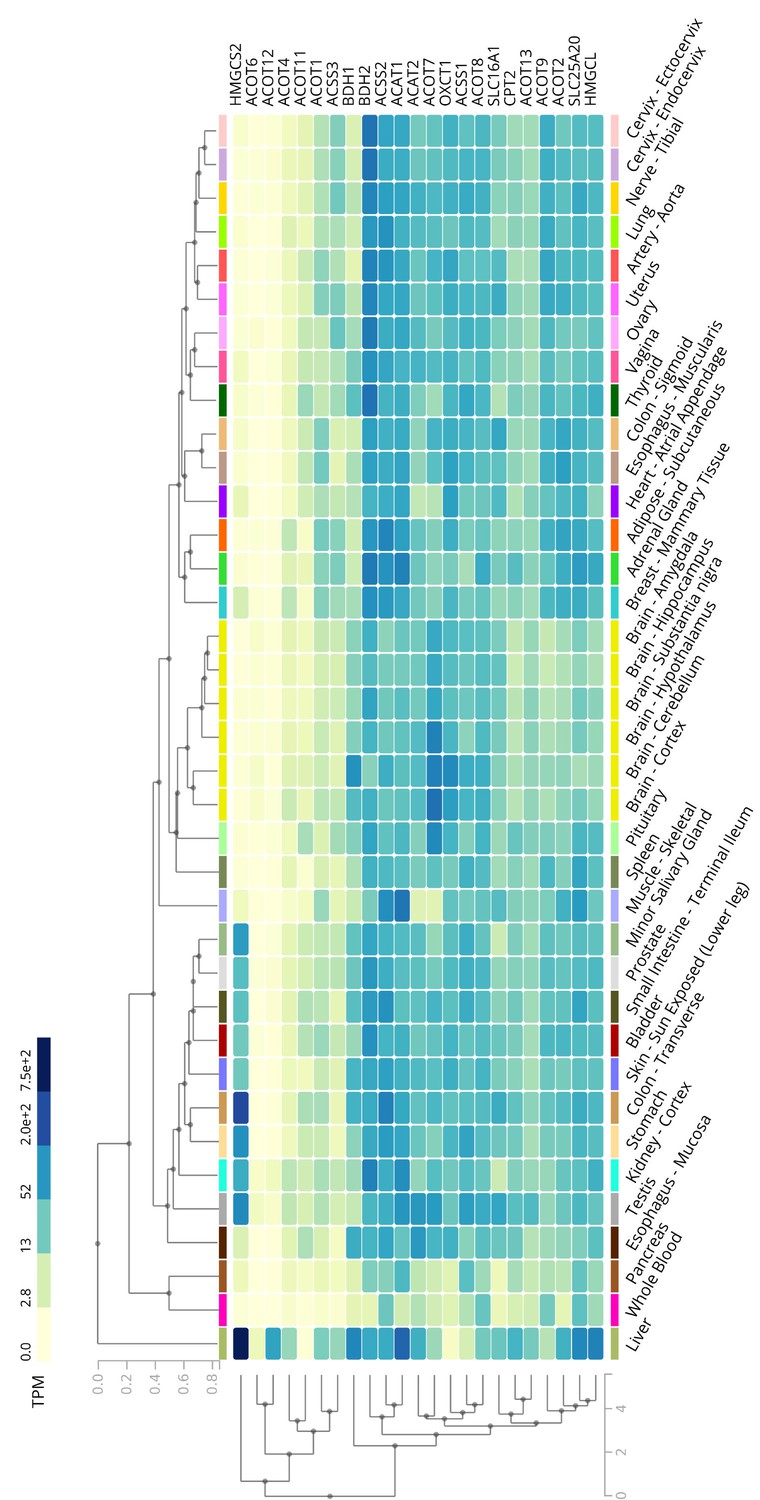
The expression profile of ACOTs and ketogenetic enzymes in human liver.
The heatmap from the GTEx database represents the expression levels of ACOTs and ketogenetic genes in a variety of normal human tissues.
Figure 4—figure supplement 2
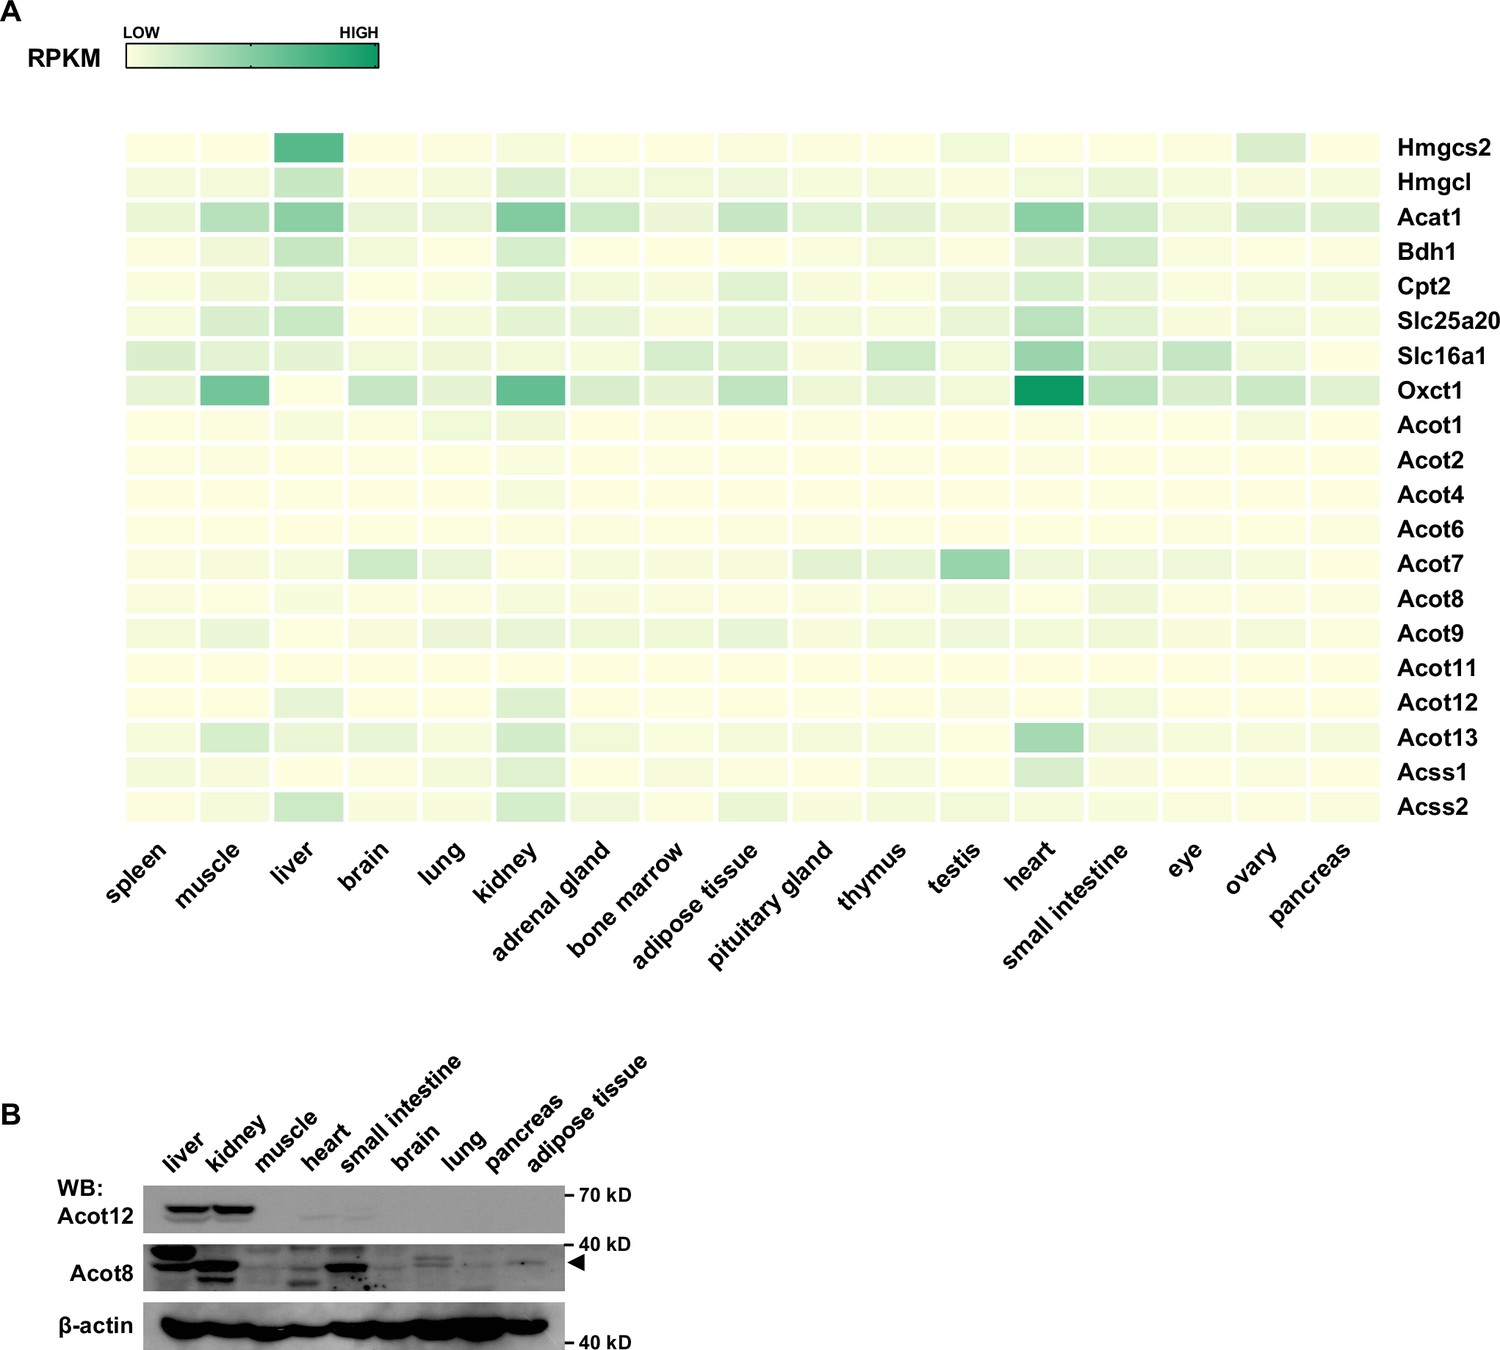
The expression profile of ACOTs and ketogenetic enzymes in mouse liver.
(A) A heatmap from the GEO database represents the expression levels of ACOTs and ketogenetic genes in the indicated normal mouse tissues. (B) The protein levels of Acot12 and Acot8 in different tissues of mice (C57BL/6).
-
Figure 4—figure supplement 2—source data 1
Complete, unedited immunoblots, as well as immunoblots including sample and band identification, are provided for the immunoblots presented in Figure 4—figure supplement 2.
- https://cdn.elifesciences.org/articles/87419/elife-87419-fig4-figsupp2-data1-v1.zip
Figure 4—figure supplement 3

Free fatty acid (FFA)-derived acetate is diminished by supplementation of glucose.
NMR detection of the amount of U-13C-acetate secreted by mouse primary hepatocyte (MPH) (A) and LO2 (B) cell lines after incubation in U-13C-palmitate-containing Hanks’ balanced salt solution (HBSS) supplemented with or without (w/wo) glucose (20 mM) for 20 hr. UD, undetectable.Values are expressed as mean ± standard deviation (SD) (n = 3) of three independent measurements. ***p < 0.001 by two-tailed unpaired Student’s t-test.
Figure 5
Acetate production is dependent on the oxidation of free fatty acids (FFAs) in both mitochondria and peroxisomes.
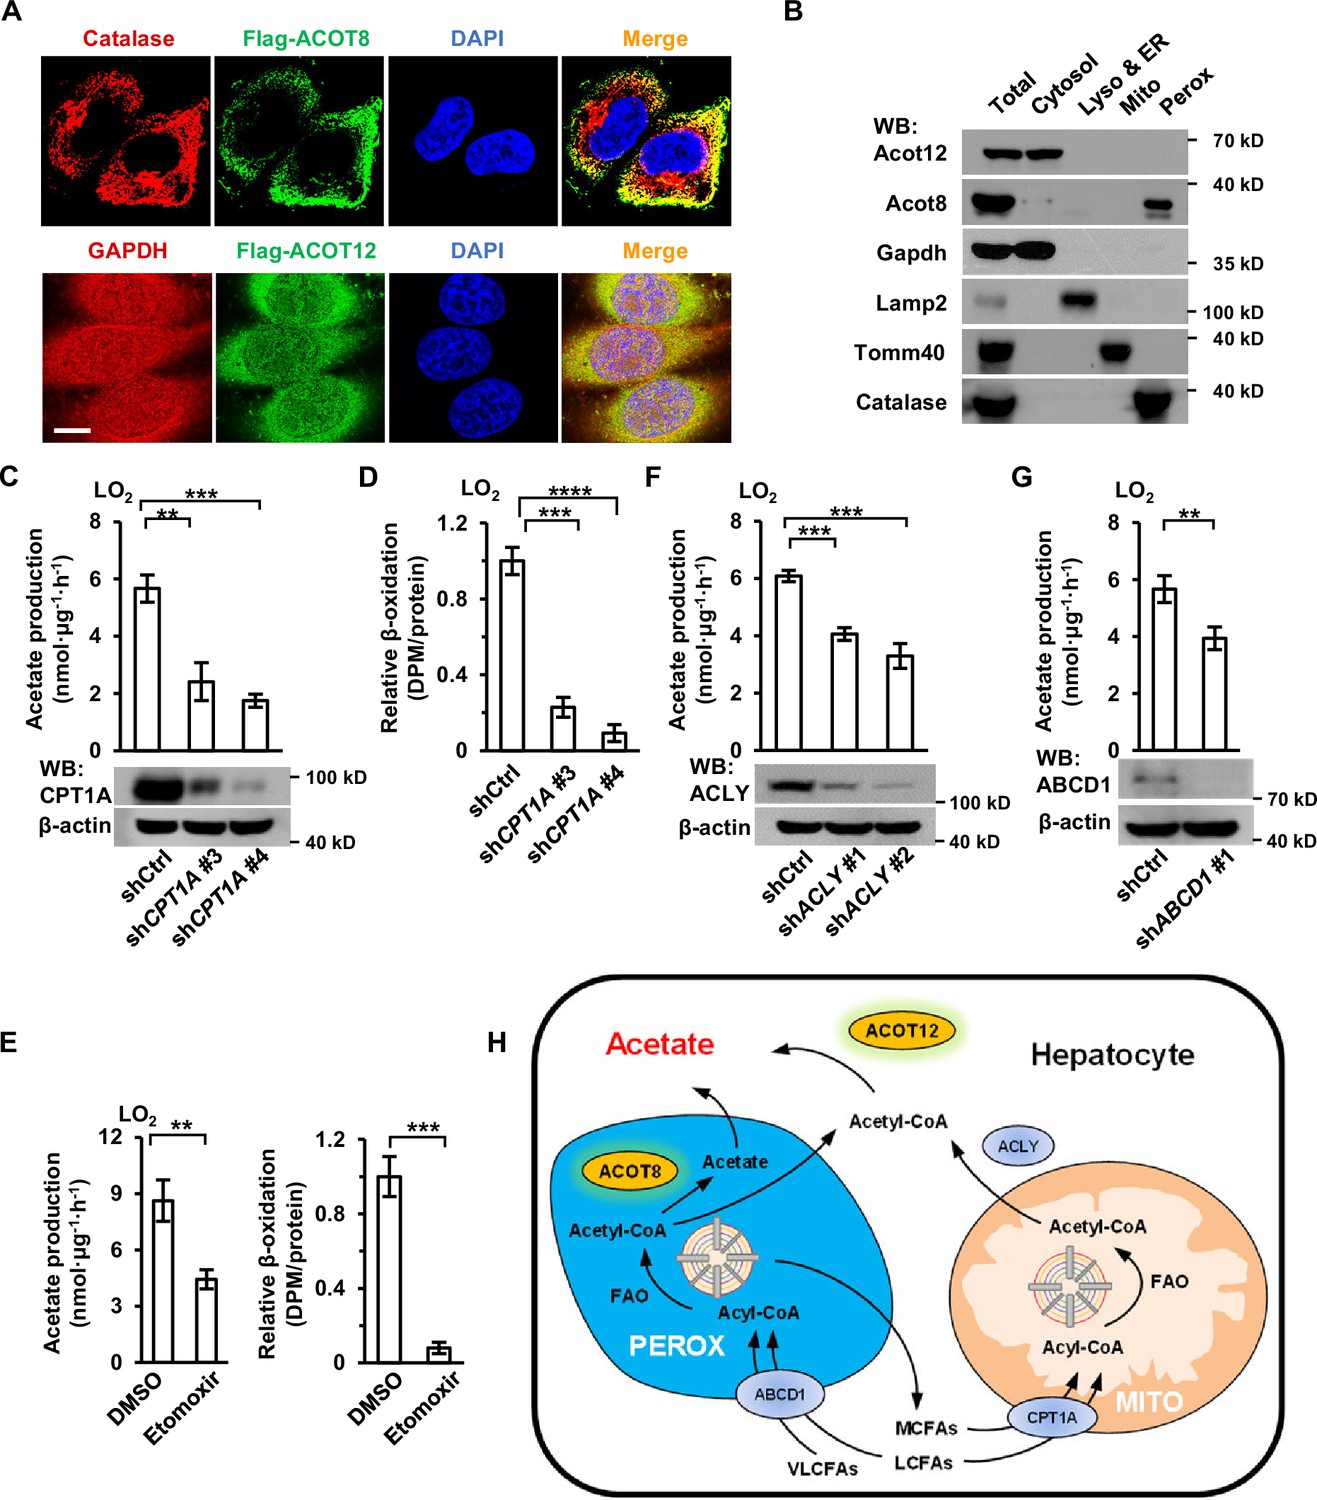
(A) Co-immunostaining of Flag-ACOT8 with the peroxisome marker catalase and of Flag-ACOT12 with the cytosol marker GAPDH in LO2 cells. Nuclei were stained with DAPI. Scale bars represent 10 μm. (B) The protein levels of Acot12 and Acot8 in the subcellular fractions of mouse primary hepatocyte (MPH) cells. Abbreviations: ER, endoplasmic reticulum; Lyso, lysosome; Mito, mitochondria; Perox, peroxisome. (C, D) U-13C-acetate production (C) and the relative β-oxidation rate (D) in carnitine palmitoyltransferase 1A (CPT1A)-knockdown LO2 cells cultured in Hanks’ balanced salt solution (HBSS) containing U-13C-palmitate for 20 hr. (E) U-13C-acetate production (left) and the relative β-oxidation rate (right) of LO2 cells cultured in U-13C-palmitate-containing HBSS with or without the CPT1 inhibitor etomoxir (20 μM) for 20 hr. (F) U-13C-acetate production in ATP citrate lyase (ACLY)-knockdown LO2 cells cultured in HBSS supplemented with U-13C-palmitate for 20 hr. (G) U-13C-acetate production in ATP-binding cassette subfamily D member 1 (ABCD1)-knockdown LO2 cells cultured in HBSS containing U-13C-palmitate for 20 hr. (H) A schematic diagram depicting the mitochondrial and peroxisome pathways of acetate production via the oxidation of FFAs in hepatocytes. Very long- and long-chain fatty acids (VL/LCFAs) are transported through ABCD1 into a peroxisome, where they are further degraded into medium-chain fatty acids (MCFAs) via the fatty acid oxidation (FAO) process. This process involves the production of acetyl-CoA, which is further converted to acetate by peroxisome-localized ACOT8. MCFAs generated in peroxisomes are exported into the cytosol and absorbed directly by mitochondria. Cytosolic acyl-CoA derived from medium- and long-chain fatty acids (M/LCFAs) is transferred into mitochondria through CPT1A. All of the fatty acids and acyl-CoA in mitochondria undergo FAO to be degraded to acetyl-CoA. Then, acetyl-CoA together with oxaloacetate is synthesized to form citrate in the tricarboxylic cycle (TCA). Citrate is subsequently exported into the cytosol, where it is lysed to acetyl-CoA by ACLY. Acetyl-CoA is finally converted to acetate by cytosol-localized ACOT12. Values in (C–G) are expressed as the mean ± standard deviation (SD) (n = 3) of three independent measurements. **p < 0.01, ***p < 0.001, ****p < 0.0001 by two-tailed unpaired Student’s t-tests.
-
Figure 5—source data 1
Complete, unprocessed immunoblots displaying sample and band identification are presented in Figure 5, along with the corresponding raw data for immunostaining.
- https://cdn.elifesciences.org/articles/87419/elife-87419-fig5-data1-v1.zip
Figure 6 with 2 supplements

ACOT12 and ACOT8 serve to maintain the CoA pool for sustained fatty acid oxidation (FAO).
(A, B) Mouse primary hepatocytes (MPHs) knocked down for Acot12 (A) or Acot8 (B) were cultured in glucose-free reaction buffer containing 0.8 μCi/ml [9,10-3H(N)]-oleic acid for 20 hr, before the relative β-oxidation rate was determined. (C) Relative abundance (M + 0) of reduced CoA in MPHs knocked down for Acot12 or Acot8. (D) Relative abundance (M + 0) of acetyl-CoA in MPHs knocked down for Acot12 or Acot8. (E) The ratio of reduced CoA to acetyl-CoA in MPHs knocked down for Acot12 or Acot8. (F) Relative abundance (M + 0) of reduced CoA and various oxidized CoA compounds in MPHs. Abbreviations: Ac-CoA, acetyl-CoA; HMG-CoA, 3-hydroxy-3-methylglutaryl-CoA. Values are expressed as mean ± standard deviation (SD) (n = 3) of three independent experiments and were analyzed using unpaired Student’s t-tests (*p < 0.05, **p < 0.01, ***p < 0.001, ****p < 0.0001, n.s., no significant difference).
Figure 6—figure supplement 1
ACOT12 and ACOT8 are involved in the catabolism of fatty acids.
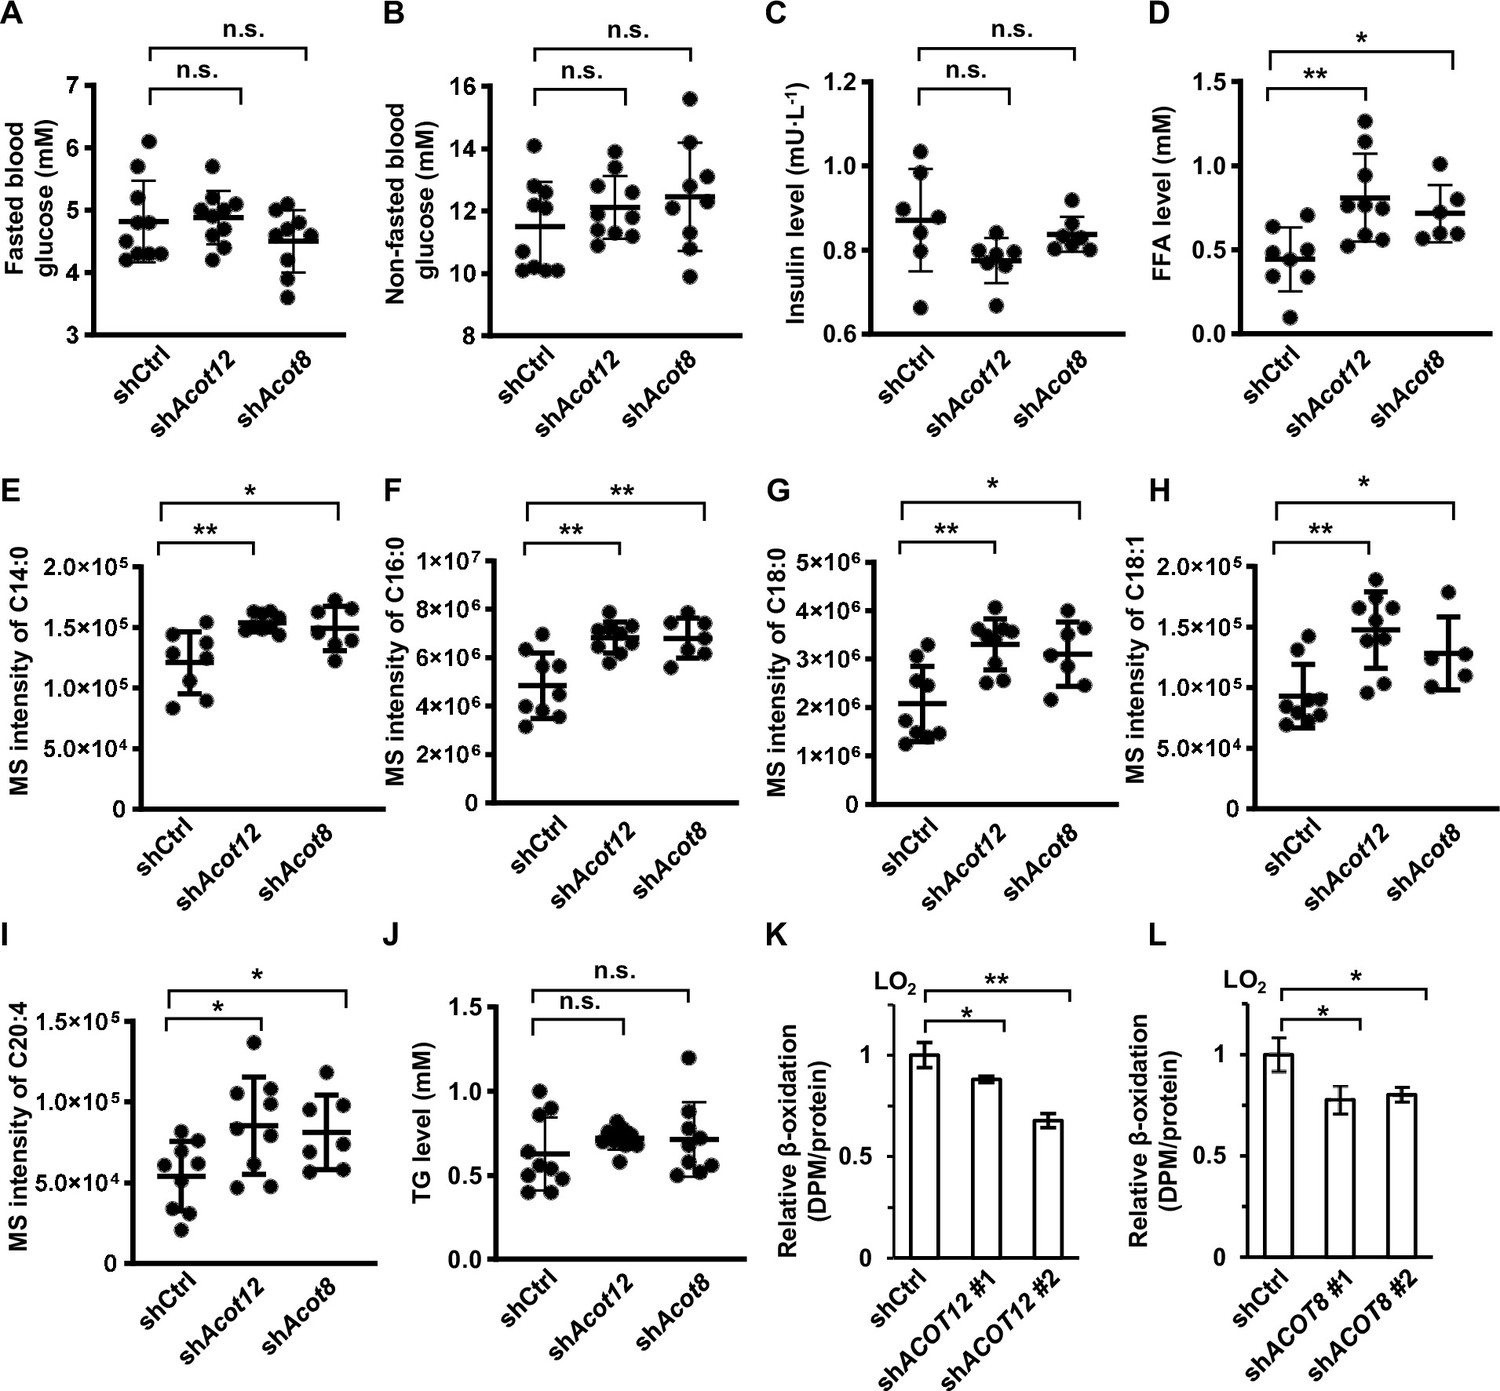
(A–D) Serum levels of fasted blood glucose (A), non-fasted blood glucose (B), insulin (C), and total free fatty acid (FFA) (D) of C57BL/6 mice with adenovirus-mediated knockdown of Acot12 or Acot8. Fasted, mice were fasted for 12 hr; non-fasted, mice were fed normally. (E–I) Serum FFA levels (M + 0) determined by gas chromatography–mass spectrometry (GC–MS). (J) Serum levels of triacylglycerol (TG) from C57BL/6 mice with adenovirus-mediated knockdown of Acot12 or Acot8. (K, L) LO2 cell lines knocked down for ACOT12 (K) or ACOT8 (L) were cultured in glucose-free reaction buffer containing 0.8 μCi/ml [9,10- 3H(N)]-oleic acid for 20 hr, before the relative β-oxidation rate was determined (n = 3). Results are expressed as mean ± standard deviation (SD) of n = 10 mice per group in (A–J) and three independent experiments in (K, L), and were analyzed by using unpaired Student’s t-tests (*p < 0.05, **p < 0.01, n.s., no significant difference).
Figure 6—figure supplement 2
ACOT12 and ACOT8 serve to maintain the CoA pool for sustained fatty acid oxidation (FAO).
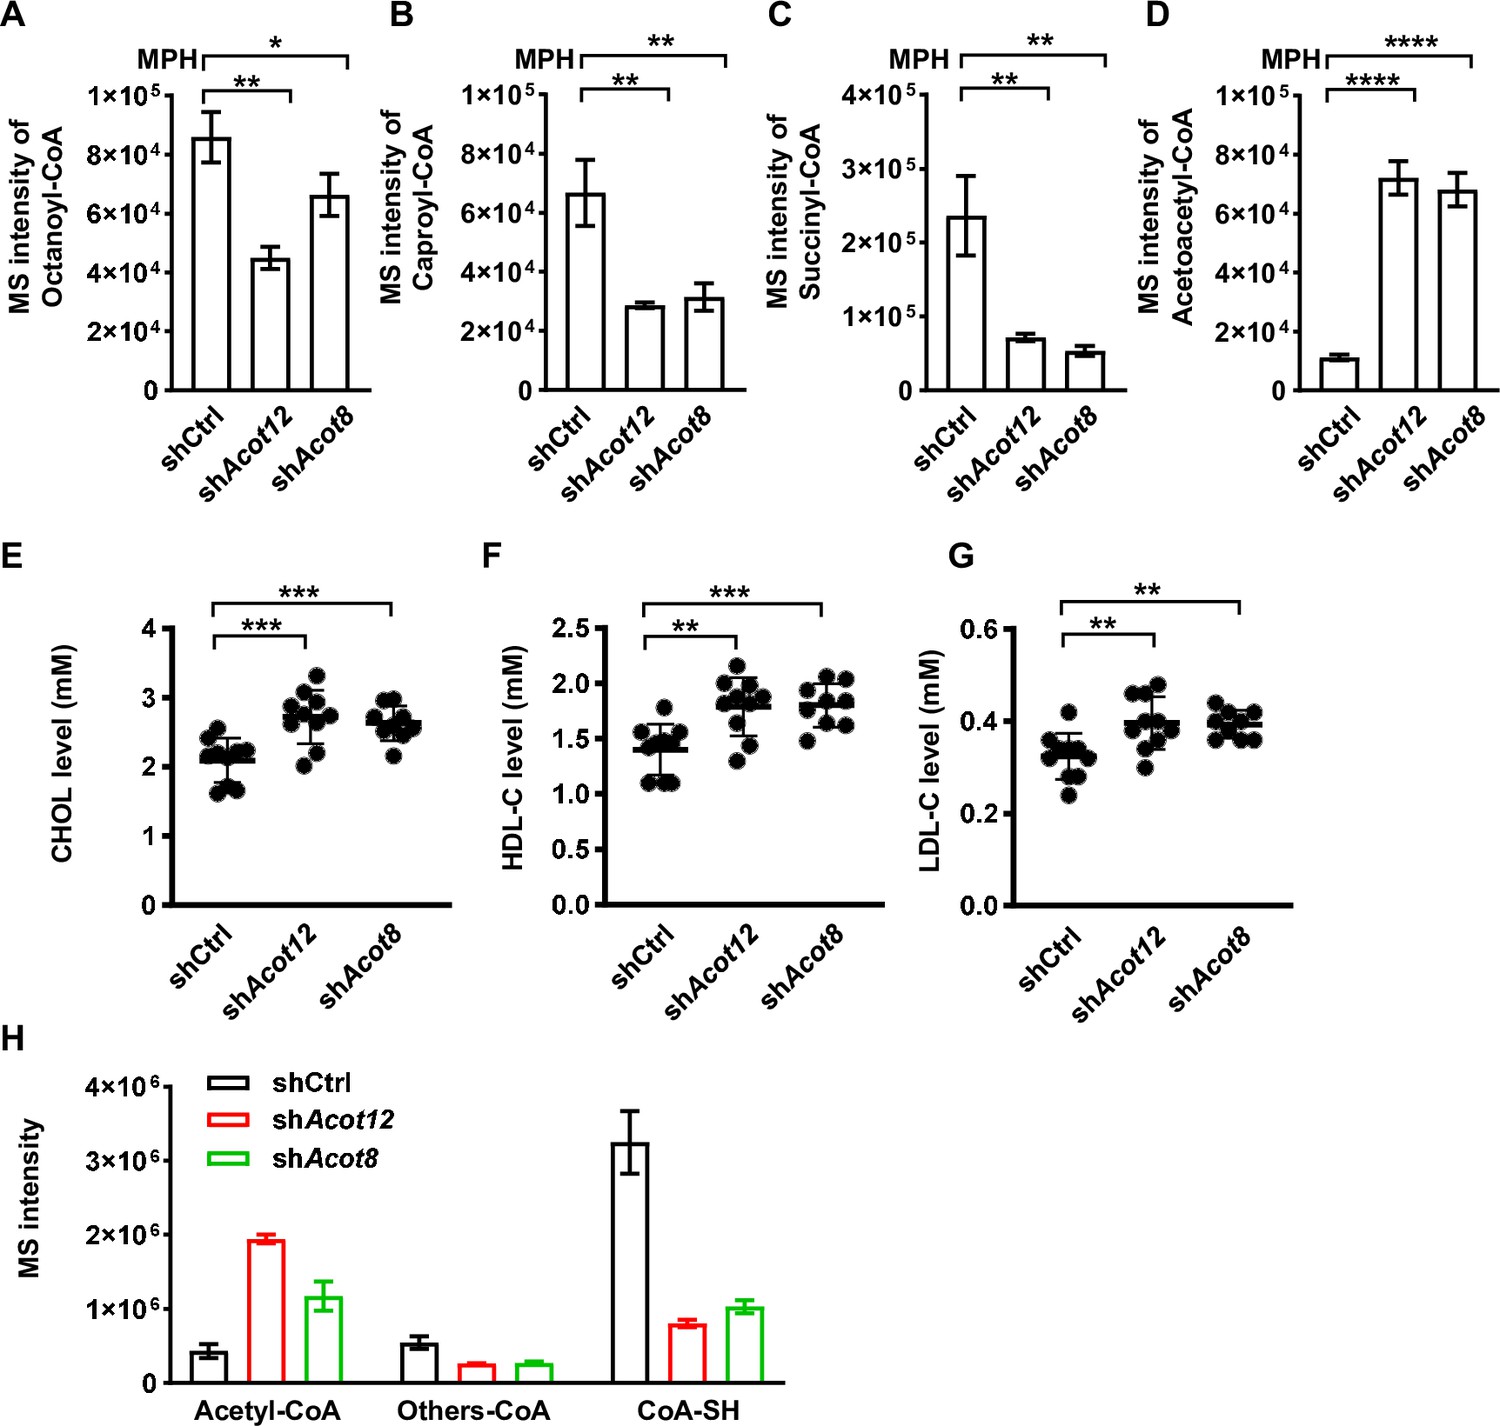
(A–D) Relative abundance (M + 0 ) of octanoyl-CoA (A), caproyl-CoA (B), succinyl-CoA (C), and acetoacetyl-CoA (D) in mouse primary hepatocytes (MPHs) knocked down for Acot12 or Acot8 (n = 3). (E–G) Serum levels of cholesterol (CHOL) (E), high-density lipoprotein cholesterol (HDL-C) (F), and low-density lipoprotein cholesterol (LDL-C) (G) of C57BL/6 mice with adenovirus-mediated knockdown of Acot12 or Acot8. (H) Relative abundance (M + 0) of reduced CoA, acetyl-CoA and other oxidized CoA molecules (octanoyl-CoA, caproyl-CoA, succinyl-CoA, acetoacetyl-CoA, and HMG-CoA) in MPHs knocked down for Acot12 or Acot8 (n = 3). HMG-CoA, 3-hydroxy-3-methylglutaryl-CoA. Results are expressed as the mean ± standard deviation (SD) of three independent experiments in (A–D, H) and n = 10 mice per group in (E–G), and were analyzed using unpaired Student’s t-tests (*p < 0.05, **p < 0.01, ***p < 0.001, ****p < 0.0001, n.s., no significant difference).
Figure 7
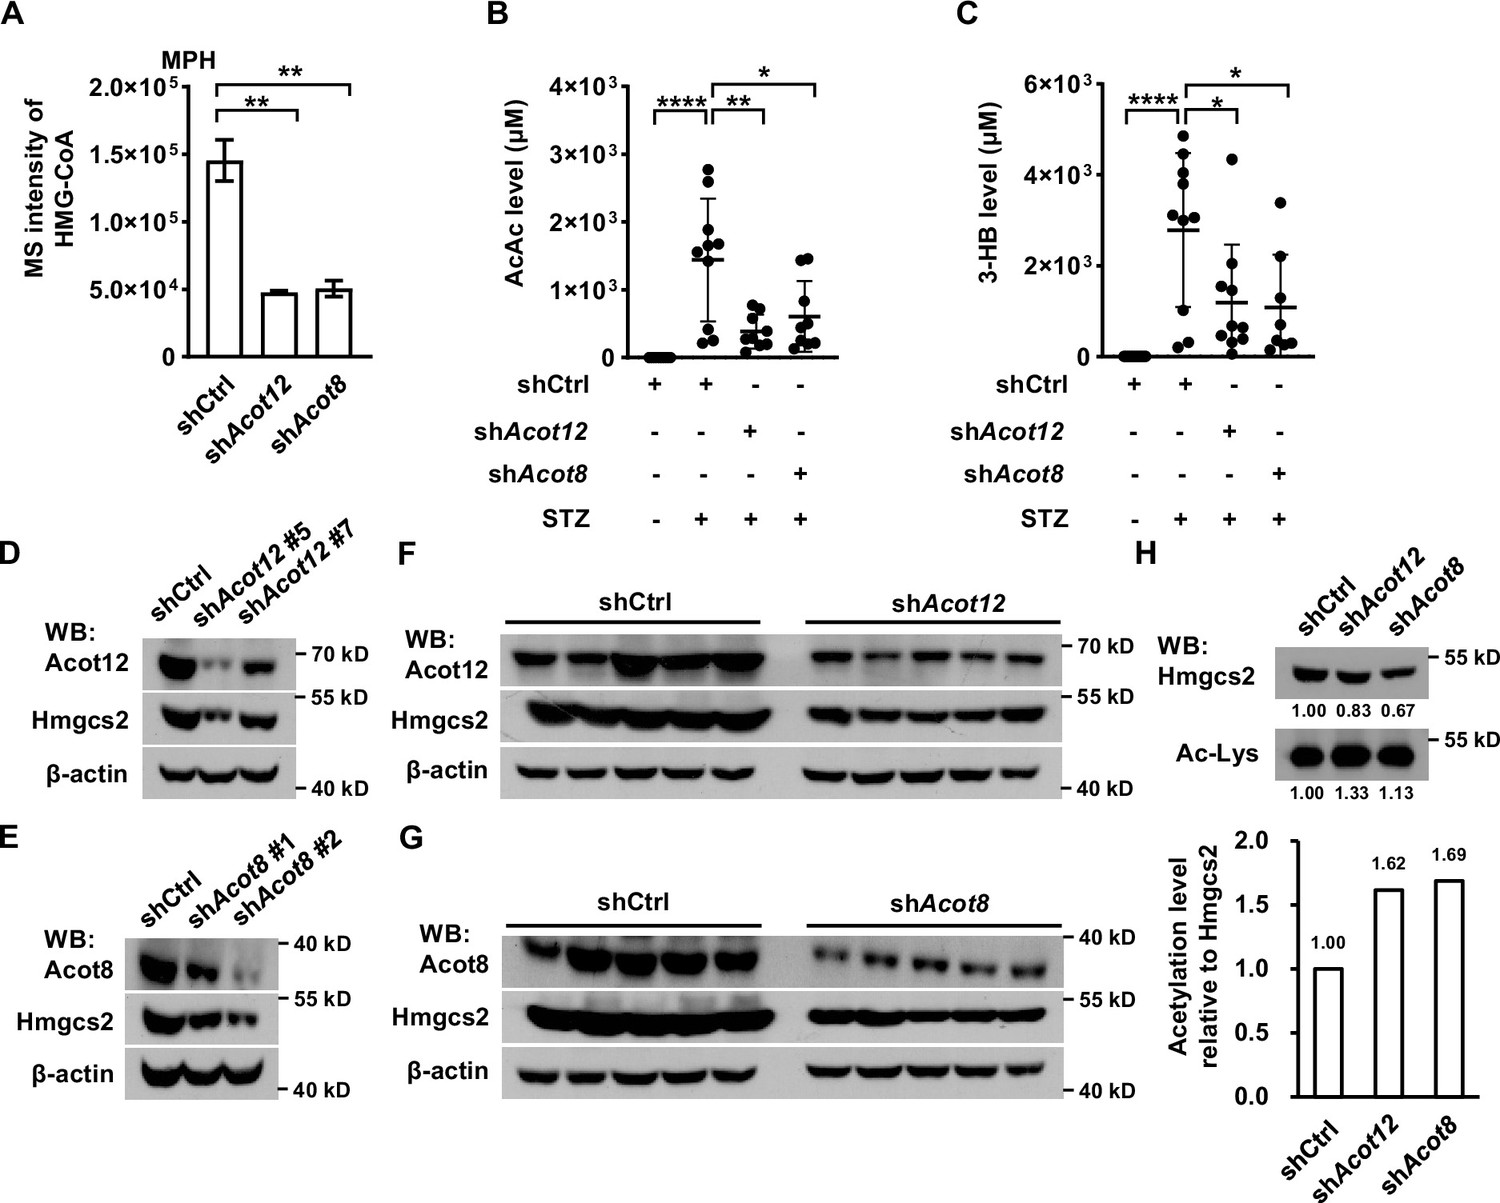
ACOT12 and ACOT8 are required for the production of ketone bodies in streptozotocin (STZ)-induced diabetes.
(A) Relative abundance (M + 0) of HMG-CoA in mouse primary hepatocytes (MPHs) knocked down for Acot12 or Acot8 (n = 3). (B, C) Serum levels of acetoacetate (AcAc) (B) and 3-hydroxybutyrate (3-HB) (C) in STZ-induced diabetic C57BL/6 mice with adenovirus-mediated knockdown of Acot12 or Acot8 in the liver. (D, E) The protein levels of Hmgcs2 in MPHs knocked down for Acot12 (D) and Acot8 (E). (F, G) Acot12 (F) and Acot8 (G) in mice (C57BL/6) liver were knocked down by adenovirus-based shRNA, before Hmgcs2 protein was detected by Western Blot. (H) Western Blot (upper panel) and evaluation of the relative acetylation (Ac-Lys) level by calculating the ratio of acetylated Hmgcs2 relative to Hmgcs2 (lower panel). Abbreviations: HMG-CoA, 3-hydroxy-3-methylglutaryl-CoA; Hmgcs2, 3-hydroxy-3-methylglutaryl-CoA synthase 2. Results are expressed as the mean ± standard deviation (SD) of three independent experiments in (A) and n = 10 mice per group in (B, C), and were analyzed by using unpaired Student’s t-tests (*p < 0.05, **p < 0.01, ****p < 0.0001, n.s., no significant difference).
-
Figure 7—source data 1
Complete, unedited immunoblots, as well as immunoblots including sample and band identification, are provided for the immunoblots presented in Figure 7.
- https://cdn.elifesciences.org/articles/87419/elife-87419-fig7-data1-v1.zip
Figure 8 with 2 supplements
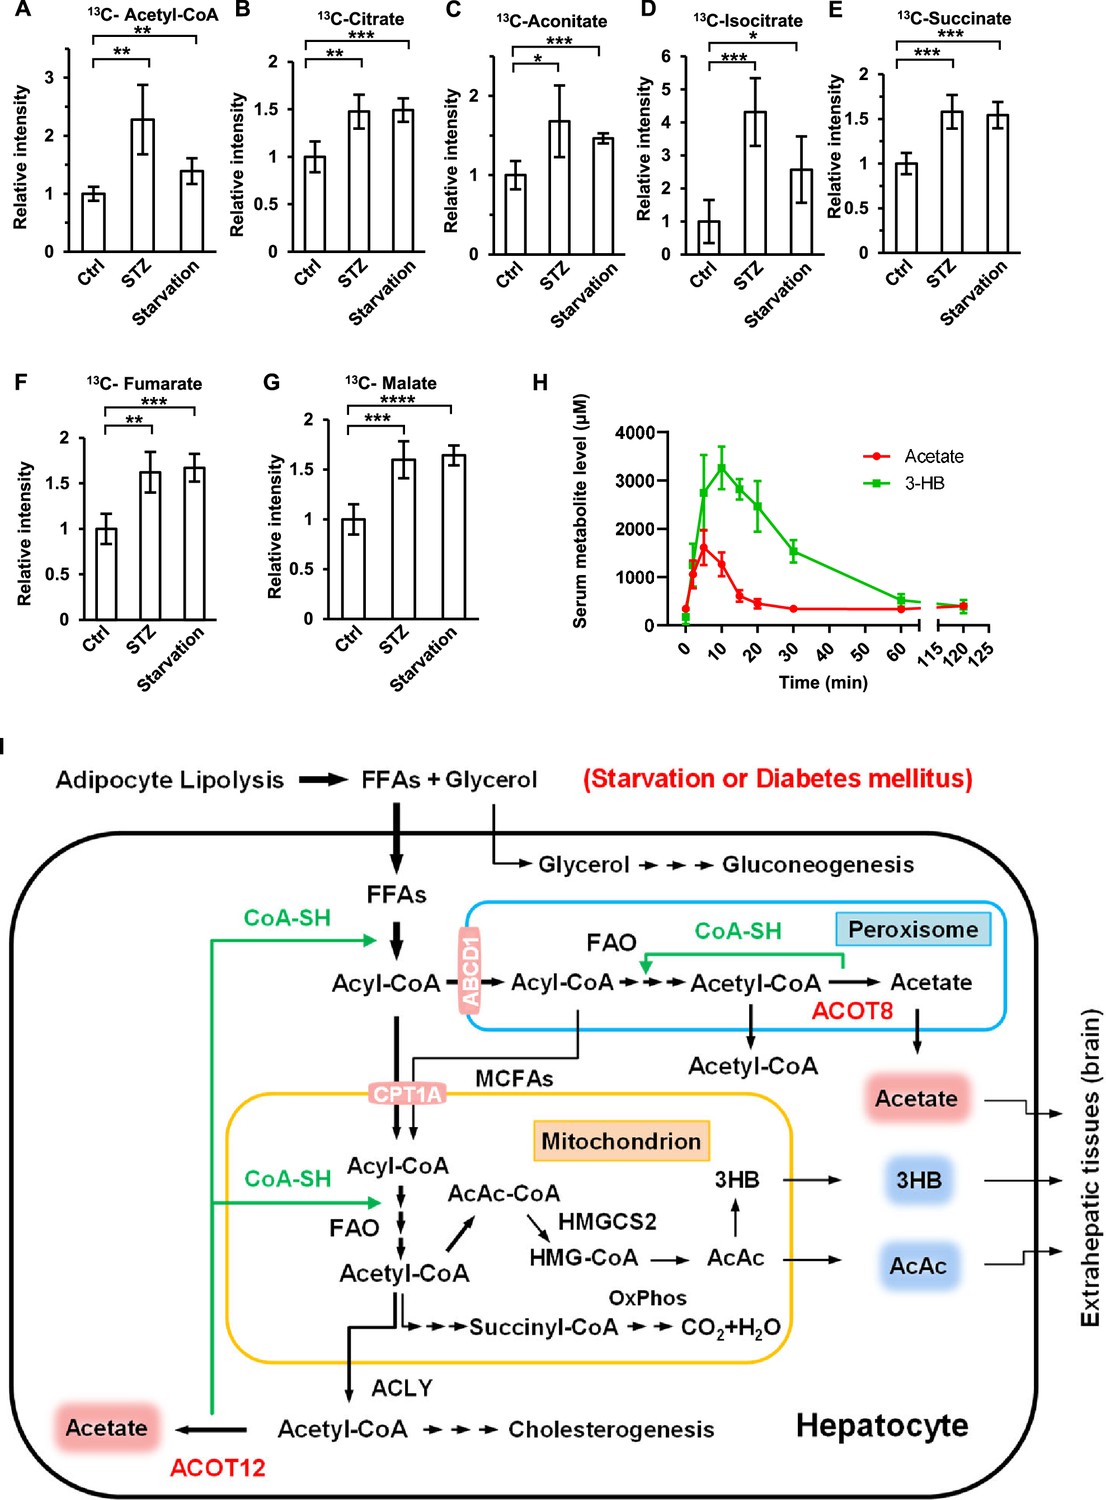
Brain exhibits increased acetate consumption during energy stress.
(A–G) Relative abundances (M + 1) of 13C-acetyl-CoA (A), 13C-citrate (B), 13C-aconitate (C), 13C-isocitrate (D), 13C-succinate (E), 13C-fumarate (F), and 13C-malate (G) in the brain of starved or diabetic mice (C57BL/6) were determined 1 hr after intraperitoneal injection of 2-13C-acetate (310 mg/kg). (H) The abundance of acetate and 3-hydroxybutyrate (3-HB) in the serum of fasting mice (C57BL/6) after intraperitoneal injection (acetate 300 mg/kg, 3-HB 520 mg/kg). (I) A working model describing the biological significance of ACOT12- and ACOT8-catalized conversion of acetyl-CoA to acetate and CoA. Under energy stress conditions, such as in diabetes mellitus and after prolonged starvation, at least two advantages are obtained by converting acetyl-CoA to acetate and CoA: (1) CoA is required for sustained fatty acid oxidation (FAO) and for the production of ketone bodies in the liver; (2) acetate serves as a novel ketone body to fuel extrahepatic tissues, particularly the brain. Values in (A–H) are expressed as the mean ± standard deviation (SD) (n = 5 mice per group in A–G and n = 7 mice per group in H) and were analyzed statistically by employing unpaired Student’s t-tests (*p < 0.05, **p < 0.01, ***p < 0.001, ****p < 0.0001, n.s., no significant difference).
Figure 8—figure supplement 1
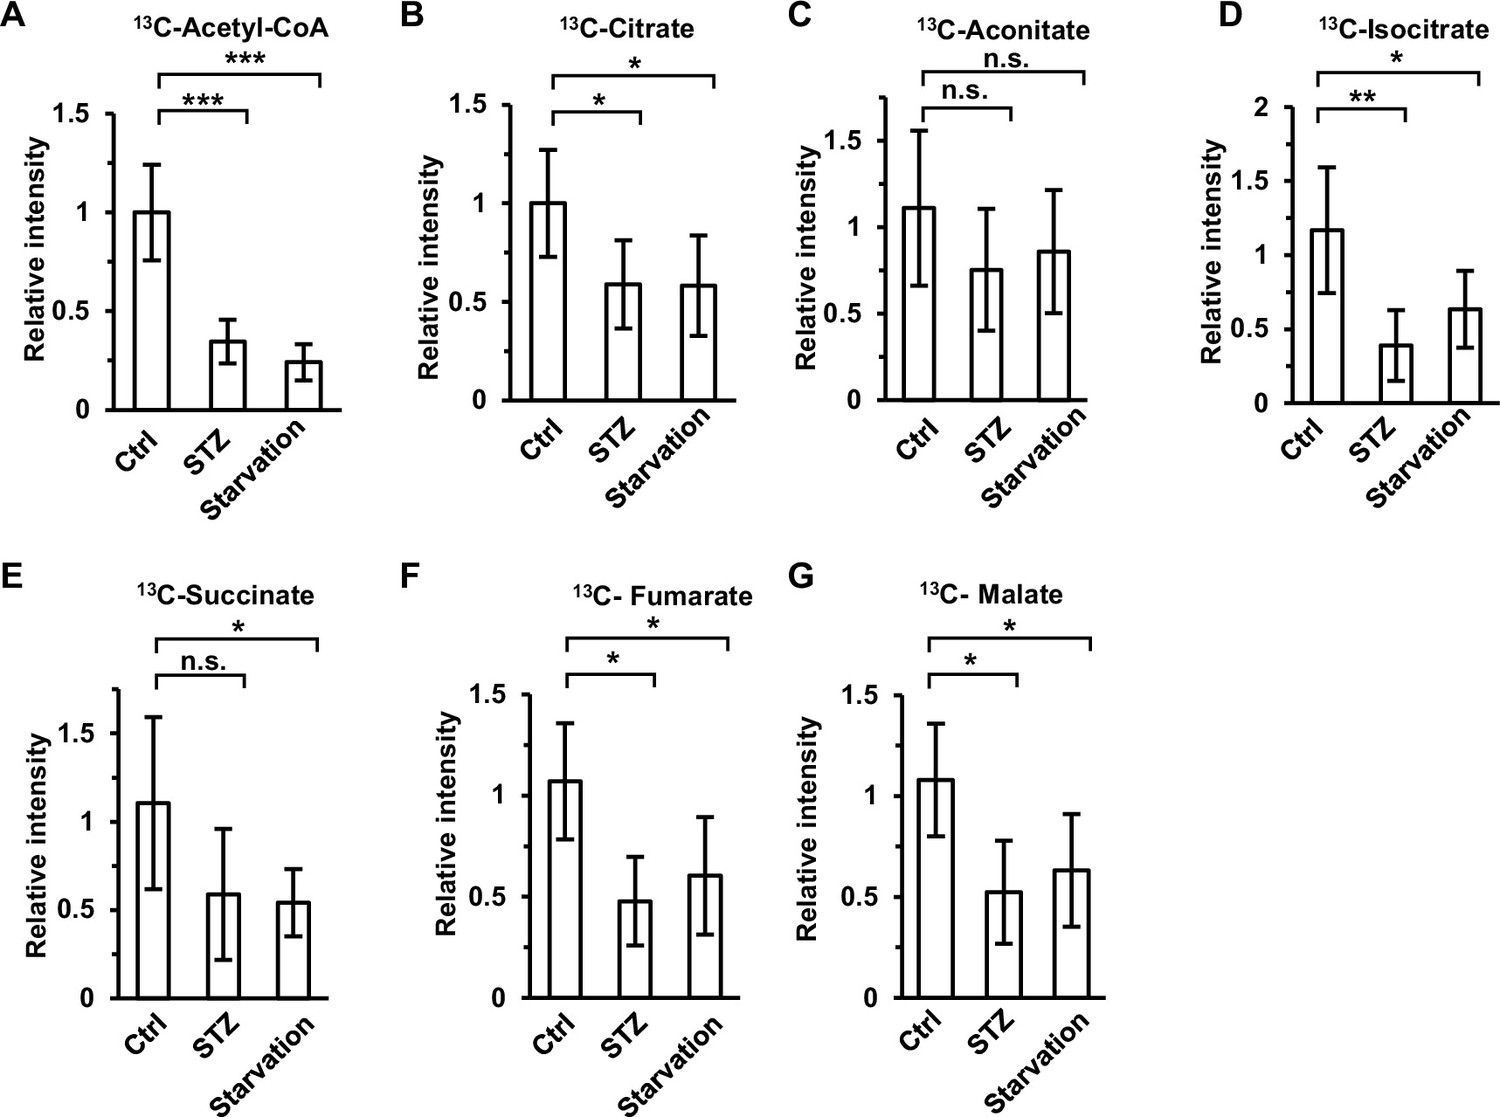
Accumulation of acetate derivatives in muscle is retarded under energy stress.
Relative abundances (M + 1) of 13C-acetyl-CoA (A), 13C-citrate (B), 13C-aconitate (C), 13C-isocitrate (D), 13C-succinate (E), 13C-fumarate (F), and 13C-malate (G) in the muscle of diabetic and starved mice (C57BL/6) were determined 1 hr after intraperitoneal injection of 2-13C-acetate (310 mg/kg). Values are expressed as the mean ± standard deviation (SD) of 5 mice per group. Results were analyzed statistically by employing unpaired Student’s t-tests (*p < 0.05, **p < 0.01, ***p < 0.001, n.s., no significant difference).
Figure 8—figure supplement 2
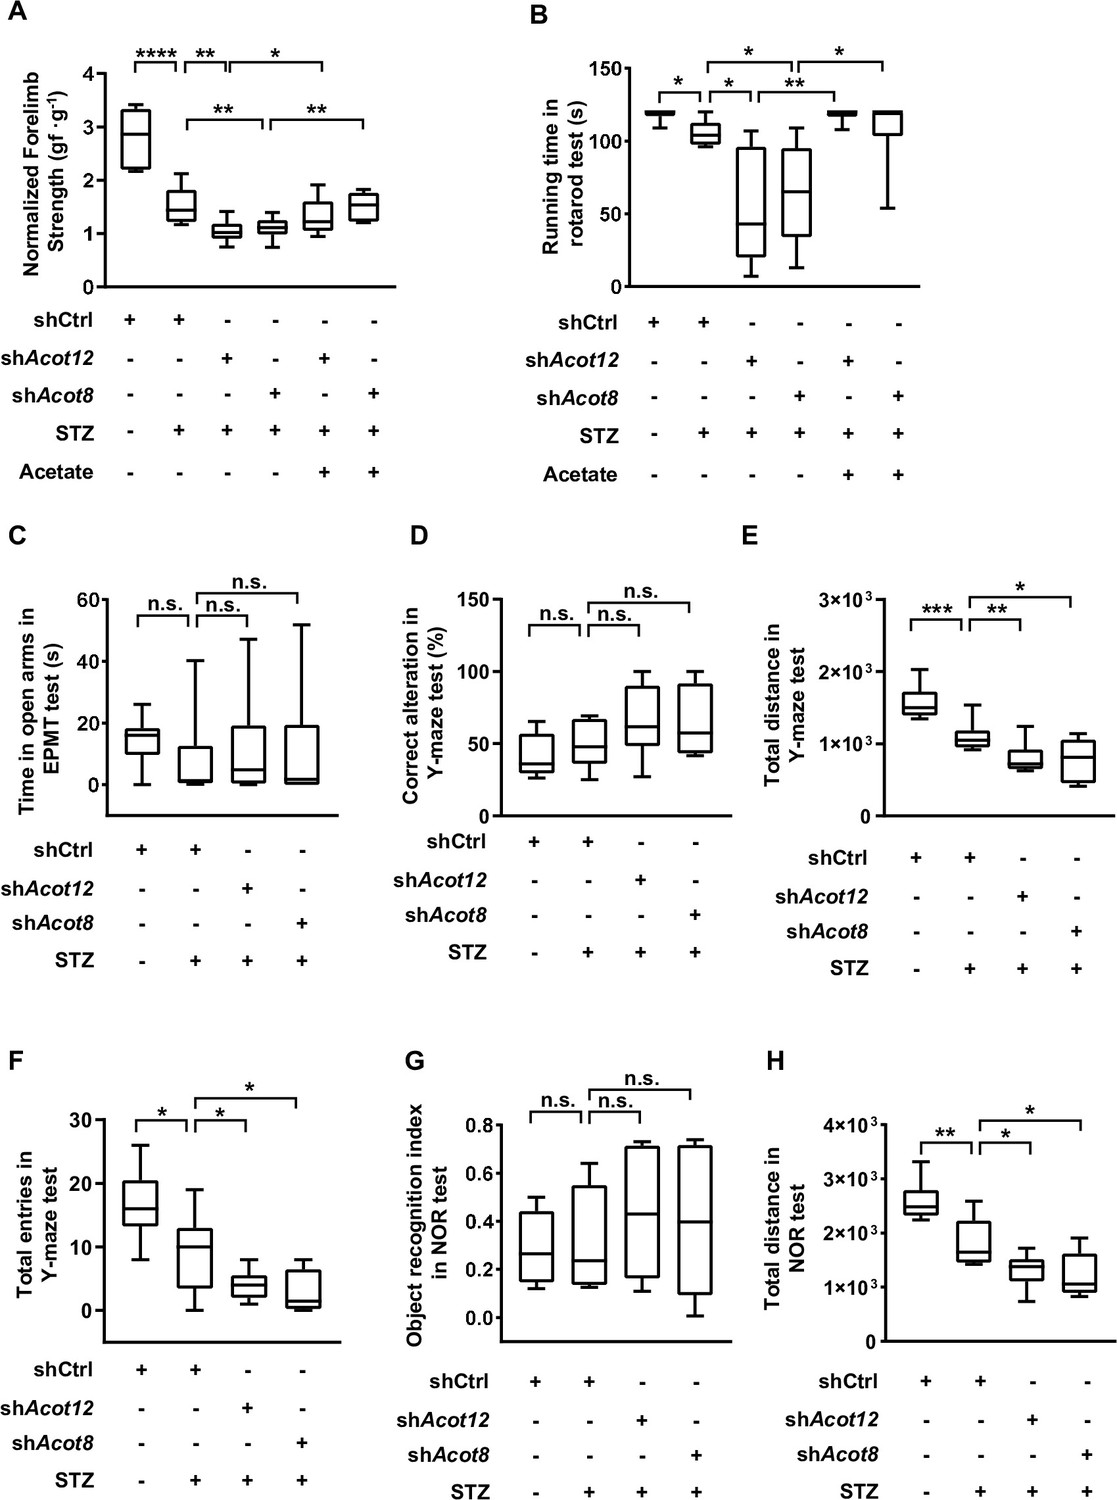
Analyses of the behavior of diabetic mice with KD of ACOT12 or ACOT8.
(A, B) Normalized forelimb strength in the forelimb grip force test (A) and total running time in the rotarod test (B) were determined in streptozotocin (STZ)-induced diabetic C57BL/6 mice, which were knocked down for Acot12 or Acot8 in the liver and injected intraperitoneally with acetate (300 mg/kg) or with control. (C) Total time spent in the open arms during the elevated plus maze test of the diabetic C57BL/6 mice w/wo adenovirus-mediated knockdown of Acot12 or Acot8 in the liver. (D–F) The percentage of correct alterations (D), total distance moved (E), and total number of entries into each arm (F) in the Y-maze test (same mice as in C). (G, H) The novel object preference index (G) and total distance traveled (H) in the novel object recognition (NOR) test (same mice as in C). Results in (A–H) are expressed as box plots (box extending from the 25th to the 75th percentiles, with whiskers indicating the minimum and maximum and lines in the boxes indicating the median) of n = 10 mice per group, and were analyzed using unpaired Student’s t-tests (*p < 0.05, **p < 0.01, ***p < 0.001, ****p < 0.0001, n.s., no significant difference).
Tables
Appendix 1—key resources table
| Reagent type (species) or resource | Designation | Source or reference | Identifiers | Additional information |
|---|---|---|---|---|
| Gene (Homo-sapiens) | ACOT1 | Core Facility of Biomedical Sciences, Xiamen University | Gene ID: 25082 | |
| Gene (Homo-sapiens) | ACOT2 | Core Facility of Biomedical Sciences, Xiamen University | Gene ID: 15824 | |
| Gene (Homo-sapiens) | ACOT4 | Core Facility of Biomedical Sciences, Xiamen University | Gene ID: 9637 | |
| Gene (Homo-sapiens) | ACOT8 | Core Facility of Biomedical Sciences, Xiamen University | Gene ID: 24012 | |
| Gene (Homo-sapiens) | ACOT9 | Core Facility of Biomedical Sciences, Xiamen University | Gene ID: 17595 | |
| Gene (Homo-sapiens) | ACOT11 | Core Facility of Biomedical Sciences, Xiamen University | Gene ID: 10617 | |
| Gene (Homo-sapiens) | ACOT12 | Core Facility of Biomedical Sciences, Xiamen University | Gene ID: 134526 | |
| Cell line (Homo-sapiens) | HeLa | Our laboratory cells bank | Cell line maintained in our laboratory cells bank | |
| Cell line (Homo-sapiens) | HEK-293T | Our laboratory cells bank | Cell line maintained in our laboratory cells bank | |
| Cell line (Homo-sapiens) | HT1080 | Our laboratory cells bank | Cell line maintained in our laboratory cells bank | |
| Cell line (Homo-sapiens) | Huh7 | Our laboratory cells bank | Cell line maintained in our laboratory cells bank | |
| Cell line (Homo-sapiens) | LO2 | Our laboratory cells bank | Cell line maintained in our laboratory cells bank | |
| Cell line (Homo-sapiens) | H3255 | Our laboratory cells bank | Cell line maintained in our laboratory cells bank | |
| Cell line (Homo-sapiens) | A549 | Our laboratory cells bank | Cell line maintained in our laboratory cells bank | |
| Cell line (Homo-sapiens) | QBI-293A | Our laboratory cells bank | Cell line maintained in our laboratory cells bank | |
| Cell line (Homo-sapiens) | HEB | Our laboratory cells bank | Cell line maintained in our laboratory cells bank | |
| Cell line (Homo-sapiens) | HCT116 | Cell Bank of the Chinese Academy of Sciences (Shanghai) | Cell line maintained in Cell Bank of the Chinese Academy of Sciences (Shanghai) | |
| Cell line (Homo-sapiens) | 786-O | Cell Bank of the Chinese Academy of Sciences (Shanghai) | Cell line maintained in Cell Bank of the Chinese Academy of Sciences (Shanghai) | |
| Cell line (Homo-sapiens) | HepG2 | Cell Bank of the Chinese Academy of Sciences (Shanghai) | Cell line maintained in Cell Bank of the Chinese Academy of Sciences (Shanghai) | |
| Cell line (mouse) | Hepa1-6 | Cell Bank of the Chinese Academy of Sciences (Shanghai) | Cell line maintained in Cell Bank of the Chinese Academy of Sciences (Shanghai) | |
| Cell line (mouse) | AML12 | Cell Bank of the Chinese Academy of Sciences (Shanghai) | Cell line maintained in Cell Bank of the Chinese Academy of Sciences (Shanghai) | |
| Transfected construct (human) | ACLY shRNA-#1 | This paper | Lentiviral construct to transfect and express the shRNA; Targeting sequence: GCAGCAGACCTATGACTATGC | |
| Transfected construct (human) | ACLY shRNA-#2 | This paper | Lentiviral construct to transfect and express the shRNA; Targeting sequence: GCATCGCAAACTTCACCAACG | |
| Transfected construct (human) | ACLY shRNA-#3 | This paper | Lentiviral construct to transfect and express the shRNA; Targeting sequence: GCACGAAGTCACAATCTTTGT | |
| Transfected construct (human) | ACLY shRNA-#4 | This paper | Lentiviral construct to transfect and express the shRNA; Targeting sequence: GCAAGGCATGCTGGACTTTGA | |
| Transfected construct (human) | CPT1A shRNA-#3 | This paper | Lentiviral construct to transfect and express the shRNA; Targeting sequence: TACAGTCGGTGAGGCCTCTTATGAA | |
| Transfected construct (human) | CPT1A shRNA-#4 | This paper | Lentiviral construct to transfect and express the shRNA; Targeting sequence: GGACCAAGATTACAGTGGTATTTGA | |
| Transfected construct (human) | ABCD1 shRNA-#1 | This paper | Lentiviral construct to transfect and express the shRNA; Targeting sequence: GCAGATCAACCTCATCCTTCT | |
| Transfected construct (human) | ACOT12 shRNA-#1 | This paper | Lentiviral construct to transfect and express the shRNA; Targeting sequence: GCTAGAGTTGGACAAGTTATA | |
| Transfected construct (human) | ACOT12 shRNA-#2 | This paper | Lentiviral construct to transfect and express the shRNA; Targeting sequence: CAAATACCAGTGATTTGGATTAGCA | |
| Transfected construct (mouse) | Acot12 shRNA-#5 | This paper | Lentiviral construct to transfect and express the shRNA; Targeting sequence: GCATGGAGATCAGTATCAAGG | |
| Transfected construct (mouse) | Acot12 shRNA-#6 | This paper | Lentiviral construct to transfect and express the shRNA; Targeting sequence: GCAGGTTCAGCGATTCCATTT | |
| Transfected construct (mouse) | Acot12 shRNA-#7 | This paper | Lentiviral construct to transfect and express the shRNA; Targeting sequence: GCGAGGACGATCAGATATATT | |
| Transfected construct (human) | ACOT8 shRNA-#1 | This paper | Lentiviral construct to transfect and express the shRNA; Targeting sequence: GAGGATCTCTTCAGAGGAAGG | |
| Transfected construct (human) | ACOT8 shRNA-#2 | This paper | Lentiviral construct to transfect and express the shRNA; Targeting sequence: GCAGCCAAGTCTGTGAGTGAA | |
| Transfected construct (mouse) | Acot8 shRNA-#1 | This paper | Lentiviral construct to transfect and express the shRNA; Targeting sequence: GGGACCCTAACCTTCACAAGA | |
| Transfected construct (mouse) | Acot8 shRNA-#2 | This paper | Lentiviral construct to transfect and express the shRNA; Targeting sequence: GCTGTGTGGCTGCTTATATCT | |
| Antibody | anti-Flag (mouse monoclonal) | Sigma | Cat#F1804 RRID:AB_262044 | IF (1:200) WB (1:2000) |
| Antibody | anti-ACOT12 (rabbit polyclonal) | Abbkine | Cat#ABP53776 | WB (1:500) |
| Antibody | anti-ACOT8 (rabbit polyclonal) | Abbkine | Cat#ABP50586 | WB (1:500) |
| Antibody | anti-HMGCS2 (rabbit polyclonal) | ABclonal | Cat#A14244 RRID:AB_2761104 | WB (1:1000) |
| Antibody | anti-ABCD1 (rabbit polyclonal) | Abbkine | Cat#ABP54187 | WB (1:1000) |
| Antibody | anti-β-actin (mouse monoclonal) | Proteintech | Cat#60008-1-Ig RRID:AB_2289225 | WB (1:2000) |
| Antibody | anti-ACLY (rabbit polyclonal) | Proteintech | Cat#15421-1-AP RRID:AB_2223741 | WB (1:500) |
| Antibody | anti-CPT1A (rabbit polyclonal) | Proteintech | Cat#15184-1-AP RRID:AB_2084676 | WB (1:500) |
| Antibody | anti-catalase (mouse monoclonal) | Proteintech | Cat#66765-1-Ig RRID:AB_2882111 | IF (1:100) |
| Antibody | anti-TOMM40 (mouse monoclonal) | Proteintech | Cat#66658-1-Ig RRID:AB_2882015 | WB (1:2000) |
| Antibody | anti-LAMP2 (mouse monoclonal) | Proteintech | Cat#66301-1-Ig RRID:AB_2881684 | WB (1:2000) |
| Antibody | anti-GAPDH (rabbit monoclonal) | Proteintech | Cat#60004-1-Ig RRID:AB_2107436 | IF (1:100) WB (1:2000) |
| Antibody | Acetylated-lysine antibody (rabbit polyclonal) | Cell Signaling Technology | Cat#9441S RRID:AB_331805 | WB (1:1000) |
| Antibody | HRP-conjugated goat anti-mouse IgG antibody | Thermo Fisher | Cat#A16072SAM PLE | WB (1:5000) |
| Antibody | HRP-conjugated goat anti-rabbit IgG antibody | Thermo Fisher | Cat#A16104SAM PLE | WB (1:5000) |
| Commercial assay or kit | Peroxisome Isolation kit | Sigma | PEROX1-1KT | |
| Commercial assay or kit | PCR-based Mycoplasma Detection Kit | Sigma | MP0035-1KT | |
| Chemical compound, drug | Streptozotocin | Sangon Biotech | Cat#A610130-0100 | |
| Chemical compound, drug | Ampicillin | Sangon Biotech | Cat#A610028-0025 | |
| Chemical compound, drug | Streptomycin | Sangon Biotech | Cat#A610494-0250 | |
| Chemical compound, drug | Tetradecanoic acid | Sangon Biotech | Cat#A600931-0250 | |
| Chemical compound, drug | Sodium stearate | Sangon Biotech | Cat#A600888-0100 | |
| Chemical compound, drug | Colistin | Yuanye Bio-Technology | Cat#1264-72-8 | |
| Chemical compound, drug | Deuterated water (D2O) | Qingdao Tenglong Weibo Technology | Cat#DFSA180309 G100 | |
| Chemical compound, drug | Sodium 3-(trimethylsilyl) propionate-2,2,3,3-d4 (TSP) | Qingdao Tenglong Weibo Technology | Cat#DLM-48–5 | |
| Chemical compound, drug | Etomoxir | MedChemExpress (MCE) | Cat#828934-41-4 | |
| Chemical compound, drug | Sodium palmitate | Sigma | Cat#P9767-10G | |
| Chemical compound, drug | Sodium acetate | Sigma | Cat#791741-100G | |
| Chemical compound, drug | Sodium 3-hydroxybutyrate | Sigma | Cat#54965-10G-F | |
| Chemical compound, drug | U-13C-palmitate | Cambridge Isotope Laboratories | Cat#CLM-6059–1 | |
| Chemical compound, drug | U-13C-glucose | Cambridge Isotope Laboratories | Cat#CLM-1396-1 | |
| Chemical compound, drug | U-13C-glutamine | Cambridge Isotope Laboratories | Cat#CLM-1822-H-0.1 | |
| Chemical compound, drug | U-13C-acetate | Cambridge Isotope Laboratories | Cat#CLM-440-1 | |
| Chemical compound, drug | 2-13C-acetate | Cambridge Isotope Laboratories | Cat#CLM-381-5 | |
| Chemical compound, drug | DAPI stain | Sigma | D9542 | |
| Software, algorithm | R | R-studio | R (version 3.6.3) |
Additional files
Download links
A two-part list of links to download the article, or parts of the article, in various formats.
Downloads (link to download the article as PDF)
Open citations (links to open the citations from this article in various online reference manager services)
Cite this article (links to download the citations from this article in formats compatible with various reference manager tools)
Hepatic conversion of acetyl-CoA to acetate plays crucial roles in energy stress
eLife 12:RP87419.
https://doi.org/10.7554/eLife.87419.3


