Plasma extracellular vesicle synaptic proteins as biomarkers of clinical progression in patients with Parkinson’s disease
- Department of Neurology, Shuang Ho Hospital, Taipei Medical University-Shuang Ho Hospital, Taiwan
- Department of Neurology, School of Medicine, College of Medicine Taipei Medical University-Shuang Ho Hospital, Taiwan
- Taipei Neuroscience Institute, Taipei Medical University, Taiwan
- Division of Psychiatry, University College London, United Kingdom
Figures
Figure 1
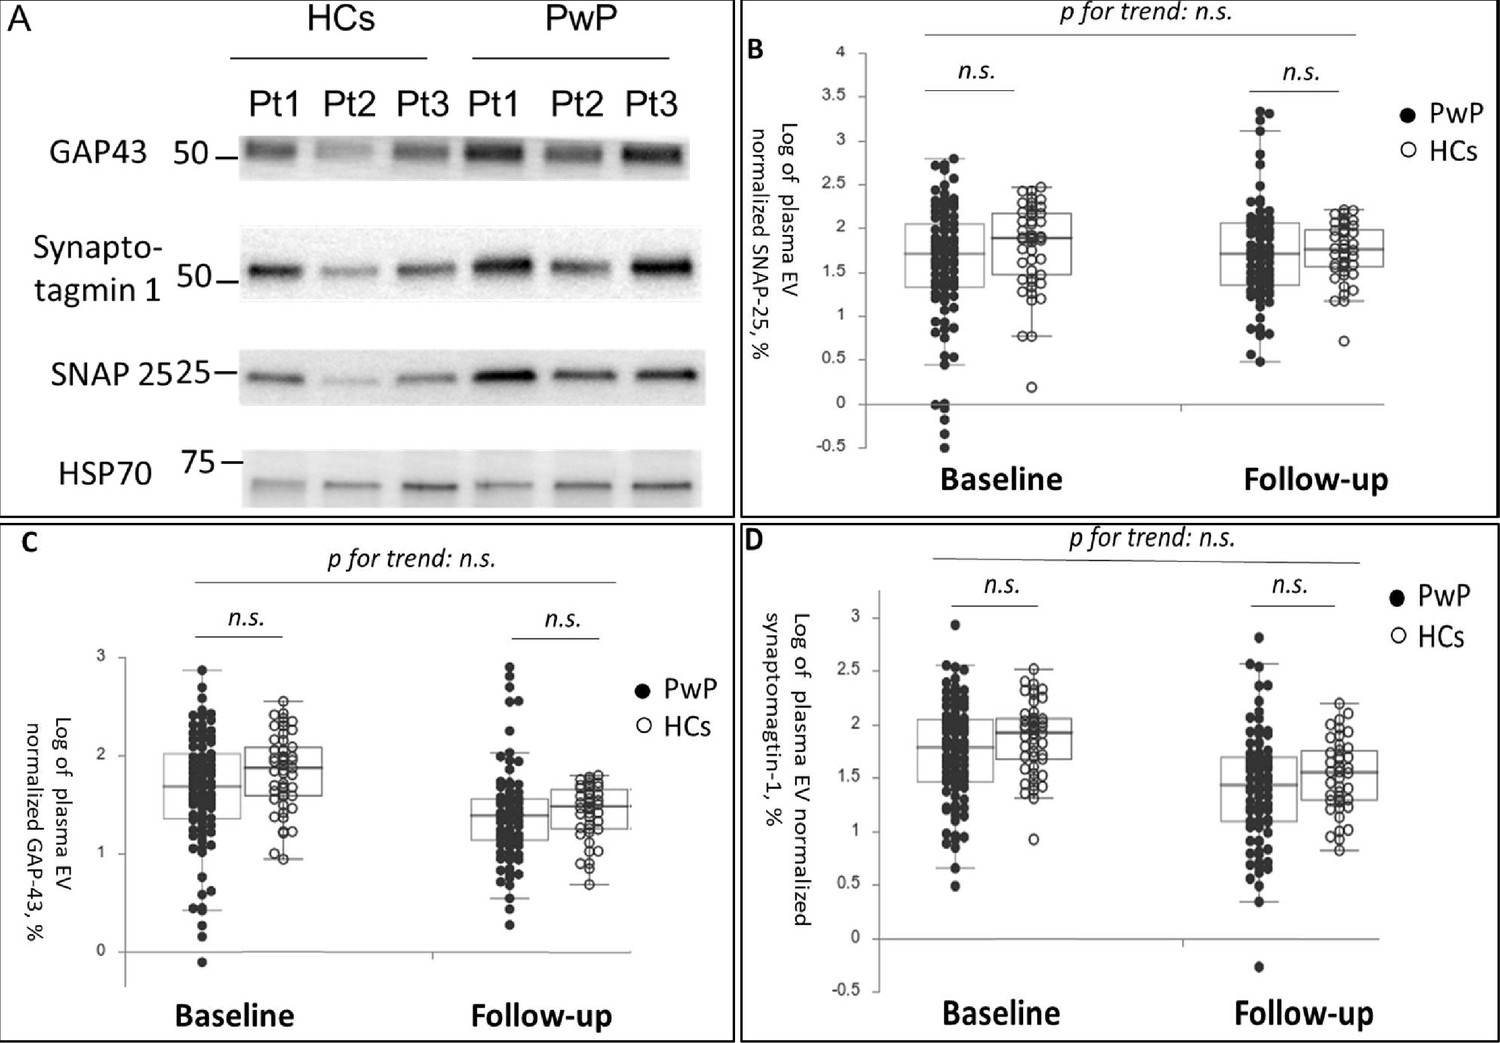
Baseline and follow-up synaptic protein levels in plasma extracellular vesicles (EVs) between patients with Parkinson’s disease (PwP) and healthy controls (HCs).
(A) Representative protein blot images of different synaptic proteins, including SNAP-25, GAP-43, and synaptotagmin-1. Heat shock protein 70 (HSP-70) was the protein loading control. (B–D) Comparison of plasma SNAP-25, GAP-43, and synaptotagmin-1 levels between PwP and HCs at baseline and follow-up. Data are presented using a dot plot displaying the median and first and third quartile values. n.s., nonsignificant.
-
Figure 1—source data 1
The original blot image of the representative GAP-43 (A), synaptotagmin-1 (B), SNAP-25 (C), and HSP-70 (D).
- https://cdn.elifesciences.org/articles/87501/elife-87501-fig1-data1-v1.pdf
Figure 2
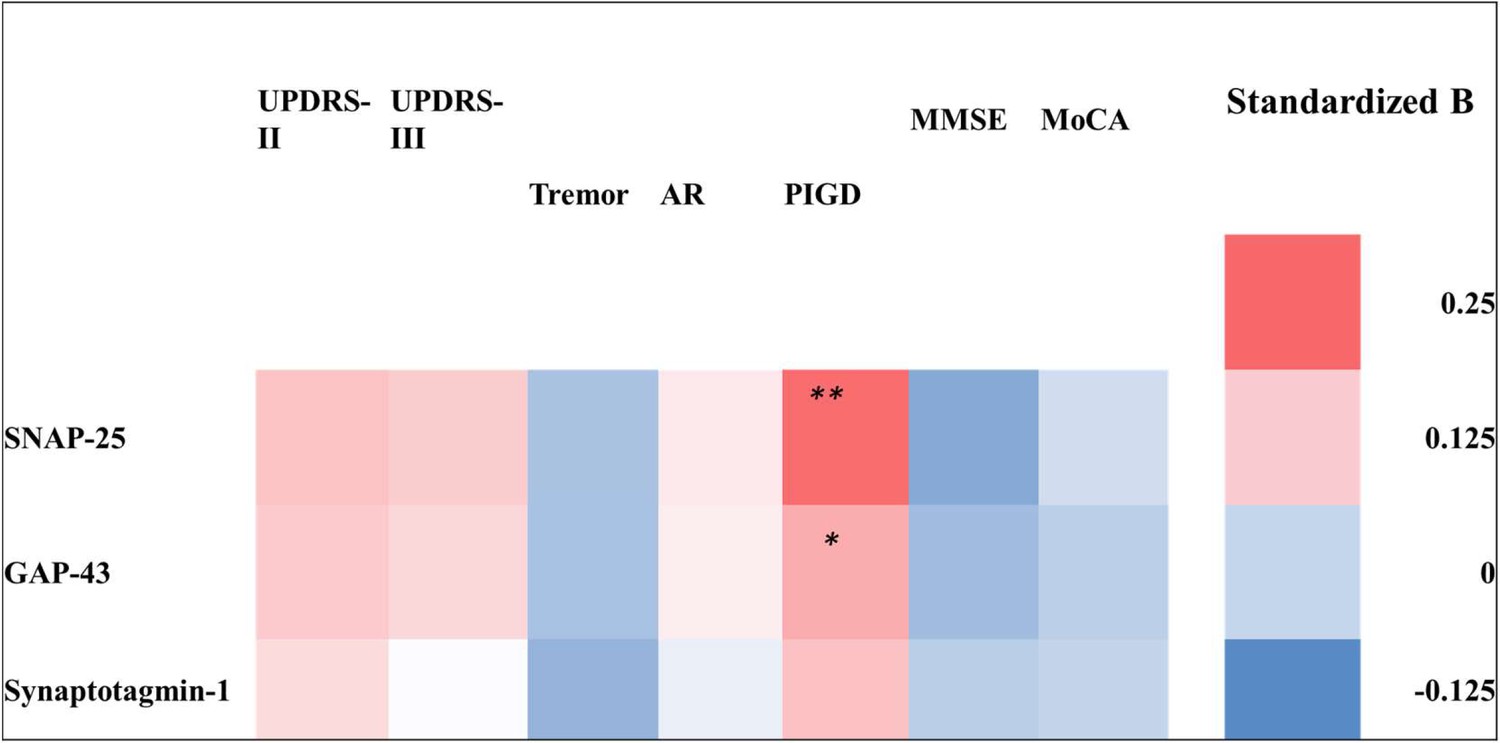
Heatmap of the association between baseline plasma extracellular vesicle (EV) synaptic protein levels and clinical assessment parameters at follow-up in patients with Parkinson’s disease (PwP).
The logistic regression model was used to assess the baseline plasma EV SNAP-25, GAP-43, and synaptotagmin-1 levels. The motor symptoms were assessed based on the Unified Parkinson’s Disease Rating Scale (UPDRS)-II and UPDRS-III scores and tremor, akinetic rigidity (AR), and postural instability and gait disturbance (PIGD) subscores, and cognitive function was assessed using the Mini-Mental State Examination (MMSE) and Montreal Cognitive Assessment (MoCA) scores. The association is presented using standardized β values. Detailed results of the regression model are provided in Supplementary file 1. *p<0.05; **p<0.01.
Figure 3
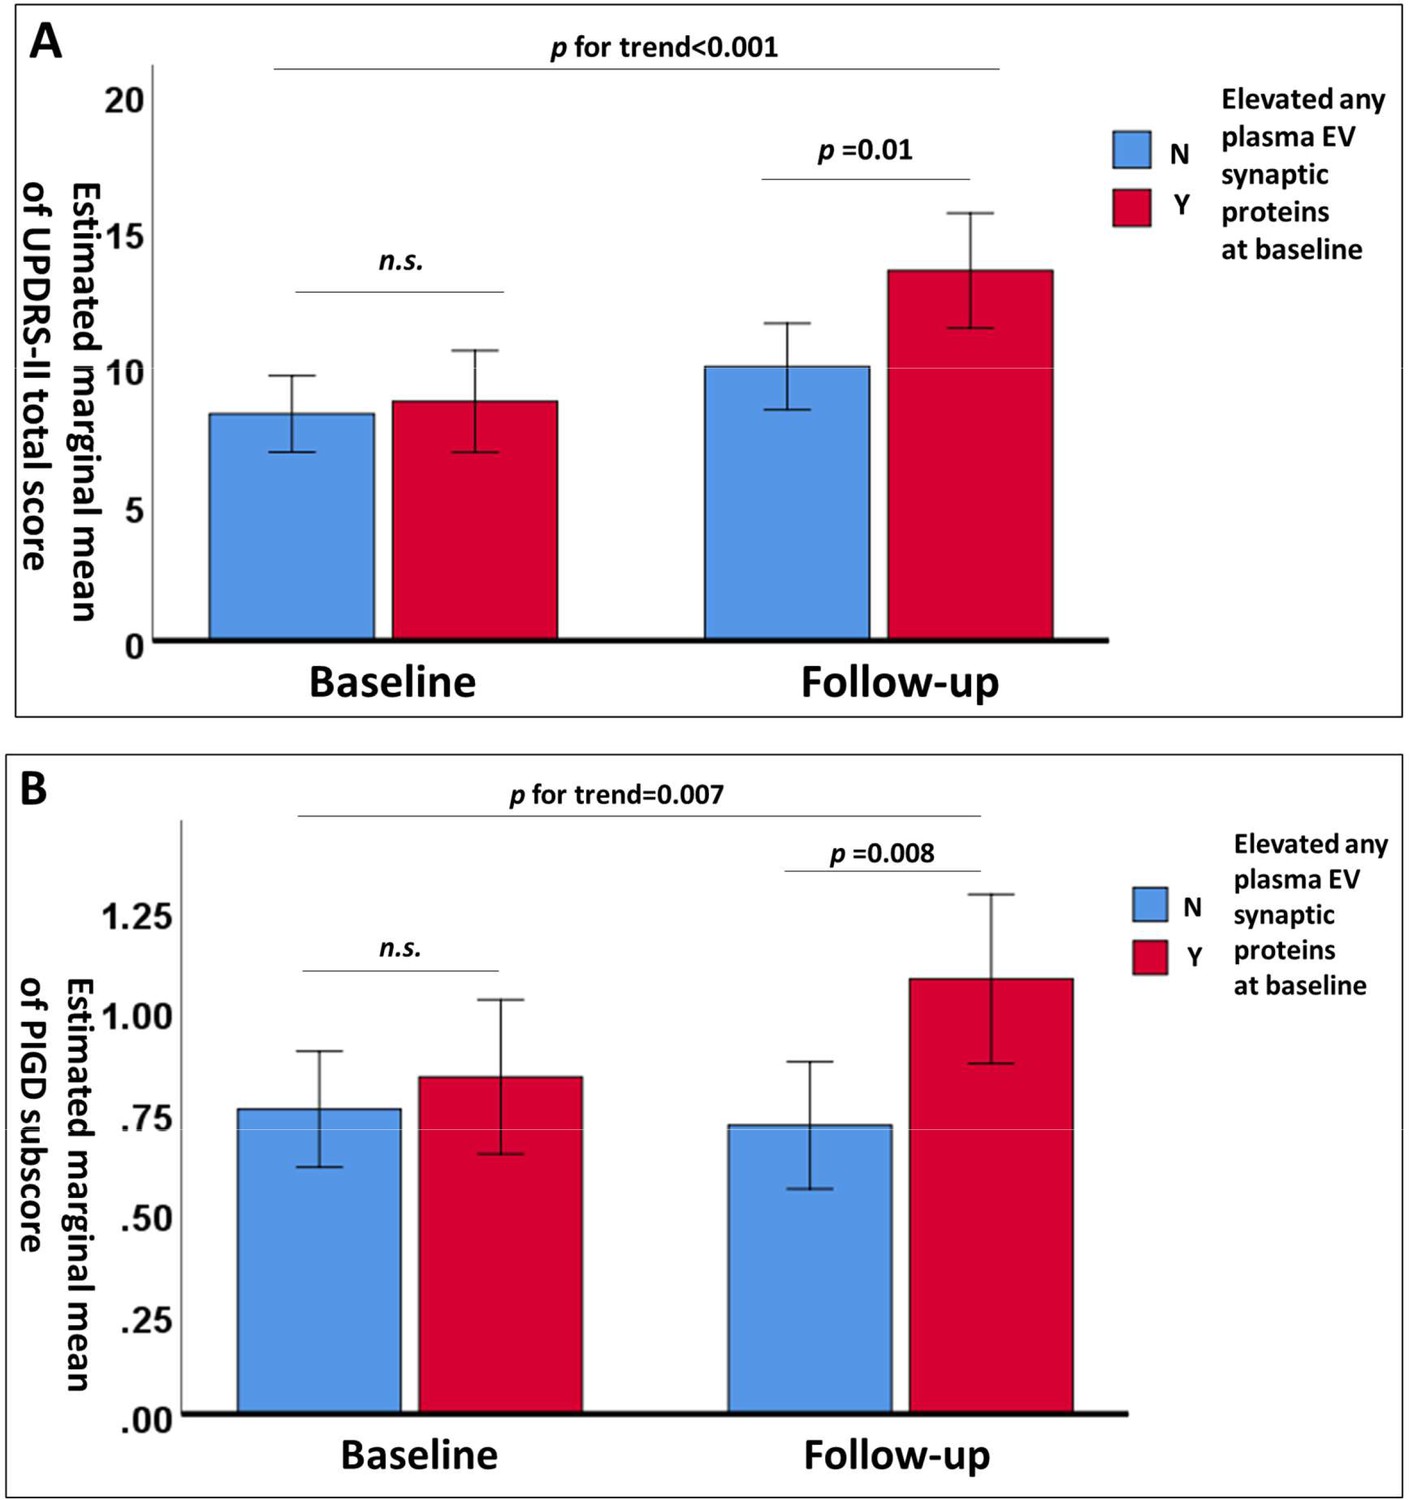
Changes in estimated marginal means of Unified Parkinson’s Disease Rating Scale (UPDRS)-II total scores.
(A) and postural instability and gait disturbance (PIGD) subscores (B) after adjustment for age, sex, and disease duration in patients with Parkinson’s disease (PwP) with (n=36) and without (n=66) elevated levels of any one plasma extracellular vesicle synaptic protein (first quartile) at baseline and follow-up. Data are presented as means with 95% confidence intervals. n.s., nonsignificant.
Tables
Table 1
Demographic data of study participants.
| HCs (n = 43) | PwP (n = 101) | |
|---|---|---|
| Age (y) | 65 (10.24) | 69 (7.76) |
| Women | 15 | 48 |
| Baseline | ||
| MMSE | 27 (3.92) | 26 (4.15) |
| MoCA | 23 (4.63) | 21 (5.70) |
| Disease duration (y) | - | 2 (2.24) |
| UPDRS-II | - | 8 (5.58) |
| UPDRS-III | - | 22 (9.30) |
| 1-year follow-up | ||
| MMSE | 28 (4.12) | 27 (5.61) |
| MoCA | 24 (5.82) | 23 (6.45) |
| UPDRS-II | - | 11 (6.41) |
| UPDRS-III | - | 19 (9.39) |
-
Data is presented as median (standard deviation).
-
HC = healthy control; PwP = people with Parkinson’s disease; MMSE = Mini-Mental State Examination; MoCA = Montreal Cognitive Assessment; UPDRS = Unified Parkinson’s Disease Rating Scale.
Table 2
The association between the change in plasma EV synaptic protein abundance (between baseline and follow-up) with the change in clinical severity in motor and cognitive domains (between baseline and follow-up) in people with Parkinson’s disease.
A generalized linear model was employed, and the data is presented as coefficient (p-value).
| UPDRS-II | UPDRS-III | Tremor | AR | PIGD | MMSE | MoCA | |
|---|---|---|---|---|---|---|---|
| SNAP-25 * follow-up | 0.218 (0.049) | 0.312 (0.076) | 0.004 (0.432) | 0.016 (0.066) | 0.009 (0.440) | –0.007 (0.932) | 0.048 (0.647) |
| GAP-43 * follow-up | 0.984 (0.031) | 1.711 (0.018) | 0.001 (0.972) | 0.089 (0.011) | 0.073 (0.115) | –0.099 (0.767) | –0.054 (0.901) |
| Synaptomagtin-1 * follow-up | 1.543 (0.012) | 2.205 (0.024) | 0.007 (0.815) | 0.107 (0.023) | 0.109 (0.080) | –0.361 (0.421) | –0.260 (0.661) |
-
UPDRS = Unified Parkinson's Disease Rating Scale; AR = akinetic rigidity; PIGD = postural instability and gait disturbance; MMSE = Mini-Mental Status Examination; MoCA = Montreal Cognitive Assessment.
Table 3
The clinical severity in people with Parkinson’s disease with and without elevated (first quartile) baseline plasma extracellular vesicle (EV) synaptosome-associated protein 25 (SNAP-25), growth-associated protein 43 (GAP-43), and synaptotagmin-1.
p-Value indicates the inter-group comparisons for the changes.
| Plasma EV | SNAP-25 | GAP-43 | Synaptotagmin-1 | ||||||||
|---|---|---|---|---|---|---|---|---|---|---|---|
| L (n = 74) | H (n = 28) | p | L (n = 74) | H (n = 28) | p | L (n = 74) | H (n = 28) | p | |||
| UPDRS- II | Baseline | 8.26 ± 5.80 | 9.04 ± 4.90 | <0.001 | 8.53 ± 5.67 | 8.32 ± 5.33 | <0.001 | 8.46 ± 5.70 | 8.50 ± 5.24 | <0.001 | |
| Follow-up | 10.38 ± 6.11 | 13.36 ± 6.72 | 10.65 ± 6.30 | 12.64 ± 6.53 | 10.57 ± 6.25 | 12.86 ± 6.58 | |||||
| UPDRS-III | Baseline | 22.31 ± 9.54 | 23.89 ± 8.65 | 0.259 | 22.22 ± 9.66 | 24.14 ± 8.25 | 0.244 | 21.97 ± 9.37 | 24.79 ± 8.93 | 0.145 | |
| Follow-up | 20.01 ± 9.33 | 24.21 ± 8.87 | 19.96 ± 9.25 | 24.36 ± 8.99 | 20.04 ± 9.39 | 24.14 ± 8.70 | |||||
| Tremor | Baseline | 0.34 ± 0.46 | 0.46 ± 0.38 | 0.037 | 0.34 ± 0.34 | 0.46 ± 0.37 | 0.034 | 0.33 ± 0.34 | 0.47 ± 0.38 | 0.014 | |
| Follow-up | 0.27 ± 0.26 | 0.35 ± 0.32 | 0.27 ± 0.26 | 0.35 ± 0.32 | 0.28 ± 0.29 | 0.32 ± 0.22 | |||||
| AR | Baseline | 1.04 ± 0.46 | 1.09 ± 0.44 | 0.300 | 1.03 ± 0.47 | 1.11 ± 0.42 | 0.325 | 1.03 ± 0.46 | 1.13 ± 0.45 | 0.195 | |
| Follow-up | 0.96 ± 0.46 | 1.10 ± 0.42 | 0.95 ± 0.45 | 1.12 ± 0.43 | 0.96 ± 0.46 | 1.10 ± 0.42 | |||||
| PIGD | Baseline | 0.76 ± 0.61 | 0.81 ± 0.44 | 0.023 | 0.77 ± 0.60 | 0.77 ± 0.45 | 0.046 | 0.74 ± 0.56 | 0.86 ± 0.58 | 0.027 | |
| Follow-up | 0.74 ± 0.59 | 1.07 ± 0.75 | 0.78 ± 0.61 | 0.98 ± 0.74 | 0.73 ± 0.56 | 1.11 ± 0.80 | |||||
| MMSE | Baseline | 25.32 ± 4.45 | 25.29 ± 3.29 | 0.483 | 25.58 ± 4.16 | 24.61 ± 4.11 | 0.470 | 25.62 ± 3.91 | 24.50 ± 4.69 | 0.342 | |
| Follow-up | 24.78 ± 5.93 | 25.14 ± 4.64 | 25.05 ± 5.79 | 24.43 ± 5.10 | 25.23 ± 5.61 | 23.96 ± 5.50 | |||||
| MoCA | Baseline | 20.68 ± 6.00 | 21.21 ± 5.00 | 0.834 | 21.14 ± 5.77 | 20.04 ± 5.62 | 0.899 | 21.12 ± 5.33 | 20.07 ± 6.69 | 0.926 | |
| Follow-up | 20.60 ± 6.85 | 21.46 ± 5.37 | 21.10 ± 6.55 | 20.18 ± 6.30 | 21.19 ± 6.33 | 19.93 ± 6.80 | |||||
-
L = second to fourth quartile at baseline; H = first quartile at baseline; UPDRS = Unified Parkinson’s Disease Rating Scale; AR = akinetic rigidity; PIGD = postural instability and gait disturbance; MMSE = Mini-Mental Status Examination; MoCA = Montreal Cognitive Assessment.
Additional files
-
Supplementary file 1
Association between the baseline plasma EV synaptic proteins with the clinical severity in people with Parkinson’s disease at follow-up with the adjustment of age, sex, disease duration, and the baseline severity of corresponding item, presented as standardized β and p-values.
UPDRS, Unified Parkinson’s Disease Rating Scale; AR, akinetic rigidity; PIGD, postural instability and gait disturbance; MMSE, Mini-Mental Status Examination; MoCA, Montreal Cognitive Assessment.
- https://cdn.elifesciences.org/articles/87501/elife-87501-supp1-v1.docx
-
MDAR checklist
- https://cdn.elifesciences.org/articles/87501/elife-87501-mdarchecklist1-v1.docx
Download links
A two-part list of links to download the article, or parts of the article, in various formats.
Downloads (link to download the article as PDF)
Open citations (links to open the citations from this article in various online reference manager services)
Cite this article (links to download the citations from this article in formats compatible with various reference manager tools)
Plasma extracellular vesicle synaptic proteins as biomarkers of clinical progression in patients with Parkinson’s disease
eLife 12:RP87501.
https://doi.org/10.7554/eLife.87501.3


