Proteomic analysis shows decreased type I fibers and ectopic fat accumulation in skeletal muscle from women with PCOS
- Department of Physiology and Pharmacology, Karolinska Institute, Sweden
- Department of Physiology, Institute of Neuroscience and Physiology, Sahlgrenska Academy, University of Gothenburg, Sweden
- School of Biomedical Sciences, University of New South Wales, Australia
- Victor Chang Cardiac Research Institute, Darlinghurst, Australia
- Epigenetics and Diabetes Unit, Department of Clinical Sciences, Lund University Diabetes Centre, Lund University, Sweden
- School of Health Sciences, University of Skövde, Sweden
Figures
Figure 1
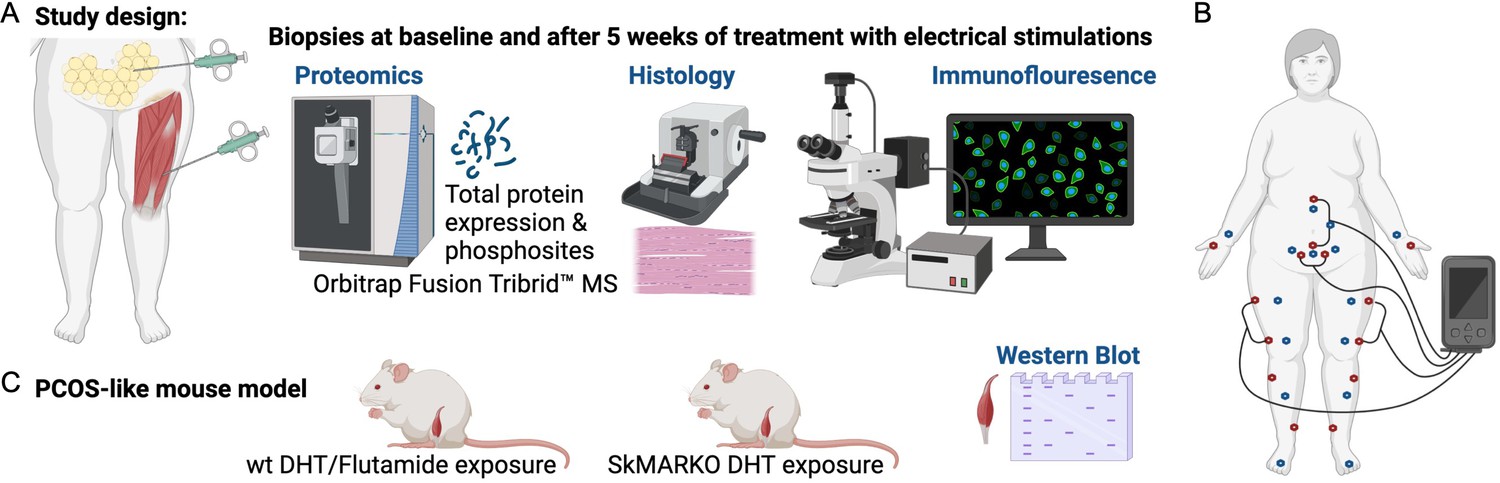
Study design.
(A) Muscle and fat biopsies collected from 10 controls and 10 women with polycystic ovary syndrome (PCOS) at baseline and after treatment with electrical stimulations. Electrical stimulations were given 3 times/week for 5 weeks. (B) The electrical stimulation protocol alternating between protocol 1 in red dots and protocol 2 in blue dots. Acupuncture points not connected to the stimulator were stimulated manually. (C) A PCOS-like mouse model treated with the androgen receptor blocker flutamide or lacking androgen receptors in skeletal muscle (SkMARKO). Created with https://www.biorender.com/.
Figure 2
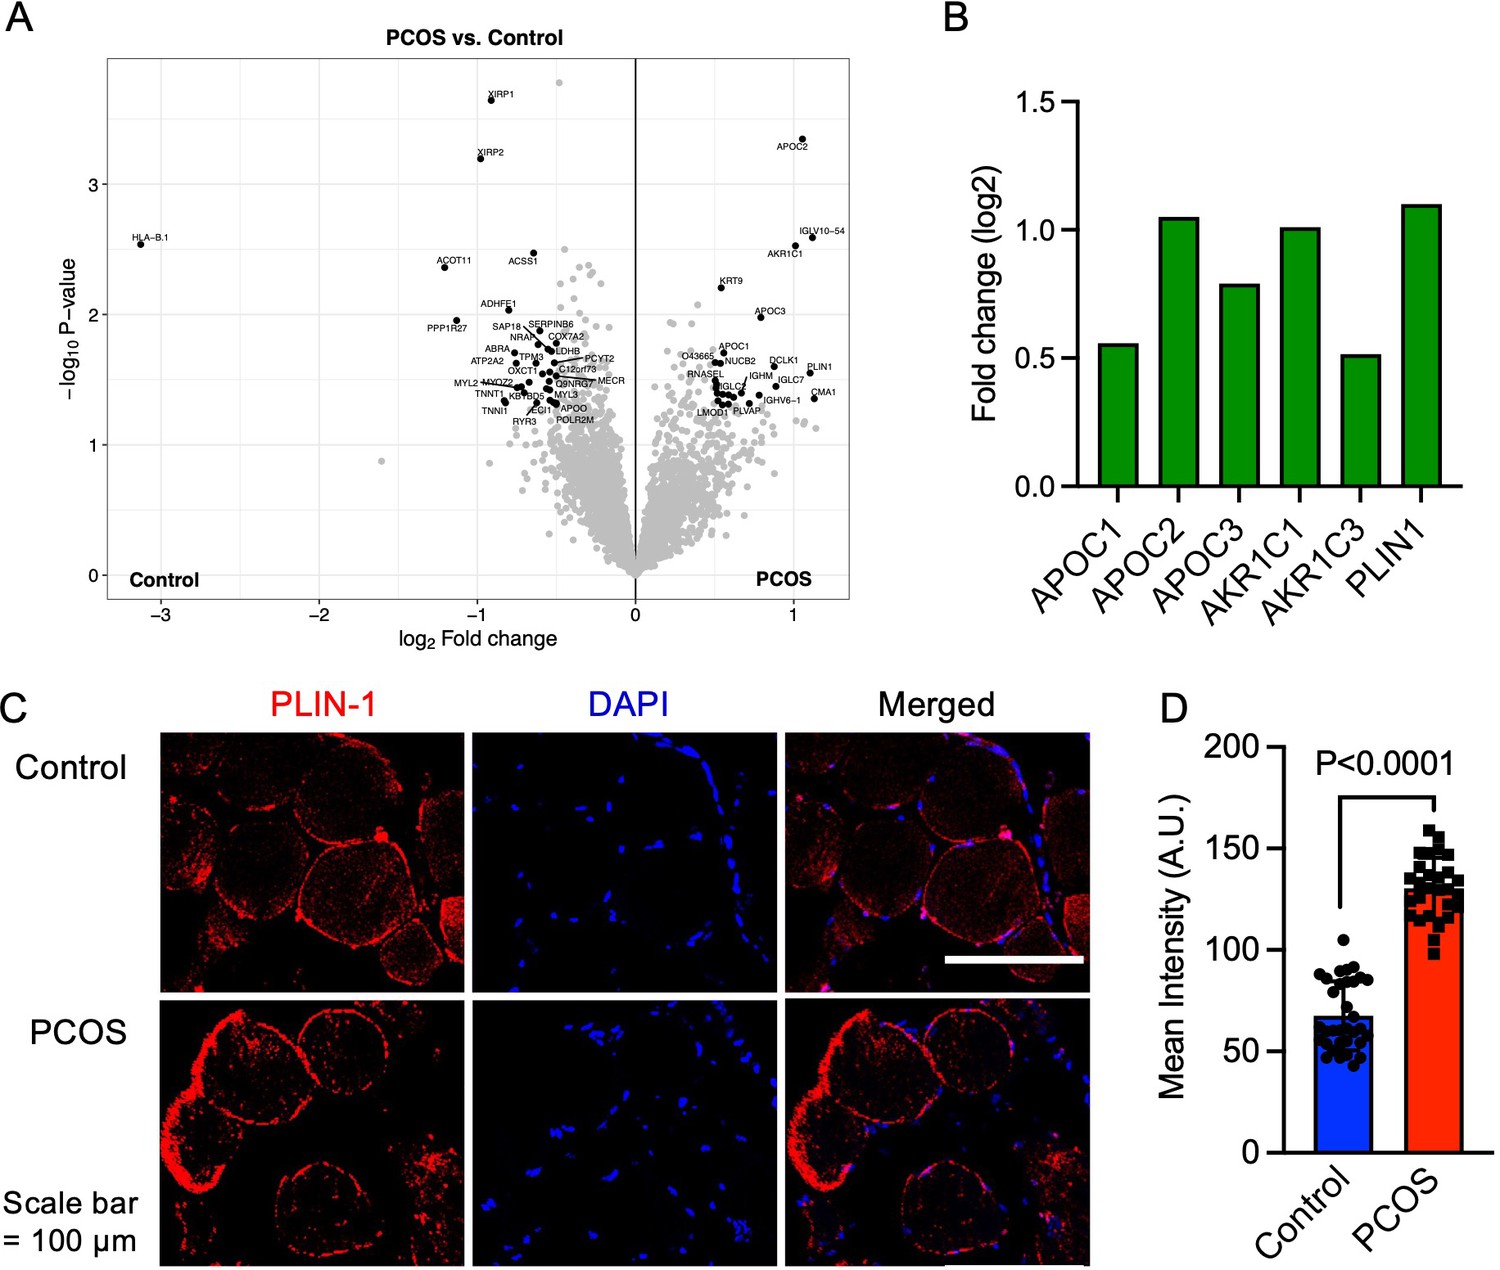
Protein expression and upregulated proteins in skeletal muscle.
(A) Volcano plot showing the mean protein log2 fold change in skeletal muscle (polycystic ovary syndrome [PCOS] vs controls) using limma method, and plotted against the –log10 p-value highlighting significantly regulated proteins in black (p<0.05, log2 fold change ± 0.5), n=10/group. (B) Increased protein expression of apolipoproteins C1 and C2, aldo-keto reductase (AKR) family 1 C1 and C3, and perilipin-1 in those with PCOS, (C) staining of perilipin-1 and DAPI in skeletal muscle, (D) quantification of perilipin-1 staining in skeletal muscle cells from control (n=33) and PCOS (n=28). Difference is based on Mann-Whitney U test and data are presented as mean ± SD.
Figure 3
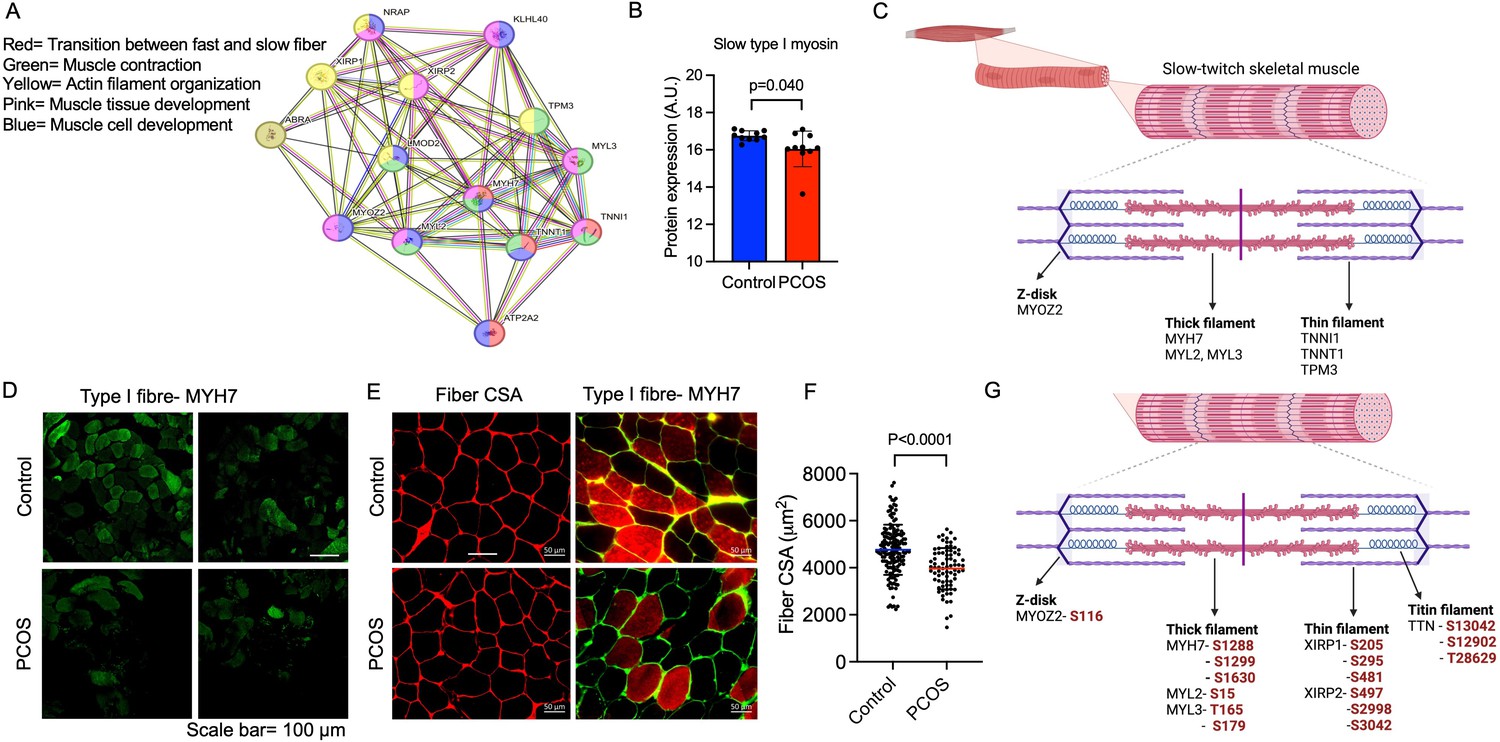
Enriched downregulated pathways involved in muscle contraction and transition between fast and slow fibers in PCOS.
(A) Protein network on proteins with a lower expression in polycystic ovary syndrome (PCOS) skeletal muscle vs. controls. Lines indicate protein-protein associations. (B) Decreased expression of the slow type I skeletal muscle fibers myosin heavy chain beta (MYH7) in those with PCOS (n=10/group), differences are based on the limma method and presented as mean ± SD. (C) Lower expression of proteins in slow-twitch type I muscle fibers in PCOS vs controls (p<0.05, log2 fold change <-0.5). (D, E) Immunofluorescent staining of type I muscle fibers with myosin heavy chain beta, and (E) the cell membrane with WGA. (F) Quantification of fiber cross-sectional area (CSA) in (E), difference is based on Mann-Whitney U test and data are presented as mean ± SD. (G) Differently phosphorylated sites in proteins expressed in muscle filaments (p<0.05, log2 fold change ± 0.5).
Figure 4
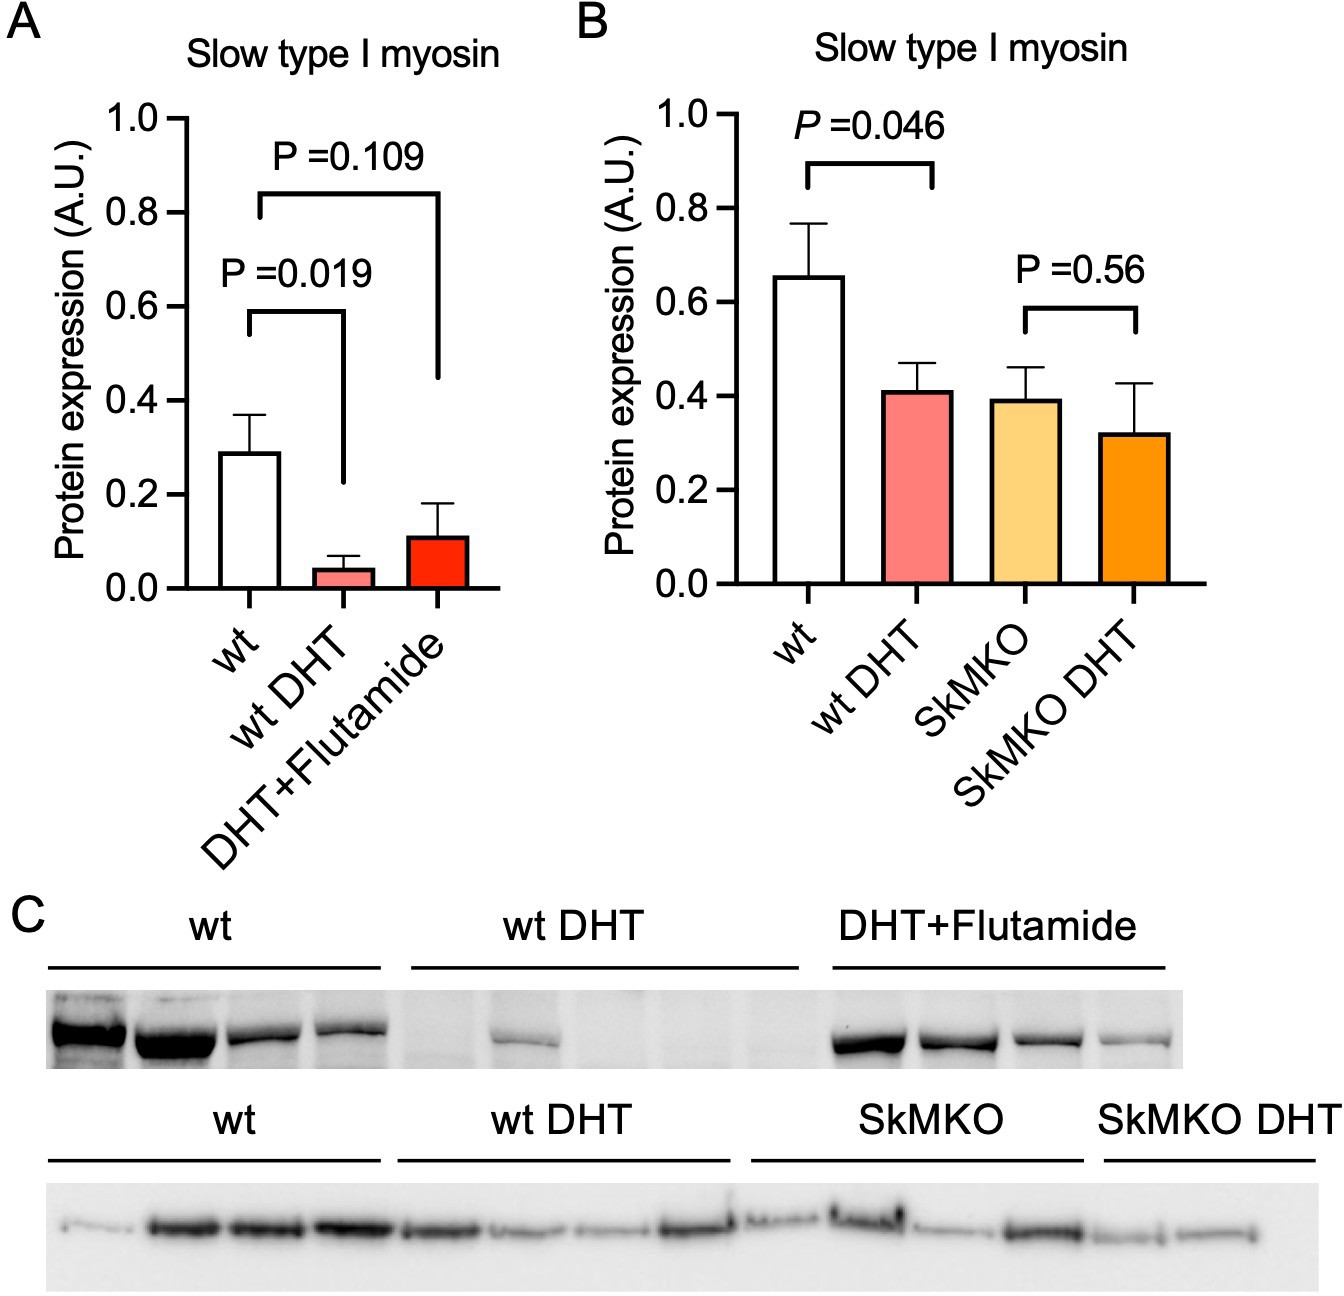
Androgen exposure leads to a shift in muscle fiber type in mice.
(A) Decreased expression of the slow type I skeletal muscle fibers myosin heavy chain beta (MYH7) in dihydrotestosterone (DHT)-exposed polycystic ovary syndrome (PCOS)-like mice. This effect was partly blocked by the androgen receptor antagonist flutamide (n=5–6/group). (B) Decreased expression of slow type I skeletal muscle fibers (MYH7) in skeletal muscle-specific androgen receptor knockout mice (SkMARKO) compared to wild type (wt) (p=0.033). DHT exposure did not alter the number of type I fibers in SkMARKO (n=6–8/group). (C) Representative expression of myosin heavy chain beta. Differences in (A) are based on one-way ANOVA with Dunnets multiple comparisons test and (B) on two-way ANOVA, and presented as mean ± SEM. The full raw unedited uncropped blots with the relevant bands clearly labeled are provided as Figure 4—source data 1.
-
Figure 4—source data 1
Contains the raw unedited uncropped blots used to generate the figure.
- https://cdn.elifesciences.org/articles/87592/elife-87592-fig4-data1-v1.zip
Figure 5
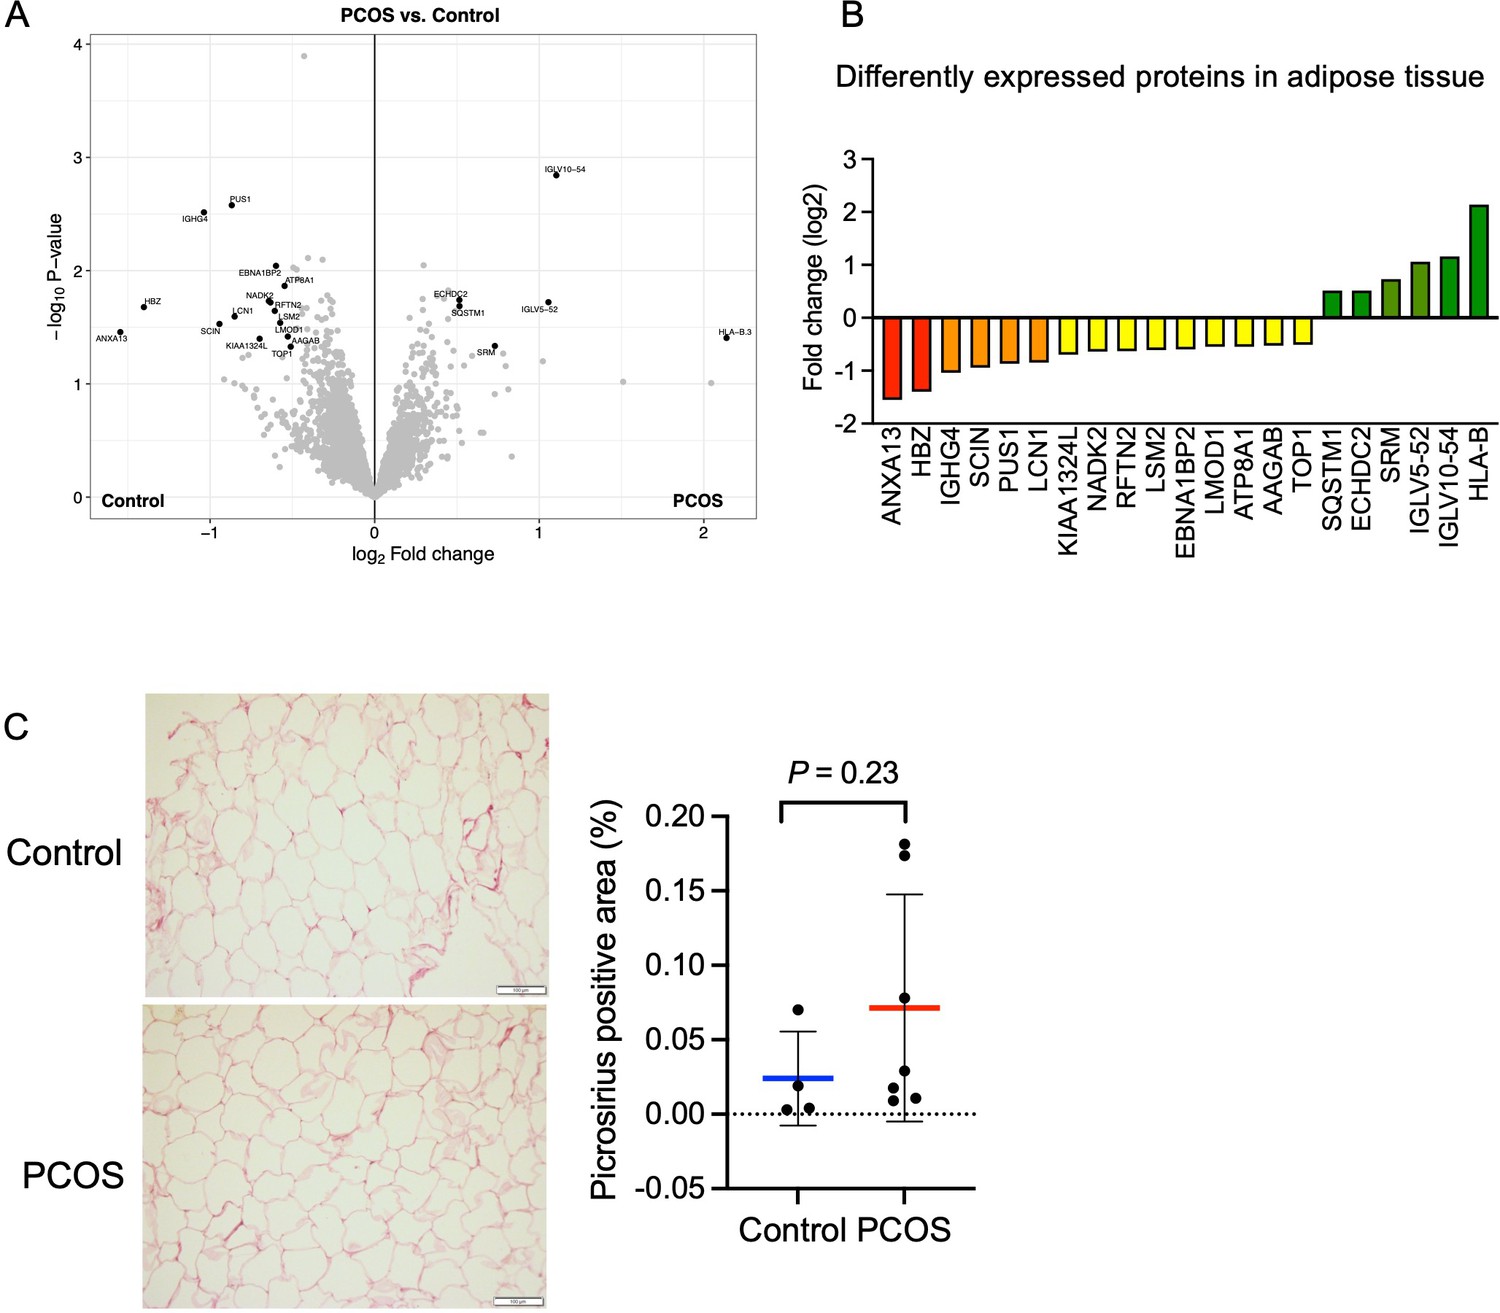
Protein expression and differently expressed proteins in adipose tissue.
(A) Volcano plot showing the mean protein log2 fold change in adipose tissue (polycystic ovary syndrome [PCOS] vs controls) using limma method, and plotted against the –log10 p-value highlighting significantly regulated proteins (black; p<0.05, log2 fold change ± 0.5). n=10/group. (B) All differentially expressed proteins in adipose tissue from women with PCOS. (C) Picrosirius red staining of s.c. adipose tissue. The difference between women with PCOS (n=7) and controls (n=4) was based on Mann-Whitney U test and is presented as mean ± SD.
Figure 6
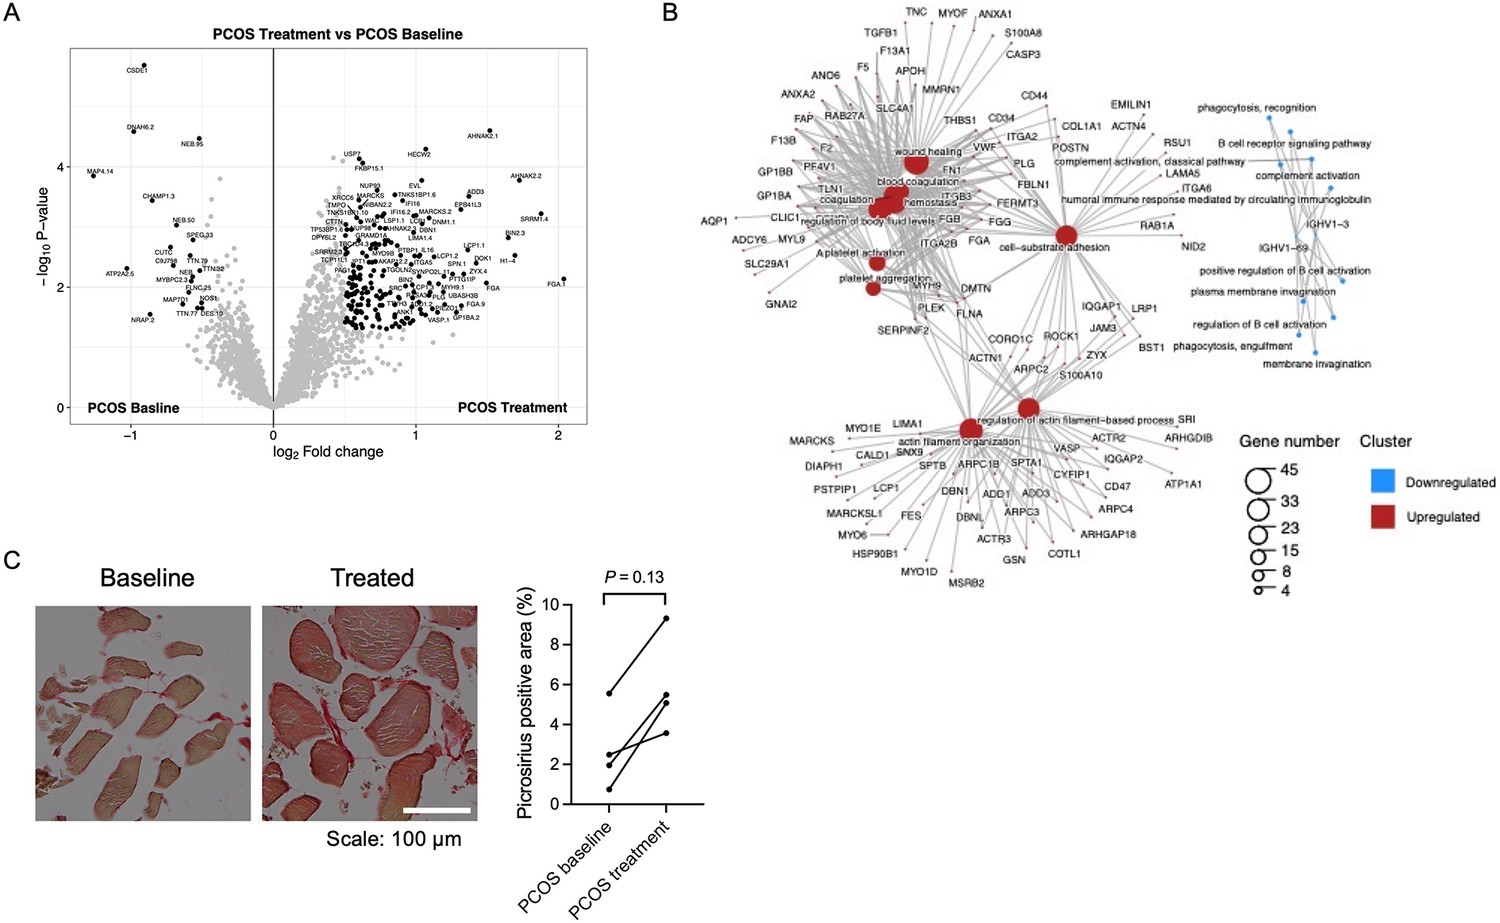
Protein expression and enriched signaling pathways in skeletal muscle after treatment with electrical stimulation.
(A) Volcano plot showing the mean protein log2 fold change in skeletal muscle (treatment vs baseline in polycystic ovary syndrome [PCOS]) using limma method, and plotted against the –log10 p-value highlighting significantly regulated proteins (black; p<0.05, log2 fold change ± 0.5). n=10/group. (B) GO terms for biological function of the changed proteins. (C) Representative pictures and quantification of picrosirius red staining of skeletal muscle before and after treatment with electrical stimulation in the same individual (n=4). Change between baseline and after treatment was based on Wilcoxon signed-rank test.
Figure 7
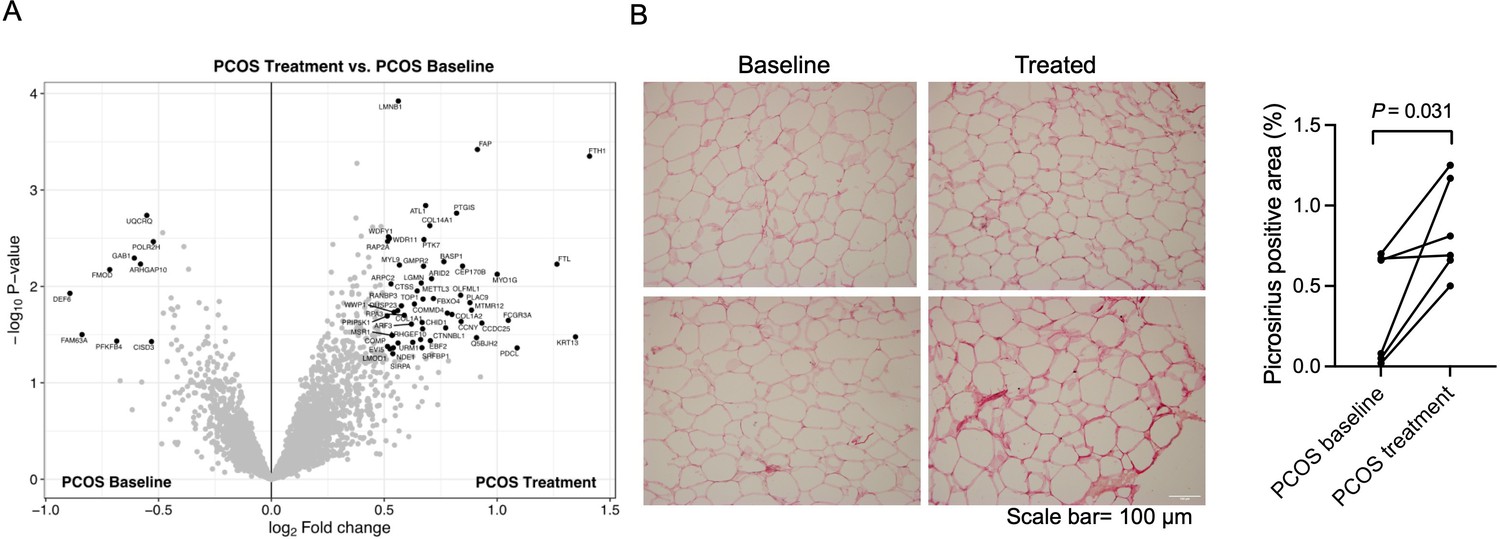
Protein expression and collagen quantification in adipose tissue after treatment with electrical stimulation.
(A) Volcano plot showing the mean protein log2 fold change in adipose tissue (treatment vs baseline in polycystic ovary syndrome [PCOS]) using limma method, and plotted against the –log10 p-value highlighting significantly regulated proteins (black; p<0.05, log2 fold change ± 0.5). n=10/group. (B) Representative pictures and quantification of picrosirius red staining of adipose tissue before and after treatment with electrical stimulation (n=6). Changes between baseline and after treatment were based on Wilcoxon signed-rank test.
Tables
Table 1
Anthropometric and biochemical analyses in study participants.
| Variable | Controls baseline(n=10) | PCOS baseline(n=10) | Controls vs. PCOS(p-value) | PCOS treatment(n=10) | Baseline vs. treatment(p-value) |
|---|---|---|---|---|---|
| Age (years) | 31.2±4.8 | 30.1±5.1 | 0.60 | ||
| Weight (kg) | 88.2±11.0 | 88.6±15.6 | 0.82 | 89.0±14.9 | 0.33 |
| BMI (kg/m2) | 30.5±3.7 | 30.5±4.1 | 0.88 | 30.7±4.0 | 0.32 |
| Ferriman-Gallwey score | 2.1±1.7 | 7.7±4.5 | 0.003 | 9.2±6.0 | 0.48 |
| Testosterone (pg/ml) | 258±77 | 476±211 | 0.004 | 347±220 | 0.012 |
| Insulin (mU/ml) | 8.2±3.5 | 11.4±8.5 | 0.47 | 8.5±4.8 | 0.11 |
| Glucose (mmol/l) | 5.2±0.3 | 4.8±0.4 | 0.044 | 4.8±0.3 | 0.67 |
| HOMA-IR | 1.92±0.96 | 2.75±2.00 | 0.41 | 1.89±1.33 | 0.037 |
| Hemoglobin A1c (mmol/mol) | 31.5±2.6 | 31.7±2.7 | 1.00 | 30.5±2.9 | 0.035 |
| Triglycerides (mmol/l) | 0.71±0.18 | 1.11±0.58 | 0.076 | 1.01±0.58 | 0.066 |
-
Data are presented as mean ± SD. Differences between PCOS and controls were analyzed by Mann-Whitney U test. Wilcoxon signed-rank test was used to analyze changes between measurements at baseline and after 5 weeks of treatment. p-value < 0.05 was considered significant.
Additional files
-
MDAR checklist
- https://cdn.elifesciences.org/articles/87592/elife-87592-mdarchecklist1-v1.docx
-
Supplementary file 1
Differently expressed proteins, phosphorylation sites, and transcripts, and their respective enriched pathways, in skeletal muscle and adipose tissues.
(a) Differentially expressed proteins in skeletal muscle from women with polycystic ovary syndrome (PCOS) compared with controls (n=10/group). p<0.05, log2 fold change ± 0.5. (b) Gene ontology pathway analysis of differentially expressed proteins in skeletal muscle from women with PCOS compared with controls. (c) Overlap between differentially expressed proteins in skeletal muscle from women with PCOS compared with controls and differentially expressed genes. (d) Phosphorylation sites with a change in phosphorylation in skeletal muscle from women with PCOS compared with controls. (e) Differentially expressed proteins in adipose tissue from women with PCOS compared with controls. (f) Phosphorylation sites with a change in phosphorylation in adipose tissue from women with PCOS compared with controls. (g) Gene expression and methylation changes in skeletal muscle after treatment with electrical stimulation. (h) Changed proteins in skeletal muscle from women with PCOS after treatment with electrical stimulation. (i) Gene ontology pathway analysis of changed proteins in skeletal muscle from women with PCOS after treatment with electrical stimulation. (j) Phosphorylation sites with a change in phosphorylation in skeletal muscle from women with PCOS after treatment with electrical stimulation. (k) Changed proteins in adipose tissue from women with PCOS after treatment with electrical stimulation. (l) Gene ontology pathway analysis of changed proteins in adipose tissue from women with PCOS after treatment with electrical stimulation. (m) Phosphorylation sites with a change in phosphorylation in adipose tissue from women with PCOS after treatment with electrical stimulation.
- https://cdn.elifesciences.org/articles/87592/elife-87592-supp1-v1.xlsx
Download links
A two-part list of links to download the article, or parts of the article, in various formats.
Downloads (link to download the article as PDF)
Open citations (links to open the citations from this article in various online reference manager services)
Cite this article (links to download the citations from this article in formats compatible with various reference manager tools)
Proteomic analysis shows decreased type I fibers and ectopic fat accumulation in skeletal muscle from women with PCOS
eLife 12:RP87592.
https://doi.org/10.7554/eLife.87592.3


