A Vibrio cholerae viral satellite maximizes its spread and inhibits phage by remodeling hijacked phage coat proteins into small capsids
- Department of Plant and Microbial Biology, Seed Lab, University of California, Berkeley, United States
- Department of Biochemistry and Molecular Biology, Parent Lab, Michigan State University, United States
Figures
Figure 1 with 1 supplement
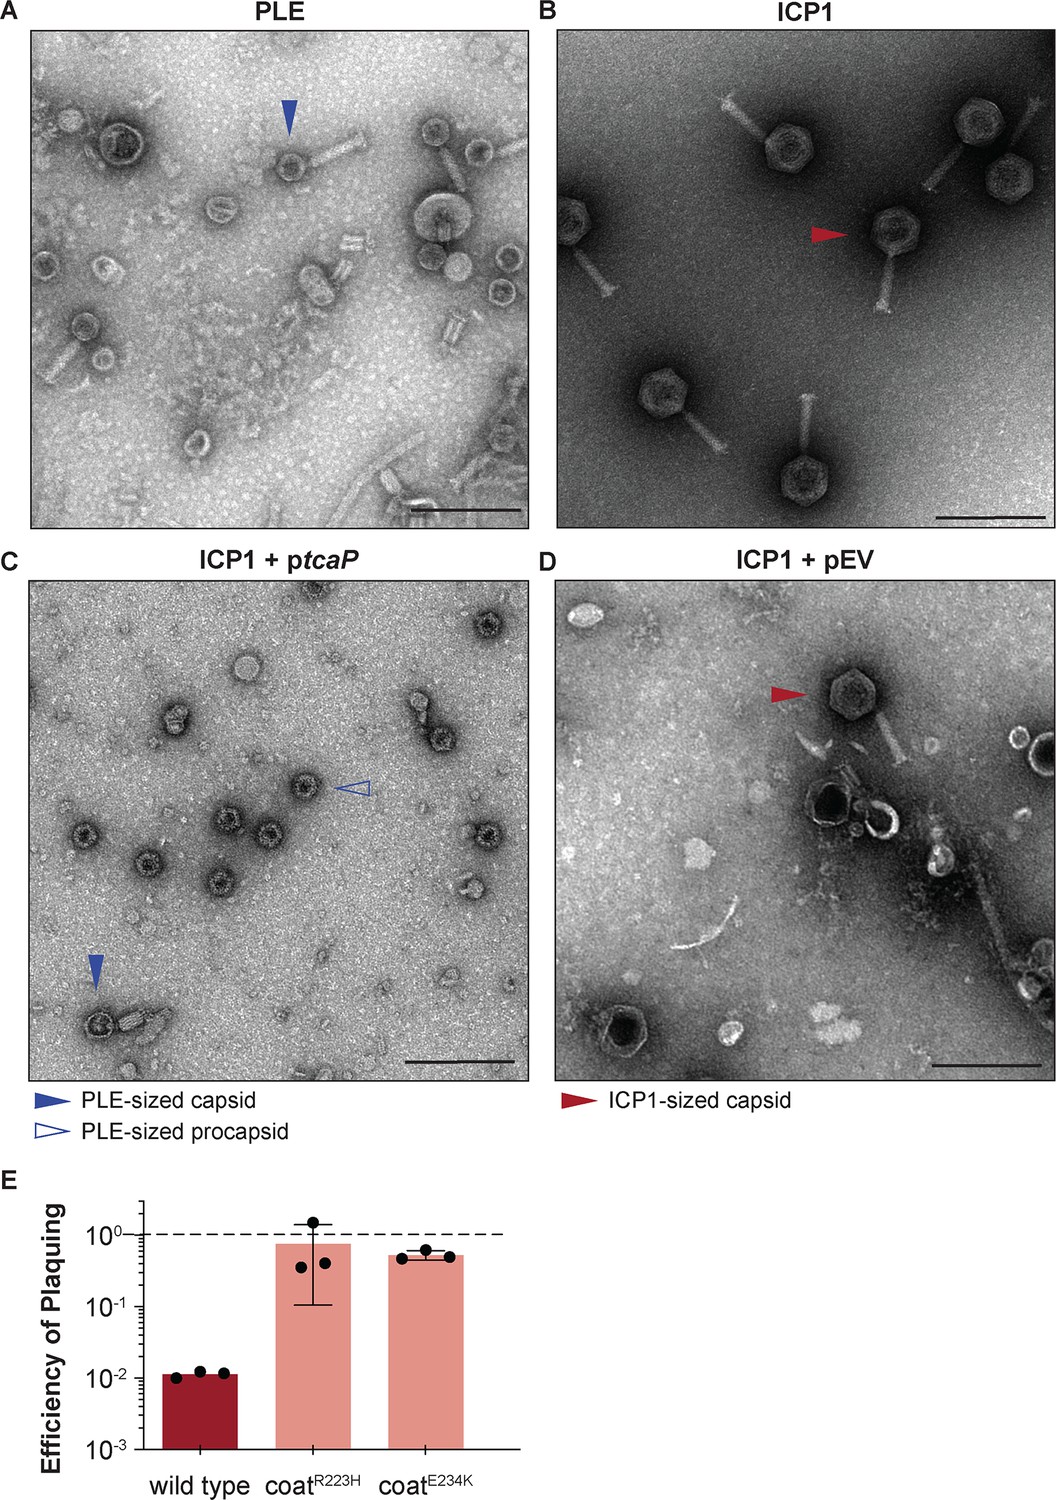
Phage-inducible chromosomal island-like element (PLE) encodes an inhibitory protein, TcaP, which modifies ICP1’s capsid assembly process to produce small capsids.
(A, B) Representative transmission electron micrographs (TEMs) from three independent biological replicates show (A) PLE virions have small, ~50-nm-wide capsids and long contractile tails while. (B) ICP1 virions have large, ~80-nm-wide capsids and long contractile tails. Scale bars are 200 nm. (C, D) Representative TEMs of lysates produced from ICP1 infection of V. cholerae expressing (C) TcaP (ptcaP) or (D) an empty vector (pEV). Arrowheads show exemplary capsids and their sizes according to the legend. Scale bars are 200 nm. (E) Efficiency of plaquing of wild type ICP1 or escape phages harboring the substitution indicated in the coat protein on V. cholerae expressing TcaP relative to an empty vector control. Each dot represents a biological replicate, bars represent the mean, and error bars show the standard deviation. The dotted line indicates an efficiency of plaquing of 1 where the expression of TcaP is not inhibitory to plaque formation.
-
Figure 1—source data 1
Data used to create Figure 1E.
- https://cdn.elifesciences.org/articles/87611/elife-87611-fig1-data1-v1.xlsx
-
Figure 1—source data 2
Uncropped micrographs used to create Figure 1A–D.
- https://cdn.elifesciences.org/articles/87611/elife-87611-fig1-data2-v1.zip
Figure 1—figure supplement 1
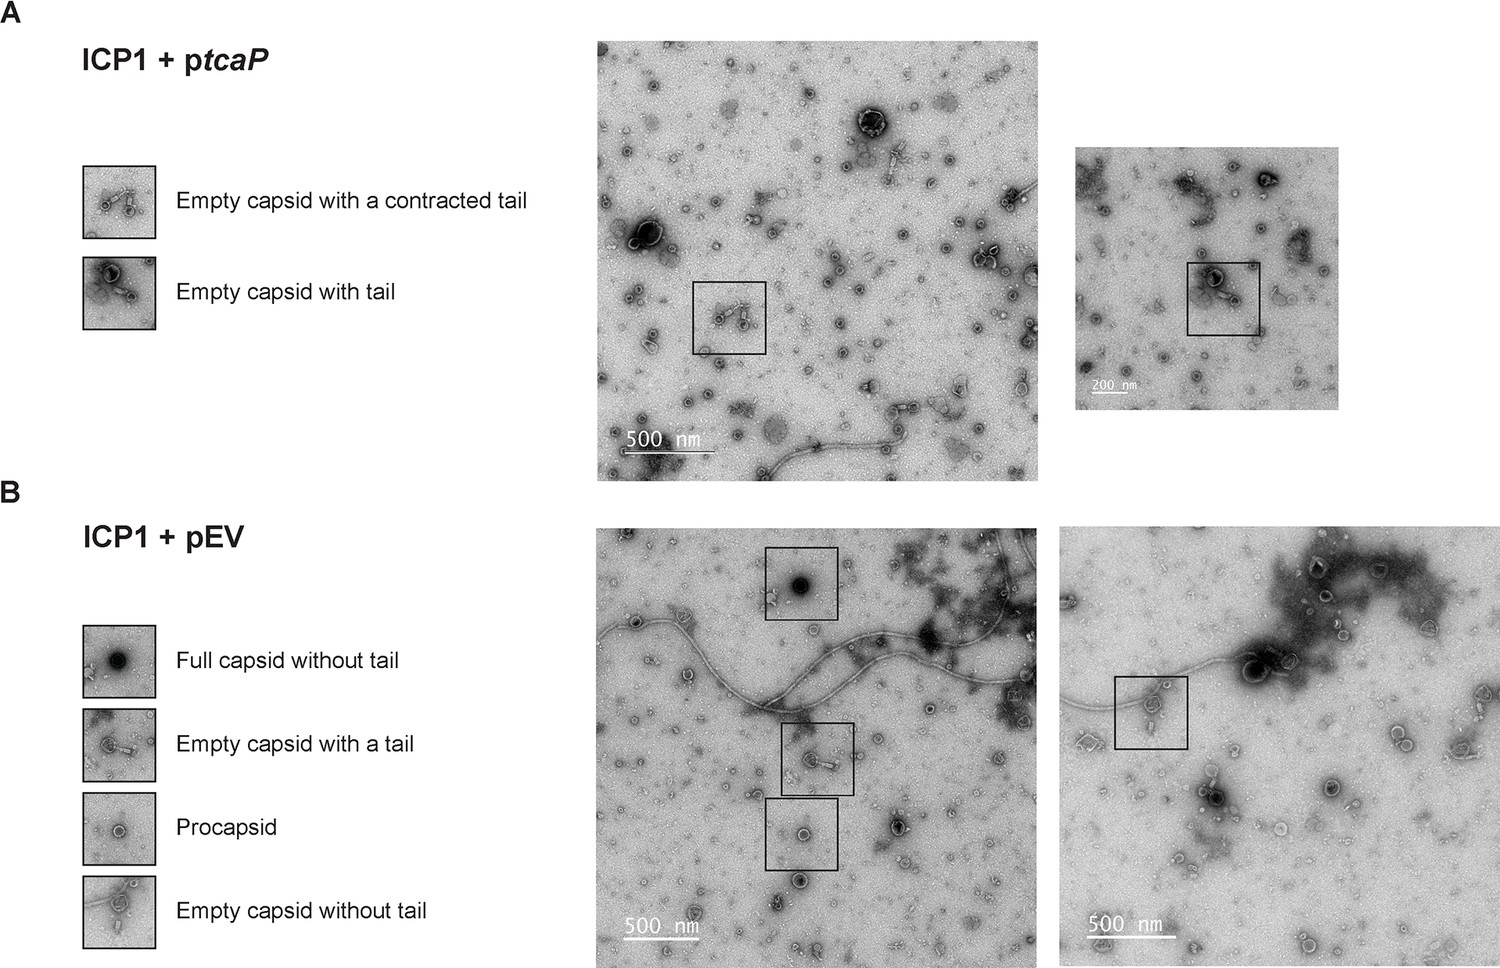
More than one particle morphology is seen in lysates produced from ICP1 infection of V. cholerae with an empty vector or expressing tcaP.
(A, B) Representative transmission electron micrographs (TEMs) show virion morphologies as indicated that were produced from ICP1 infection of V. cholerae expressing (A) a plasmid expressing tcaP (ptcaP) or (B) an empty vector (pEV). Scale bars are 500 or 200 nm, as indicated.
-
Figure 1—figure supplement 1—source data 1
Uncropped micrographs used to create Figure 1—figure supplement 1A and B.
- https://cdn.elifesciences.org/articles/87611/elife-87611-fig1-figsupp1-data1-v1.zip
Figure 2
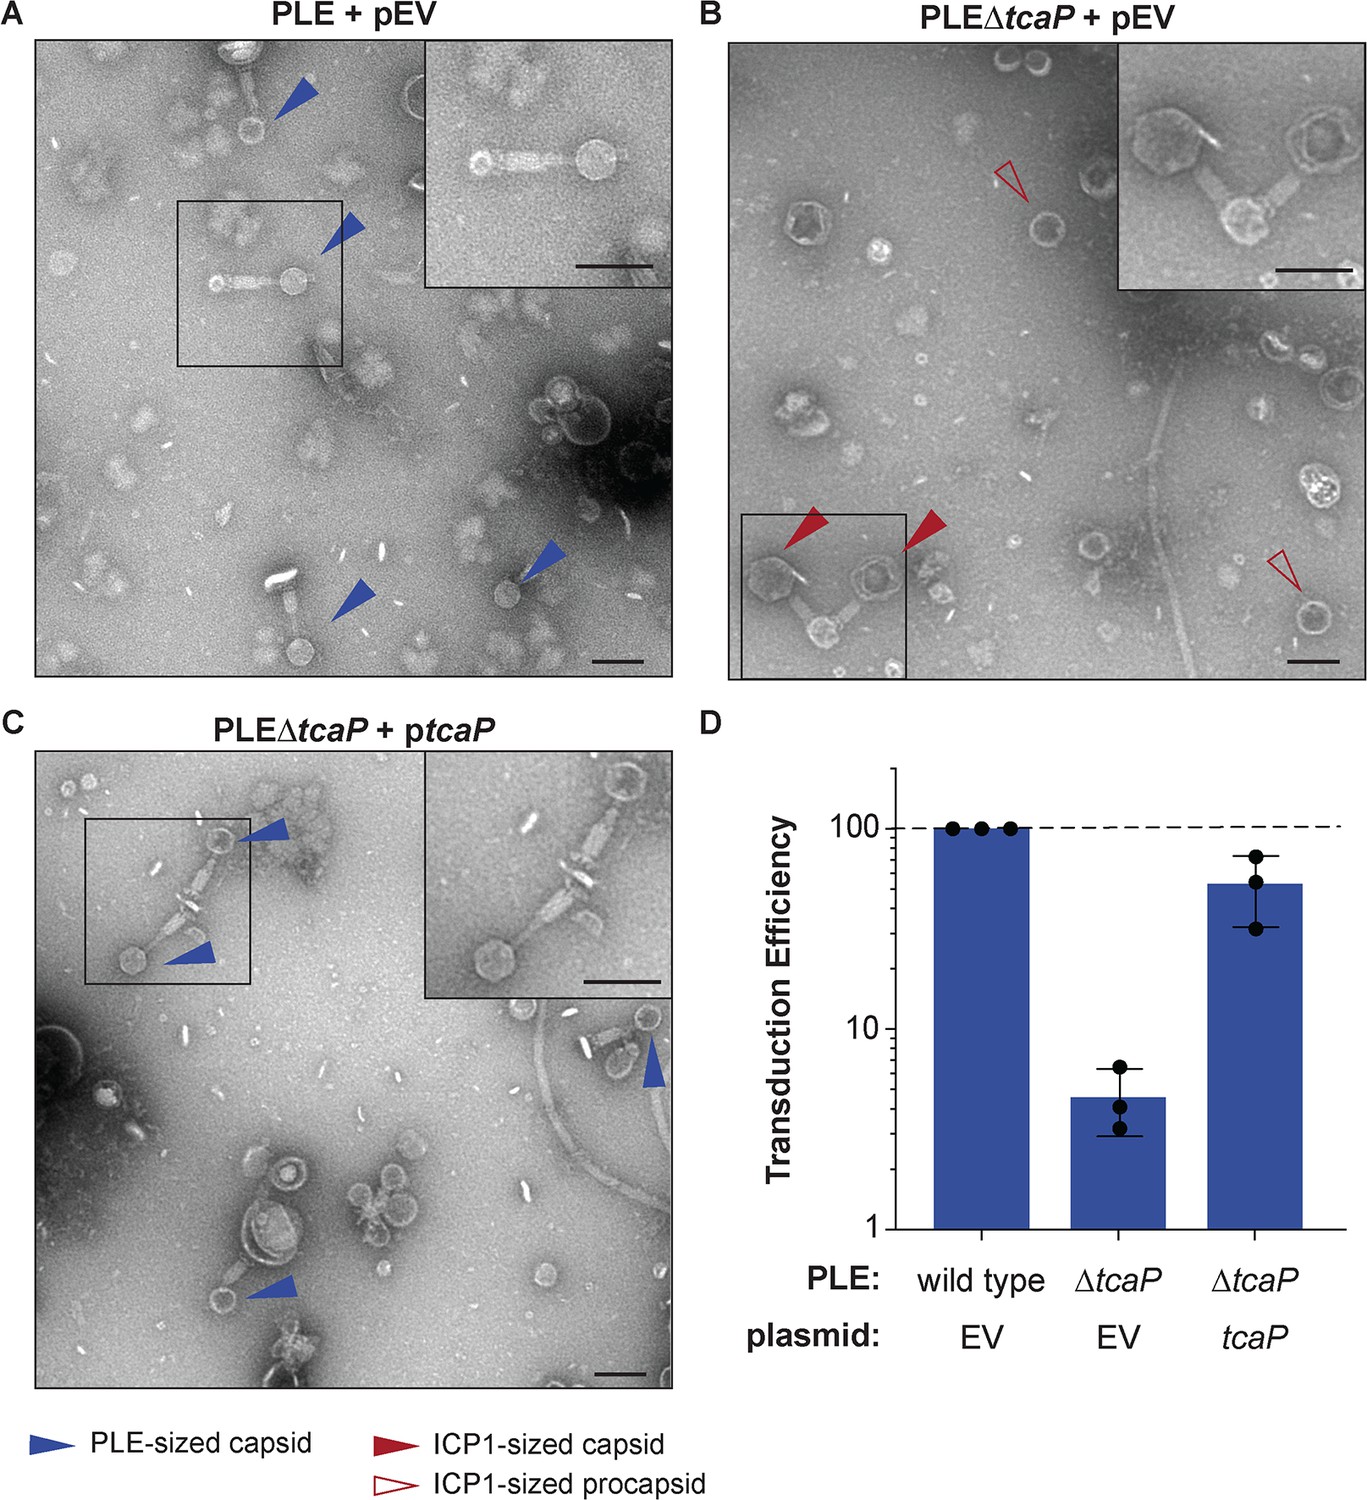
TcaP is the only phage-inducible chromosomal island-like element (PLE)-encoded factor necessary for directing small capsid assembly, which is required for efficient PLE transduction.
(A–C) Representative transmission electron micrographs (TEMs) from three independent biological replicates of lysate from ICP1-infected strains of V. cholerae with wild type PLE or PLE∆tcaP, as indicated, carrying either the empty vector (EV) or a vector expressing TcaP (tcaP). Insets are enlarged regions of the images highlighting representative particles, and arrowheads indicate capsid types and sizes, as described in the legend. Scale bars are 100 nm. (D) Quantification of PLE genome transduction for the strain indicated represented as the transduction efficiency relative to wild type PLE with an empty vector (pEV). Each dot represents a biological replicate, bars represent the mean, and error bars show standard deviation. The dotted line indicates an efficiency of 100%.
-
Figure 2—source data 1
Data used to create Figure 2D.
- https://cdn.elifesciences.org/articles/87611/elife-87611-fig2-data1-v1.xlsx
-
Figure 2—source data 2
Uncropped micrographs used to create Figure 1A–C.
- https://cdn.elifesciences.org/articles/87611/elife-87611-fig2-data2-v1.zip
Figure 3 with 4 supplements
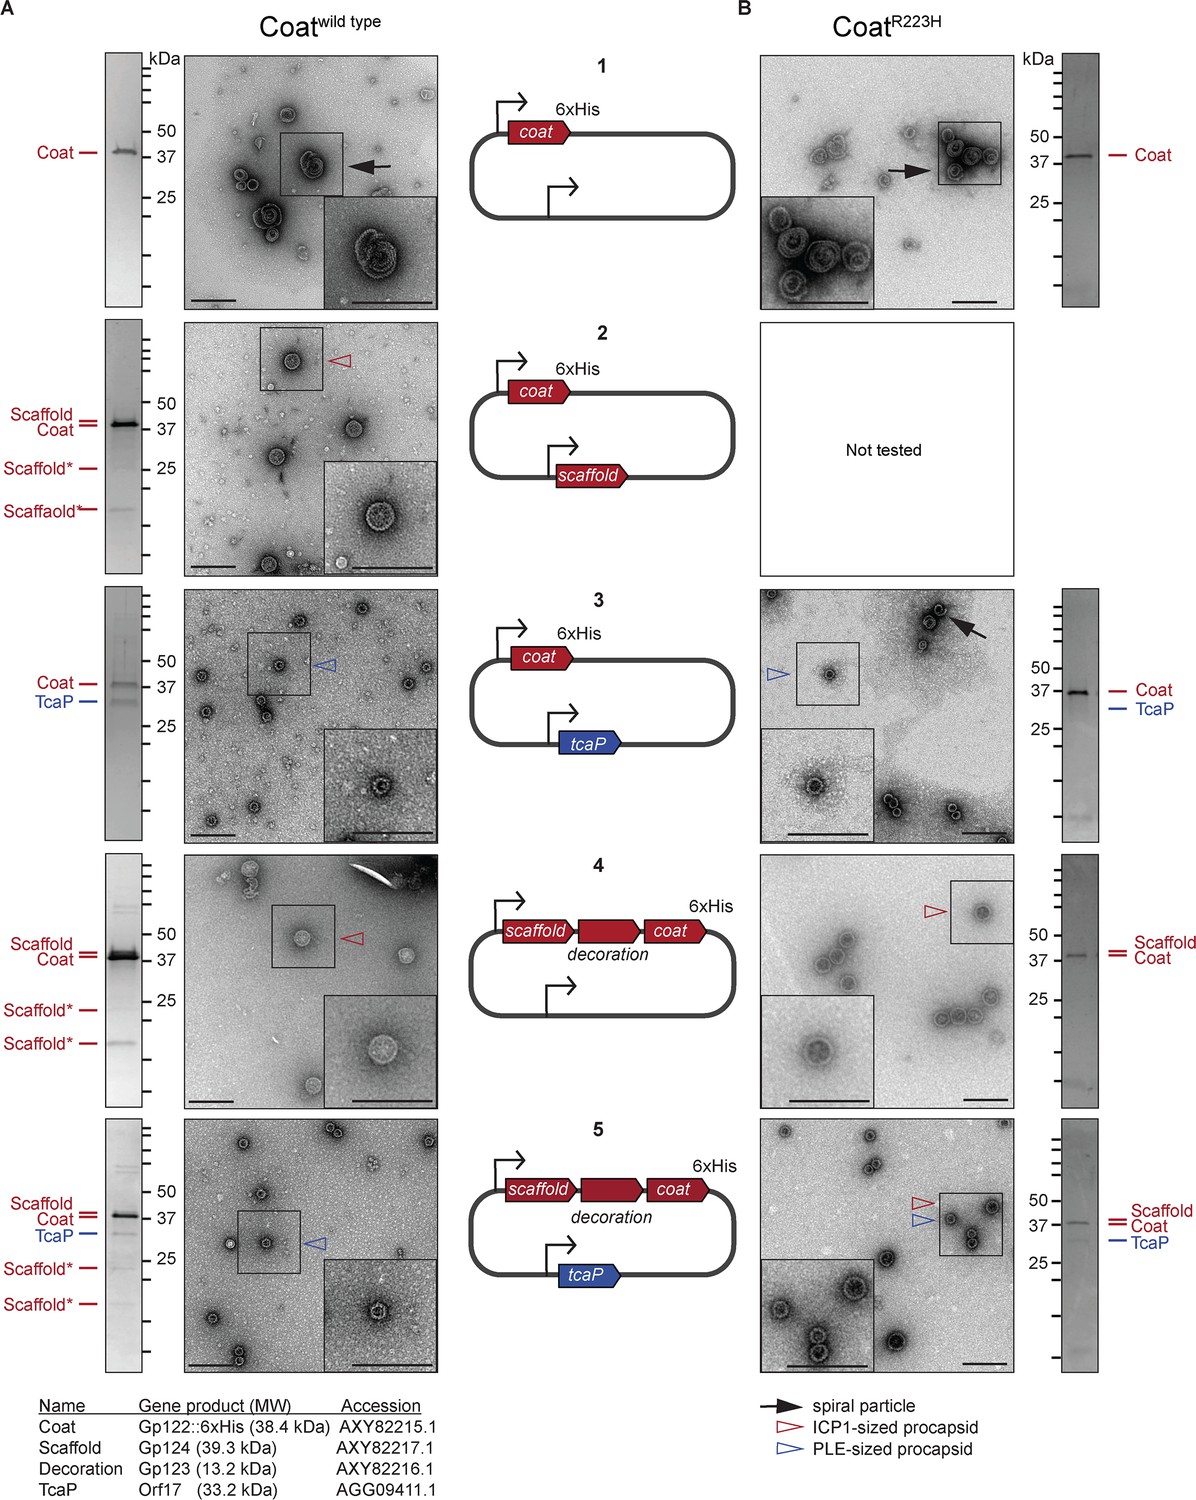
The size of procapsid-like particles (PLPs) is determined by ICP1 and phage-inducible chromosomal island-like element (PLE) scaffolds.
Representative transmission electron micrographs (TEMs) and Coomassie stained SDS-PAGE analyses of resulting affinity-purified PLPs produced in the heterologous assembly platform in E. coli from 2 to 3 independent biological replicates following expression of (A) coatwild type or (B) coatR223H proteins encoded on plasmids as shown in the diagrams in the central panel (numbered 1–5). ICP1-encoded genes are shown in red and PLE-encoded genes are shown in blue. Bent arrow icons indicate Ptac promoters. Six-histidine (6xHis) represents the tag fused to the C-terminus of the coat. Protein standards are indicated by black tick marks and a subset are marked by their sizes in kDa as indicated (standard range: 250, 150, 100, 75, 50, 37, 35, 20, 15, 10 kDa). Protein bands of interest are indicated by colored tick marks and labels (see legend for calculated molecular weights and accession numbers of these proteins, complete gene and protein information is provided in the Key resources table). In the absence of protease inhibitors, ICP1’s scaffold appears to be cleaved and the resulting cleavage products are indicated by scaffold*. Protease inhibitors were included in all coatR223H purifications. TEM insets are enlarged sections of the images highlighting representative particles and arrowheads indicate capsid types and sizes, as described in the legend. Scale bars are 200 nm.
Figure 3—figure supplement 1
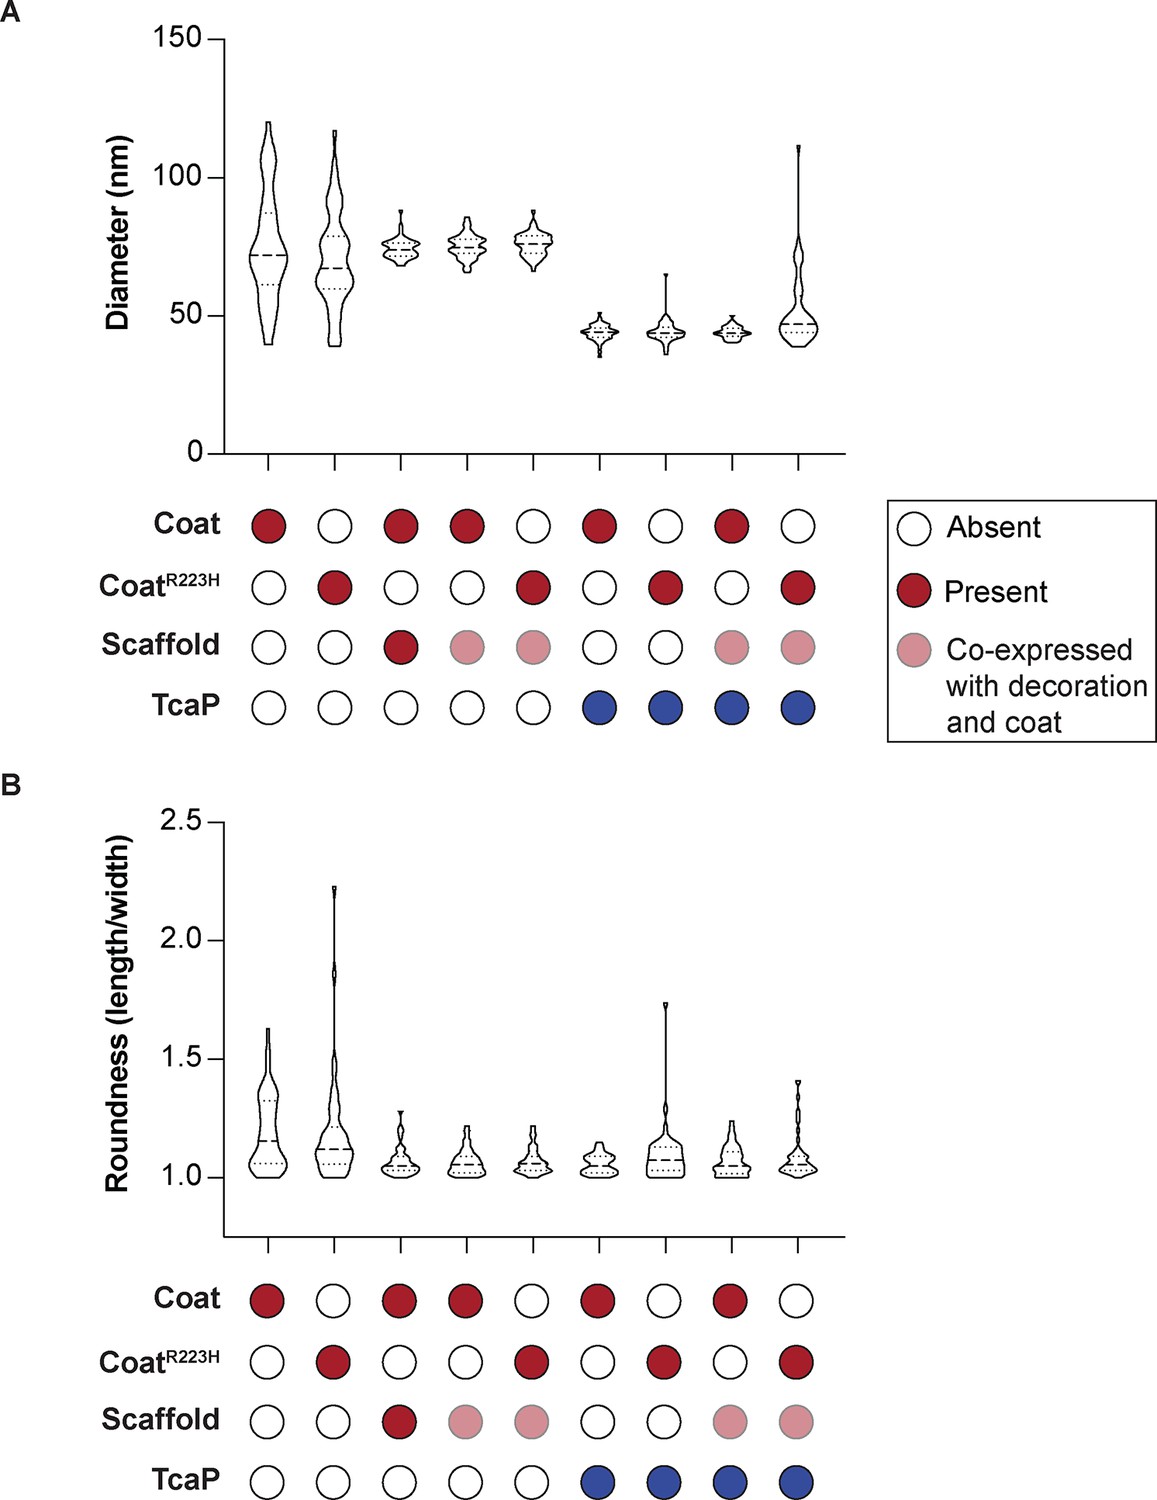
Quantification of size and shape of procapsid-like particle produced in E. coli.
(A) Violin plots showing the diameter of procapsid-like particles assembled from proteins according to legend in E. coli. Each particle was measured across two axes, and the measurements were averaged, n = 50 for each particle type. Red represents ICP1-encoded proteins and blue represents phage-inducible chromosomal island-like element (PLE)-encoded proteins. (B) Violin plots showing the roundness of procapsid-like particles assembled from proteins according to legend in E. coli. Roundness was calculated by dividing the length by the width of each particle; thus, a value of 1 represents a perfectly round particle and higher values represent a greater asymmetry of the particle.
-
Figure 3—figure supplement 1—source data 1
Data used to create Figure 3—figure supplement 1A and B.
- https://cdn.elifesciences.org/articles/87611/elife-87611-fig3-figsupp1-data1-v1.xlsx
Figure 3—figure supplement 2
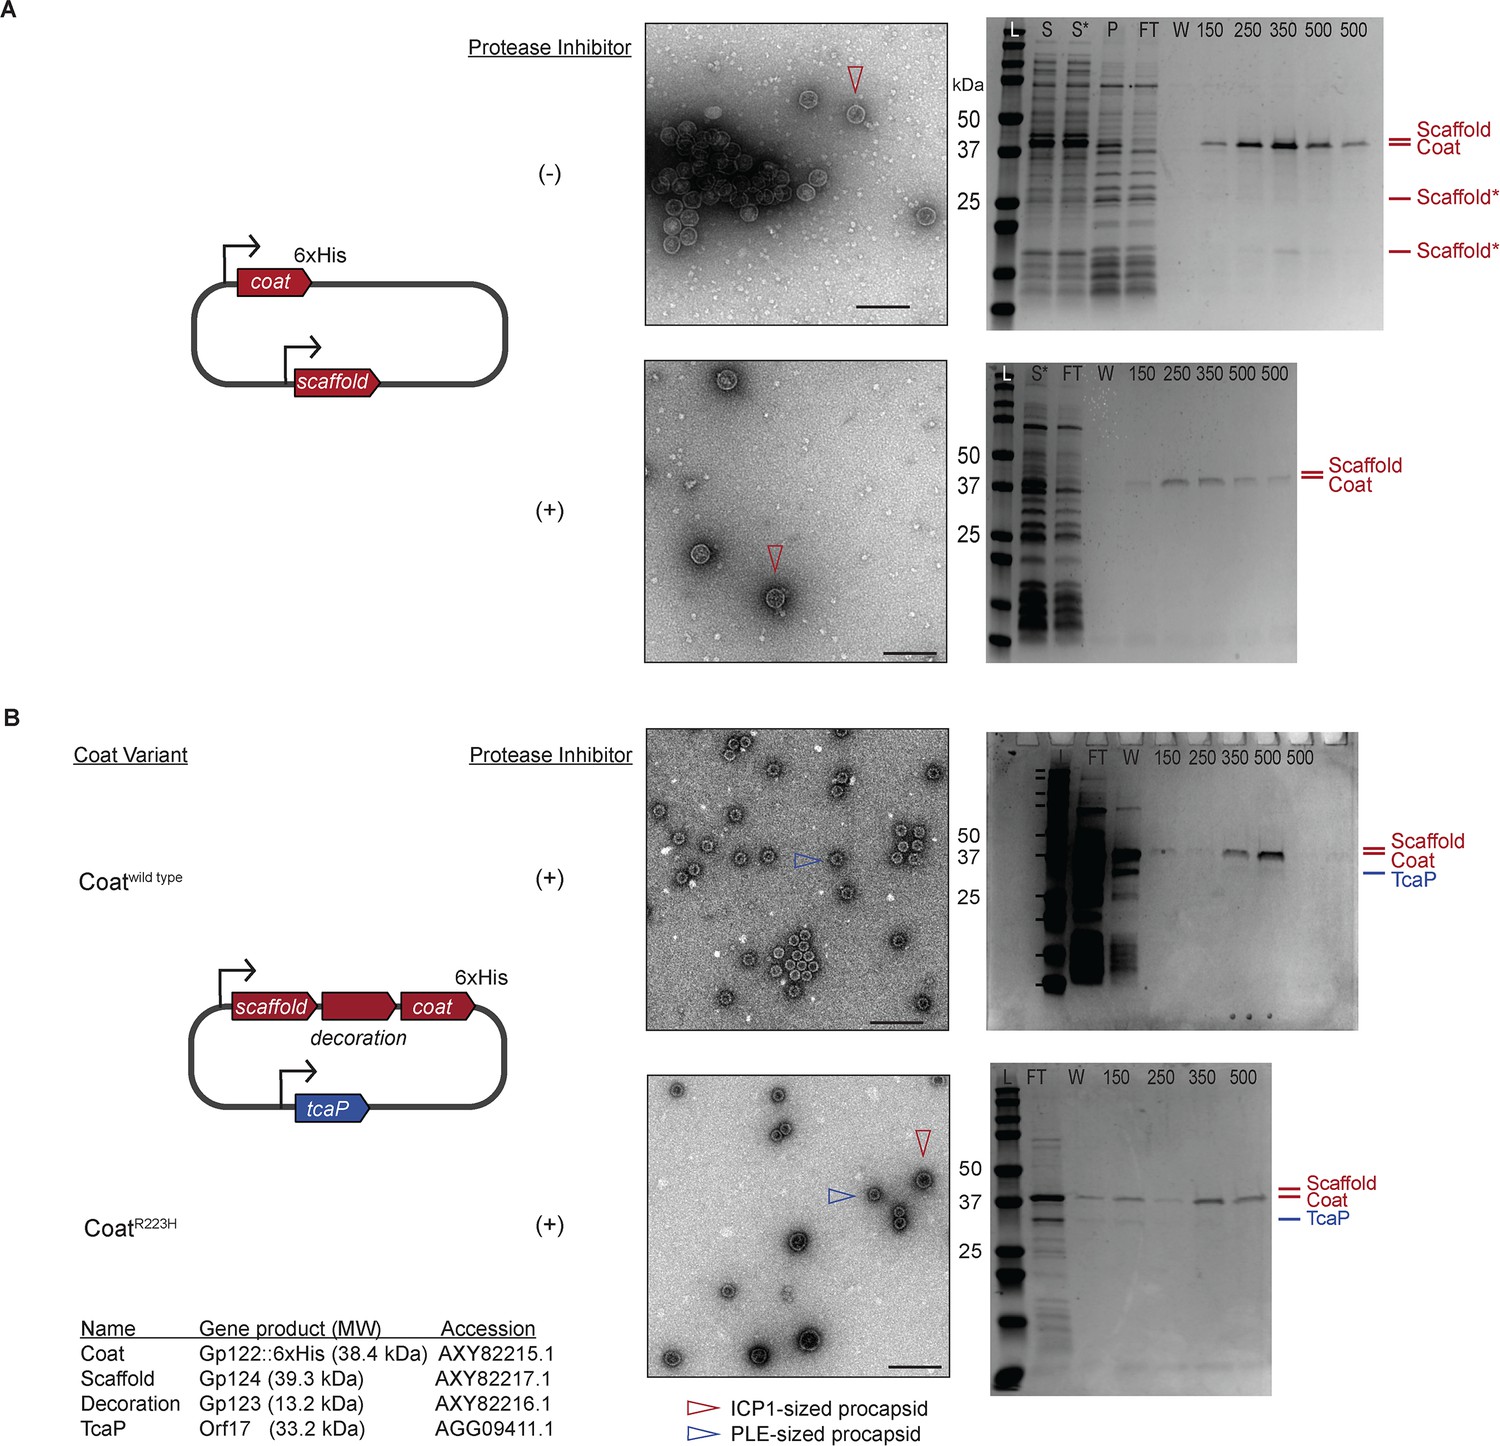
ICP1’s scaffold is cleaved in the absence of protease inhibitors and procapsid-like particle (PLP) assembly is not dependent on scaffold cleavage.
(A, B) (left) A diagram of the plasmid used in the heterologous PLP assembly platform in E. coli with ICP1-encoded genes show in red, PLE-encoded genes shown in blue. Bent arrow icons indicate Ptac promoters. Six-histidine (6xHis) represents the tag fused to the C-terminus of the coat. Coat variants used are indicated in (B). (A, B) (middle) Representative transmission electron micrographs (TEMs) of resulting purified PLPs produced either without (-) or with (+) protease inhibitors, as indicated. Particles of interest are indicated according to the legend. Scale bars are 200 nm. (Right) Representative Coomassie stained SDS-PAGE analyses of the steps of the affinity-purification process, Labels: L (ladder), S (supernatant [debris spin]), S* (supernatant [particle spin]), P (pellet [particle spin]), FT (flow through), W (wash), 150, 250, 350, 500 (mM imidazole); see ‘Methods’ for details. A subset of the protein standards are marked on the left with their sizes in kDa as indicated (standard: 200, 150, 100, 75, 50, 37, 35, 20, 15, 10 kDa). Protein bands of interest are indicated on the right of the gel (see legend for calculated molecular weights and accessions of these proteins). ICP1’s apparent scaffold cleavage products are indicated by scaffold*.
-
Figure 3—figure supplement 2—source data 1
Uncropped micrographs and gels used to create Figure 3—figure supplement 2A and B.
- https://cdn.elifesciences.org/articles/87611/elife-87611-fig3-figsupp2-data1-v1.zip
Figure 3—figure supplement 3
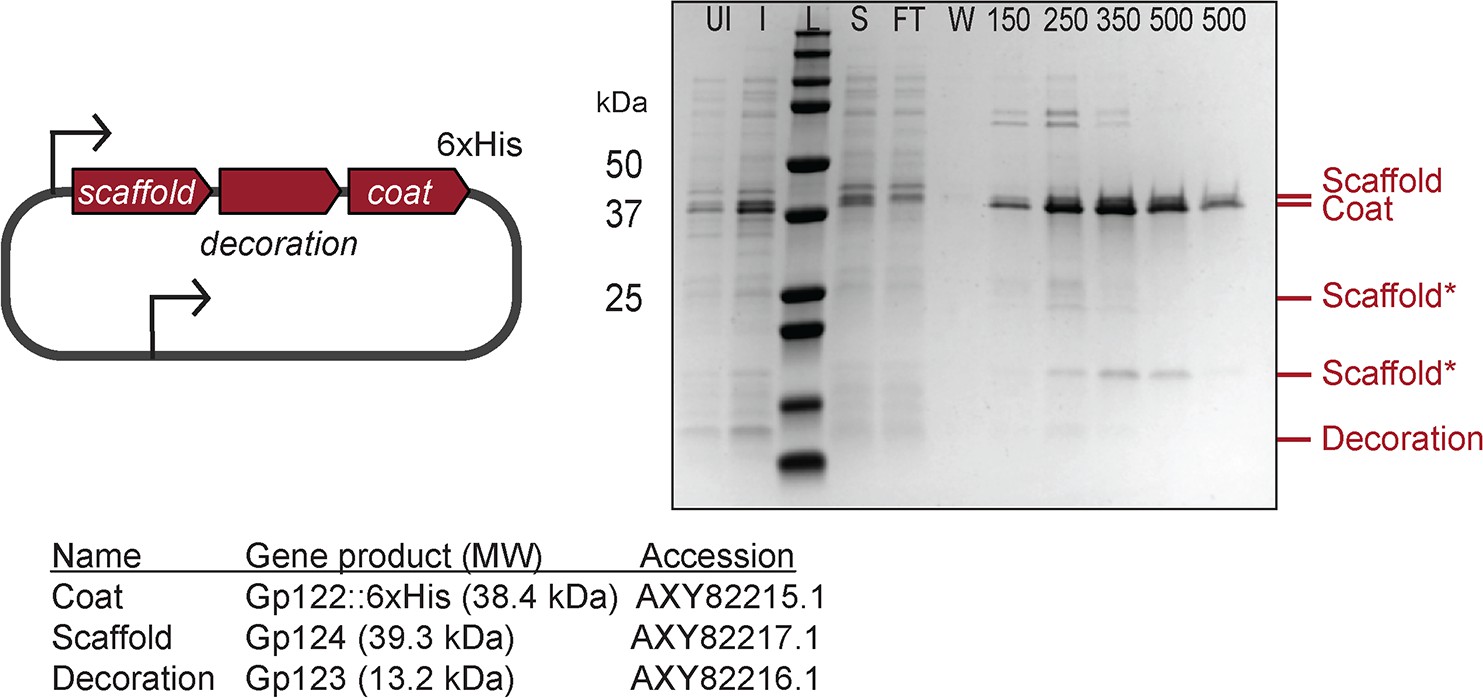
ICP1’s decoration protein is produced but not assembled into procapsid-like particles (PLPs).
Representative Coomassie stained SDS-PAGE analyses of the steps of the affinity-purification process showing production of the decoration protein but no incorporation in the PLPs. Labels: UI (uninduced), I (induced), L (ladder), S (supernatant), FT (flow through), W (wash), 150, 250, 350, 500 (mM imidazole). See ‘Methods’ for details. A subset of the protein standards are marked on the left with their sizes in kDa as indicated (standard: 200, 150, 100, 75, 50, 37, 35, 20, 15, 10 kDa). Protein bands of interest are indicated on the right (see legend for calculated molecular weights and accession numbers of these proteins). ICP1’s apparent scaffold cleavage products are indicated by scaffold*.
-
Figure 3—figure supplement 3—source data 1
Uncropped micrographs and gels used to create Figure 3—figure supplement 3.
- https://cdn.elifesciences.org/articles/87611/elife-87611-fig3-figsupp3-data1-v1.zip
Figure 3—figure supplement 4
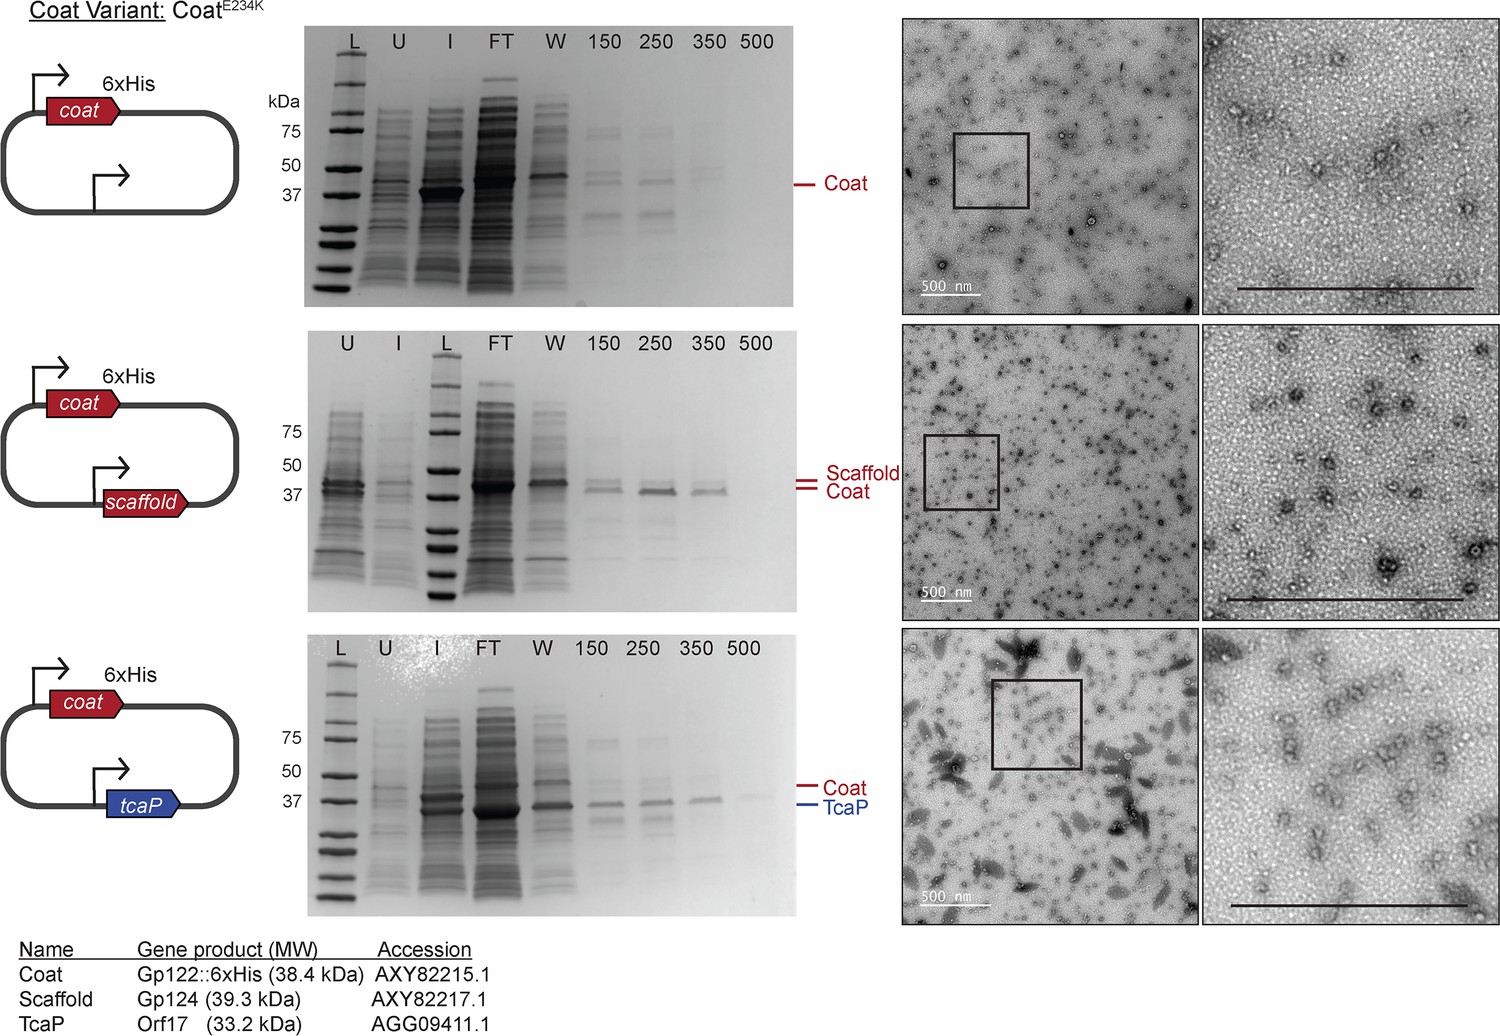
The E234K substitution diminishes assembly of the coat protein in the procapsid-like particle (PLP) assembly platform.
A diagram of the plasmid used in the heterologous PLP assembly platform in E. coli with ICP1-encoded genes shown in red and PLE-encoded genes shown in blue. Bent arrow icons indicate Ptac promoters. Six-histidine (6xHis) represents the tag fused to the C-terminus of the coat. The coat variant used is indicated. Representative Coomassie stained SDS-PAGE analyses of the steps of the affinity-purification process, Labels: L (ladder) S (supernatant [debris spin]), S* (supernatant [particle spin]), P (pellet [particle spin]), FT (flow through), W (wash), 150, 250, 350, 500 (mM imidazole), see ‘Methods’ for details. A subset of the protein standards are marked on the left with their sizes in kDa as indicated (standard: 200, 150, 100, 75, 50, 37, 35, 20, 15, 10 kDa). Protein bands of interest are indicated on the right (see legend for calculated molecular weights and accession numbers of these proteins). Representative transmission electron micrographs (TEMs) of resulting purified PLPs produced with corresponding plasmids as indicated. Boxes indicate regions that are enlarged on far right, and scale bars are 500 nm.
-
Figure 3—figure supplement 4—source data 1
Micrographs and gels used to create Figure 3—figure supplement 4.
- https://cdn.elifesciences.org/articles/87611/elife-87611-fig3-figsupp4-data1-v1.zip
Figure 4 with 2 supplements
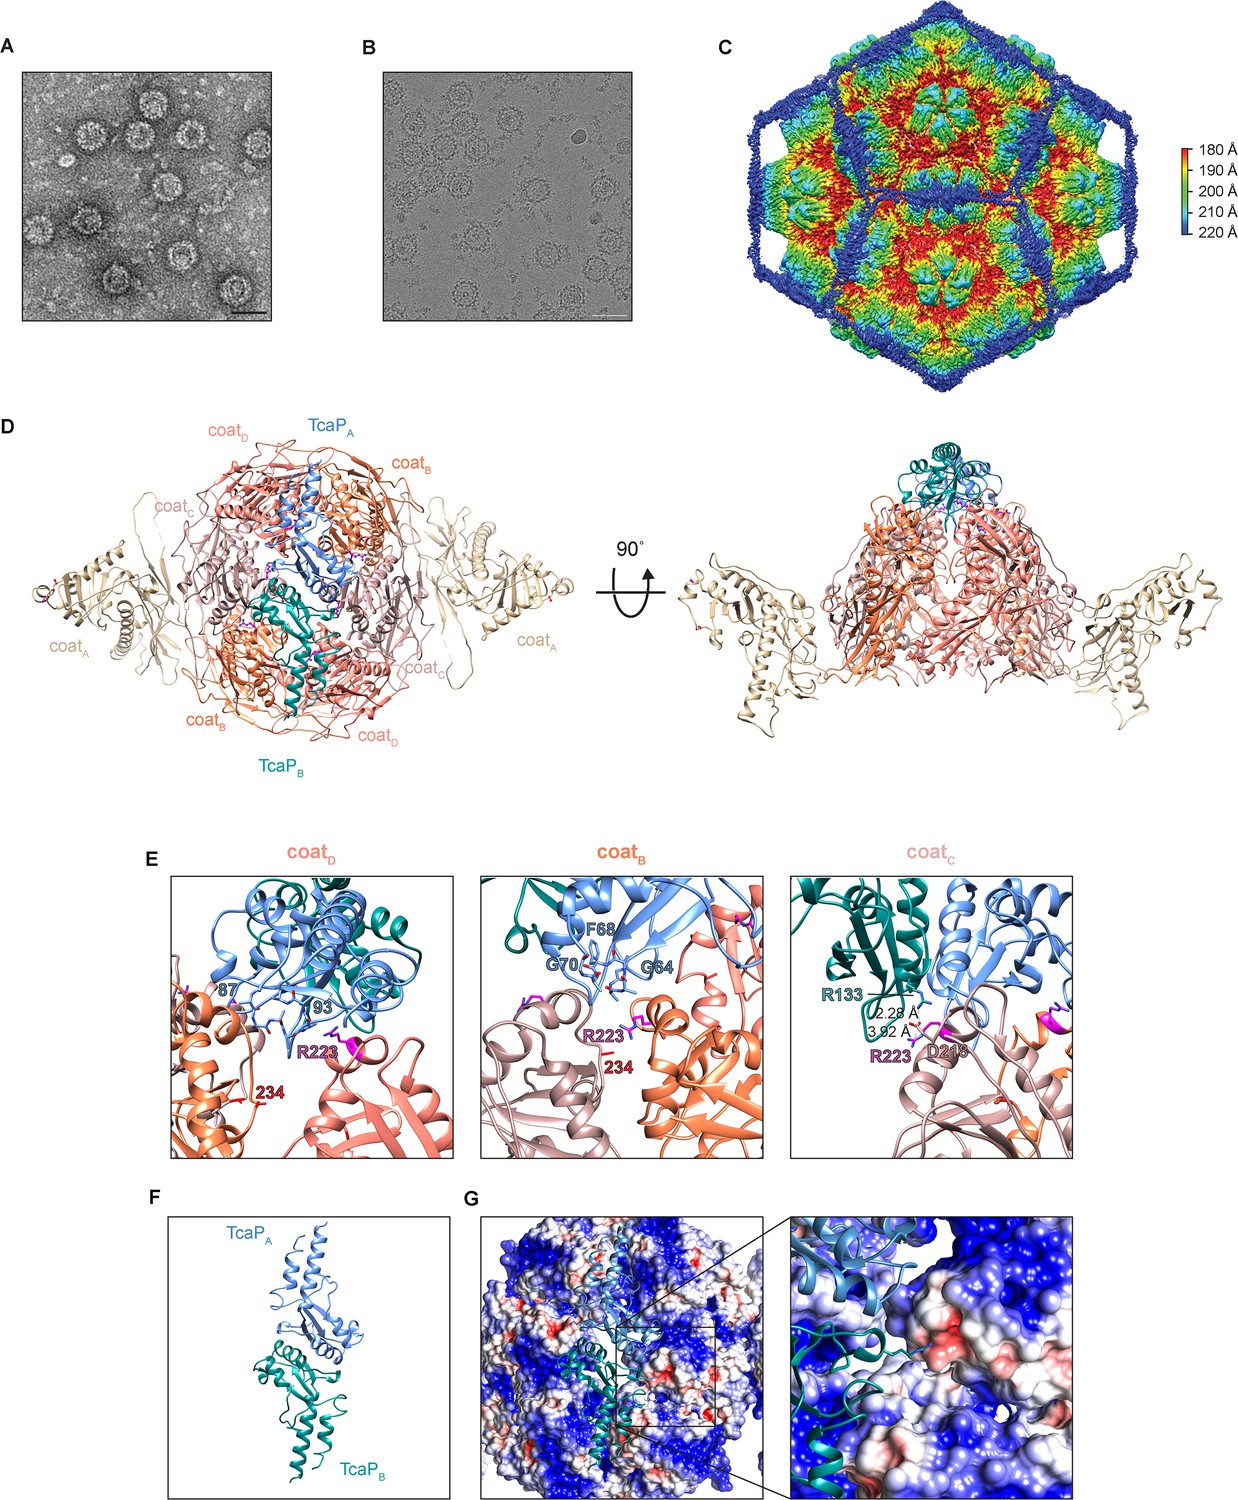
Cryogenic electron microscopy (cryo-EM) reveals TcaP is an external scaffold.
(A, B) Representative micrographs from three independent biological replicates from (A) transmission electron and (B) cryo-electron microscopy of phage-inducible chromosomal island-like element (PLE) procapsid-like particle (PLPs) produced from co-expression of ICP1’s coat and PLE’s TcaP. Scale bars are 50 nm. (C) Isosurface reconstruction of PLE PLPs, resolved to 3.4 Å, colored radially (Å) as indicated in the legend. (D) Ribbon model of the solved structure for eight coat proteins, two from the adjacent pentamers (coatA tan) and six in a hexamer (coatB coral, coatC salmon, and coatD pink), and two partial TcaP proteins (TcaPA blue and TcaPB teal). Substituted residues in coat that escape TcaP-mediated remodeling are shown as balls and sticks (magenta for R223 and red for E234) and lie along the region of the hexamer where TcaP binds. Side chains that could not be fully resolved are modeled as alanines. (E) Details of the interactions between TcaP and the coat subunits. Residues in TcaP that contact coat are shown as sticks. For TcaP, the numbers, colored according to their chain, indicate the first and last residue within the region of contact. Distance measurements between residues are shown as dashed lines and measured in Å. Side chains that could not be fully resolved are modeled as alanines. (F) Ribbon model of the solved structure of the partial TcaP dimer, oriented as in panels (D) and (G). (G) Electrostatic potential surface representation of the coat with a ribbon diagram of TcaP show the negative pocket on coatC that is filled by the positively charged arginine from TcaP. Electrostatic potential is calculated using APBS and the coloring is from –5 kT/e (red) to +5 kT/e (blue).
-
Figure 4—source data 1
Cryogenic electron microscopy (cryo-EM) data collection parameters used to create Figure 4B–G.
- https://cdn.elifesciences.org/articles/87611/elife-87611-fig4-data1-v1.xlsx
-
Figure 4—source data 2
Data reconstruction model parameters used to create Figure 4B–G.
- https://cdn.elifesciences.org/articles/87611/elife-87611-fig4-data2-v1.xlsx
Figure 4—figure supplement 1
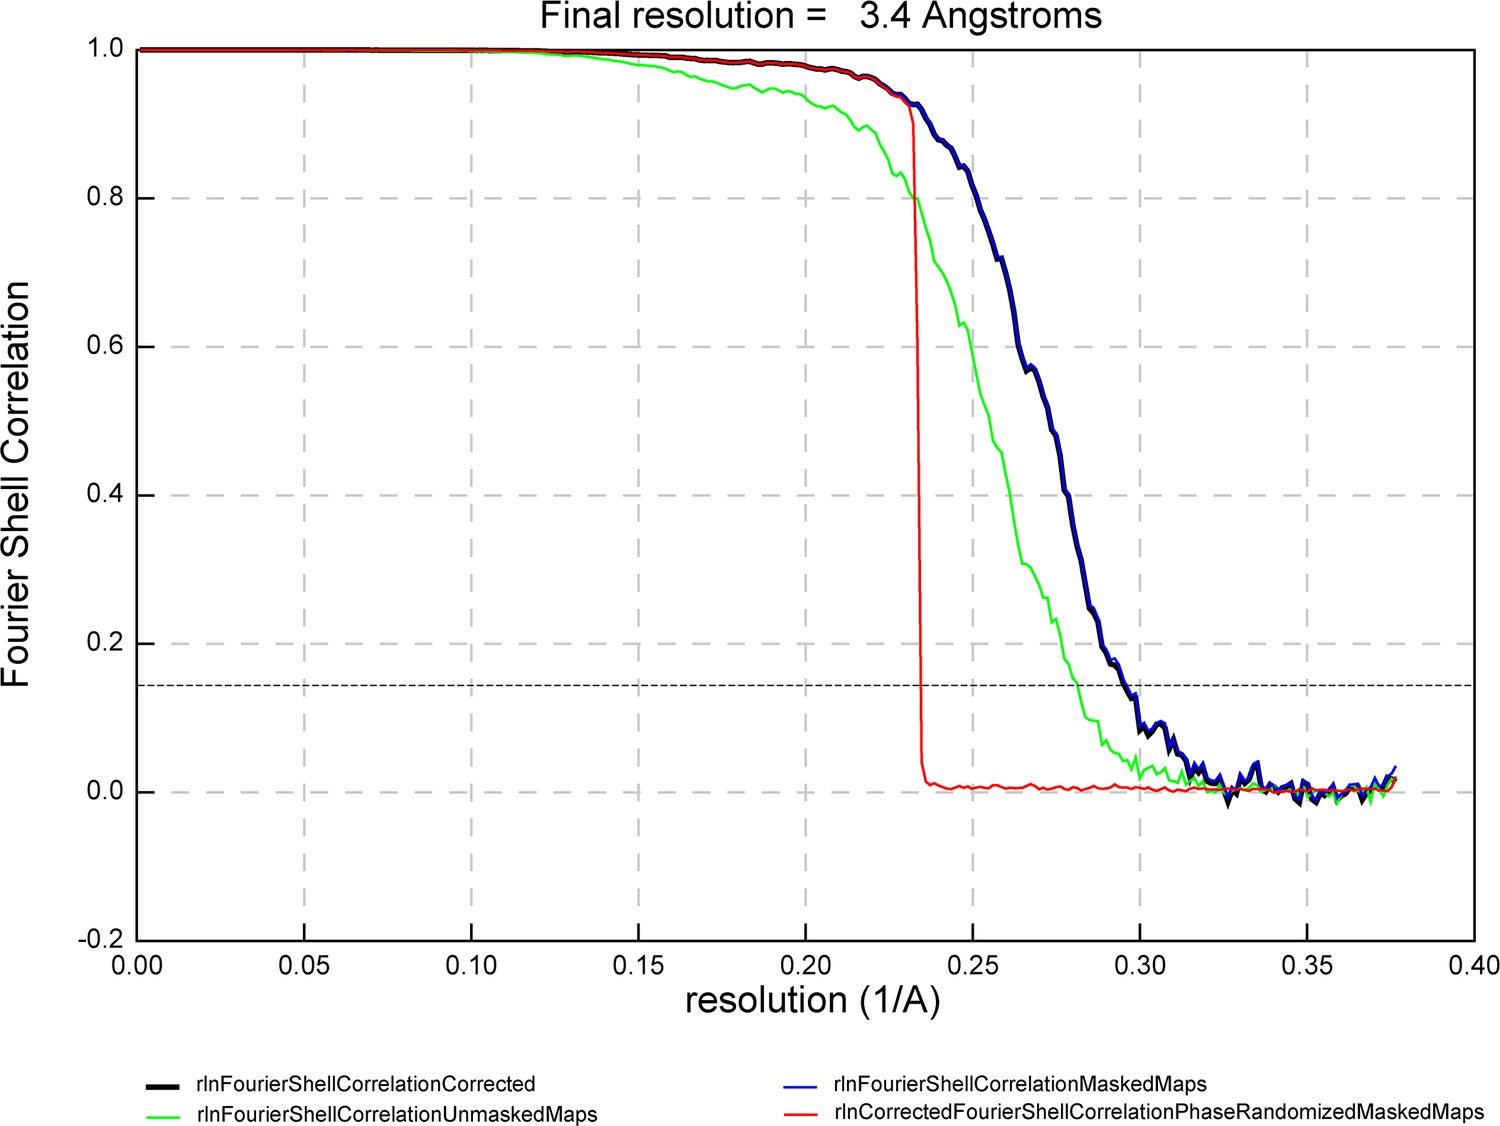
Fourier shell correlation (FSC) curve.
FSC curve for the icosahedral reconstruction of phage-inducible chromosomal island-like element (PLE) procapsid-like particles. The horizontal dashed line indicates the 0.143 threshold.
Figure 4—figure supplement 2
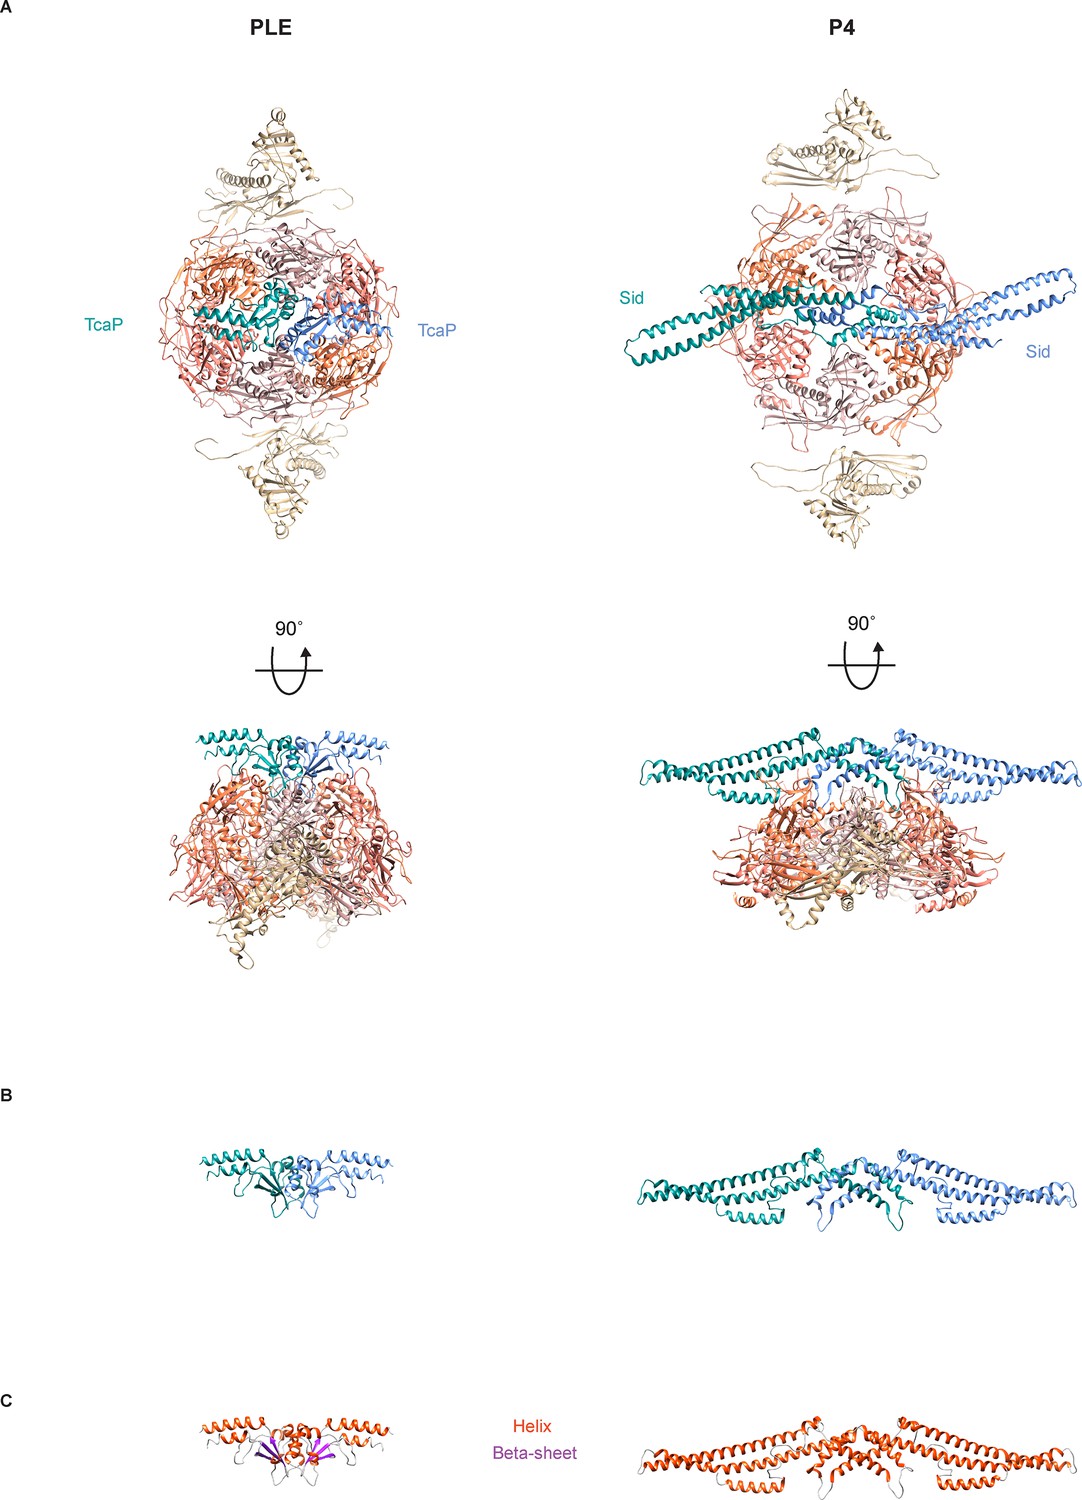
Comparison of TcaP and Sid structures in procapsid-like particles.
(A) Top- and side views of the ribbon models of the solved structure of the phage-inducible chromosomal island-like element (PLE) (left) or P4 (right) (2, PDB 7JW1) procapsid-like particle showing eight coat proteins, two from the adjacent pentamers (tan) and six in a hexamer (two in coral, two in salmon, and two in pink), and two external scaffolding proteins TcaP (A) or Sid (B) (blue and teal). Note that only a fragment of TcaP is shown (34–172 of 298 residues) and side chains that could not be fully resolved are modeled as alanines. (B) Ribbon models of solved TcaP (left) and Sid (right) dimers. The structures are not similar enough to be aligned by MatchMaker in Chimera. (C) Ribbon models of solved TcaP (left) and Sid (right) dimers, colored according to secondary structure: helices (orange), beta sheets (purple).
Figure 5 with 1 supplement
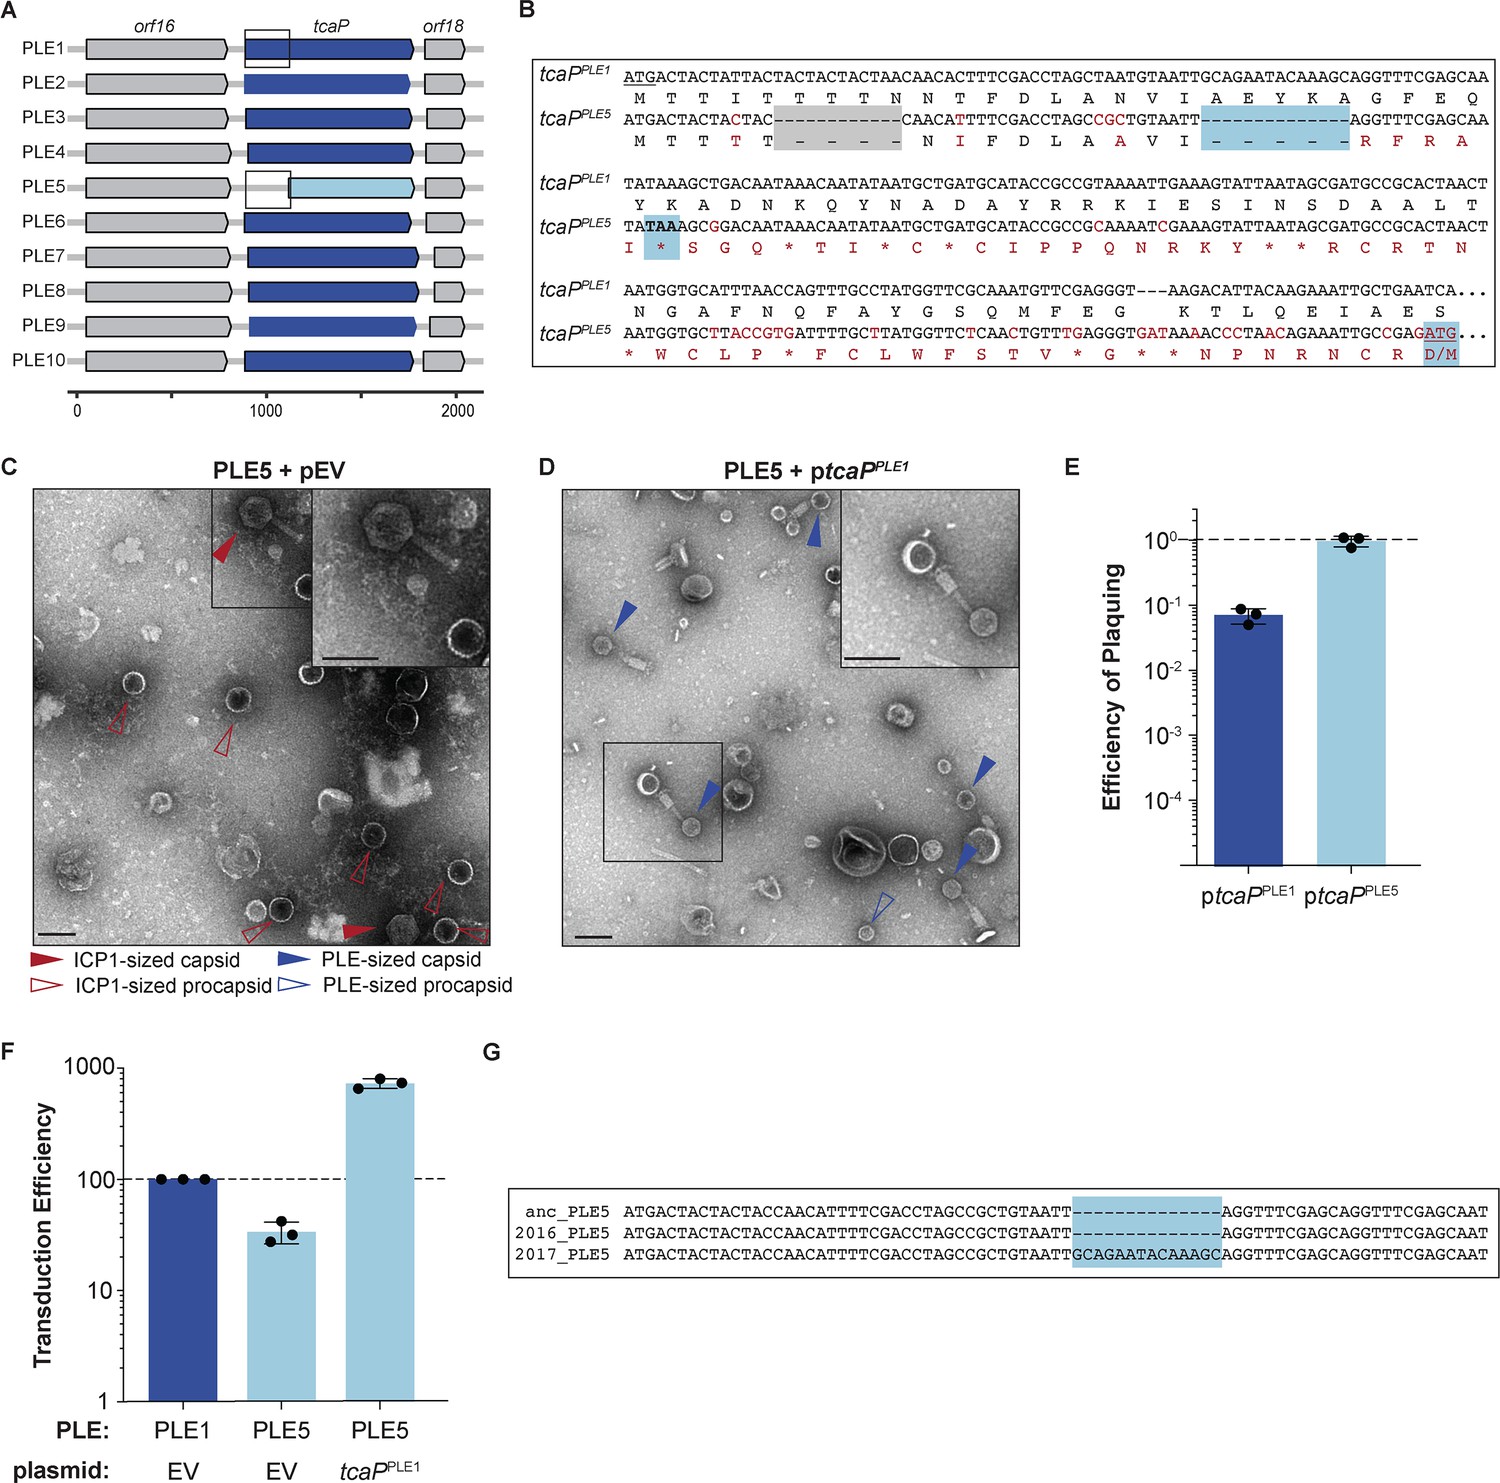
Genetic analysis of tcaP alleles from 10 phage-inducible chromosomal island-like element (PLEs) reveals PLE5’s nonfunctional TcaP variant.
(A) Gene graphs of tcaP and its two neighboring genes, from the 10 known unique PLEs. PLE5’s tcaP, the shortest allele, is shown in light blue, while the other, full-length tcaP alleles are shown in dark blue, and the neighboring genes are shown in gray. Lower scale bar is in nucleotides. Boxes outline regions aligned in (B). (B) Alignment of the region encoding tcaP and their translated products from PLE1 and PLE5 from the boxed regions in panel (A). Nonidentical nucleotides and amino acids are shown in red on the PLE5 sequence, gaps are shown as dashes on either sequence, and stop codons are shown as asterisks. The gray box indicates an in-frame deletion. The blue boxes indicate the notable features of the tcaPPLE5 sequence: the 14-nucleotide deletion that results in the frameshift, the resulting early stop codon, and the ATG and M of the alternative, originally annotated start site, which restores the original reading frame. (C, D) Representative transmission electron micrographs (TEMs) from 2 to 3 independent biological replicates of lysate from ICP1-infected strains of PLE5(+) V. cholerae (C) with an empty vector (pEV), or (D) expressing tcaP from PLE1 (ptcaPPLE1). Scale bars are 100 nm. Arrowheads show capsids and their sizes according to the legend. (E) Efficiency of ICP1 plaquing on V. cholerae expressing tcaP from PLE1 (ptcaPPLE1) or tcaP from PLE5 (ptcaPPLE5) (from the originally annotated start site producing the truncated allele) compared to an empty vector (pEV). Each dot represents a biological replicate, bars represent the mean, and error bars show the standard deviation. The dotted line indicates an efficiency of plaquing of 1, where the expression of TcaP is not inhibitory to plaque formation. (F) Transduction efficiency of the strain indicated relative to PLE1 with an empty vector. Each dot represents a biological replicate, bars represent the mean, and error bars show standard deviation. The dotted line indicates an efficiency of 100%. (G) Alignment of the first nucleotides of the tcaP alleles from the PLE5 variants encoding the ‘ancestral’ (anc) sequences from before 1991, from 2016, or from 2017. The light blue box highlights the 14-nucleotide insertion in the PLE5 sequence from 2017.
-
Figure 5—source data 1
Data used to create Figure 5E.
- https://cdn.elifesciences.org/articles/87611/elife-87611-fig5-data1-v1.xlsx
-
Figure 5—source data 2
Data used to create Figure 5F.
- https://cdn.elifesciences.org/articles/87611/elife-87611-fig5-data2-v1.xlsx
-
Figure 5—source data 3
Uncropped micrographs used to create Figure 5C and D.
- https://cdn.elifesciences.org/articles/87611/elife-87611-fig5-data3-v1.zip
Figure 5—figure supplement 1
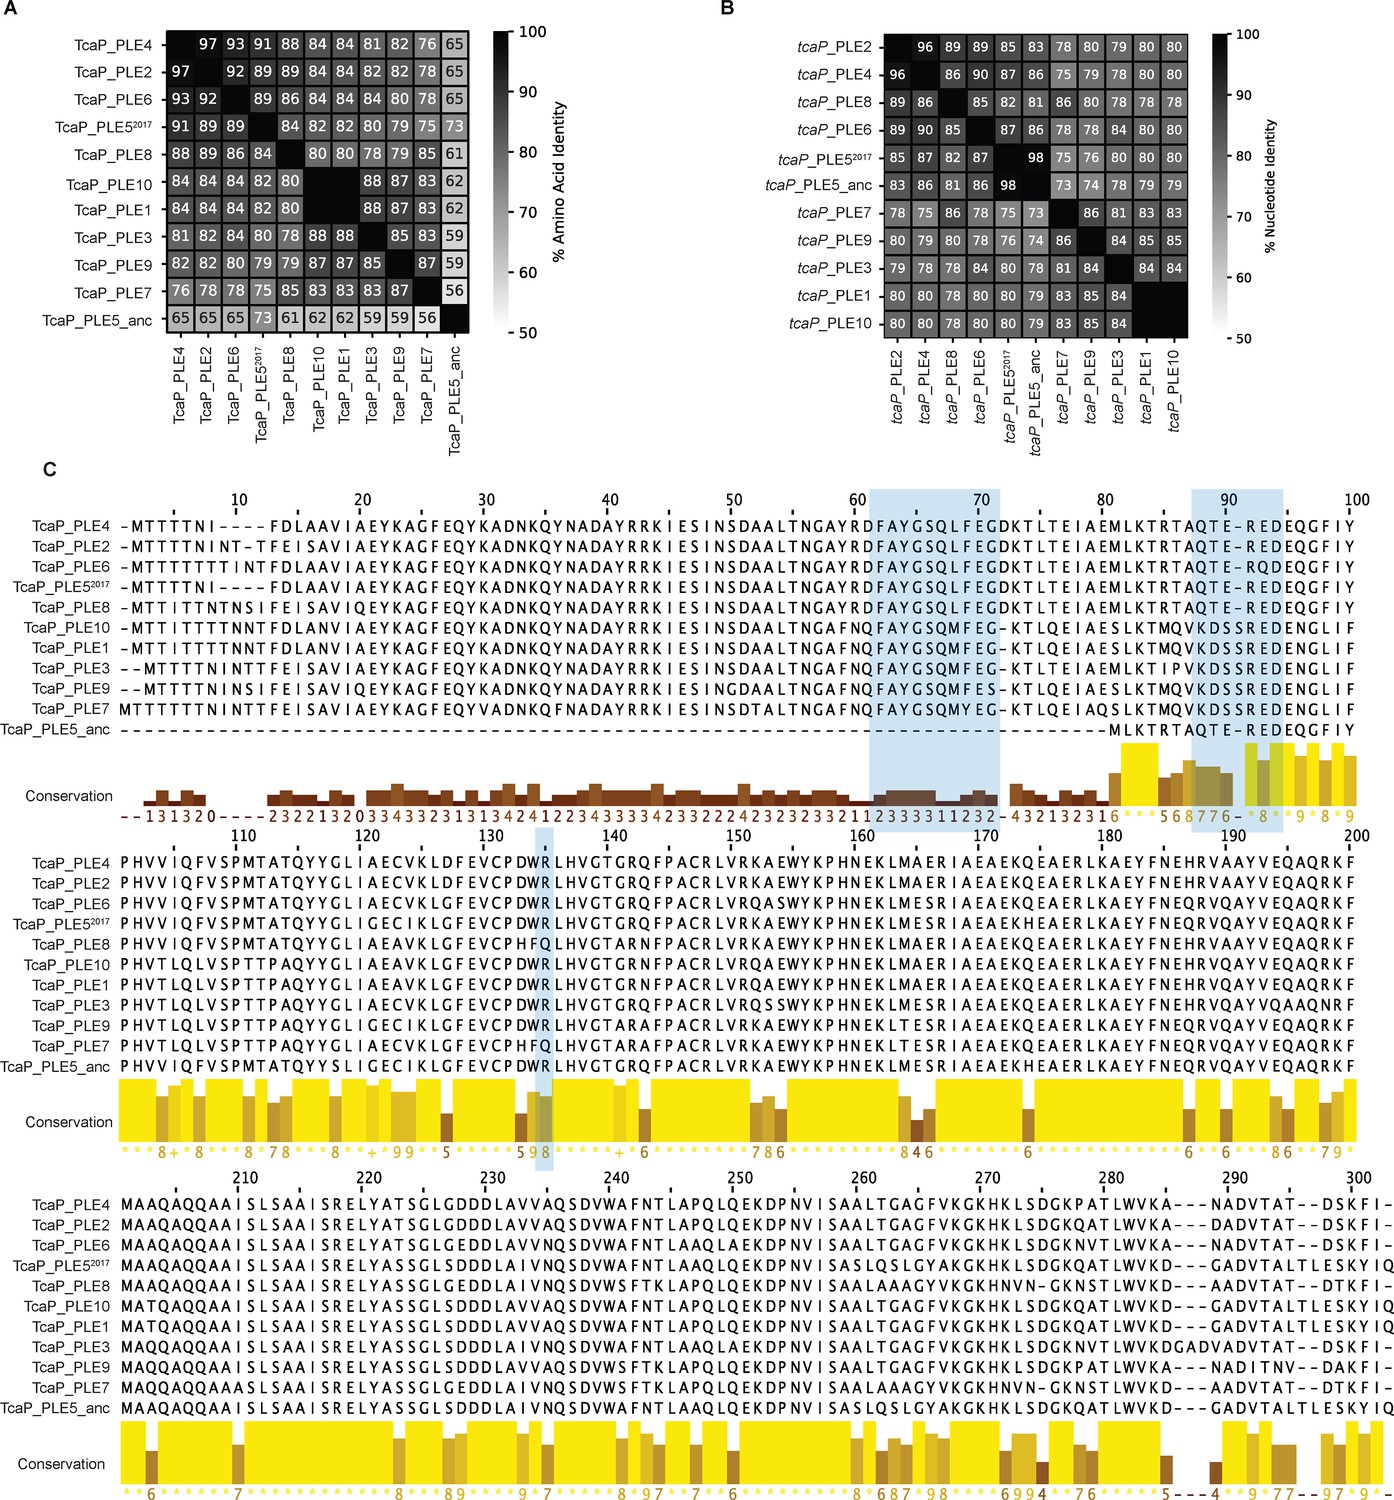
All phage-inducible chromosomal island-like element (PLEs) encode tcaP alleles.
(A) Percent identity between TcaP proteins, calculated in CLC (V.20.0.4). The sequence from TcaP_PLE5_anc (sequences from before 1991) is translated from the second start site relative to TcaP_PLE1. (B) Percent identity between tcaP genes, calculated in CLC (V.20.0.4). The nucleotide sequences start relative to PLE1 for both PLE5 alleles. (C) An alignment of all TcaP protein sequences. Bar height and color indicate conservation. Blue shading indicates regions of TcaP_PLE1 that contact the coat proteins in the procapsid-like particle (PLP).
Figure 6
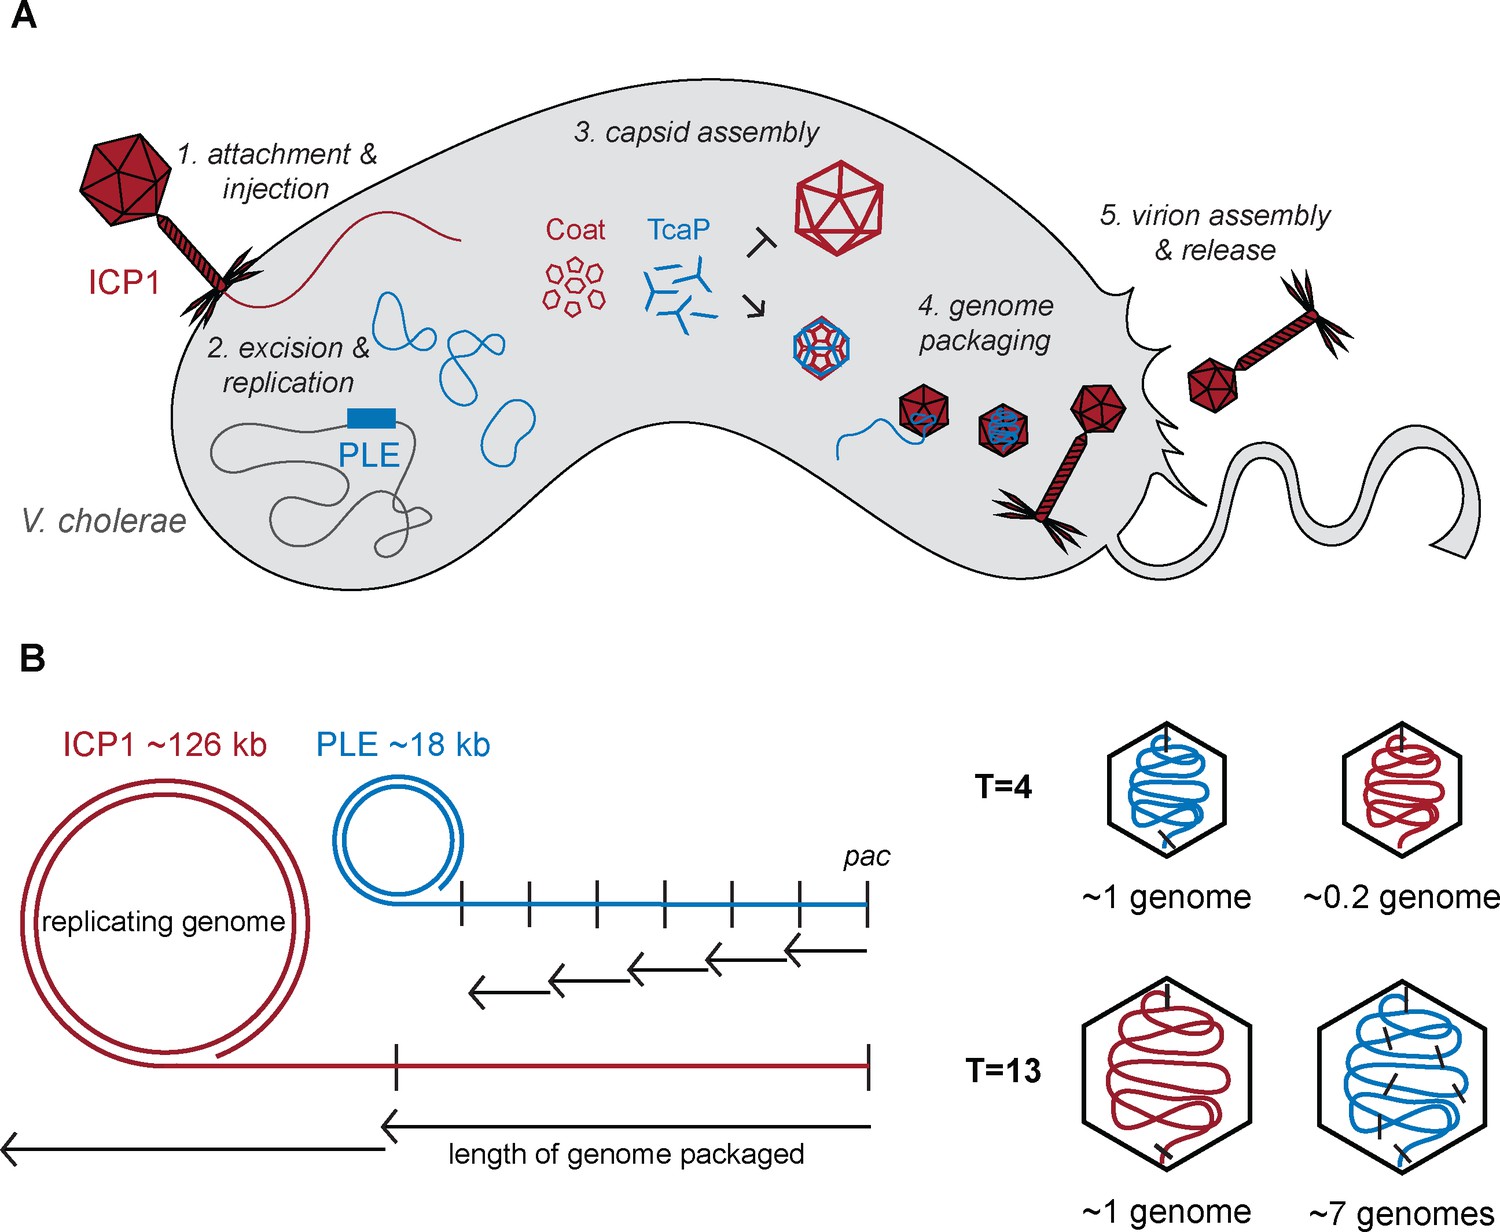
Model of TcaP-mediated small capsid assembly.
(A) A cartoon model of ICP1 infecting a PLE(+) V. cholerae cell. Injection of ICP1’s genome triggers activation of phage-inducible chromosomal island-like element (PLE), then TcaP directs the assembly of coat proteins into small capsids, inhibiting the formation of large capsids. PLE’s genome is then packaged into the small capsids, a process that likely triggers the removal of the external scaffold, TcaP. PLE virions are released from the cell. ICP1 components are red, PLE components are blue, and V. cholerae components are grey. (B) A model showing the impact of capsid size on genome packaging. The replicated ICP1 and PLE genomes form concatemers, from one pac site (indicated as a vertical line) to the next. Headful packaging results in ~105–110% of the genome within the capsid. The length of the genome packaged is indicated by the small arrows for T = 4 capsids and longer arrows for T = 13 capsids. ICP1’s genome is partially packaged into a T = 4 capsid and several copies of PLE’s genome are packaged into a T = 13 capsid. ICP1’s genome is red and PLE’s is blue.
Tables
Key resources table
| Reagent type (species) or resource | Designation | Source or reference | Identifiers | Additional information |
|---|---|---|---|---|
| Genetic reagent (V. cholerae) | ptcaPPLE1 | This paper | CMB2 | V. cholerae E7946 pKL06 PtacRiboE4-tcaP (PLE1); strepR1, cmR2 |
| Genetic reagent (V. cholerae) | pEV5 | This paper | CMB3 | V. cholerae E7946 pKL06 Ptac RiboE-Empty Vector; strepR, cmR |
| Genetic reagent (V. cholerae) | ptcaPPLE5 | This paper | CMB41 | V. cholerae E7946 pKL06 Ptac RiboE-tcaP (PLE5); strepR, cmR |
| Genetic reagent (V. cholerae) | PLE1∆tcaP pEV | This paper | CMB71 | V. cholerae E7946 PLE1::kanR∆tcaP pKL06 PtacRiboE-EV; strepR, cmR, kanR3 |
| Genetic reagent (V. cholerae) | PLE1∆tcaP ptcaPPLE1 | This paper | CMB73 | V. cholerae E7946 PLE1::kanR∆tcaP pKL06 PtacRiboE-tcaP (PLE1); strepR, cmR, kanR |
| Genetic reagent (Escherichia coli) | pcoat::6xHis, pEV | This paper | CMB548 | E. coli BL21 pETDUET6 Ptac-gp122::6xHis, Ptac-EV |
| Genetic reagent (E. coli) | pcoat::6xHis, ptcaP | This paper | CMB555 | E. coli BL21 pETDUET Ptac-gp122::6xHis, Ptac-tcaP |
| Genetic reagent (E. coli) | pcoat::6xHis, pscaffold | This paper | CMB560 | E. coli BL21 pETDUET Ptac-gp122::6xHis, Ptac-gp124 |
| Genetic reagent (E. coli) | pscaffold-decoration-coat::6xHis, ptcaP | This paper | CMB562 | E. coli BL21 pETDUET Ptac-gp124-gp123-gp122::6xHis, Ptac-tcaP |
| Genetic reagent (E. coli) | pscaffold-decoration-coat::6xHis, pEV | This paper | CMB568 | E. coli BL21 pETDUET Ptac-gp124-gp123-gp122::6xHis, Ptac-tcaP |
| Genetic reagent (V. cholerae) | PLE1 pEV | This paper | CMB577 | V. cholerae E7946 PLE1::kanR pKL06.2 PtacRiboE-EV; strepR, cmR, kanR3 |
| Genetic reagent (V. cholerae) | PLE5 pEV | This paper | CMB579 | V. cholerae E7946 PLE5::kanR pKL06.2 PtacRiboE-EV; strepR, cmR, kanR3 |
| Genetic reagent (V. cholerae) | PLE5 ptcaP PLE1 | This paper | CMB581 | V. cholerae E7946 PLE5::kanR pKL06.2 PtacRiboE-tcaP(PLE1); strepR, cmR, kanR3 |
| Genetic reagent (E. coli) | pscaffold-decoration-coat R223H::6xHis, pEV | This paper | CMB603 | E. coli BL21 pETDUET Ptac-gp124-gp123-gp122R223H::6xHis, Ptac-EV |
| Genetic reagent (E. coli) | pscaffold-decoration-coat R223H::6xHis, ptcaP | This paper | CMB604 | E. coli BL21 pETDUET Ptac-gp124-gp123-gp122R223H::6xHis, Ptac-tcaP |
| Genetic reagent (E. coli) | pcoat R223H::6xHis, pEV | This paper | CMB605 | E. coli BL21 pETDUET Ptac-gp122R223H::6xHis, Ptac-EV |
| Genetic reagent (E. coli) | pcoatR223H::6xHis, ptcaP | This paper | CMB606 | E. coli BL21 pETDUET Ptac-gp122R223H::6xHis, Ptac-tcaP |
| Genetic reagent (E. coli) | pcoat::6xHis, ptcaP; pcoat | This paper | CMB609 | E. coli BL21 pETDUET Ptac-gp122::6xHis, Ptac-tcaP and pCDFDuet Ptac-gp122 |
| Genetic reagent (E. coli) | pcoat E234K::6xHis, pEV | This paper | CMB574 | E. coli BL21 pETDUET Ptac-gp122E234K::6xHis, Ptac-EV |
| Genetic reagent (E. coli) | pcoat E234K::6xHis, ptcaP | This paper | CMB575 | E. coli BL21 pETDUET Ptac-gp122E234K::6xHis, Ptac-tcaP |
| Genetic reagent (E. coli) | pcoat E234K::6xHis, pscaffold | This paper | CMB576 | E. coli BL21 pETDUET Ptac-gp122E234K::6xHis, Ptac-gp124 |
| Genetic reagent (bacteriophage ICP1) | ICP1 wild type | McKitterick et al., 2019 | KSΦ49 | ICP1_2011_Dha_A ∆spacer 9 (accession: MH310933) |
| Genetic reagent (bacteriophage ICP1) | ICP1 coat R223H | This paper | Phage 1, DDΦ78 | ICP1_2011_Dha_A ∆spacer 9 Gp122R223H |
| Genetic reagent (bacteriophage ICP1) | ICP1 coat E234K | This paper | Phage 2, DDΦ79 | ICP1_2011_Dha_A ∆spacer 9 Gp122E234K |
| Gene (bacteriophage ICP1) MH310933 | gp122; coat | N/A | Locus tag: ICP12011A_121 protein accession: AXY82215.1 | Major capsid protein |
| Gene (bacteriophage ICP1) MH310933 | gp123; decoration | N/A | Locus tag: ICP12011A_122 protein accession: AXY82216.1 | Capsid decoration protein |
| Gene (bacteriophage ICP1) MH310933 | gp124; scaffold | N/A | Locus tag: ICP12011A_123 protein accession: AXY82217.1 | Capsid assembly scaffolding protein |
| Gene (V. cholerae) KC152960.1 | orf17; tcaP (PLE1) | N/A | Locus tag: orf17 protein accession: AGG09411.1 | Satellite external scaffolding protein |
| Gene (V. cholerae) CP001236.1 | orf17; tcaP (PLE5_2008) | N/A | Locus tag: VC395_ A0477 Protein accession: ACP11313.1 | Satellite external scaffolding protein |
| Gene (V. cholerae) CP045718.1 | orf17; tcaP (PLE5_2016) | N/A | Locus tag: GG844_ 03730 Protein accession: QGF30303.1 | Satellite external scaffolding protein |
| Gene (V. cholerae) Assembly: GCF_007050395.1 | orf17; tcaP (PLE5_2017) | N/A | Locus tag: DM782_ RS18270 Protein accession: WP_001912195.1 | Satellite external scaffolding protein |
| Commercial assay or kit | NEBNext Ultra II DNA Library preparation kit | New England Biolabs | NEB #E7645, E7103 | |
| Commercial assay or kit | DNeasy blood and tissue DNA purification kit | QIAGEN | QIAGEN 69506 | |
| Software, algorithm | cryoSPARC | Punjani et al., 2017 | cryoSPARC v4.0.3 | |
| Software, algorithm | RELION | Kimanius et al., 2021 | RELION 4.0 | |
| Software, algorithm | AlphaFold2 | Jumper et al., 2021 | AlphaFold2 | |
| Software, algorithm | Phenix | Liebschner et al., 2019 | Phenix | |
| Software, algorithm | COOT | Emsley et al., 2010 | COOT | |
| Software, algorithm | Pyem | Asarnow et al., 2019 | Pyem |
Additional files
-
Supplementary file 1
Escape mutation information.
Phages genetically escaped TcaP’s inhibition. These phages were purified and sequenced.
- https://cdn.elifesciences.org/articles/87611/elife-87611-supp1-v1.xlsx
-
Supplementary file 2
Mass spectrometry results of PLPs.
ICP1 and PLE procapsid-like-particles were produced, purified, and subjected to mass spectrometry.
- https://cdn.elifesciences.org/articles/87611/elife-87611-supp2-v1.xlsx
-
Supplementary file 3
Oligos used in this study.
Engineered plasmids and strains were constructed using these oligos.
- https://cdn.elifesciences.org/articles/87611/elife-87611-supp3-v1.xlsx
-
MDAR checklist
- https://cdn.elifesciences.org/articles/87611/elife-87611-mdarchecklist1-v1.docx
Download links
A two-part list of links to download the article, or parts of the article, in various formats.
Downloads (link to download the article as PDF)
Open citations (links to open the citations from this article in various online reference manager services)
Cite this article (links to download the citations from this article in formats compatible with various reference manager tools)
A Vibrio cholerae viral satellite maximizes its spread and inhibits phage by remodeling hijacked phage coat proteins into small capsids
eLife 12:RP87611.
https://doi.org/10.7554/eLife.87611.3


