Dissecting muscle synergies in the task space
- School of Biomedical Sciences, University of Leeds, United Kingdom
Figures
Figure 1
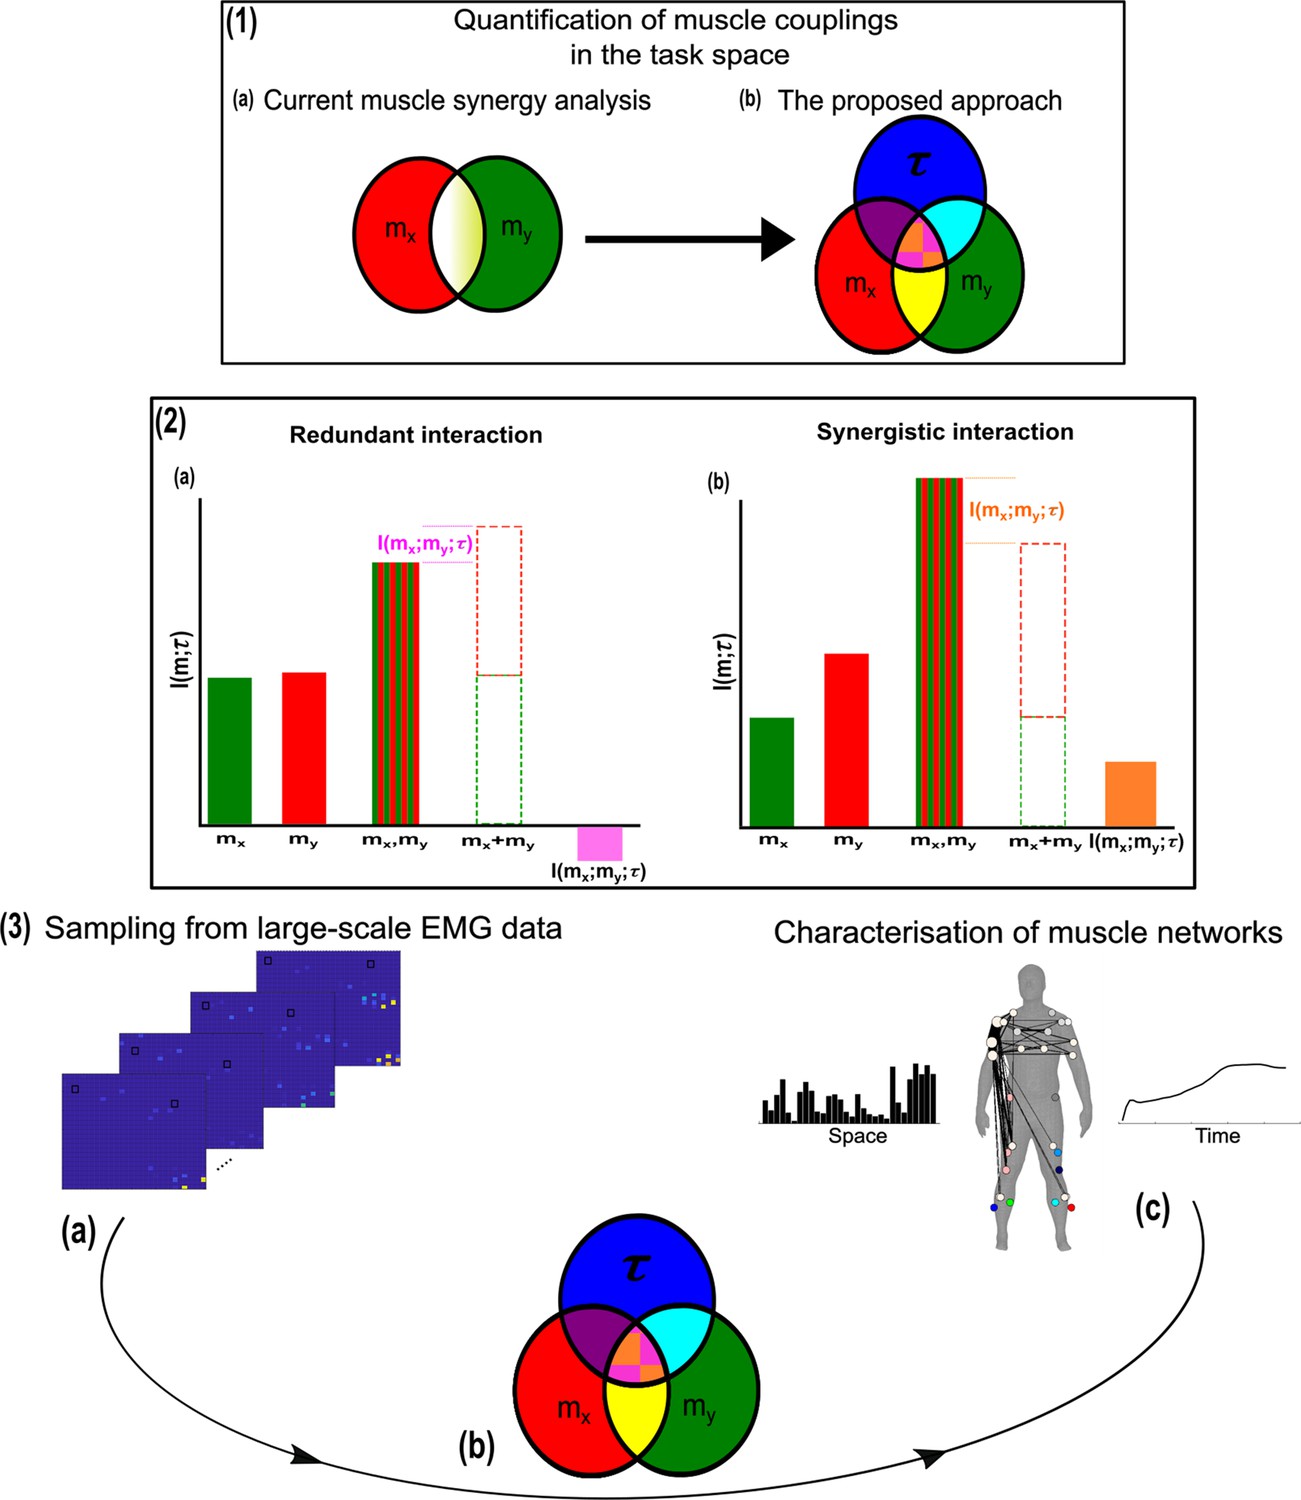
A general outline of the proposed approach.
(1.1a, b) We propose a novel approach to mapping muscle couplings to the task space. Among current muscle synergy analysis approaches, muscle couplings are quantified in isolation of the task solely using dimensionality reduction. Using our approach, the functional characteristics of muscle interactions can be quantified in terms of the similarity of their encoded task information. We do so by determining the coupling between and a corresponding task parameter () using mutual information (MI). From this perspective, task-redundant muscle couplings (pink shaded area in pink-orange intersection) represent muscles cooperating towards similar task-goals, while task-synergistic muscle couplings (orange shaded area in pink-orange intersection) encapsulate the task information provided by a muscle pairing acting towards complementary task-goals. Muscle couplings present across tasks (i.e. task-irrelevant) are quantified by conditioning the MI between pairs with respect to (yellow intersection). (1.2) A description of redundant and synergistic interactions. (a) Net redundant interactions are defined by a greater amount of information generated by the sum of individual observation of and () than their simultaneous observation (). (b) In a net synergistic interaction, provides more information than . (1.3a, c) An overview of the approach. Spatiotemporal muscle activation samples are extracted across trials from large-scale electromyographic (EMG) datasets and concatenated into vectors, forming pairs.The derived muscle couplings are then run through the network information framework (NIF) pipeline (Ó’ Reilly and Delis, 2022), producing low-dimensional, multiplexed space–time muscle networks.
Figure 2
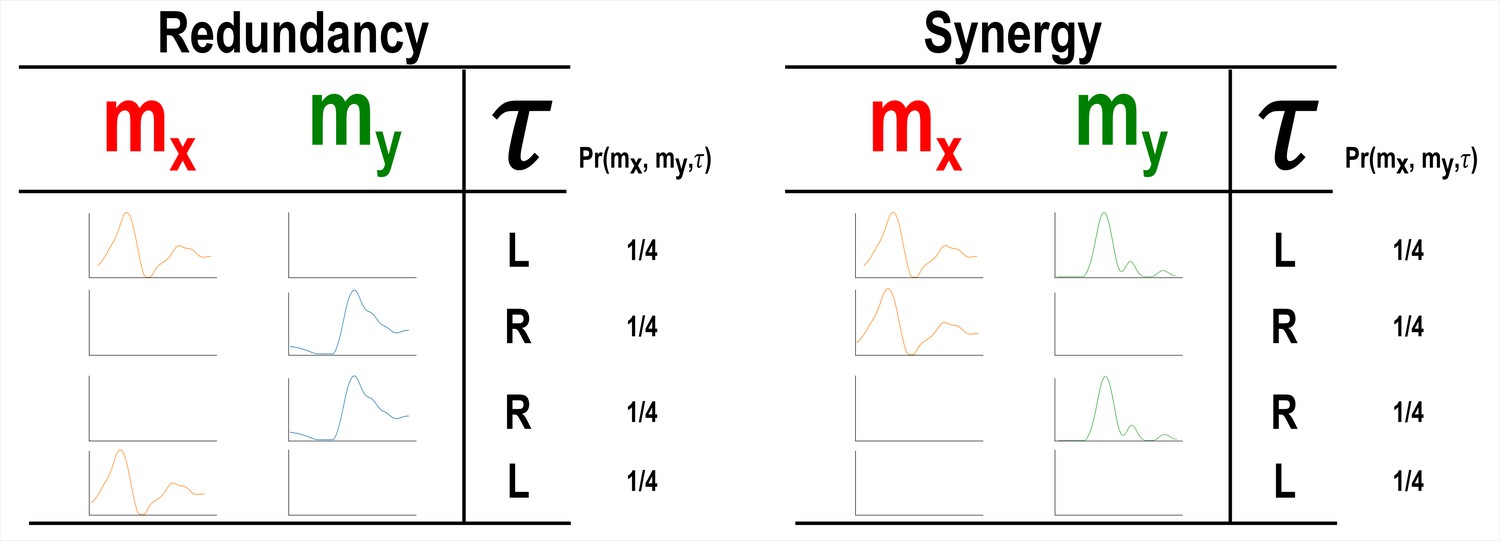
A simulation demonstrating how informational redundancy and synergy can be interpreted when applied to the muscle space.
Four observations of a given muscle pair ( and ) that can fall into two equiprobable on and off activation states and a corresponding task parameter () describing left (L) or right (R) movement direction. Observing either or in the redundancy example gives 1 bit of information while observing both and together in the synergy example gives 1 bit of information.
Figure 3
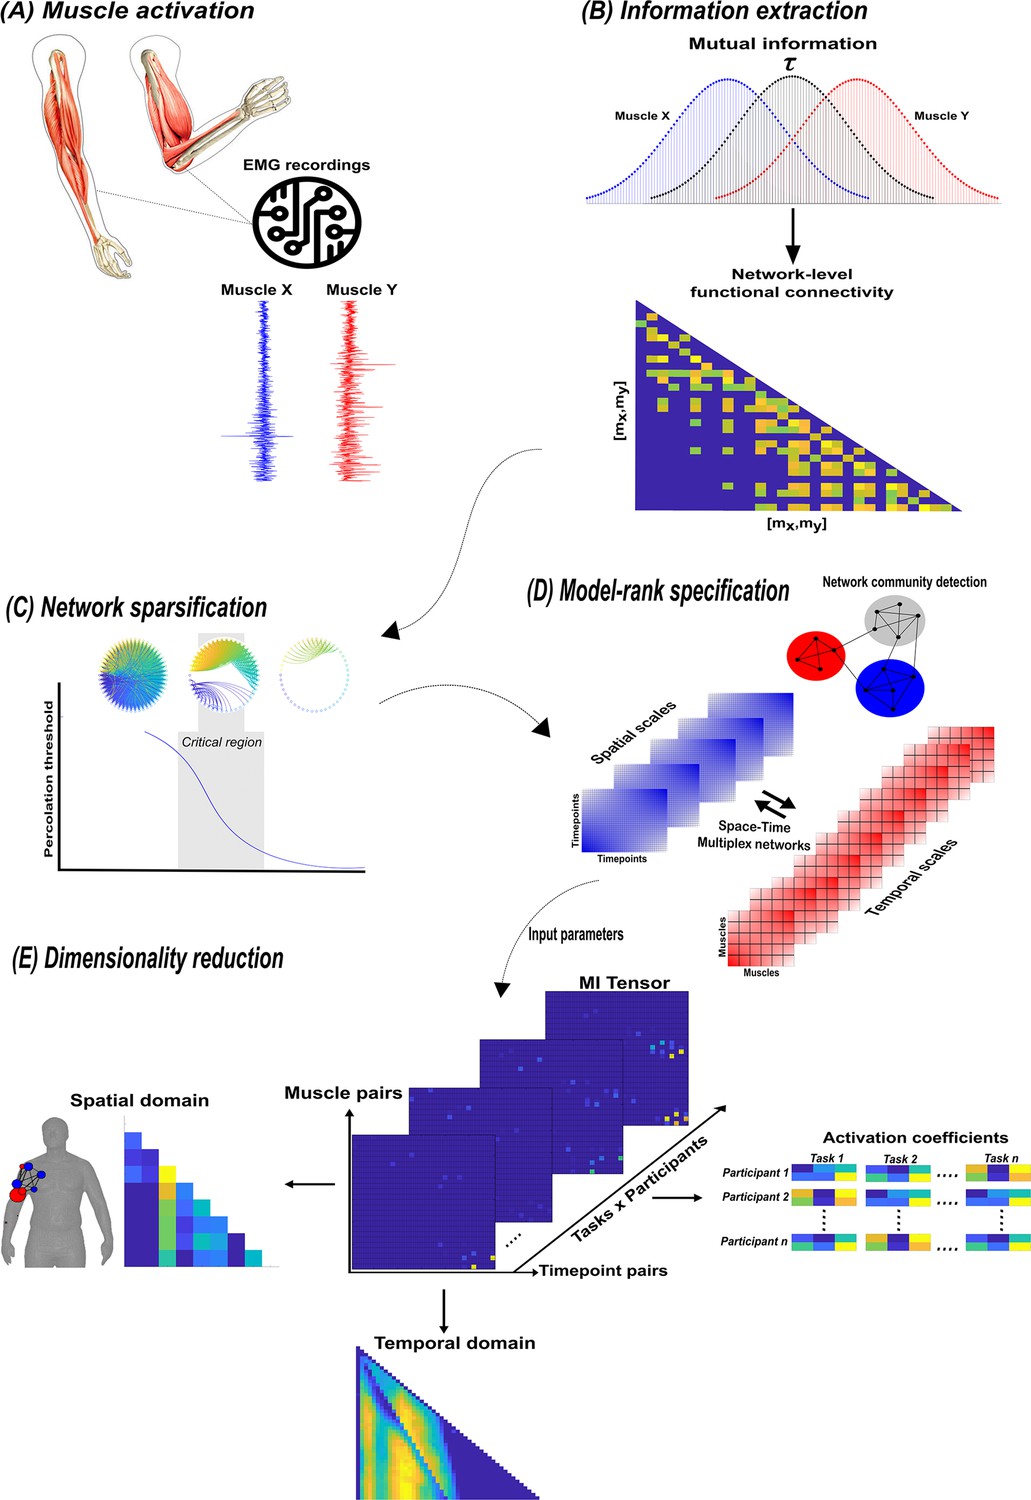
A summary of the network information framework (NIF) pipeline.
(A) Large-scale datasets of electromyographic (EMG) signals are captured while participants perform various motor tasks (Delis et al., 2014; Hilt et al., 2018; Camargo et al., 2021). (B) The mutual information (MI) between all unique muscle-timepoint vector ( combinations with respect to a corresponding task parameter () is determined (Ince et al., 2017), forming a network of functional connectivities. (C) These adjacency matrices are then analysed in terms of statistical significance and modular structure using percolation theory (Ó’ Reilly and Delis, 2022). (D) The optimal spatial and temporal model-ranks are determined using generalised, consensus-based network community detection methods (Blondel et al., 2008; Mucha et al., 2010; Lancichinetti and Fortunato, 2012; Rubinov and Sporns, 2010). (E) The optimal model-ranks are used as input parameters for dimensionality reduction, where space–time muscle networks along with their underlying activation coefficients are concurrently extracted (Delis et al., 2014).
Figure 4
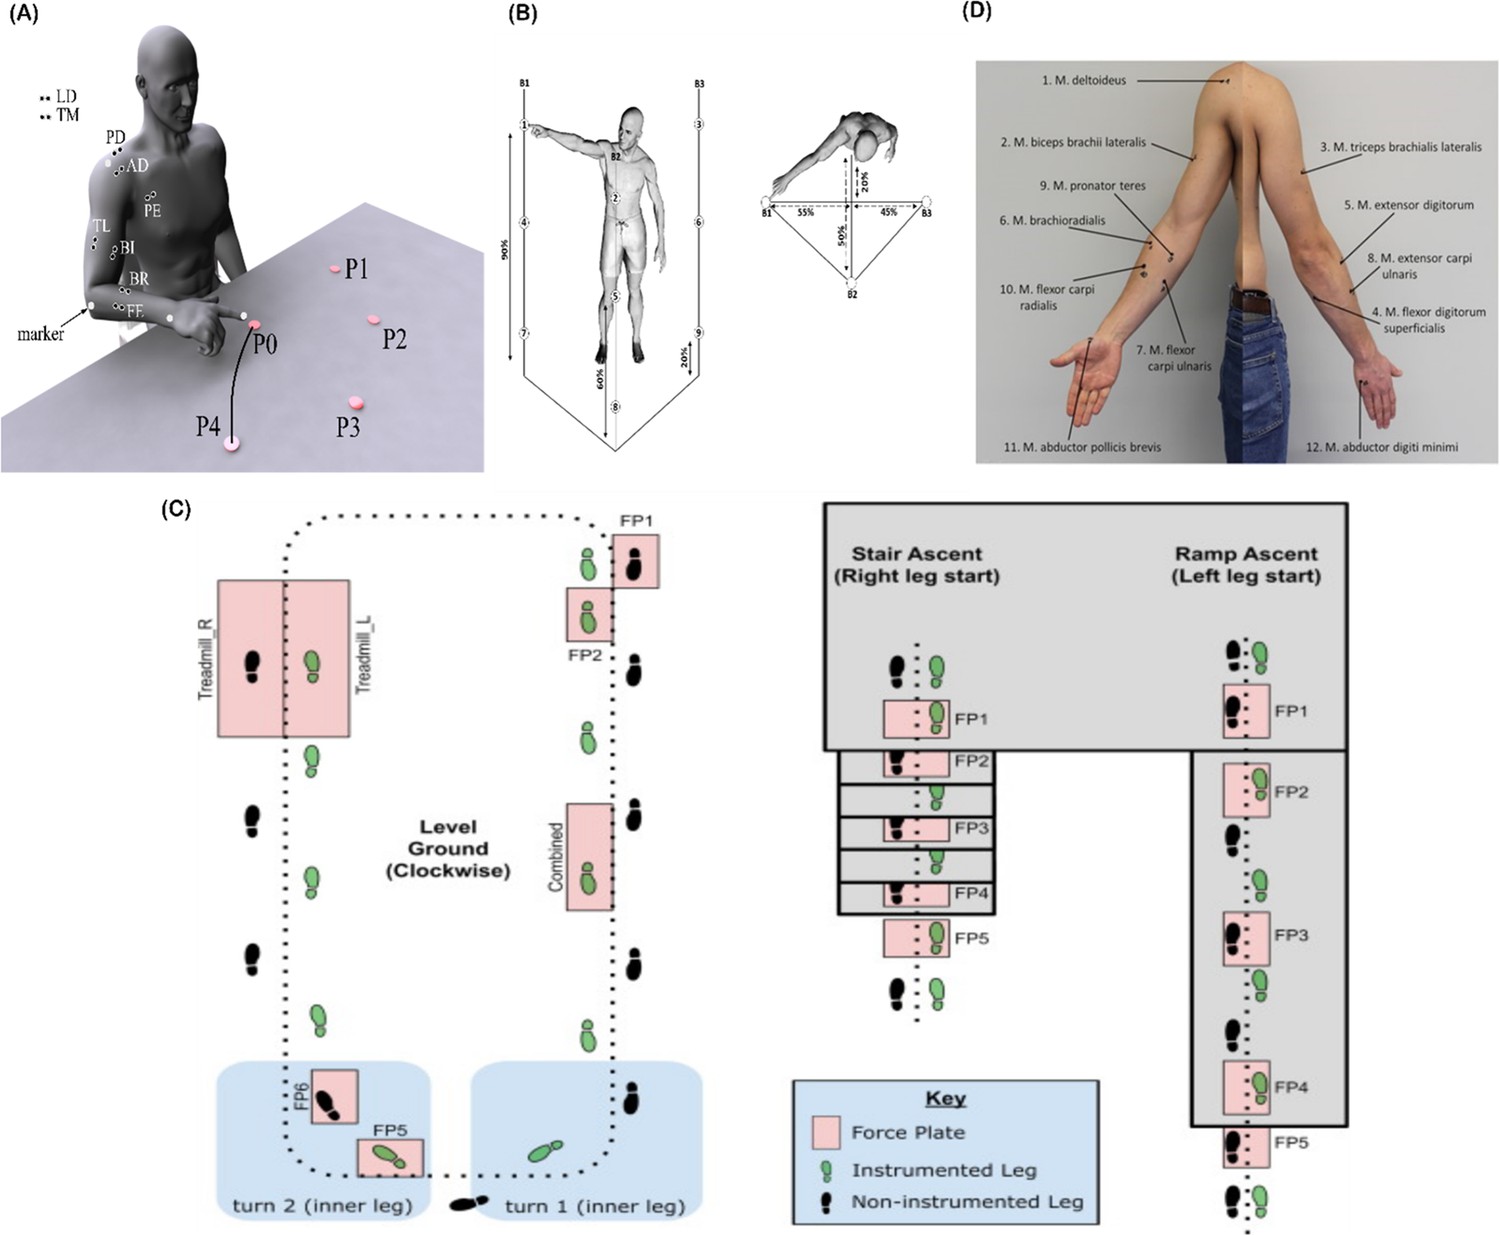
Graphical illustrations of each of the datasets analysed in the current study.
(A) Dataset 1 consisted of participants executing table-top point-to-point reaching movements (40 cm distance from starting point P0) across four targets in forward (P1–P4) and backwards (P5–P8) directions at both fast and slow speeds (40 repetitions per task) (Delis et al., 2014). The muscles recorded included the finger extensors (FE), brachioradialis (BR), biceps brachii (BI), medial-triceps (TM), lateral-triceps (TL), anterior deltoid (AD), posterior deltoid (PD), pectoralis major (PE), latissimus dorsi (LD) of the right, reaching arm. (B) For dataset 2, the activity of 30 muscles was recorded while participants performed whole-body point-to-point reaching movements across three different heights and bars and in various directions, accumulating to 72 unique reaching tasks (Hilt et al., 2018). (C) The circuit navigated by participants in dataset 3 as they executed various locomotion modes is illustrated, of which level-ground walking, stair- and ramp-ascent/descent were analysed in the current study (Camargo et al., 2021). Several sub-conditions were undertaken by participants for each locomotion mode including different walking speeds, clockwise vs. counter-clockwise direction, different stair heights and ramp inclines, etc. Participants executed these tasks while the electromyography (EMG) of 11 muscles on the right leg gluteus medius (GlutM), right external oblique (Obl), semitendinosus (ST), gracilis (GR), biceps femoris (BF), rectus femoris (RF), vastus lateralis (VL), vastus medialis (VM), soleus (SO), tibialis anterior (TA), gastrocnemius medialis (GM) along with kinematic, dynamic, and inertial motion unit (IMU) signals were captured. (D) The EMG placement for dataset 4 [deltoideus pars clavicularis (DC), biceps brachii (BB), triceps brachii (TB), flexor digitorum superficialis (FDS), extensor digitorum (ED), brachioradialis (BR), flexor carpi ulnaris (FCU), extensor carpi ulnaris (ECU), pronator teres (PT), flexor carpi radialis (FCR), abductor pollicus brevis (APB), abductor digiti minimi (ADM)] (Averta et al., 2021). A single trial was taken from 25 healthy and 20 post-stroke participants performing a unilateral pointing movement with the index finger and arm outstretched (task 9 of the Softpro protocol [MHH]).
Figure 5
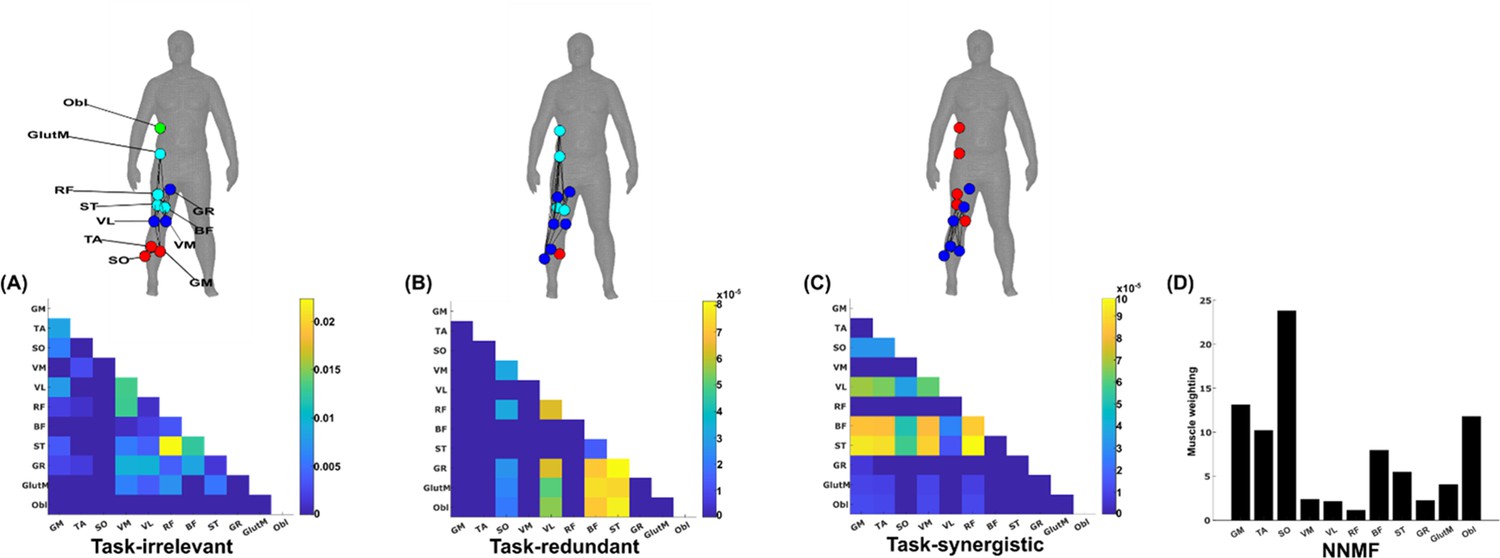
A simplified example output from the proposed framework applied to a single trial of turning gait from dataset 3.
(A) Task-irrelevant, (B) task-redundant, and (C) task-synergistic synchronous muscle couplings were quantified (the unit of shared information is 1 bit) with respect to the heel kinematic marker (anterior–posterior direction). Human body models accompanying each spatial network illustrate their respective submodular structure with node colour and size and edge width indicating community affiliation (Blondel et al., 2008), network centrality and connection strength, respectively (Makarov et al., 2015; Benzi and Klymko, 2013). (D) A corresponding synergy representation from a single trial of turning gait from dataset 3 extracted using the spatial model from current approaches (Tresch et al., 1999). Each bar represents the relative weighting of each muscle in the synergy component.
Figure 6
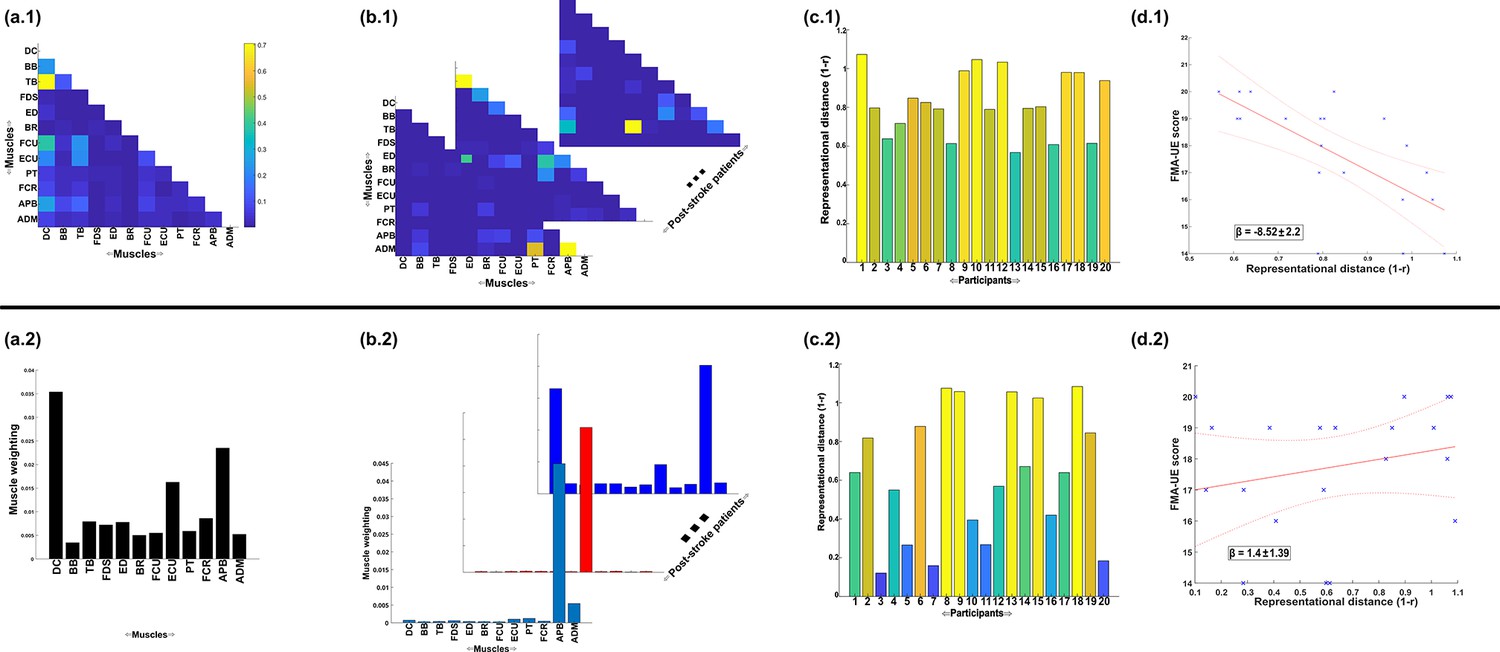
A simple demonstration of the physiological relevance of the proposed approach (a.1–d.1) and the traditional, non-negative matrix factorisation (NMF)-based approach (a.2–d.2).
From dataset 4 (Averta et al., 2021), we took the electromyographic (EMG) signals and WRBA kinematic from 20 post-stroke and 25 healthy participants. We extracted a single normative reference of healthy controls task-redundant muscle couplings with respect to WRBA (a.1) and a corresponding normative reference using NMF only (a.2). We then extracted a single component from each post-stroke participant and compared them individually with the corresponding normative reference, computing distance values (1 r) (b, c). We finally determined the predictive relationship of these distance values with a measure of upper-extremity motor impairment derived from the Fugl-Meyer assessment (FMA-UE) (d).
Figure 7 with 1 supplement
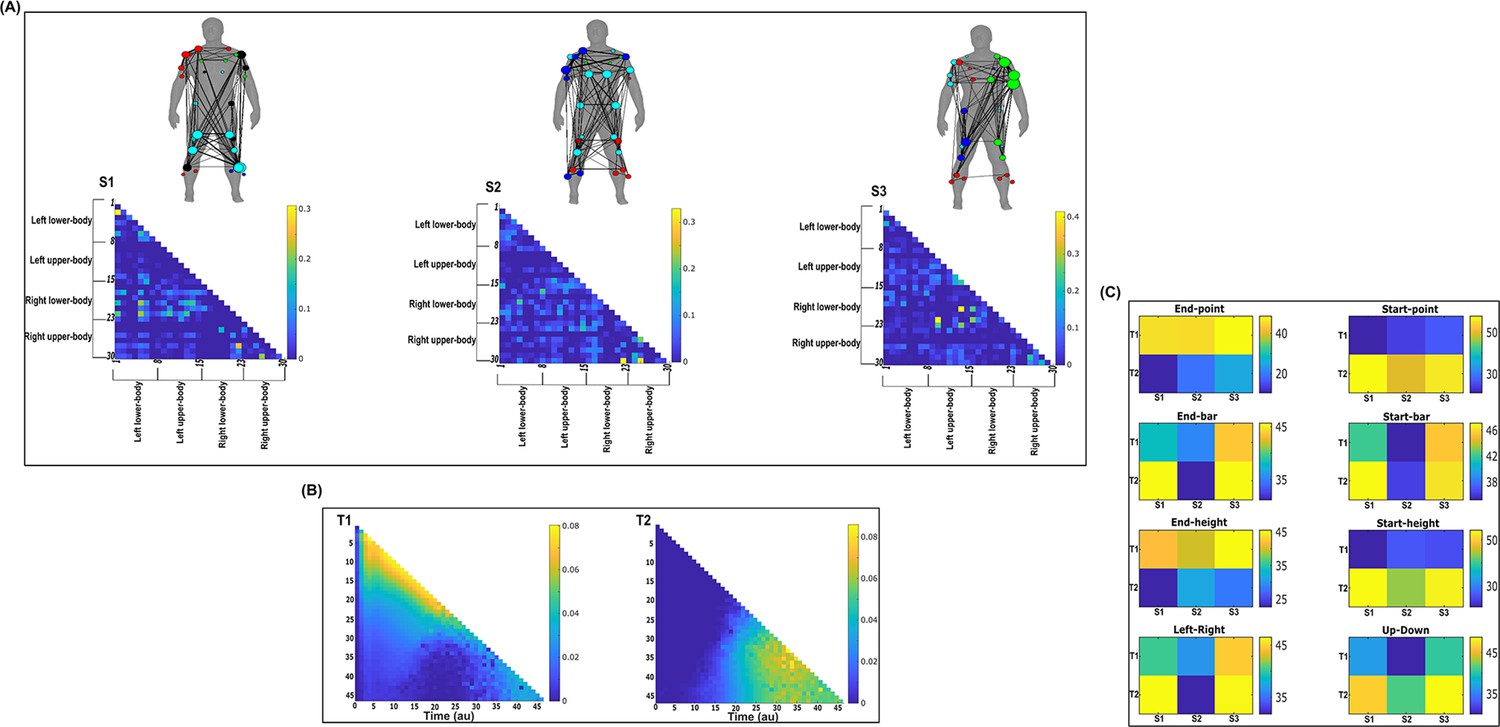
Three spatial (S1–S3) and two temporal task-irrelevant muscle networks (T1–T2) were empirically identified and extracted across participants and task parameters from dataset 2 using the network information framework (NIF) pipeline (panels A, B) (Ó’ Reilly and Delis, 2022; Hilt et al., 2018).
(Panel C) Activation coefficients are presented to the right of the networks, indicating their task parameter-specific scaling averaged across participants. Human body models accompanying each spatial network illustrate their respective submodular structure with node colour and size and edge width indicating community affiliation (Blondel et al., 2008), network centrality and connection strength, respectively (Makarov et al., 2015; Benzi and Klymko, 2013).
Figure 7—figure supplement 1
Three spatial (S1–S3) and two temporal task-irrelevant muscle networks (T1–T2) were empirically identified and extracted across participants and task parameters from dataset 1 using the network information framework (NIF) pipeline (panels A, B) (Ó’ Reilly and Delis, 2022; Delis et al., 2014).
Human body models accompanying each spatial network illustrate their respective submodular structure with node colour and size and edge width indicating community affiliation (Blondel et al., 2008), network centrality and connection strength, respectively (Makarov et al., 2015; Benzi and Klymko, 2013). (Panel C) Activation coefficients are presented to the right of the networks, indicating their task parameter-specific scaling averaged across participants.
Figure 8 with 1 supplement
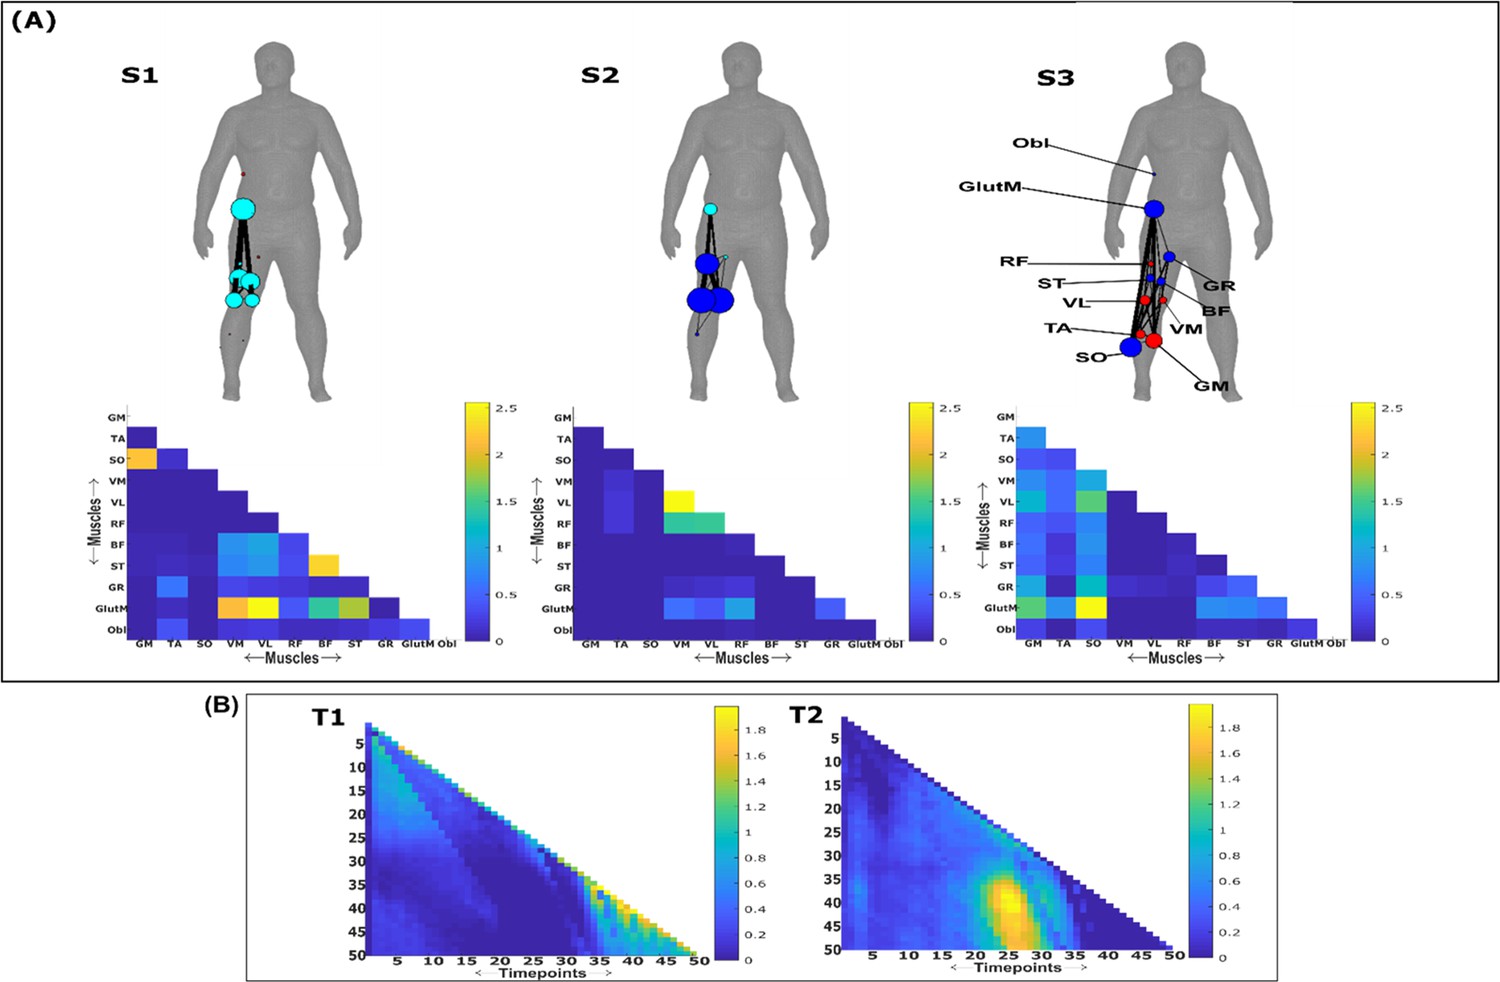
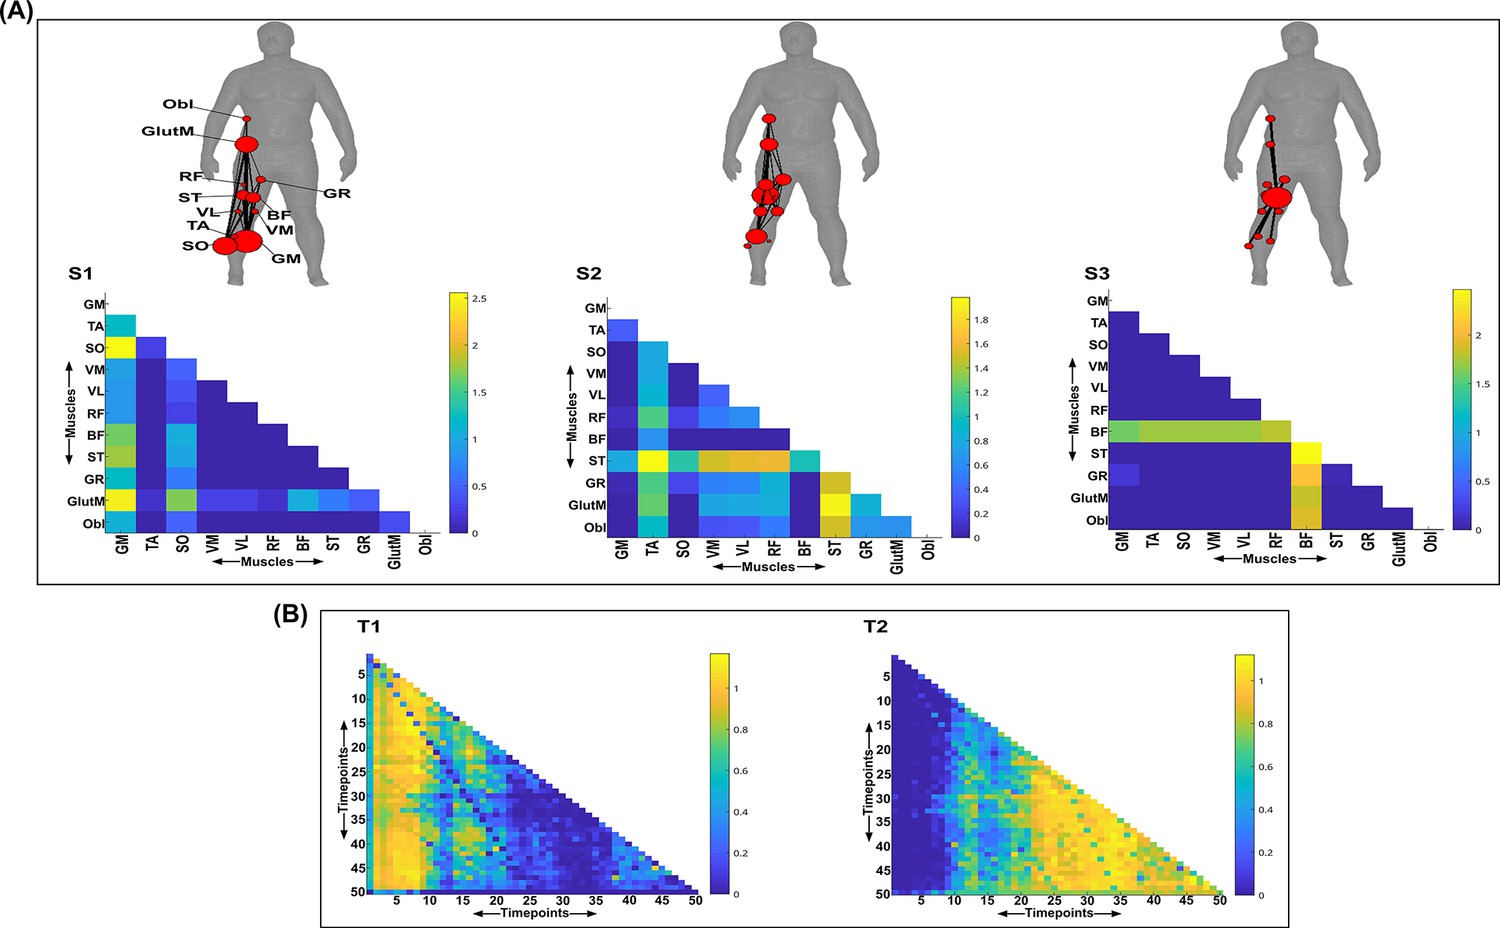
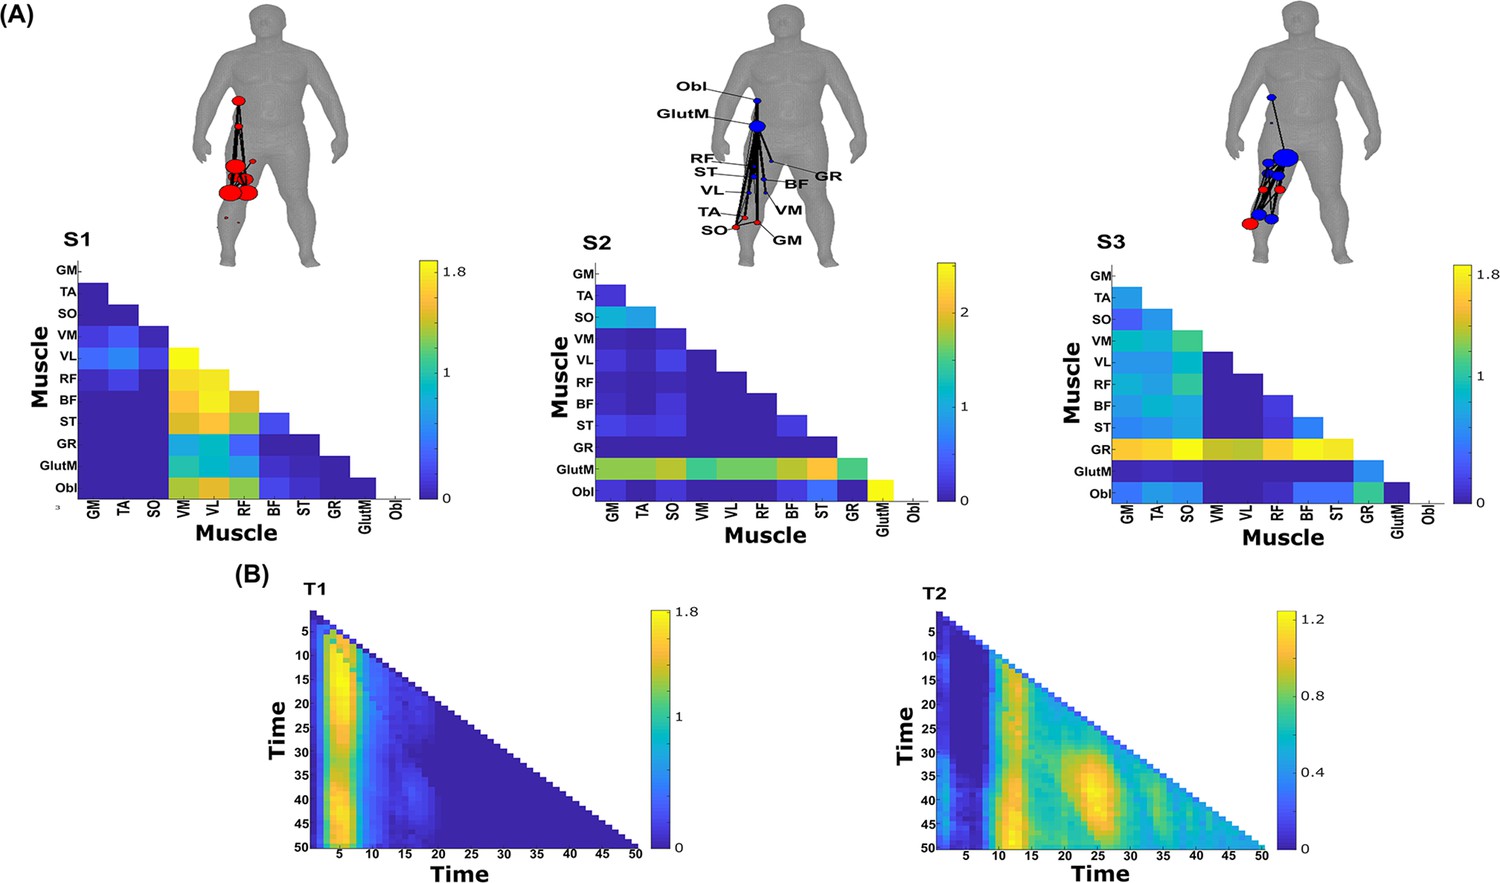
Three spatial (S1–S3) and two temporal task-irrelevant muscle networks (T1–T2) were empirically identified and extracted across participants and task parameters from dataset 3 using the network information framework (NIF) pipeline (panels A, B) (Ó’ Reilly and Delis, 2022; Camargo et al., 2021).
Activation coefficients are presented in supplementary material 1, indicating their task parameter-specific scaling averaged across participants in the dynamic, inertial motion unit (IMU), and kinematic spaces. Human body models accompanying each spatial network illustrate their respective submodular structure with node colour and size and edge width indicating community affiliation (Blondel et al., 2008), network centrality and connection strength, respectively (Makarov et al., 2015; Benzi and Klymko, 2013).
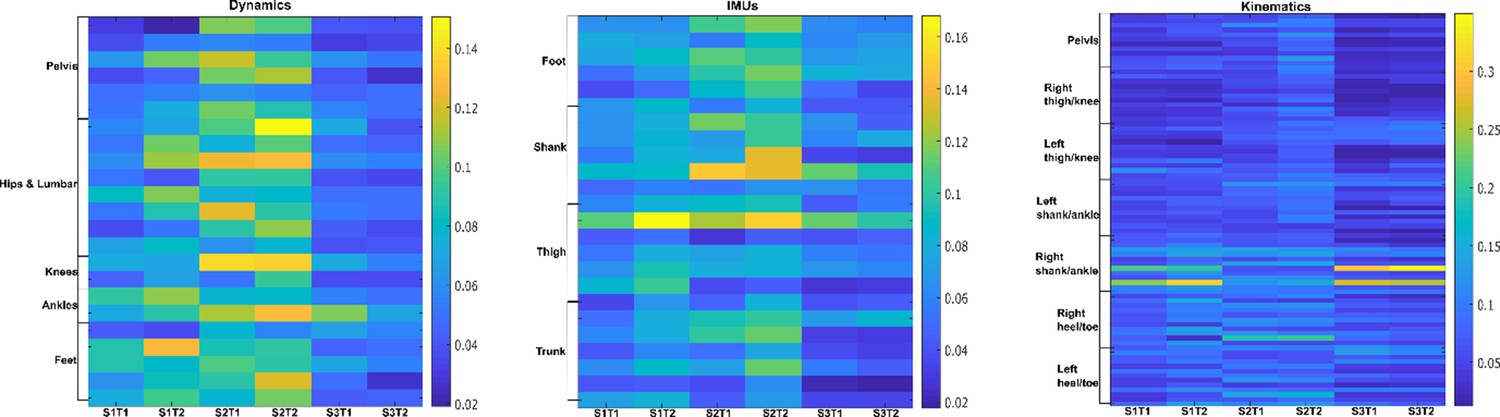
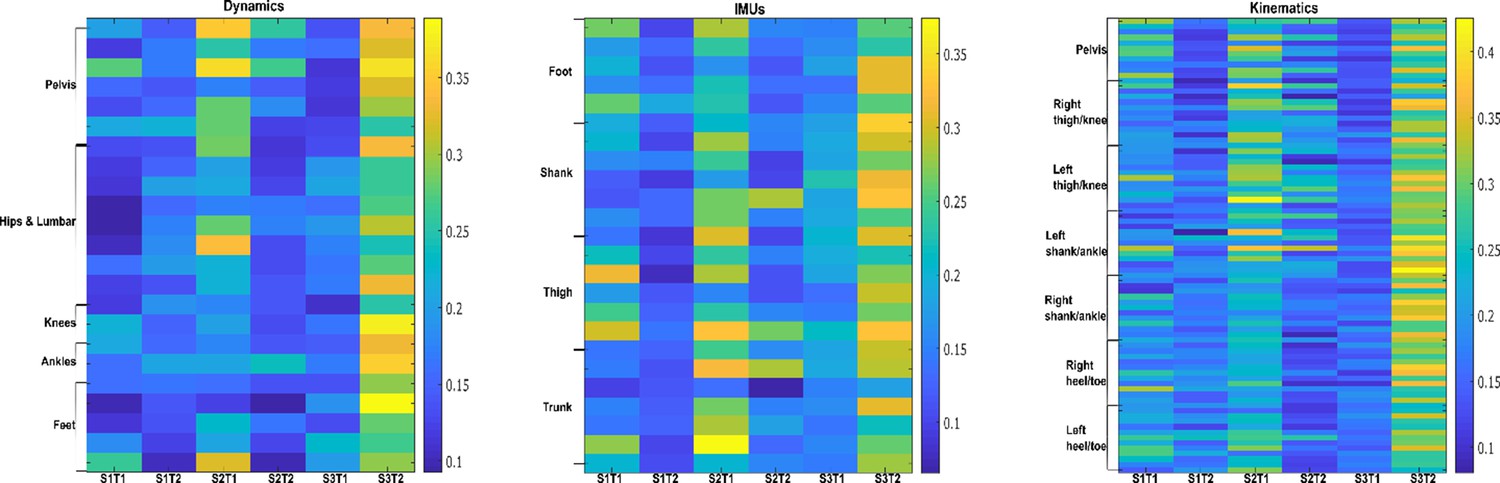
Figure 8—figure supplement 1
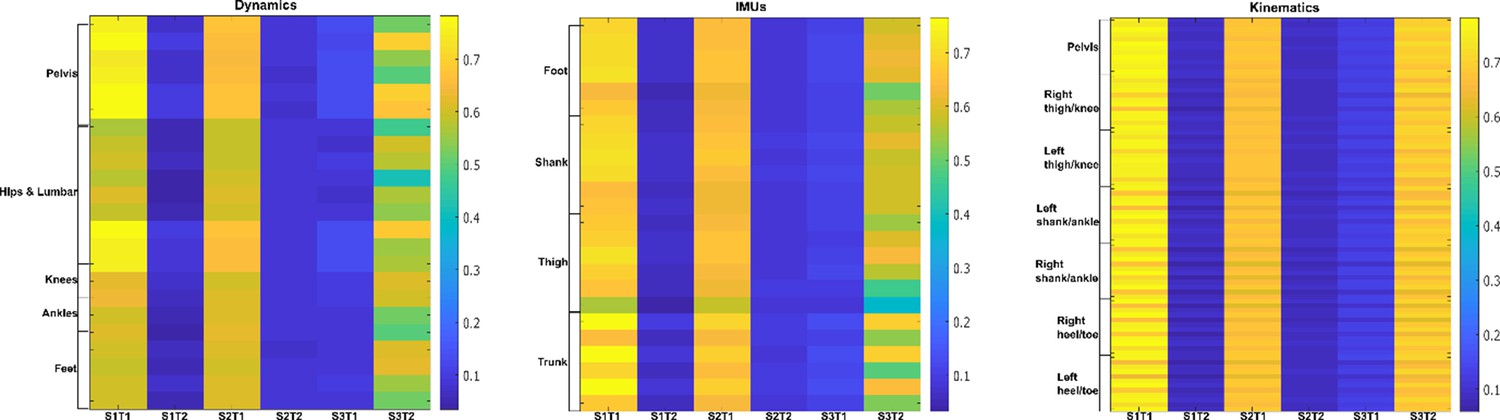
Task-irrelevant activation coefficients (dataset 3) (Delis et al., 2014).
Dynamic, inertial motion unit (IMU), and kinematic data were captured from the bilateral lower limbs while 17 participants performed various locomotion modes (i.e. stair ascents/descents, ramp inclines/declines, and level-ground walking). The spatial components (A) are supported by corresponding human body models and underneath by their temporal networks (B). To the right in (C), the activation coefficients are averaged across participants.
Figure 9 with 1 supplement
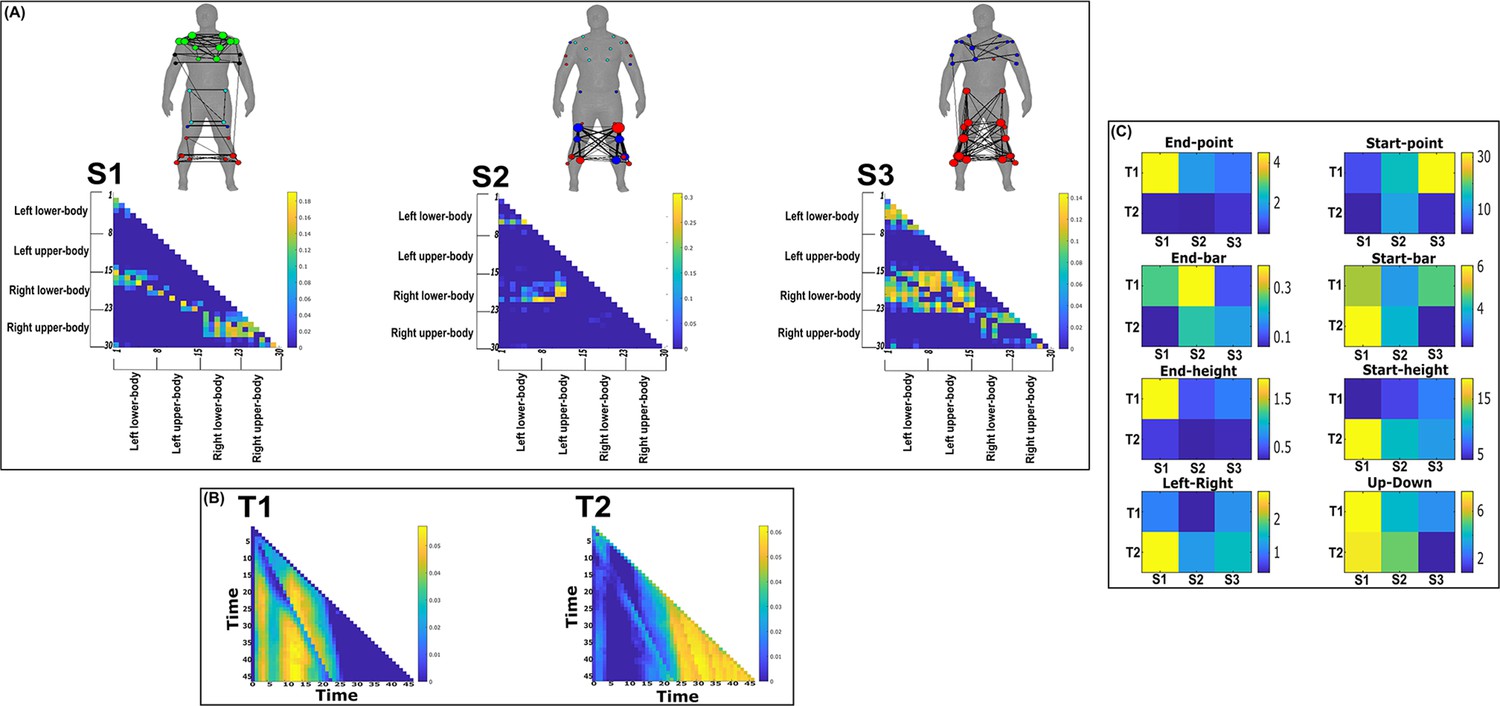
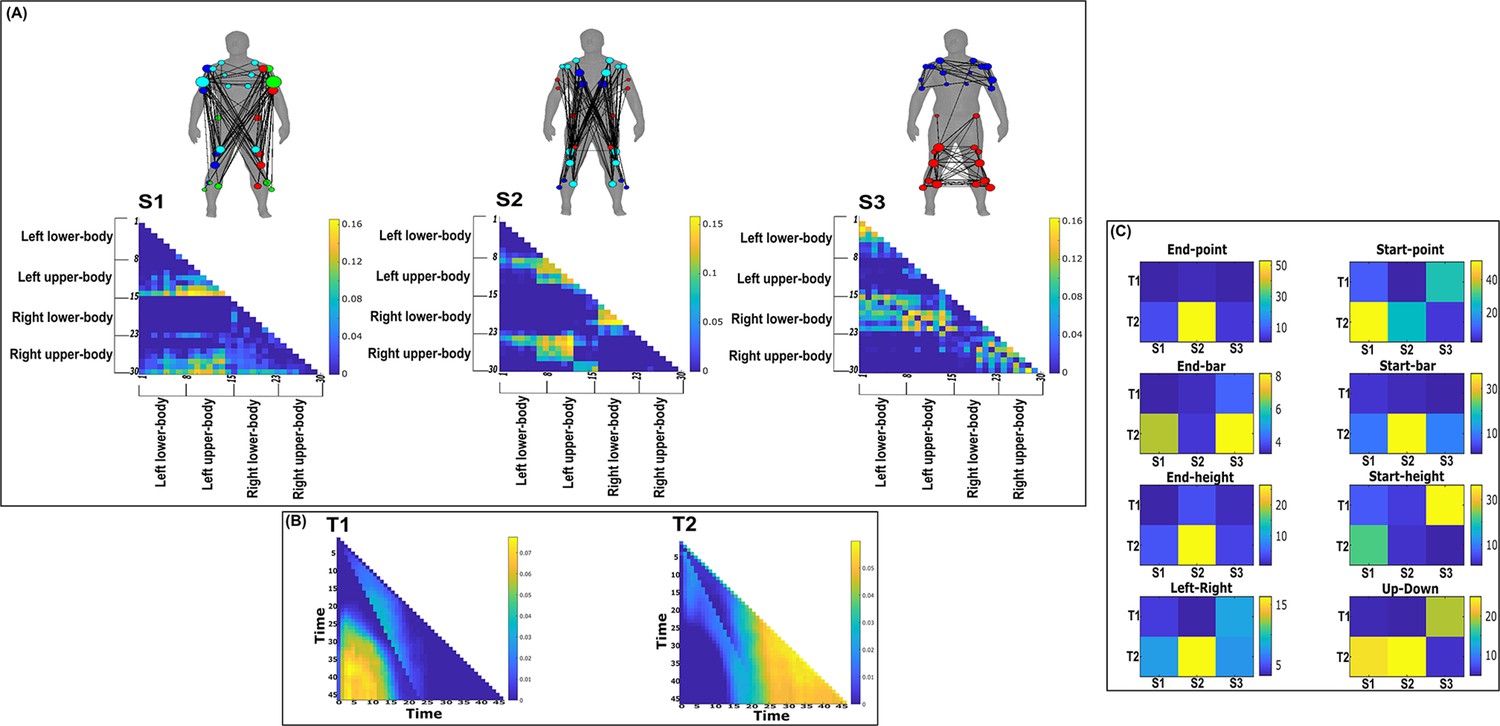
Three spatial (S1–S3) and two temporal task-redundant muscle networks (T1–T2) were empirically identified and extracted across participants and task parameters from dataset 2 using the network information framework (NIF) pipeline (panels A, B) (Ó’ Reilly and Delis, 2022; Hilt et al., 2018).
(Panel C) Activation coefficients are presented to the right of the networks, indicating their task parameter-specific scaling averaged across participants. Human body models accompanying each spatial network illustrate their respective submodular structure with node colour and size and edge width indicating community affiliation (Blondel et al., 2008), network centrality and connection strength, respectively (Makarov et al., 2015; Benzi and Klymko, 2013).
Figure 9—figure supplement 1
Three spatial (S1–S3) and two temporal task-redundant muscle networks (T1–T2) were empirically identified and extracted across participants and task parameters from dataset 1 using the network information framework (NIF) pipeline (panels A, B) (Ó’ Reilly and Delis, 2022; Delis et al., 2014).
Human body models accompanying each spatial network illustrate their respective submodular structure with node colour and size and edge width indicating community affiliation (Blondel et al., 2008), network centrality and connection strength, respectively (Makarov et al., 2015; Benzi and Klymko, 2013). (Panel C) Activation coefficients are presented to the right of the networks, indicating their task parameter-specific scaling averaged across participants.
Figure 10 with 1 supplement
Three spatial (S1–S3) and two temporal task-redundant muscle networks (T1–T2) were empirically identified and extracted across participants and task parameters from dataset 3 using the network information framework (NIF) pipeline (A, B) (Ó’ Reilly and Delis, 2022; Camargo et al., 2021).
Activation coefficients are presented in supplementary material 1, indicating their task parameter-specific scaling averaged across participants in the dynamic, inertial motion unit (IMU), and kinematic spaces. Human body models accompanying each spatial network illustrate their respective submodular structure with node colour and size and edge width indicating community affiliation (Blondel et al., 2008), network centrality and connection strength, respectively (Makarov et al., 2015; Benzi and Klymko, 2013).
Figure 10—figure supplement 1
Task-redundant activation coefficients (dataset 3) (Delis et al., 2014).
Dynamic, inertial motion unit (IMU), and kinematic data were captured from the bilateral lower limbs while 17 participants performed various locomotion modes (i.e. stair ascents/descents, ramp inclines/declines, and level-ground walking). Activation coefficients are averaged across participants.
Figure 11 with 1 supplement
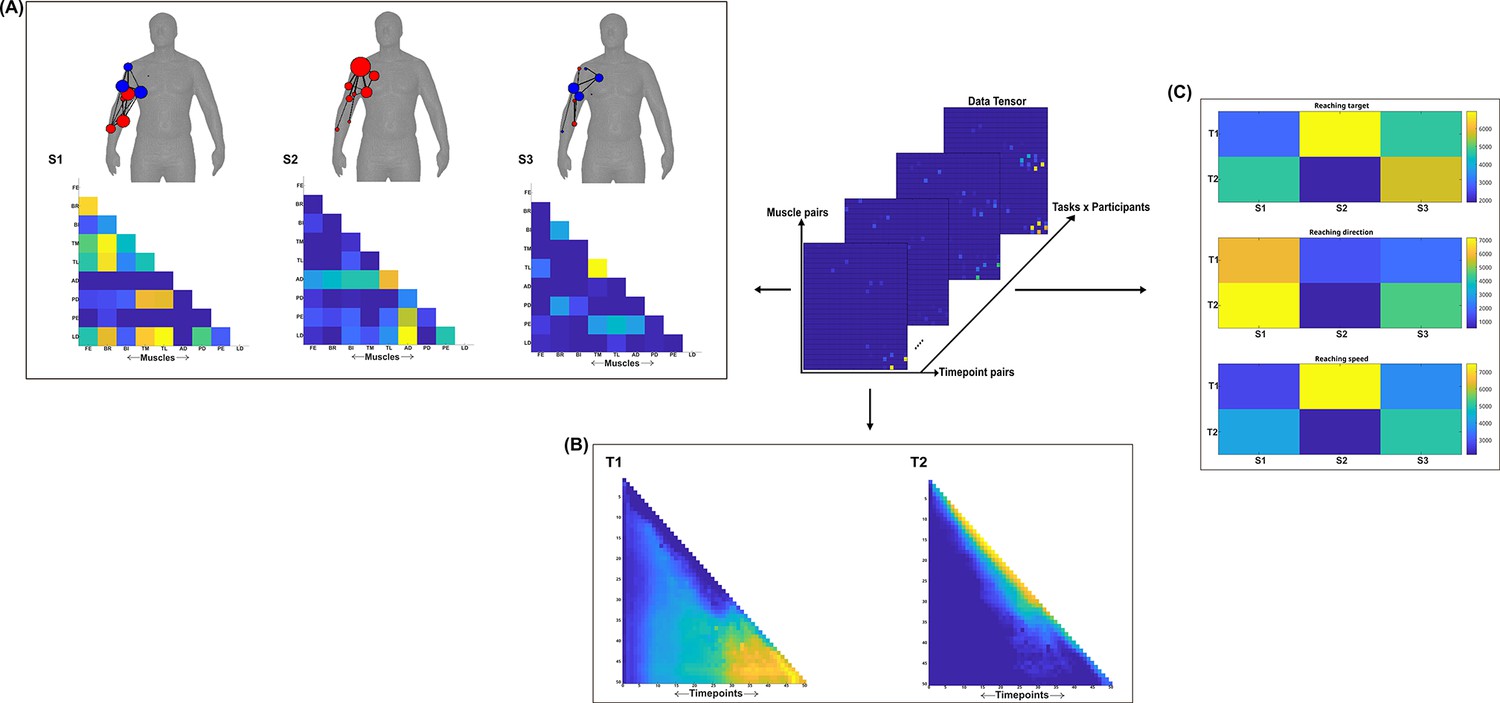
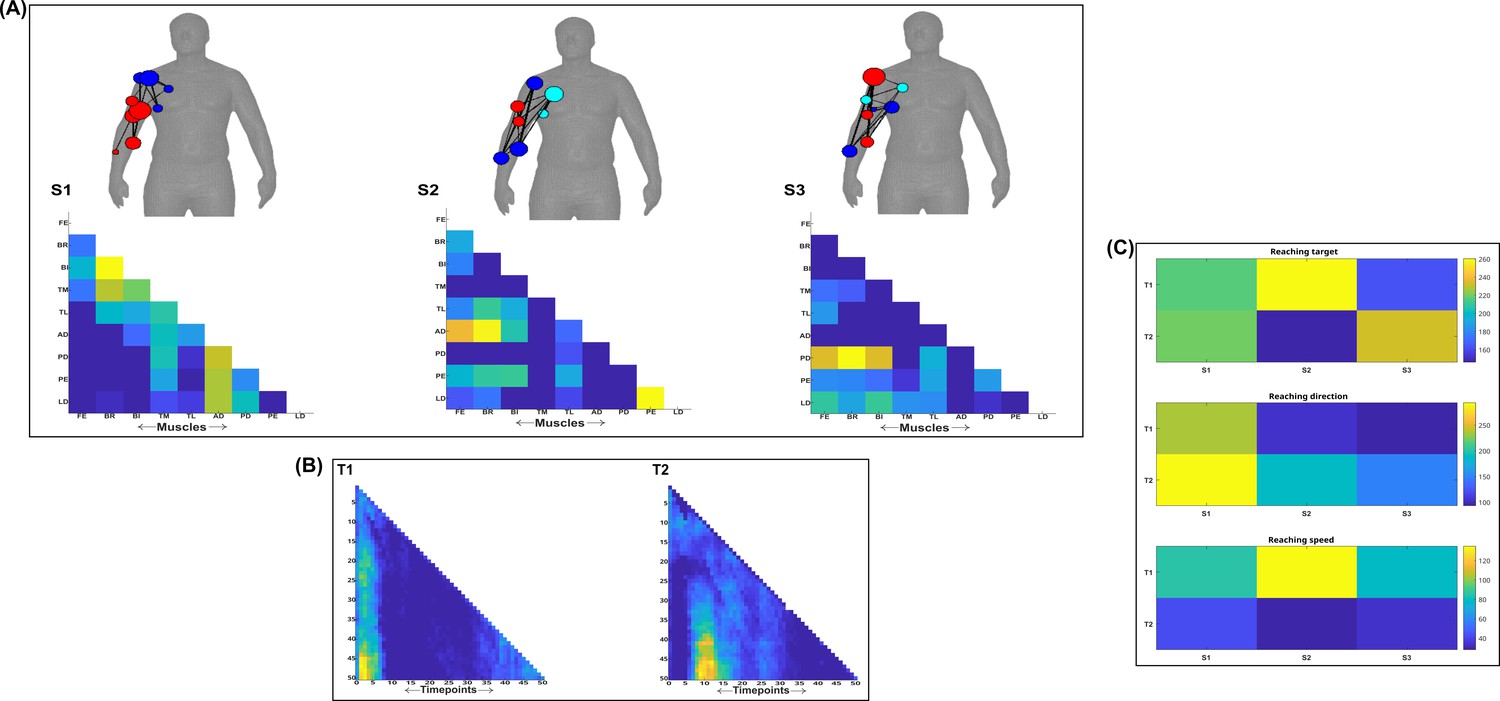
Three spatial (S1–S3) and two temporal task-synergistic muscle networks (T1–T2) were empirically identified and extracted across participants and task parameters from dataset 2 using the network information framework (NIF) pipeline (panels A, B) (Ó’ Reilly and Delis, 2022; Hilt et al., 2018).
(Panel C) Activation coefficients are presented to the right of the networks, indicating their task parameter-specific scaling averaged across participants. Human body models accompanying each spatial network illustrate their respective submodular structure with node colour and size and edge width indicating community affiliation (Blondel et al., 2008), network centrality and connection strength, respectively (Makarov et al., 2015; Benzi and Klymko, 2013).
Figure 11—figure supplement 1
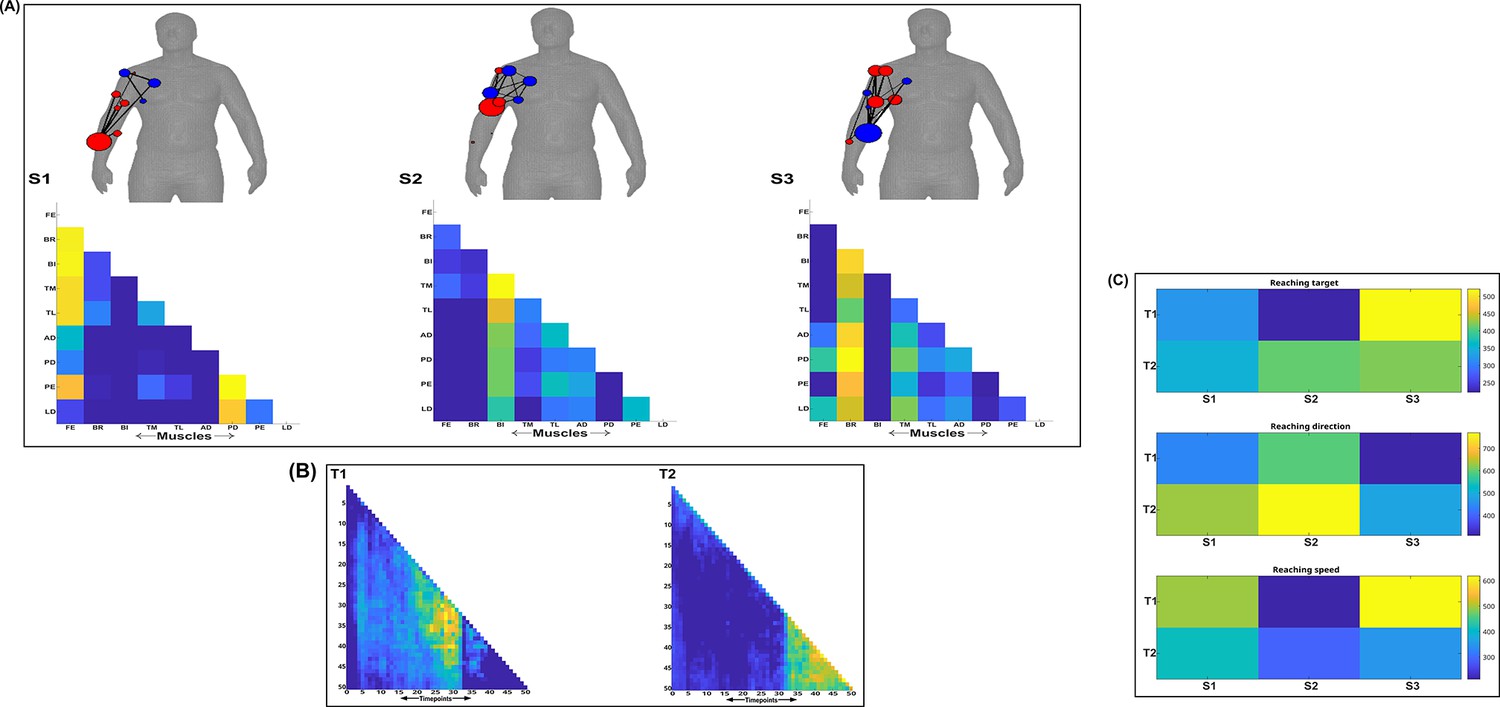
Three spatial (S1–S3) and two temporal task-synergistic muscle networks (T1–T2) were empirically identified and extracted across participants and task parameters from dataset 1 using the NIF pipeline (panels A, B) (Ó’ Reilly and Delis, 2022; Delis et al., 2014).
Human body models accompanying each spatial network illustrate their respective submodular structure with node colour and size and edge width indicating community affiliation (Blondel et al., 2008), network centrality and connection strength, respectively (Makarov et al., 2015; Benzi and Klymko, 2013). (Panel C) Activation coefficients are presented to the right of the networks, indicating their task parameter-specific scaling averaged across participants.
Figure 12 with 1 supplement
Three spatial (S1–S3) and two temporal task-synergistic muscle networks (T1–T2) were empirically identified and extracted across participants and task parameters from dataset 3 using the network information framework (NIF) pipeline (panels A, B) (Ó’ Reilly and Delis, 2022; Camargo et al., 2021).
Activation coefficients are presented in supplementary material 1, indicating their task parameter-specific scaling averaged across participants in the dynamic, inertial motion unit (IMU), and kinematic spaces. Human body models accompanying each spatial network illustrate their respective submodular structure with node colour and size and edge width indicating community affiliation (Blondel et al., 2008), network centrality and connection strength, respectively (Makarov et al., 2015; Benzi and Klymko, 2013).
Figure 12—figure supplement 1
Task-synergistic activation coefficients (dataset 3) (Delis et al., 2014).
Dynamic, inertial motion unit (IMU), and kinematic data were captured from the bilateral lower limbs while 17 participants performed various locomotion modes (i.e. stair ascents/descents, ramp inclines/declines, and level-ground walking). Activation coefficients are averaged across participants.
Figure 13
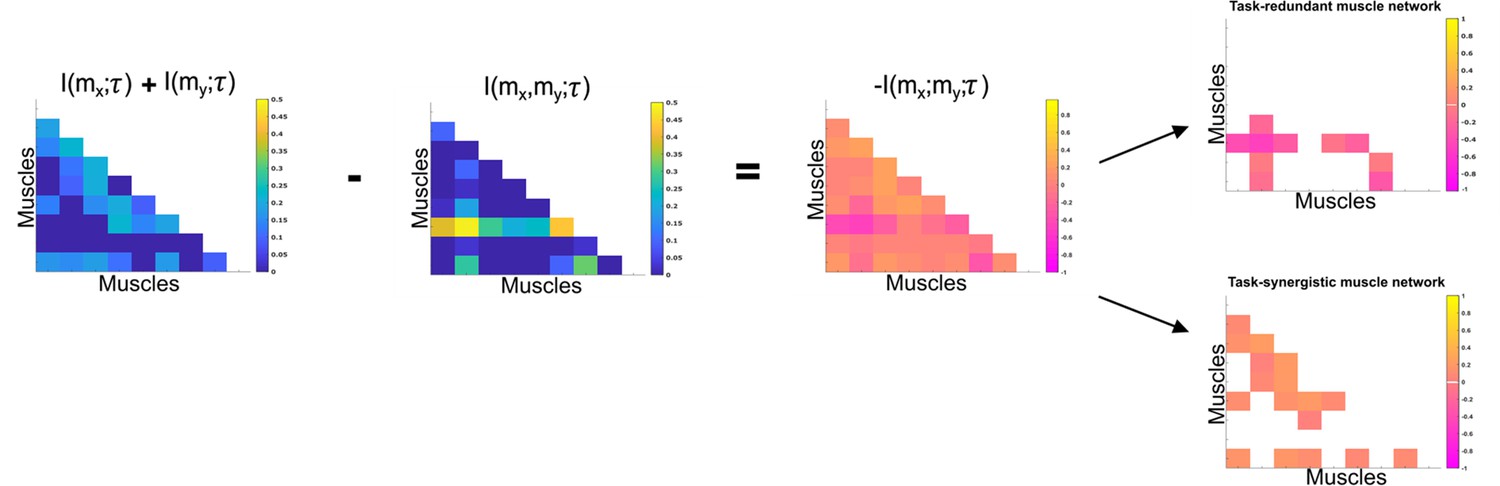
Co-information (Co-I) determines the difference between the sum total information shared with in and when observed separately and the information shared with when they are observed together.
The adjacency matrices show how this calculation is carried out for all unique combinations. Redundant and synergistic muscle couplings are then separated into two equivalently sized networks. The accompanying colour bars indicate the values present in the adjacency matrix.
Tables
Table 1
A summary table illustrating the findings from an examination of the generalisability of the muscle networks extracted from each dataset.
The spatial and temporal representations extracted from the full input data in each muscle-task information subspace were compared using Pearson’s correlation against functionally similar representations extracted from a subset of the input data.
| Dataset 1 | ||||||
|---|---|---|---|---|---|---|
| Spatial | Temporal | |||||
| Participants | Tasks | Participants | Tasks | |||
| Task-redundant | 0.95 ± 0.23 | 0.89 ± 0.28 | 0.98 ± 0.19 | 0.89 ± 0.27 | ||
| Task-synergistic | 0.95 ± 0.23 | 0.73 ± 0.26 | 0.98 ± 0.19 | 0.91 ± 0.3 | ||
| Task-irrelevant | 0.84 ± 0.1 | 0.85 ± 0.1 | 0.79 ± 0.15 | 0.95 ± 0.04 | ||
| Dataset 2 | ||||||
| Spatial | Temporal | |||||
| Participants | Tasks | Participants | Tasks | |||
| Task-redundant | 0.82 ± 0.42 | 0.94 ± 0.27 | 0.99 ± 0.03 | 0.96 ± 0.28 | ||
| Task-synergistic | 0.79 ± 0.37 | 0.96 ± 0.25 | 0.92 ± 0.3 | 0.99 ± 0.1 | ||
| Task-irrelevant | 0.84 ± 0.15 | 0.99 ± 0.01 | 0.93 ± 0.1 | 0.99 ± 0.06 | ||
| Dataset 3 | ||||||
| Spatial | Temporal | |||||
| Kinematics | Dynamics | IMU | Kinematics | Dynamics | IMU | |
| Task-redundant | 0.92 ± 0.28 | 0.91 ± 0.32 | 0.86 ± 0.31 | 0.93 ± 0.21 | 0.92 ± 0.24 | 0.87 ± 0.29 |
| Task-synergistic | 0.97 ± 0.16 | 0.9 ± 0.27 | 0.96 ± 0.19 | 0.99 ± 0.04 | 0.98 ± 0.13 | 0.95 ± 0.18 |
| Task-irrelevant | 0.9 ± 0.34 | 0.83 ± 0.37 | 0.8 ± 0.33 | 0.99 ± 0.04 | 0.98 ± 0.1 | 0.97 ± 0.15 |
Additional files
Download links
A two-part list of links to download the article, or parts of the article, in various formats.
Downloads (link to download the article as PDF)
Open citations (links to open the citations from this article in various online reference manager services)
Cite this article (links to download the citations from this article in formats compatible with various reference manager tools)
Dissecting muscle synergies in the task space
eLife 12:RP87651.
https://doi.org/10.7554/eLife.87651.4


