Heterogeneous non-canonical nucleosomes predominate in yeast cells in situ
- Department of Biological Sciences and Center for BioImaging Sciences, National University of Singapore, Singapore
- National Resource for Automated Molecular Microscopy, Simons Electron Microscopy Center, New York Structural Biology Center, United States
Figures
Figure 1 with 14 supplements
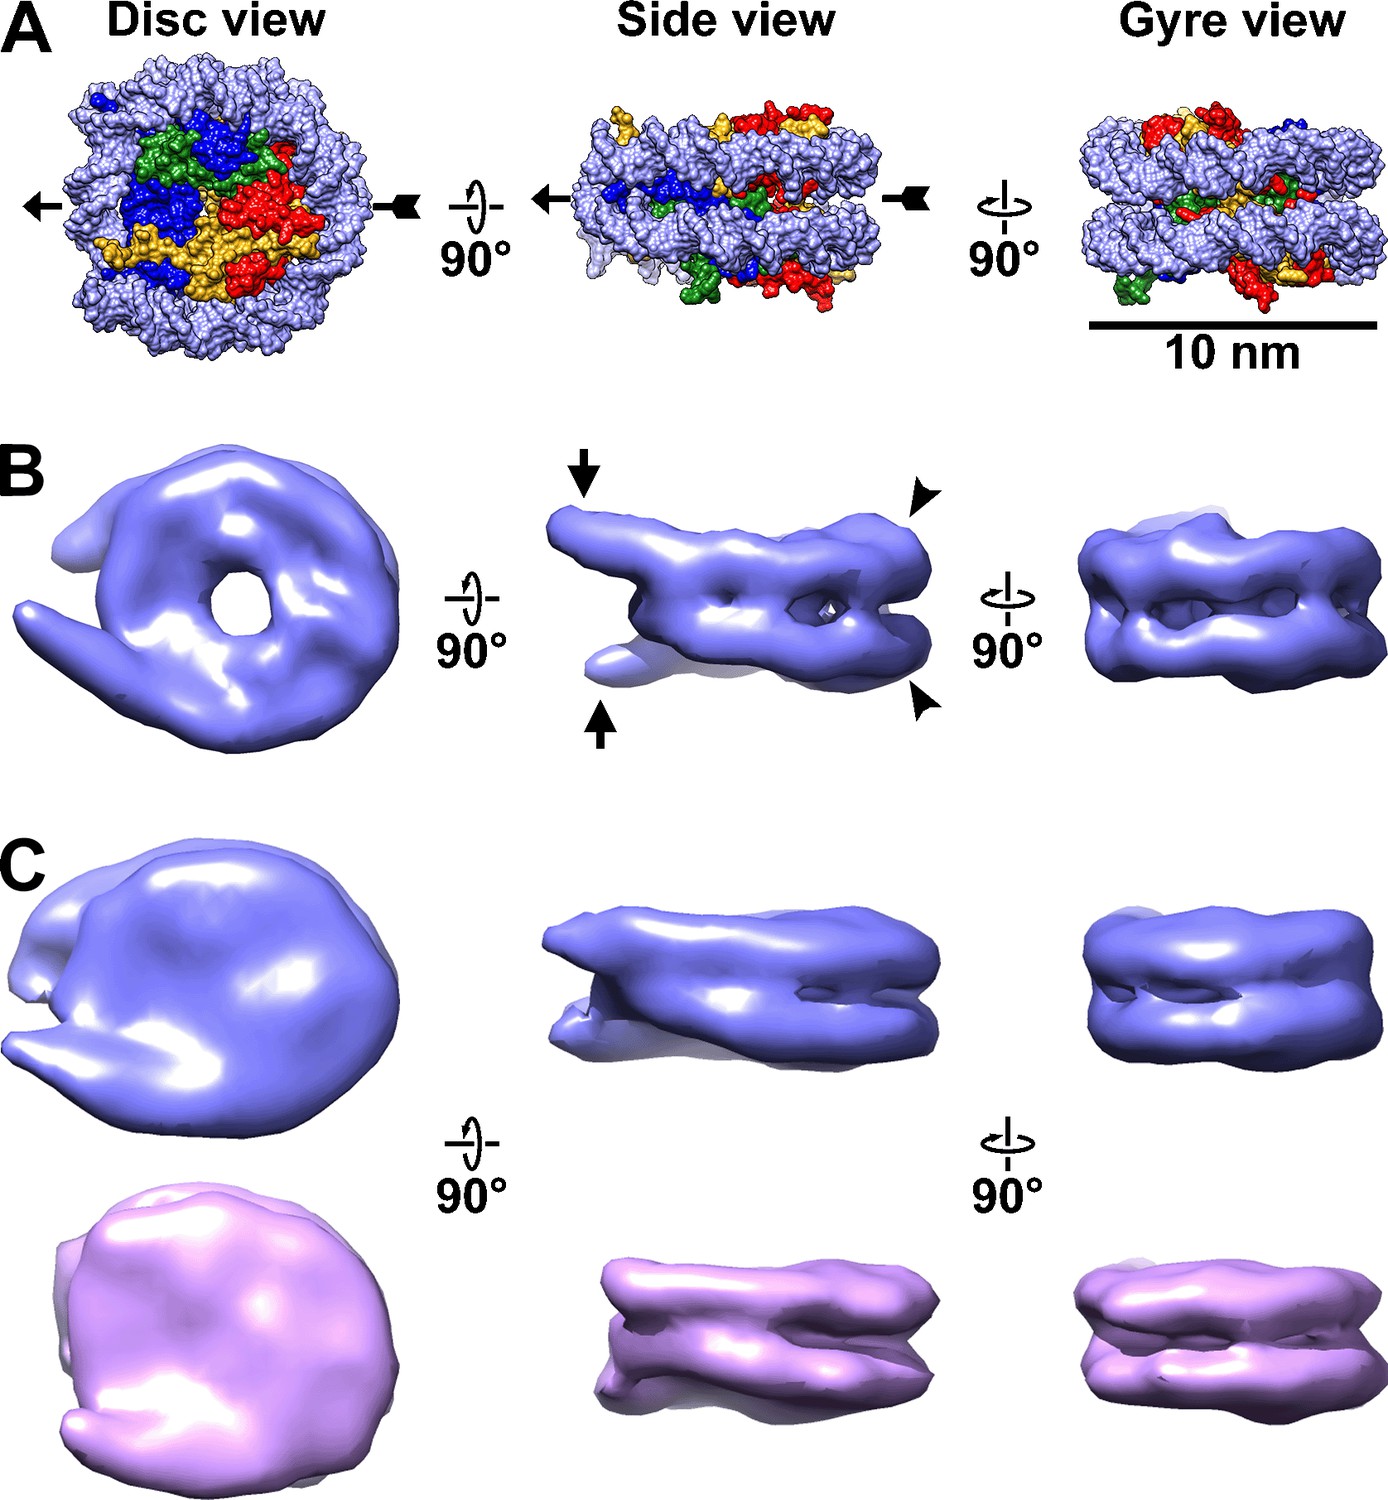
Canonical nucleosomes in vitro and in situ.
(A) Space-filling model of the reconstituted yeast nucleosome crystal structure (PDB 1ID3) (White et al., 2001), showing from left to right, the disc, side, and gyre views. The pseudo-dyad axis is indicated by the arrow. The DNA is rendered as light blue and the histones in the core are shaded blue (H3), green (H4), red (H2B), and yellow (H2A). (B) Subtomogram average of nucleosomes from wild-type (BY4741) yeast nuclear lysates. The linker DNA is indicated by the short arrows and the DNA gyre motifs are indicated by the arrowheads. (C) Subtomogram averages of nucleosomes in wild-type cell cryolamellae, oriented similarly to the nucleosomes in the other two panels. The upper (blue) class has more ordered linker DNA than the lower (magenta) class. Note that the subtomogram average in panel B looks different from those in panel C (and in Figure 3 and Figure 3—figure supplement 5) because it is at higher resolution (18 Å vs 24 Å). The gap in the disc view of the nuclear lysate-based average is due to the lower concentration of amino acids there, which is not visible in panel A due to space-filling rendering. This gap’s visibility may also depend on the contrast mechanism because it is not visible in the Volta phase plate (VPP) averages.
Figure 1—figure supplement 1
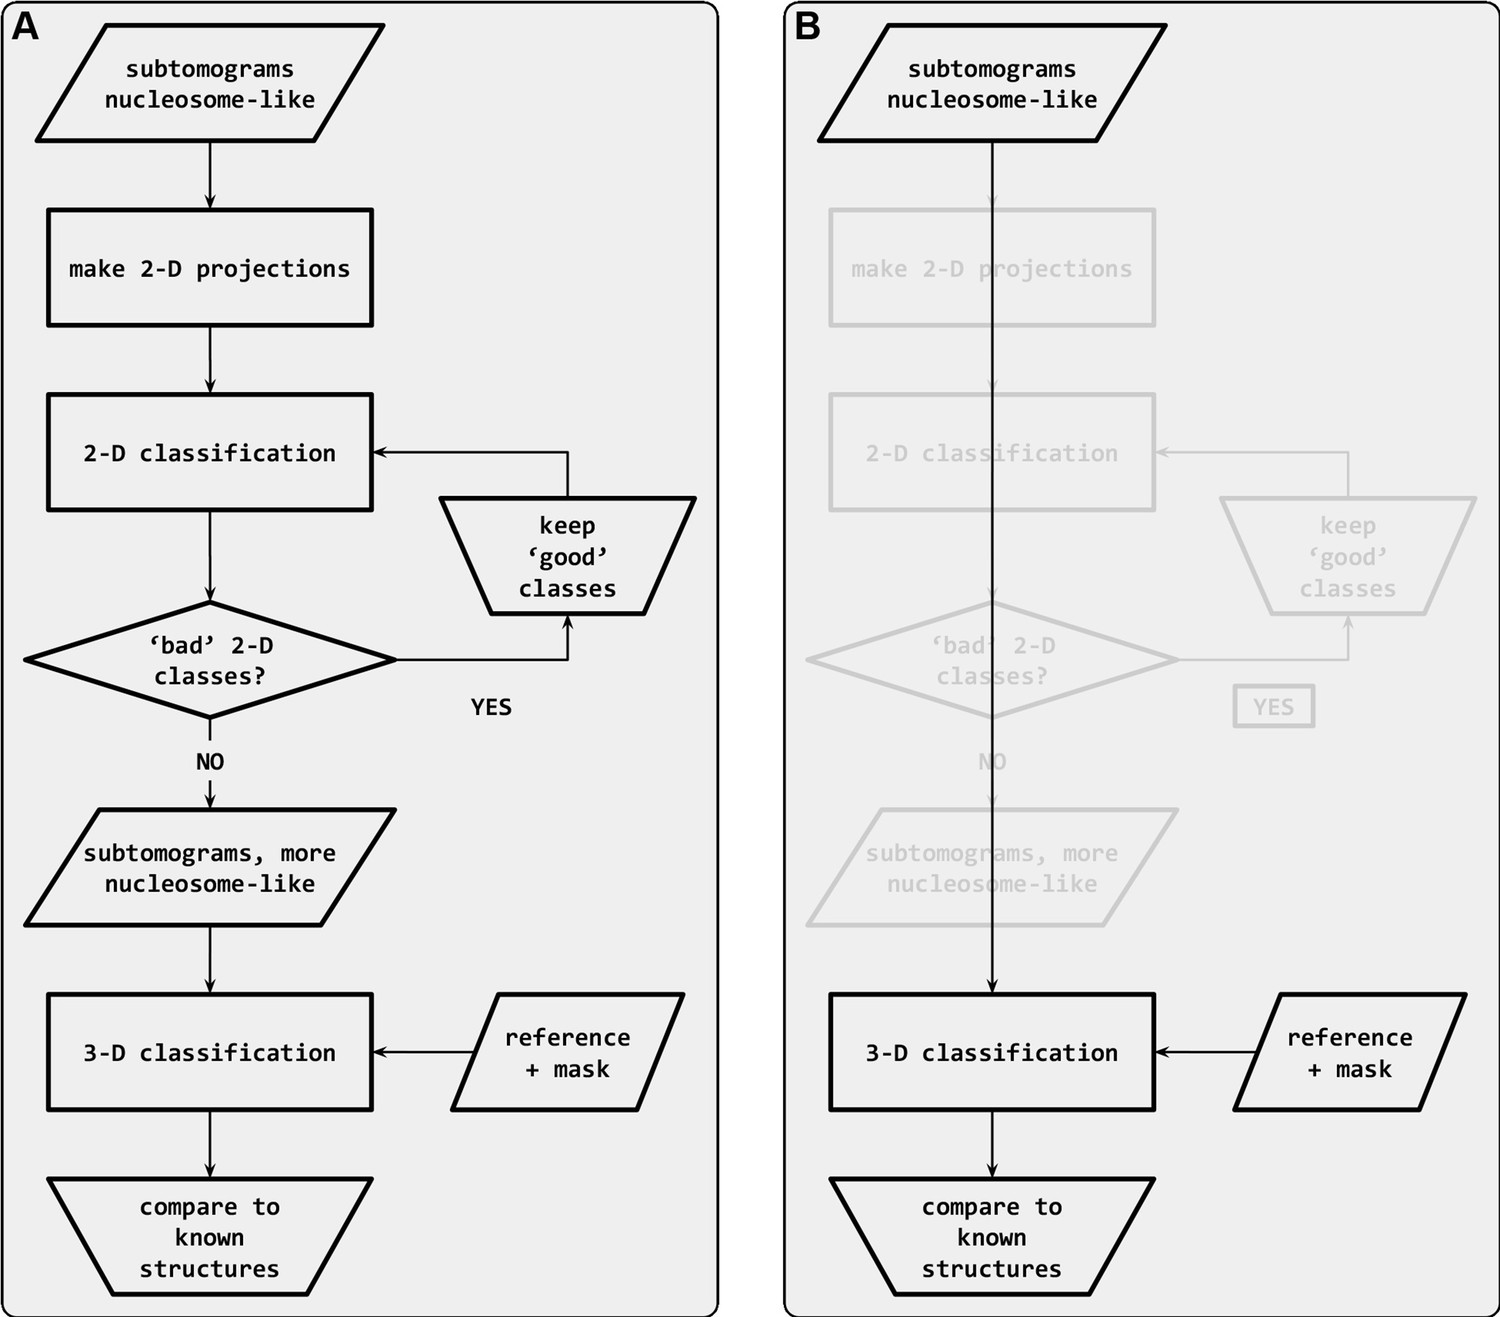
Subtomogram classification workflow.
Classification starts with subtomograms that contain nucleosome-like particles, template matched in PEET (Cai et al., 2018c). (A) In the workflow recommended by Bharat et al., 2015, the subtomograms are first subjected to sequential rounds of 2D classification to remove particles that belong to ‘bad’ classes. Once the bad classes are removed, the remaining set is subjected to 3D classification. (B) In the alternative ‘direct 3D’ classification workflow, the subtomograms are subjected directly to 3D classification. The 2D classification steps (grayed out) are bypassed.
Figure 1—figure supplement 2
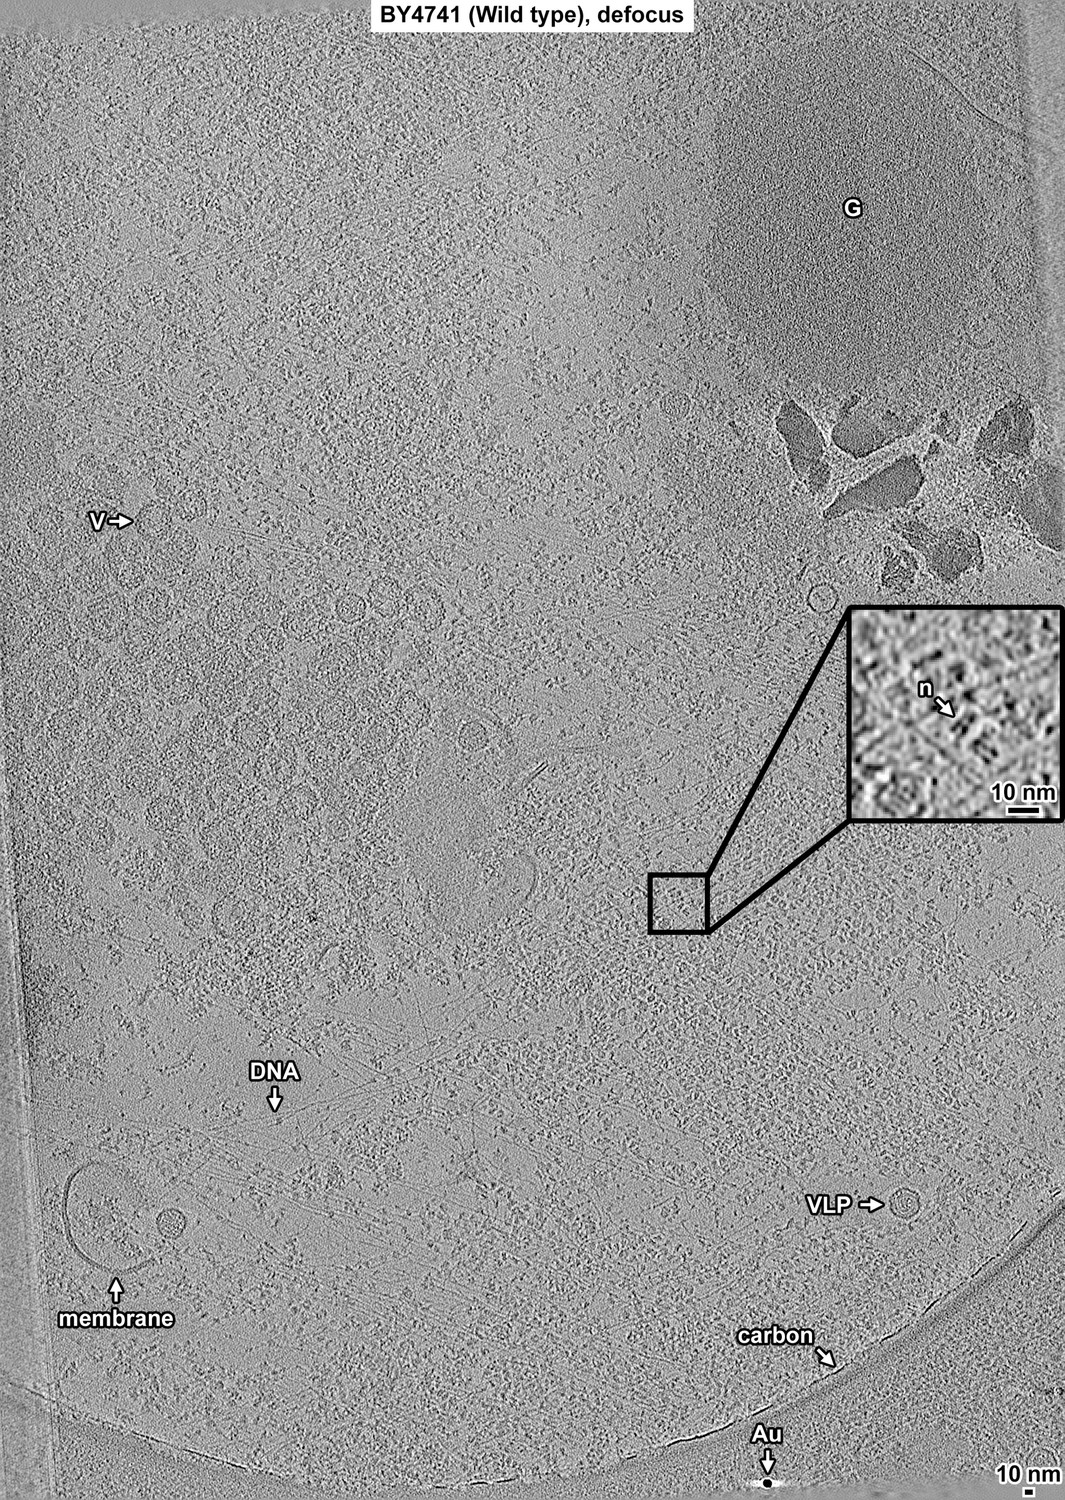
Overview of BY4741 (wild-type) nuclear lysate, defocus data.
Tomographic slice (12 nm) of BY4741 nuclear lysates imaged with defocus phase contrast (defocus). Some non-chromatin features are indicated: granule (G), coated vesicle (V), naked DNA (DNA), membrane fragments (membrane), carbon support film (carbon), virus-like particle (VLP), and gold fiducial (Au). The abundant granular densities in this field of view are nucleosome-like particles. One example is indicated in the fourfold enlargement in the inset (n). The linear features at the lower left and upper right are back-projection artifacts from the image borders. These regions are excluded from analysis.
Figure 1—figure supplement 3

Direct 3D classification of BY4741 (wild-type) nuclear lysates.
(A) Class averages (3D) of BY4741 candidate nucleosome template-matching hits. The canonical nucleosome class averages are shaded blue and the percent of particles belonging to the canonical classes are indicated under the density map. (B) Second round of classification, using the classes indicated in panel A. (C) The resolution of the refined canonical nucleosome is ~18 Å by the Fourier shell correlation (FSC) = 0.5 criterion. The refined density map is reproduced from Figure 1B.
Figure 1—figure supplement 4

Overview of a BY4741 (wild-type) cell cryolamella, defocus data.
Tomographic slice (12 nm) of a BY4741 cell cryolamella imaged with defocus phase contrast. Some non-chromatin features are indicated: nuclear envelope (NE), nuclear microtubule (MT), nucleosome-like particle (n), megacomplex (M), ribosome (R), and a putative vacuole (Vac). The high-contrast linear features at the lower left are back-projection artifacts from image borders.
Figure 1—figure supplement 5
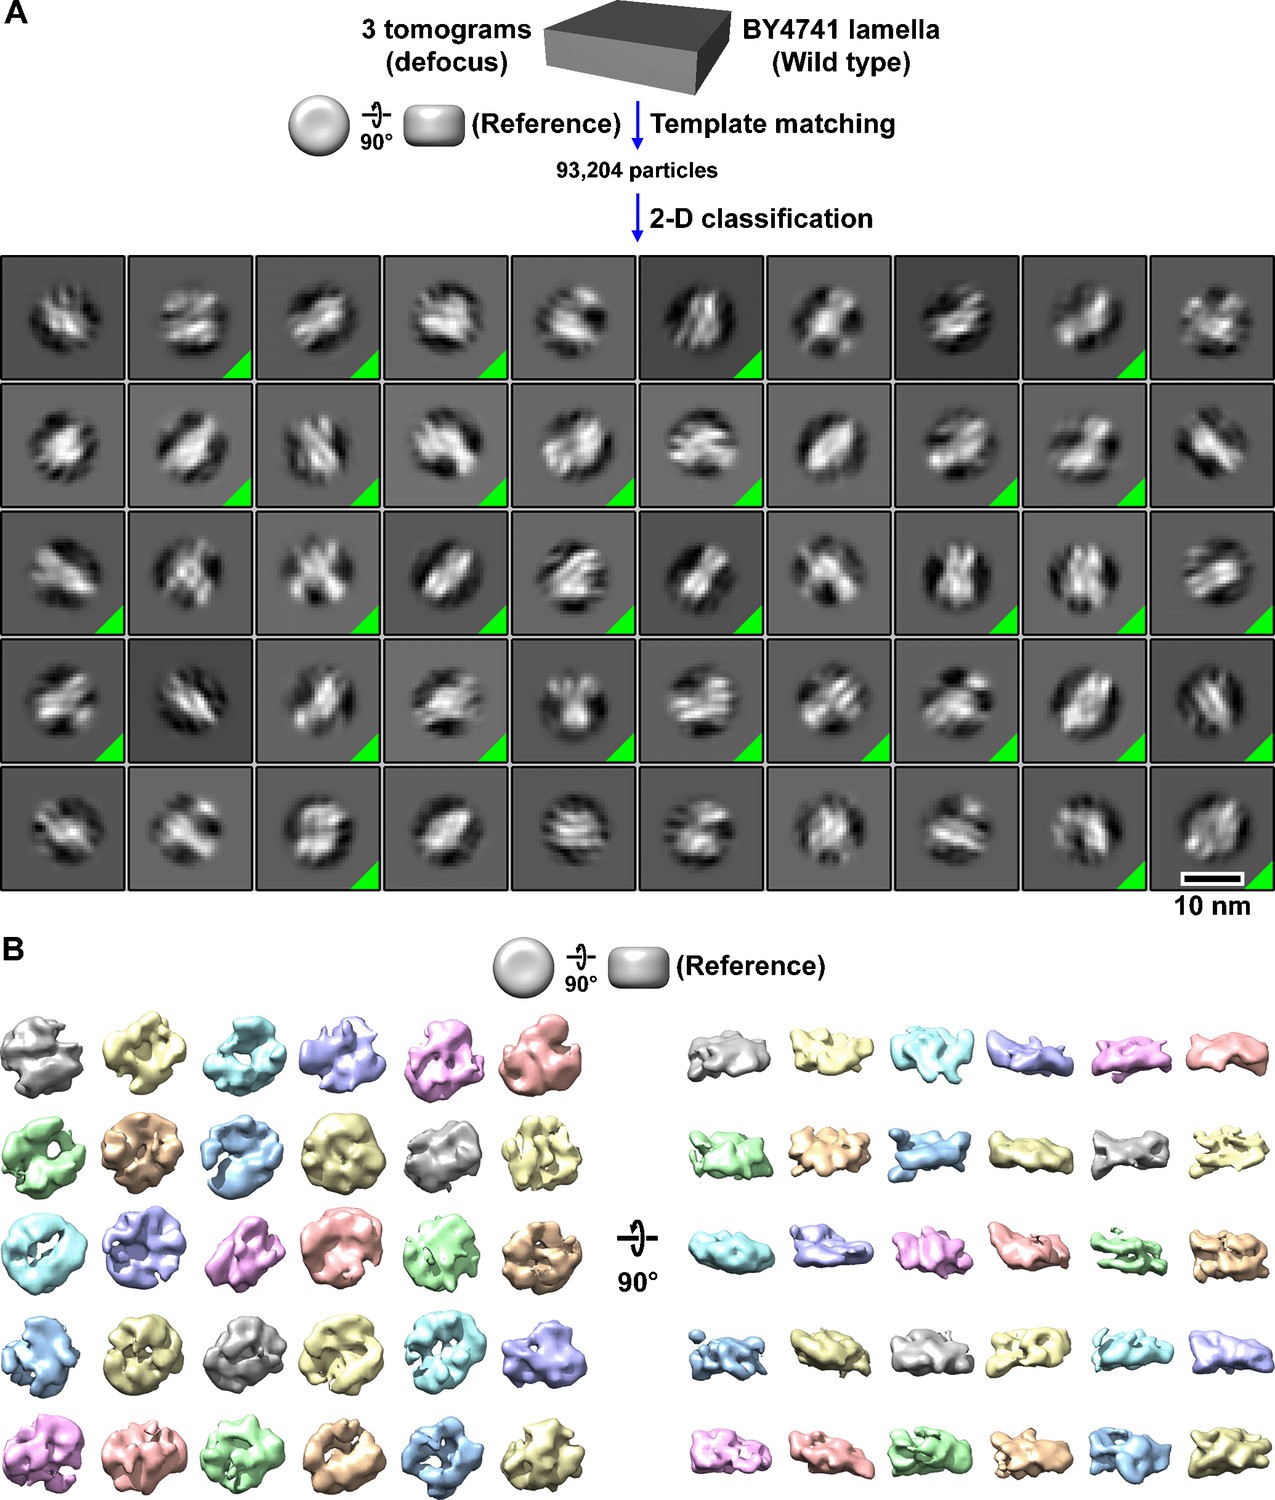
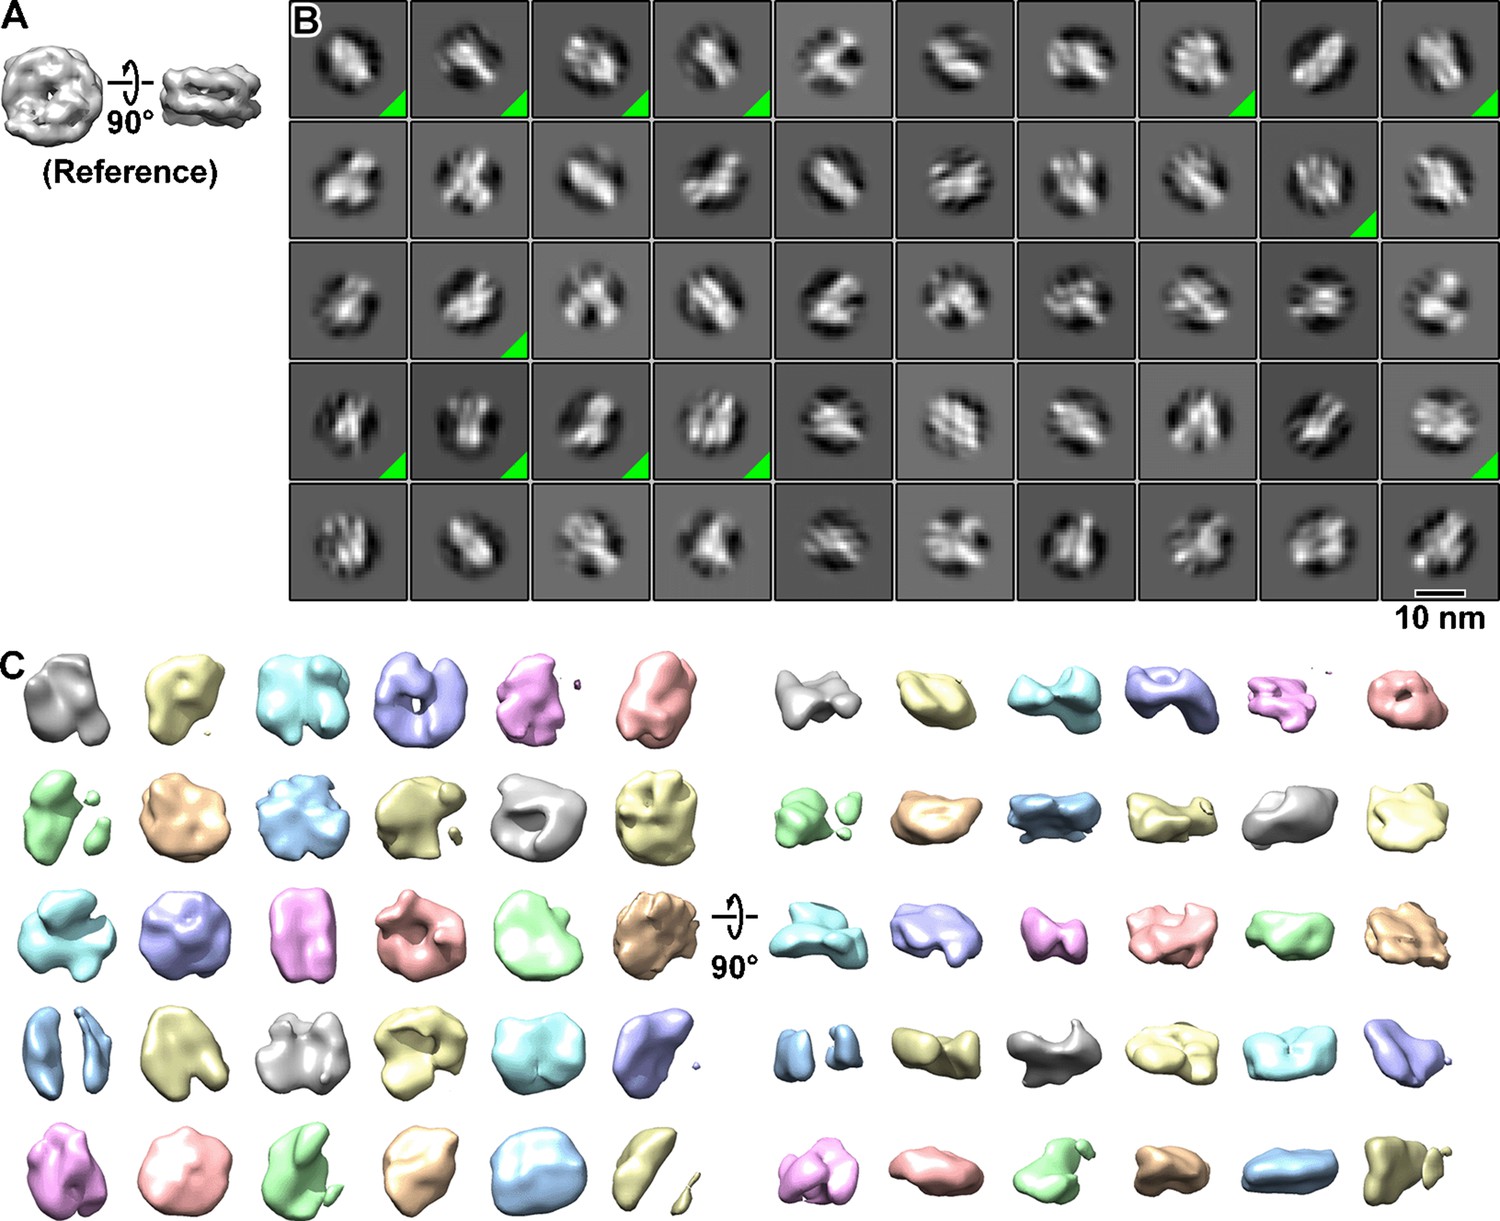
Classification of BY4741 (wild-type) nucleosome-like particles in situ.
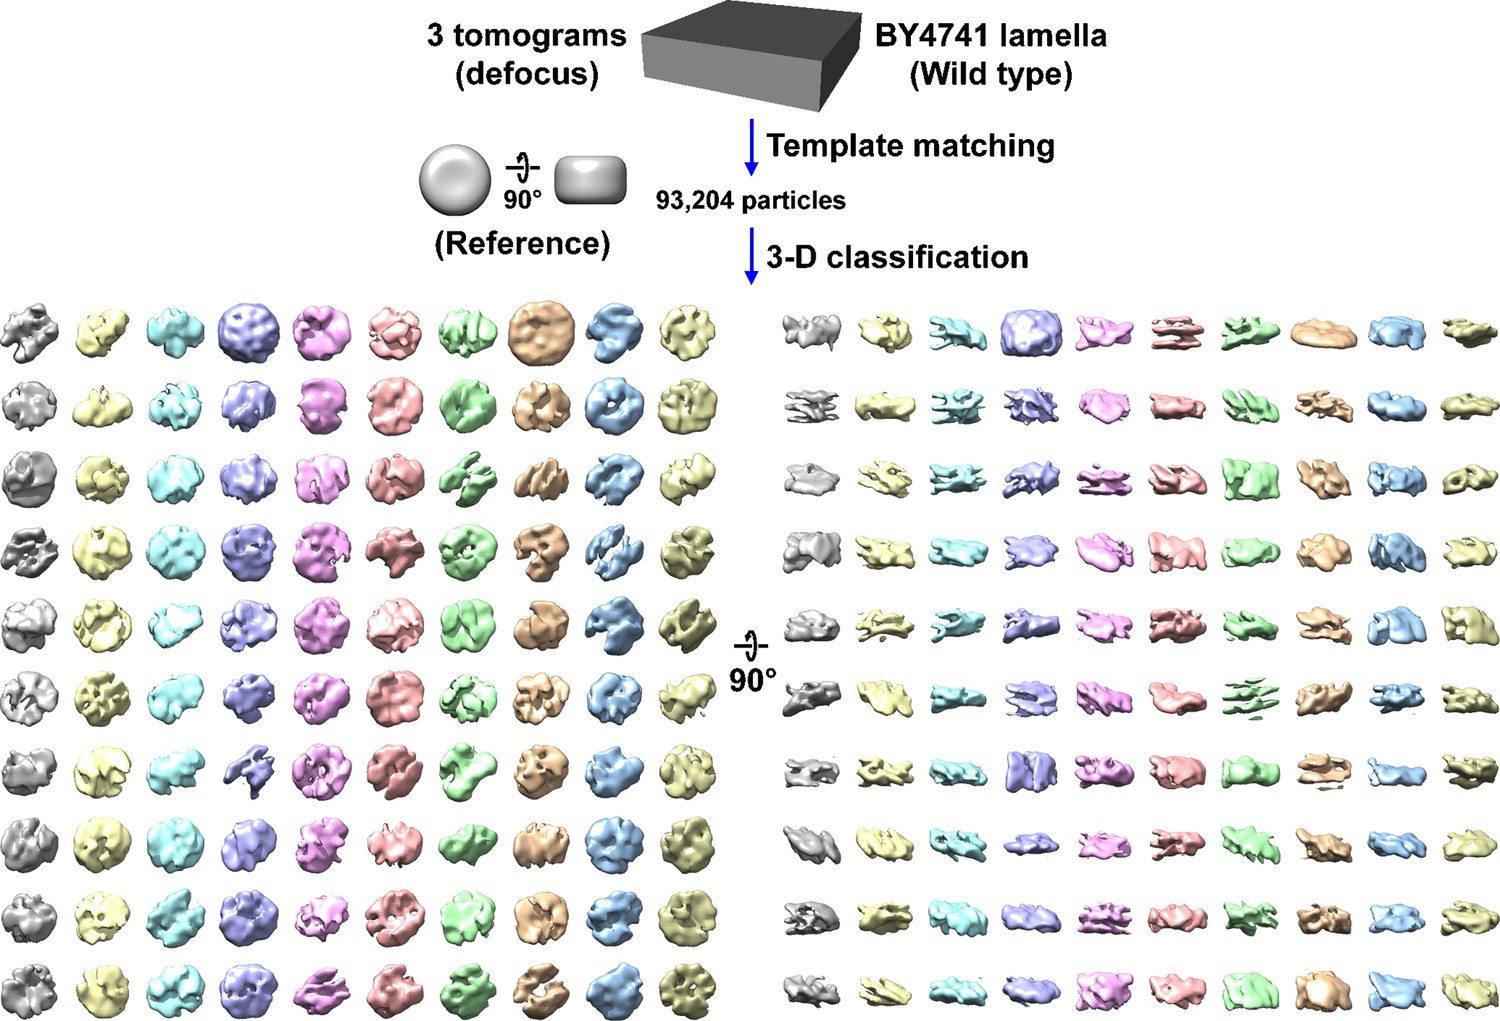
(A) Class averages (2D) of template-matched nucleosome-like particles in BY4741 (wild-type) cell cryolamellae imaged by defocus phase contrast (defocus). The class averages whose member particles were selected for additional rounds of classification are indicated by a green triangle in the box’s lower right corner. The starting dataset consisted of 93,204 template-matched candidate BY4741 nucleosomes from three tomograms, from which 16,608 particles were selected by 2D classification. (B) Class averages (3D) of nucleosome-like particles in BY4741 cells. A featureless cylinder was used as the reference for template matching and 3D classification. This workflow uses the same template-matched candidate nucleosomes as in Figure 1—figure supplement 6; see below.
Figure 1—figure supplement 6
Direct 3D classification of BY4741 (wild-type) cell cryolamellae densities.
Class averages (3D) of nucleosome-like particles in cryotomograms of BY4741 cell cryolamellae imaged by defocus phase contrast (defocus). In this experiment, 2D classification was bypassed. This workflow uses the same template-matched candidate nucleosomes as in Figure 1—figure supplement 5.
Figure 1—figure supplement 7
Classification using the nucleosome crystal structure reference.
(A) A simulated EM map from a crystal structure of the nucleosome was used as the template-matching and 3D classification reference. (B) Class averages (2D) of BY4741 (wild-type) nucleosome-like particles that were template matched using the nucleosome crystal structure. Classes that were pooled for 3D classification are indicated by a green triangle in the lower right corner of its box. Out of 72,190 template-matched particles, 6439 were selected by 2D classification. (C) Class averages (3D) of the most nucleosome-like particles selected by 2D classification. The classification was performed using the same dataset as for Figure 1—figure supplements 5 and 6.
Figure 1—figure supplement 8
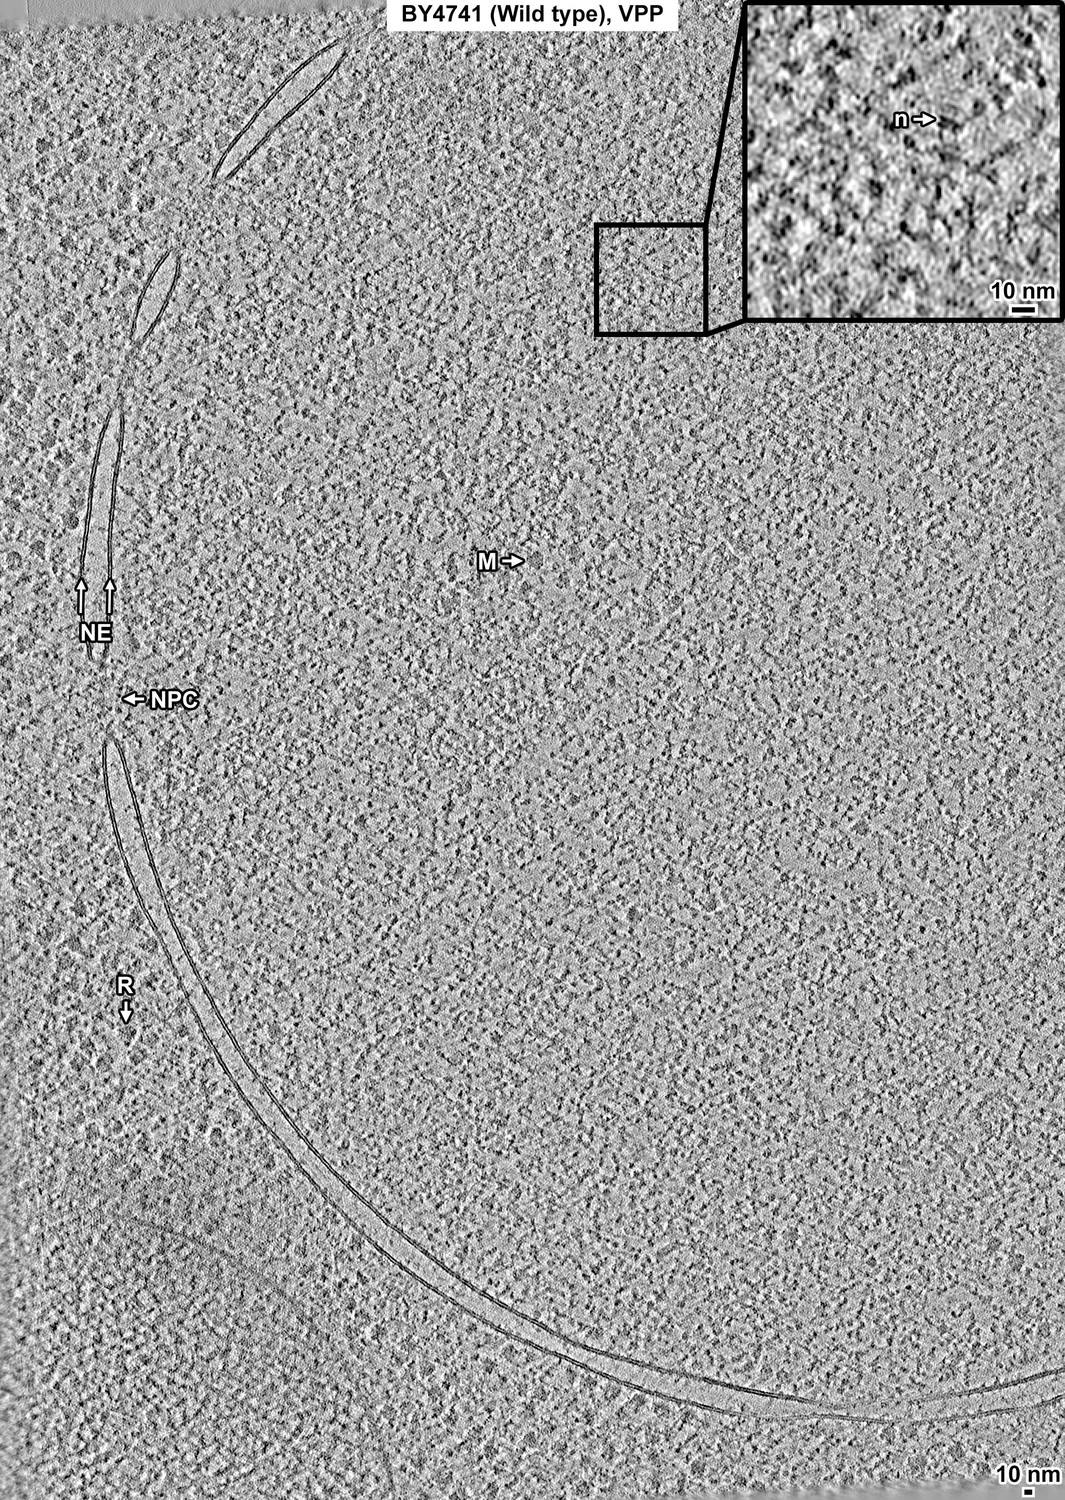
Overview of a BY4741 (wild-type) cell cryolamella, Volta phase plate (VPP) data.
Tomographic slice (12 nm) of a BY4741 cell cryolamella imaged with a VPP. The nuclear envelope (NE), nuclear pore complex (NPC), ribosome (R), and megacomplex (M) are indicated. The inset shows a threefold enlargement of the boxed area. A nucleosome-like complex (n) is indicated.
Figure 1—figure supplement 9
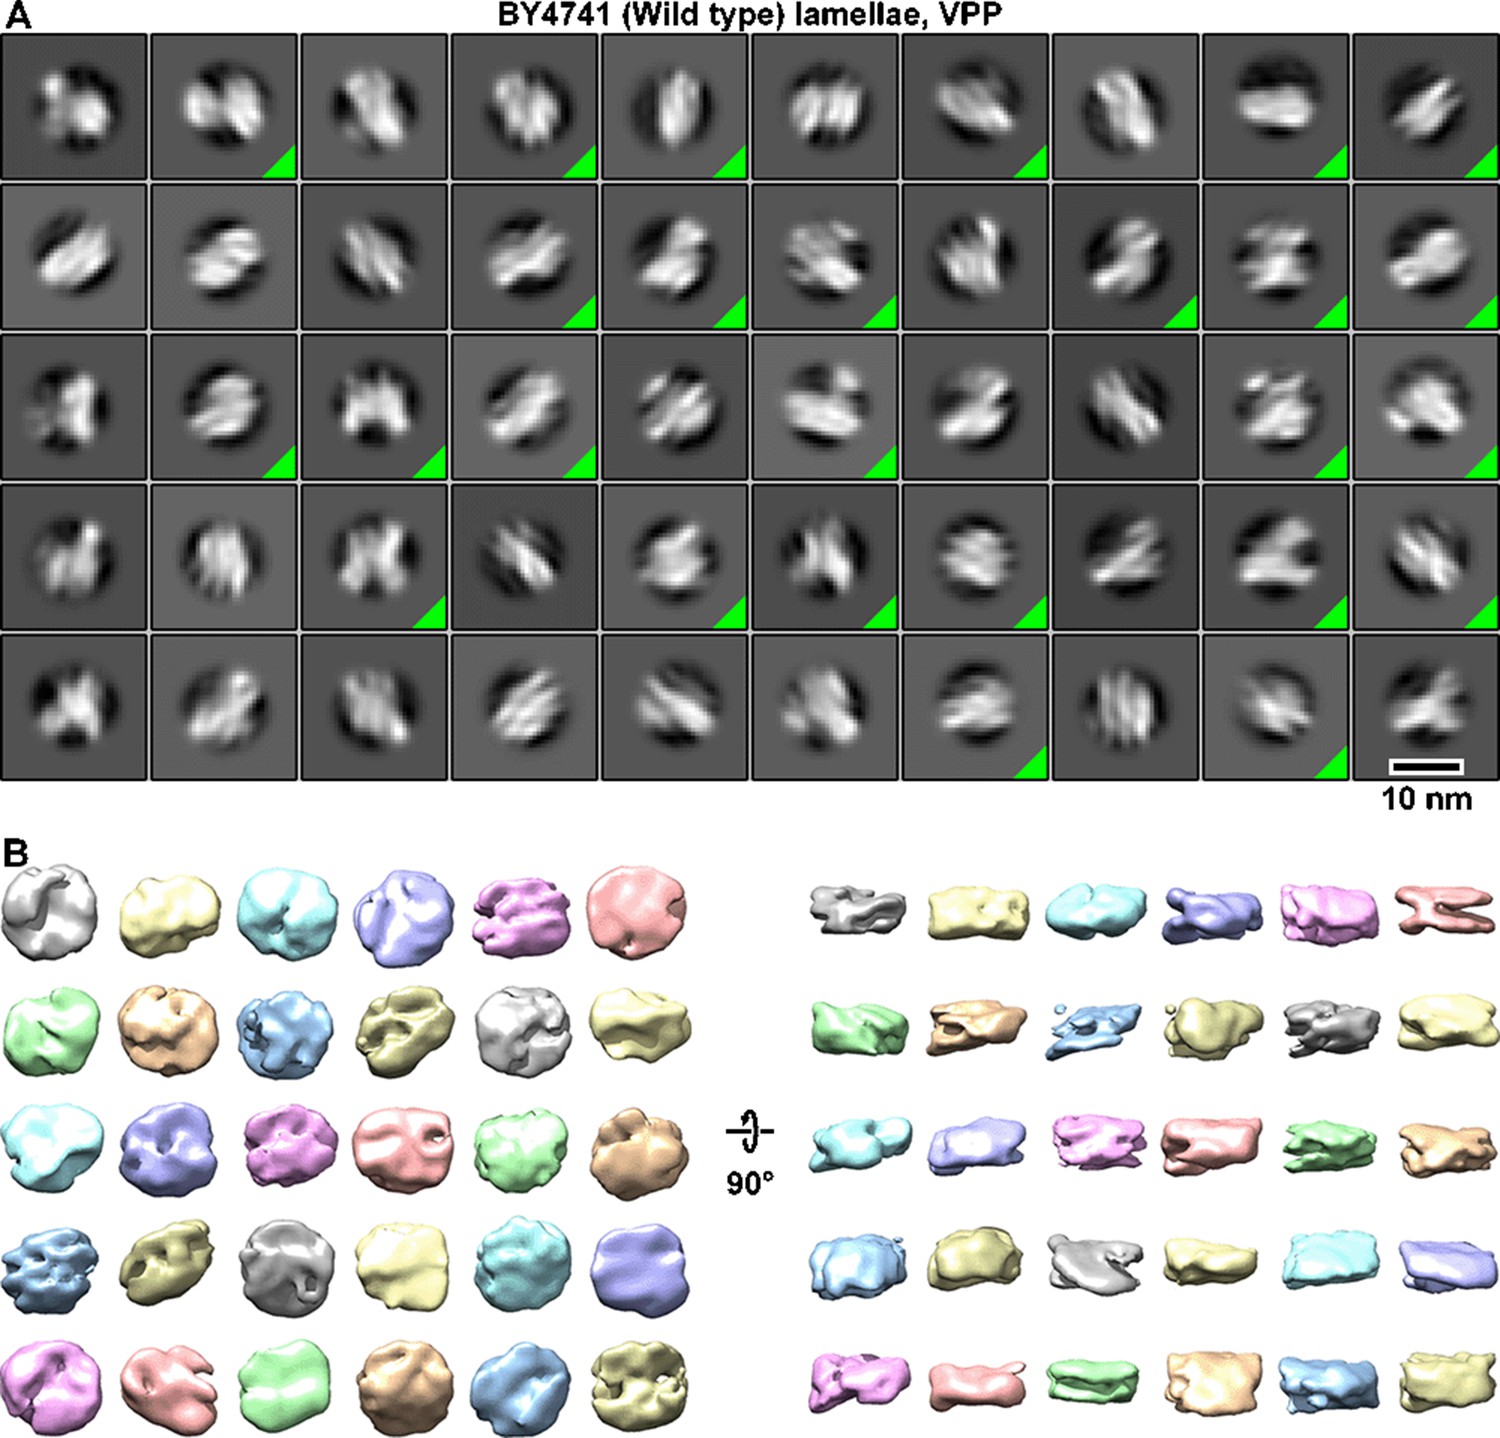
Classification of nucleosome-like particles in situ in BY4741 (wild-type) cell Volta phase plate (VPP) data.
(A) Class averages (2D) of template-matched nucleosome-like particles in VPP cryotomograms of BY4741 (wild-type) cell cryolamellae. The class averages whose member particles were selected for additional rounds of classification are indicated by a green triangle in the box’s lower right corner. The starting dataset consisted of 129,473 template-matched candidate BY4741 nucleosomes from three tomograms. 12,551 particles were selected by 2D classification. (B) Class averages (3D) of nucleosome-like particles in BY4741 cells imaged with a VPP.
Figure 1—figure supplement 10

Direct 3D classification of BY4741 (wild-type) nuclei in Volta phase plate (VPP) tomograms of cryolamellae.
(A) Class averages (3D) of BY4741 nucleosomes from VPP cryotomograms of cell cryolamellae. The canonical nucleosome class average is shaded blue and the percent of particles belonging is indicated under the density map. Note that this percentage is relative to the 129,473 template-matched nucleosome-like particles, not the ~25,000 expected number of nucleosomes in the five tomograms. (B) Second round of classification from the canonical nucleosome class identified in panel A. (C) The resolution of both class averages is ~24 Å by the Fourier shell correlation (FSC) = 0.5 criterion. The refined density maps are reproduced from Figure 1C and the number of particles per class is labeled in black. (D) Angular distribution plot of the canonical nucleosome class from panel A. Figure 1—videos 1 and 2 show the progress of this classification jobs in panels A and B, respectively.
Figure 1—figure supplement 11
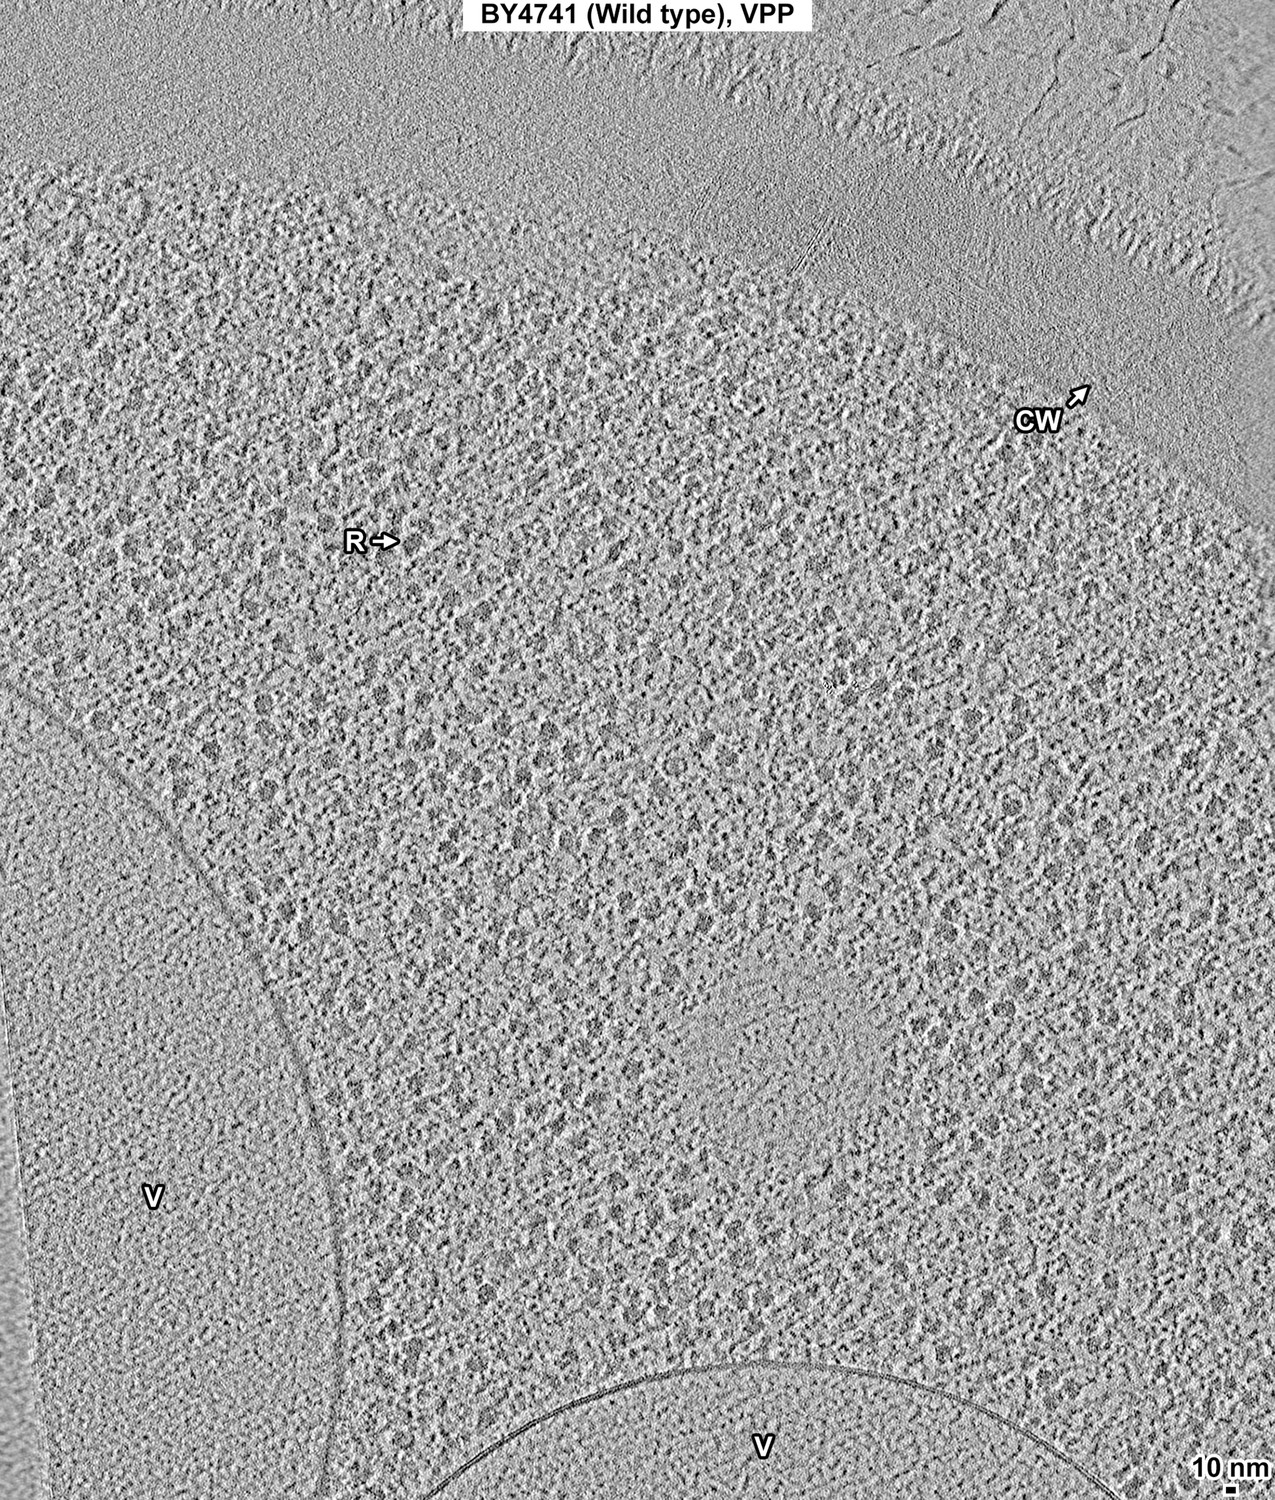
Overview of a BY4741 (wild-type) cell cryolamella imaged in the cytoplasm, Volta phase plate (VPP) data.
Tomographic slice (12 nm) of a BY4741 cell cryolamella imaged in the cytoplasm with a VPP. The vacuoles (V), a ribosome (R), and cell wall (CW) are indicated.
Figure 1—figure supplement 12

Classification of BY4741 (wild-type) cell cryolamellae Volta phase plate (VPP) densities from the cytoplasm.
Class averages (3D) of ‘nucleosome-like’ particles that were template matched from the cytoplasm in a BY4741 cell cryolamella imaged with a VPP. Both the template-matching and 3D classification parameters were identical to the ones used to analyze the nucleus. 2D classification was bypassed. One class has no contributing particles and was removed.
Figure 1—video 1
Direct 3D classification of BY4741 (wild-type) nucleosome-like particles in Volta phase plate (VPP) tomograms of cell cryolamellae, round 1.
The progress of 30 rounds of 3D classification is shown. There are 100 classes, initialized with a smooth nucleosome-sized cylindrical reference. The final iteration (30) is also shown in Figure 1—figure supplement 10, with only the most nucleosome-like classes shaded.
Figure 1—video 2
Direct 3D classification of BY4741 (wild-type) nucleosome-like particles in Volta phase plate (VPP) tomograms of cell cryolamellae, round 2.
The most nucleosome-like classes from round 1 were selected and subjected to a second round of classification, with four classes, again initialized with a smooth nucleosome-sized cylindrical reference.
Figure 2
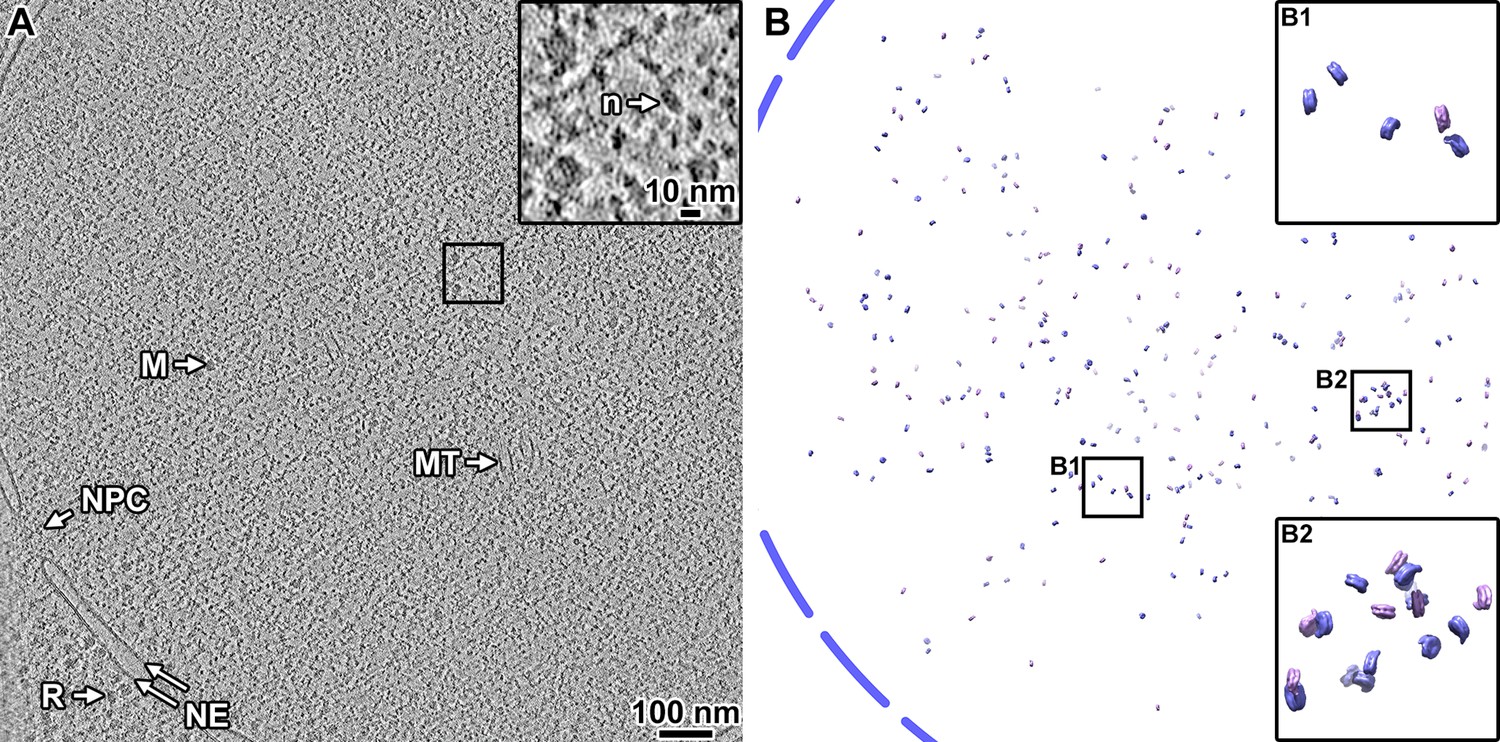
Canonical nucleosomes are a minority of the expected total in wild-type cells.
(A) Volta phase plate tomographic slice (12 nm) of a BY4741 cell cryolamella. Large subcellular structures are labeled: nuclear pore complex (NPC), nuclear megacomplex (M), nuclear microtubule (MT), nuclear envelope (NE), and ribosome (R). The inset is a fourfold enlargement of the boxed area, and a nucleosome-like particle (n) is indicated. (B) Remapped model of the two canonical nucleosome class averages in the tomogram from panel A: the class averages were oriented and positioned in the locations of their contributing subtomograms. The approximate location of the nuclear envelope is indicated by the blue dashed line. The insets B1 and B2 show fourfold enlargements of the corresponding boxed areas. Note that the remapped model projects the full 150 nm thickness of this cryolamella. In this tomogram, we estimate there are ~7600 nucleosomes (see Materials and methods on how the calculation is done), of which 297 are canonical structures. Accounting for the missing disc views, we estimate there are ~594 canonical nucleosomes in this cryolamella (<8% the expected number of nucleosomes).
Figure 3 with 9 supplements
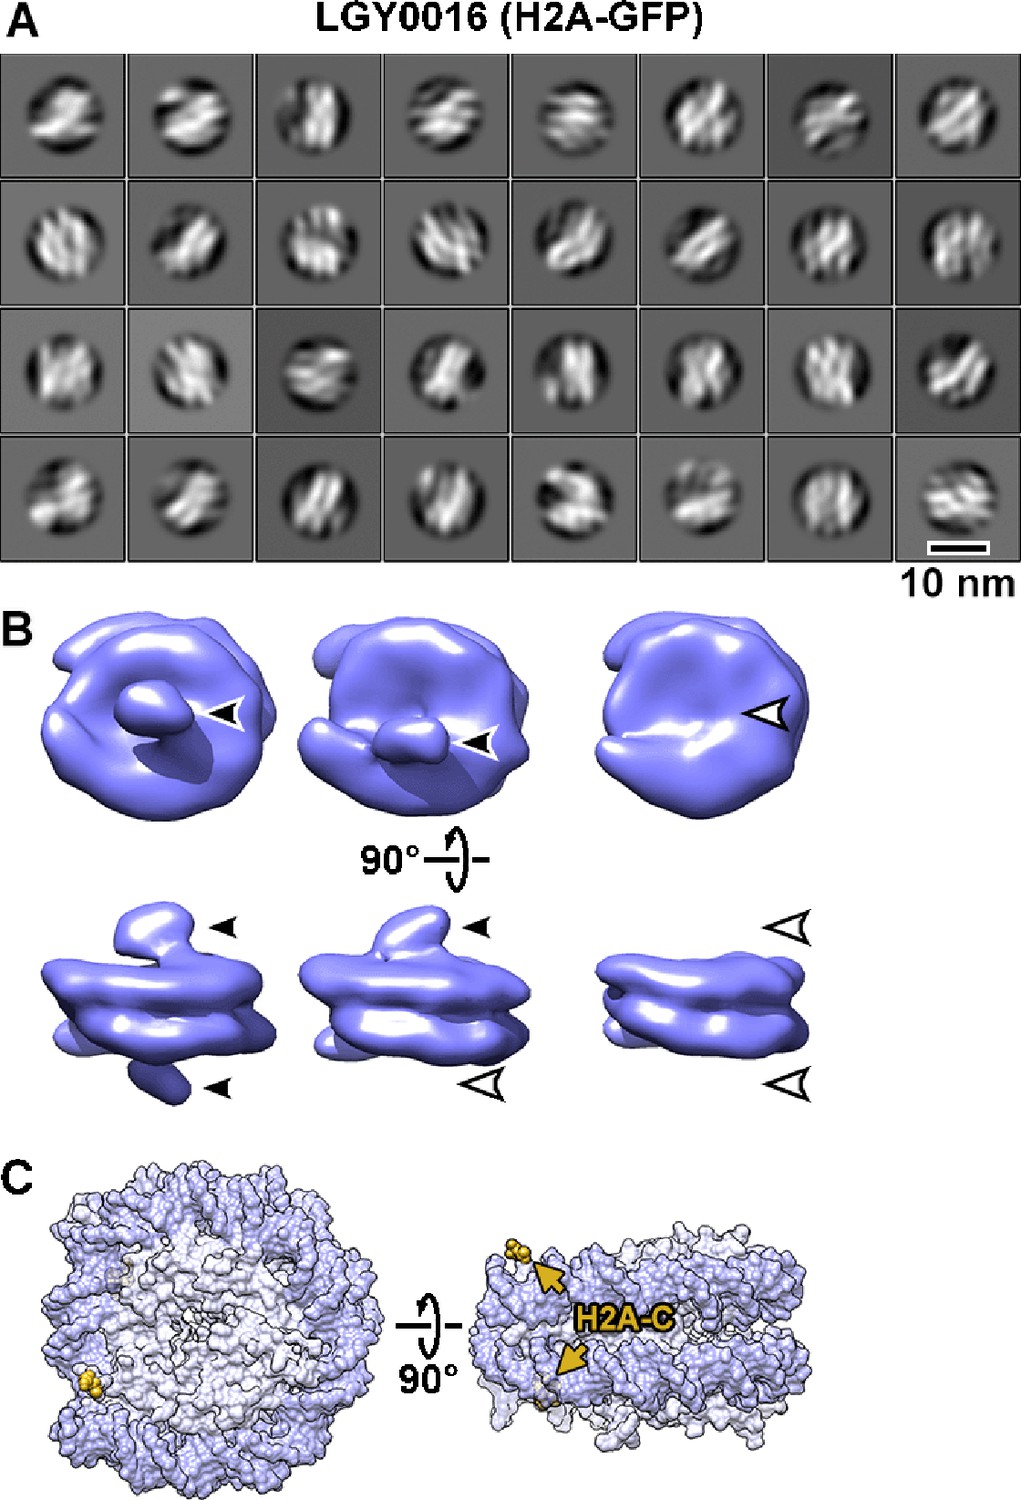
Visualization of GFP-tagged nucleosomes in vitro.
(A) Example 2D class averages of nucleosome-like particles that were template-matched with a featureless cylinder reference. Out of 88,896 template-matched particles, 66,328 were retained after 2D classification. (B) Class averages (3D) of nucleosomes from nuclear lysates. Solid arrowheads indicate the extra (GFP) densities. Open arrowheads indicate the positions that lack this density. These class averages were obtained after classification directly from subtomogram averaging, without an intervening 2D classification step. (C) The approximate positions of the H2A C-termini are rendered in yellow and indicated by arrows in the crystal structure of the yeast nucleosome (White et al., 2001). Note that in the crystal structure, fewer of the H2A C-terminal amino acids were modeled than for H2B, meaning that the H2A C-terminus is not perfectly ordered. To facilitate comparison, this structure is oriented like the class averages in panel B. The nucleosome densities in panel B are longer along the pseudo-dyad axis (horizontal) because they have linker DNA, which is absent in the nucleosome crystal structure.
Figure 3—figure supplement 1
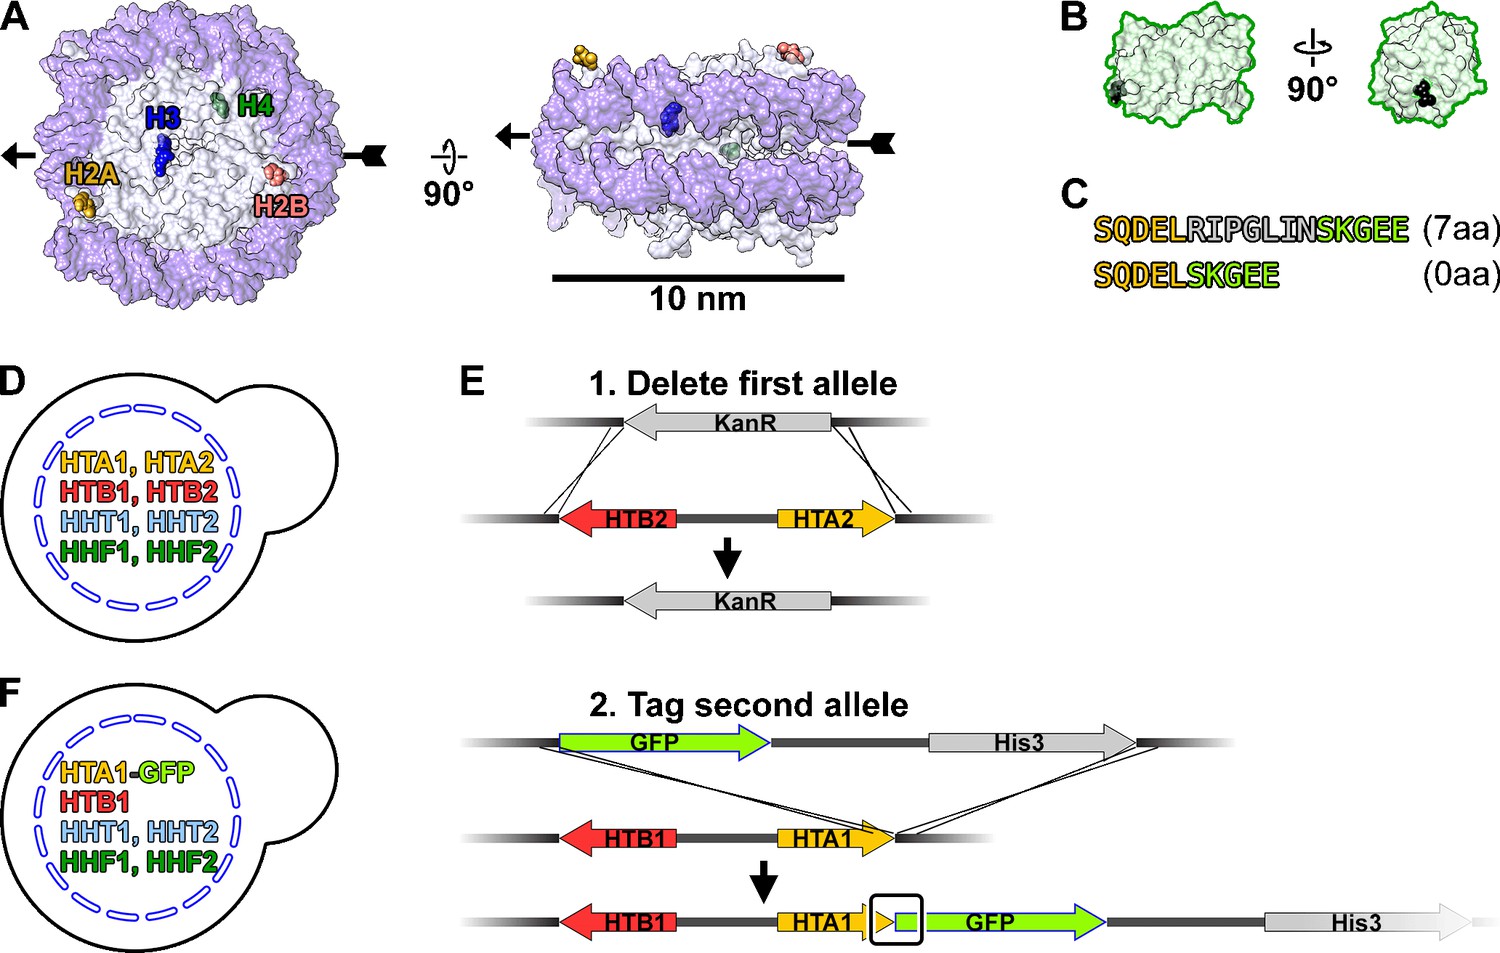
Strategy to tag H2A with GFP.
(A) Crystal structure of the yeast nucleosome, PDB 1ID3 (White et al., 2001), in the disc view (left) and side view (right). DNA, dark purple; histone octamer, light gray. One set of histone C-termini are labeled and rendered as space-filling models. Two key points of reference, pseudo-dyad and opposite pseudo-dyad, are indicated by the arrowhead and arrow tail, respectively. The other set of C-termini is related by a 180° rotation around the pseudo-dyad axis. (B) Two views of the GFP crystal structure, PDB 1GFL (Yang et al., 1996), rendered at the same scale as panel A. The N-terminus is rendered as a black space-filling model. (C) Details of the sequence at the H2A-GFP fusion, with (7aa) and without (0aa) the seven amino acid linker. The H2A C-terminal sequence is shaded yellow, GFP N-terminal sequence is shaded green, and the flexible linker is shaded gray. LGY0016 has a 0aa linker. (D) Histone genotype of the parent strain BY4741. (E) Homologous recombination strategy to C-terminally tag the sole copy of the H2A gene with GFP. Upper – replacement of the HTA2-HTB2 locus with KanR. Lower – tagging of HTA1 with GFP. The junction between the HTA1 (H2A) and GFP is boxed. (F) Histone genotype of LGY0016.
Figure 3—figure supplement 2

Experimental verification of H2A-GFP and H2B-GFP tagging.
(A) Maps of the two H2A-H2B loci in the parent (wild-type) strain BY4741 and the H2A-GFP strain LGY0016. Primers used for PCR verification are indicated with the half arrow symbols. (B) Agarose gel of PCR amplicons expected (or not) from LGY0016 genomic DNA, in which the HTB2-HTA2 locus is deleted and the HTA1 locus is tagged with GFP. (C) Immunoblot analysis of strains LGY0016 (expresses H2A-GFP only) and LGY0012 (expresses H2A only, control). The α-GFP antibody correctly detected the large H2A-GFP fusion protein in LGY0016 (lane 4) but not in LGY0012 (lane 3, negative control). The α-H2A antibody detected H2A-GFP in LGY0016 and H2A in LGY0012. (D) DIC and GFP fluorescence confocal microscopy for LGY0016 cells. In the left panel, the GFP signals are overlaid in green. In the right panel, GFP signals are rendered with inverted contrast. (E) Map of the HTA1-HTB1 locus before (upper) and after (lower) the GFP insertion, with validation primers indicated. The color scheme is the same as in panel A. Note that LGY0015 still has the HTA2-HTB2 gene pair and therefore expresses untagged H2B. (F) Validation PCR for LG0015. (G) Validation immunoblots for strains BY4741 (wild-type) and LGY0015 (expresses H2B and H2B-GFP). The α-GFP detected an ~40 kDa protein (H2B-GFP) in LGY0015 but not BY4741. The α-H2B antibody detects the 40 kDa protein (H2B-GFP) in LGY0015 but not BY4741. Note that the α-H2B antibody has poorer specificity and does not generate a strong signal for the untagged H2B. (H) In the left panel, the GFP signals are overlaid in green. In the right panel, GFP signals are rendered with inverted contrast.
-
Figure 3—figure supplement 2—source data 1
Agarose gel of PCR amplicons expected (or not) from LGY0016 genomic DNA, in which the HTB2-HTA2 locus is deleted and the HTA1 locus is tagged with GFP.
- https://cdn.elifesciences.org/articles/87672/elife-87672-fig3-figsupp2-data1-v1.zip
-
Figure 3—figure supplement 2—source data 2
Immunoblot analysis of strains LGY0016 and LGY0012 with α-GFP antibody.
The unlabeled bands on the right were from a previous attempt for immunoblot analysis of strain LGY0015.
- https://cdn.elifesciences.org/articles/87672/elife-87672-fig3-figsupp2-data2-v1.zip
-
Figure 3—figure supplement 2—source data 3
Immunoblot analysis of strains LGY0016 and LGY0012 with α-H2A antibody.
- https://cdn.elifesciences.org/articles/87672/elife-87672-fig3-figsupp2-data3-v1.zip
-
Figure 3—figure supplement 2—source data 4
Immunoblot analysis loading control of strains LGY0016 and LGY0012 with α-H3 antibody.
The unlabeled bands on the right were from a previous attempt for immunoblot analysis of strain LGY0015.
- https://cdn.elifesciences.org/articles/87672/elife-87672-fig3-figsupp2-data4-v1.zip
-
Figure 3—figure supplement 2—source data 5
DIC and GFP fluorescence confocal microscopy for LGY0016 cells.
- https://cdn.elifesciences.org/articles/87672/elife-87672-fig3-figsupp2-data5-v1.zip
-
Figure 3—figure supplement 2—source data 6
Agarose gel of PCR amplicons expected from LGY0015 genomic DNA, in which the HTB1 locus is tagged with GFP.
- https://cdn.elifesciences.org/articles/87672/elife-87672-fig3-figsupp2-data6-v1.zip
-
Figure 3—figure supplement 2—source data 7
Immunoblot analysis of strain LGY0015 with α-GFP antibody.
- https://cdn.elifesciences.org/articles/87672/elife-87672-fig3-figsupp2-data7-v1.zip
-
Figure 3—figure supplement 2—source data 8
Immunoblot analysis of strain LGY0015 with α-H2B antibody.
- https://cdn.elifesciences.org/articles/87672/elife-87672-fig3-figsupp2-data8-v1.zip
-
Figure 3—figure supplement 2—source data 9
Immunoblot analysis loading control of strain LGY0015 with α-H3 antibody.
- https://cdn.elifesciences.org/articles/87672/elife-87672-fig3-figsupp2-data9-v1.zip
-
Figure 3—figure supplement 2—source data 10
DIC and GFP fluorescence confocal microscopy for LGY0015 cells.
- https://cdn.elifesciences.org/articles/87672/elife-87672-fig3-figsupp2-data10-v1.zip
Figure 3—figure supplement 3

Overview of LGY0016 (H2A-GFP) nuclear lysate, defocus data.
Tomographic slice (12 nm) of LGY0016 nuclear lysates imaged with defocus phase contrast (defocus). Some non-chromatin features are indicated: carbon support film (carbon), membrane fragments (membrane), gold fiducial (Au), and virus-like particle (VLP). The abundant granular densities in this field of view are nucleosomes. One small subarea (boxed) is enlarged threefold in the inset. A nucleosome-like particle (n) is indicated.
Figure 3—figure supplement 4

Overview of LGY0015 (H2B, H2B-GFP) nuclear lysate, defocus data.
Tomographic slice (12 nm) of LGY0015 nuclear lysates imaged with defocus phase contrast (defocus). Some non-chromatin features are indicated: carbon support film (carbon), membrane fragments (membrane), gold fiducial (Au), and virus-like particle (VLP). The abundant granular densities in this field of view are nucleosomes. One small subarea (boxed) is enlarged threefold in the inset. A nucleosome-like particle (n) is indicated.
Figure 3—figure supplement 5

Classification of LGY0015 (H2B, H2B-GFP) nuclear lysates.
(A) Class averages (2D) of nucleosome-like particles. Out of 96,979 template-matched particles from six tomograms, 56,872 particles were selected by 2D classification. (B) Class averages (3D) of two types of LGY0015 nucleosomes. The solid arrowhead indicates the position of the GFP tag whereas the open arrowheads indicate the positions that lack this density. These are the same class averages shown in the overall workflow in Figure 3—figure supplement 7. (C) Two views of the nucleosome crystal structure, indicating the location of the H2B C-terminus (salmon).
Figure 3—figure supplement 6

Direct 3D classification of LGY0016 (H2A-GFP) nuclear lysates.
(A) Class averages (3D) of nucleosome-like particles from nuclear lysates of LGY0016 cells. The canonical nucleosome-like class averages are shaded blue while the non-canonical nucleosome averages are shaded gray. Figure 3—video 1 shows the convergence of the classification and shows more views of these class averages. (B) The second round of 3D classification, using the canonical nucleosomes from panel A. See Figure 3—video 2 for more details of this classification job. (C) Refined densities of three types of LGY0016 nucleosomes isolated from nuclear lysates; reproduced from Figure 3B. The class numbers correspond to those in panel B (blue text) while the number of particles per class are labeled in black. The Fourier shell correlation (FSC) plot of the three refined class averages is labeled with the same numbering scheme. The resolution is ~26 Å by the FSC = 0.5 criterion. Some of the class averages are ‘missing’ one or both expected GFP densities. The possible explanations include mobility of a subpopulation of GFPs or H2A-GFPs, incorrectly folded GFPs, or substitution of H2A for the variant histone H2A.Z.
Figure 3—figure supplement 7
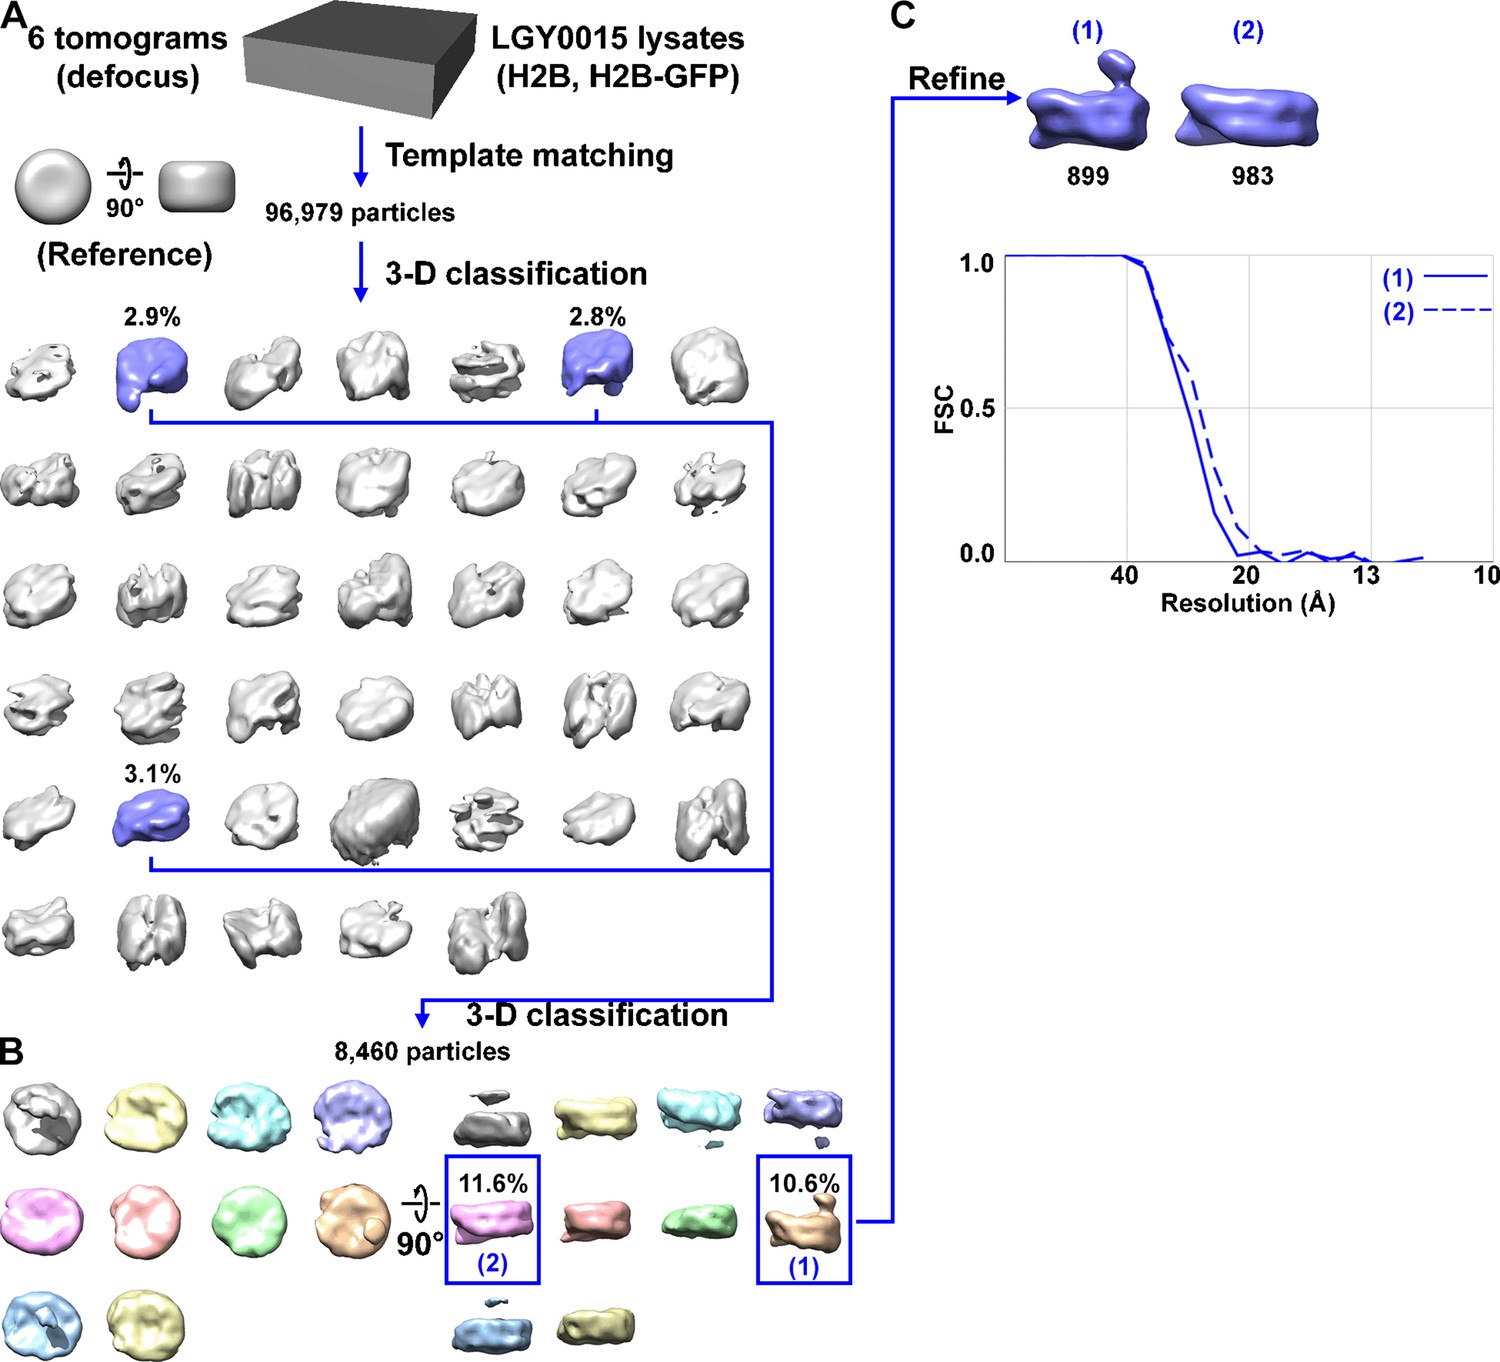
Direct 3D classification of LGY0015 (H2B, H2B-GFP) nuclear lysates.
(A) Class averages of nucleosome-like particles from nuclear lysates of LGY0015 cells. The canonical nucleosome class averages are shaded blue while the non-canonical nucleosome averages are shaded gray. (B) The second round of 3D classification, using the canonical nucleosomes from panel A. Note that some class averages, such as the gray one, have a density that is not connected to the nucleosome. This density is from a nearby particle that protruded into the mask. (C) The two types of LGY0015 nucleosomes are reproduced from Figure 3—figure supplement 5, panel B. The numbers of particles per class are indicated below the density maps in black. The Fourier shell correlation (FSC) plot of the LGY0015 nuclear lysates nucleosome class averages in panel D uses the same numbering scheme. The resolution is ~26 Å by the FSC = 0.5 criterion.
Figure 3—video 1
Direct 3D classification of LGY0016 (H2A-GFP) lysate nucleosomes, round 1.
The progress of 30 rounds of 3D classification is shown. There are 40 classes, initialized with a smooth nucleosome-sized cylindrical reference. The final iteration (30) is also shown in Figure 3—figure supplement 6, with only the most nucleosome-like classes shaded.
Figure 3—video 2
Direct 3D classification of LGY0016 (H2A-GFP) lysate nucleosomes, round 2.
The most nucleosome-like classes from round 1 were selected and subjected to a second round of classification, with 10 classes, again initialized with a smooth nucleosome-sized cylindrical reference. Two ‘junk’ classes were removed.
Figure 4 with 15 supplements
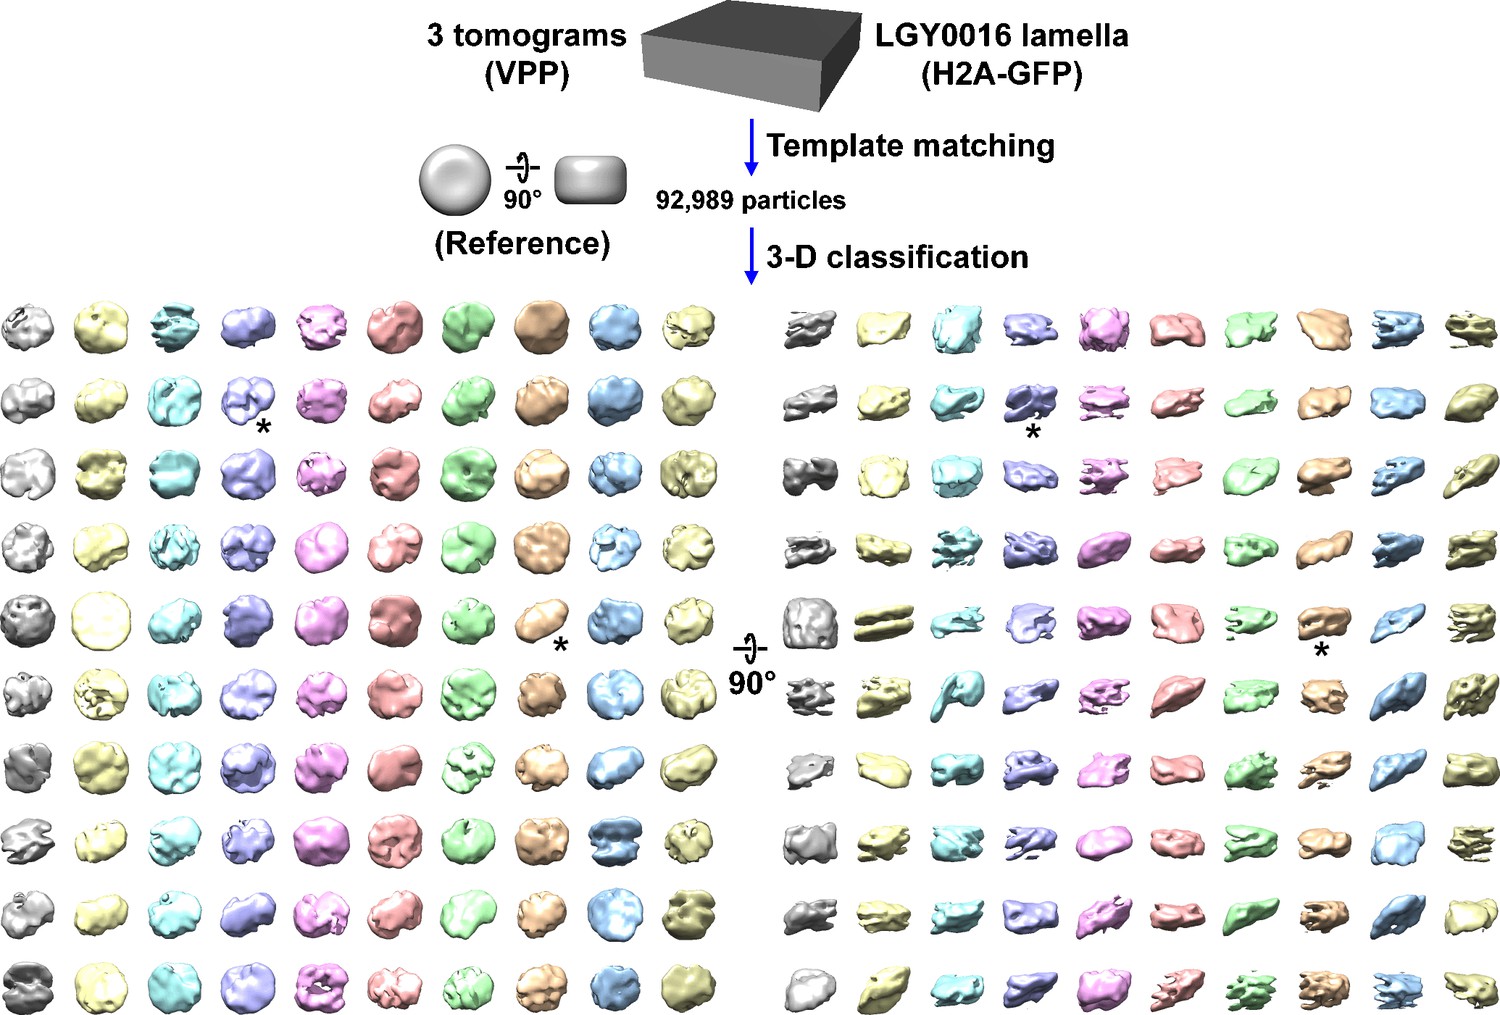
Canonical nucleosome class averages are not detected in LGY0016 (H2A-GFP) cells in situ.
Class averages (3D) of nucleosome-like particles in Volta phase plate (VPP) cryotomograms of LGY0016 cryolamellae. The starred classes have two linear motifs. Figure 4—video 1 shows the progress of this classification job.
Figure 4—figure supplement 1

Overview of a LGY0016 (H2A-GFP) cell cryolamella, defocus data.
Tomographic slice (12 nm) of a LGY0016 cryolamella, imaged with defocus phase contrast. Some non-chromatin features are indicated: nuclear envelope (NE), nuclear microtubule (MT), megacomplex (M), and ribosome (R). The inset is a threefold enlargement of the boxed area. A nucleosome-like particle (n) is indicated.
Figure 4—figure supplement 2

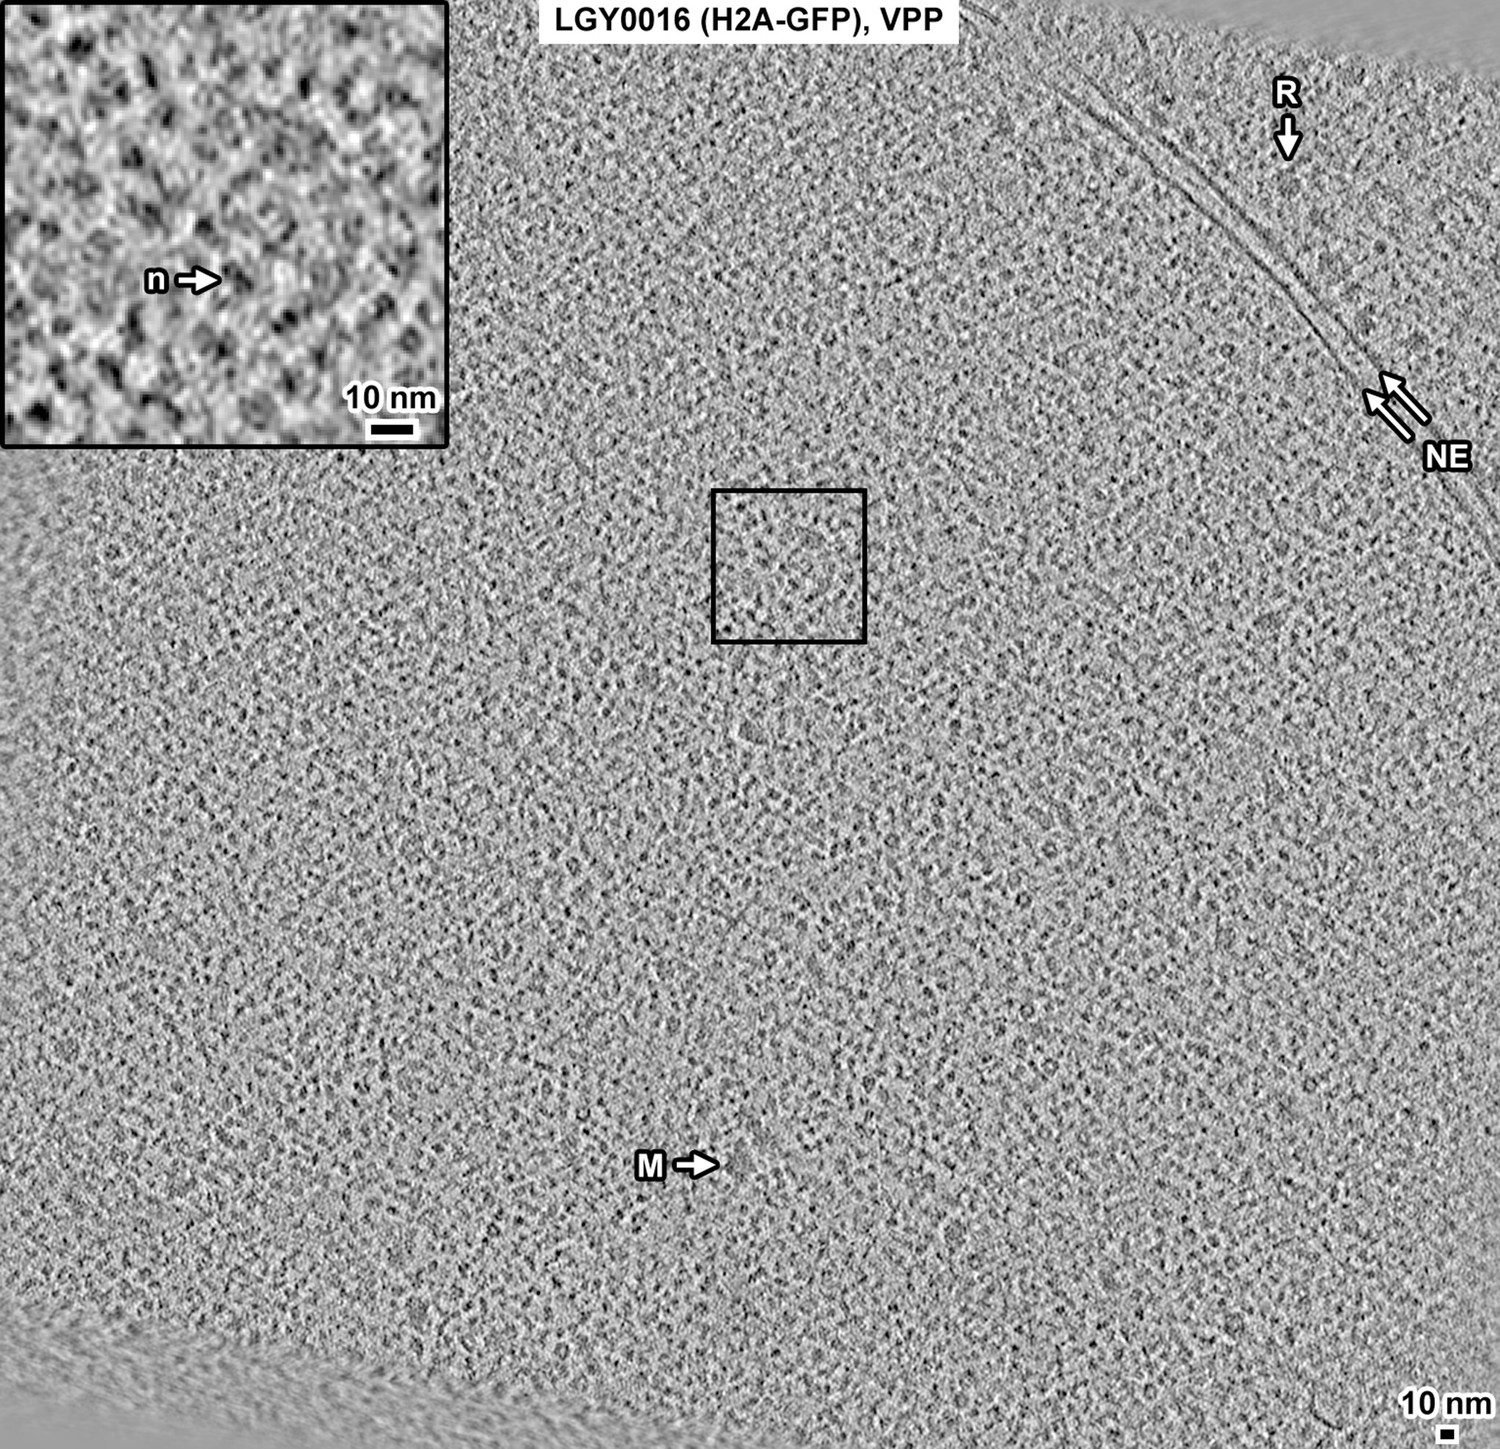
Overview of a LGY0016 (H2A-GFP) cell cryolamella, Volta phase plate (VPP) data.
Tomographic slice (12 nm) of a LGY0016 cryolamella imaged with a VPP. The nuclear envelope (NE), nuclear microtubule (MT), and a megacomplex (M) are indicated. The inset is a threefold enlargement of the boxed area. A nucleosome-like particle (n) is indicated.
Figure 4—figure supplement 3
Overview of a LGY0016 (H2A-GFP) cell cryosection, Volta phase plate (VPP) data.
Tomographic slice (12 nm) of a LGY0016 cryosection imaged with a VPP. Some non-chromatin features are indicated: nuclear envelope (NE), megacomplex (M), and ribosome (R). The inset is a threefold enlargement of the boxed area. A nucleosome-like particle (n) is indicated. The smeared features at the lower left are back-projection artifacts from image borders.
Figure 4—figure supplement 4
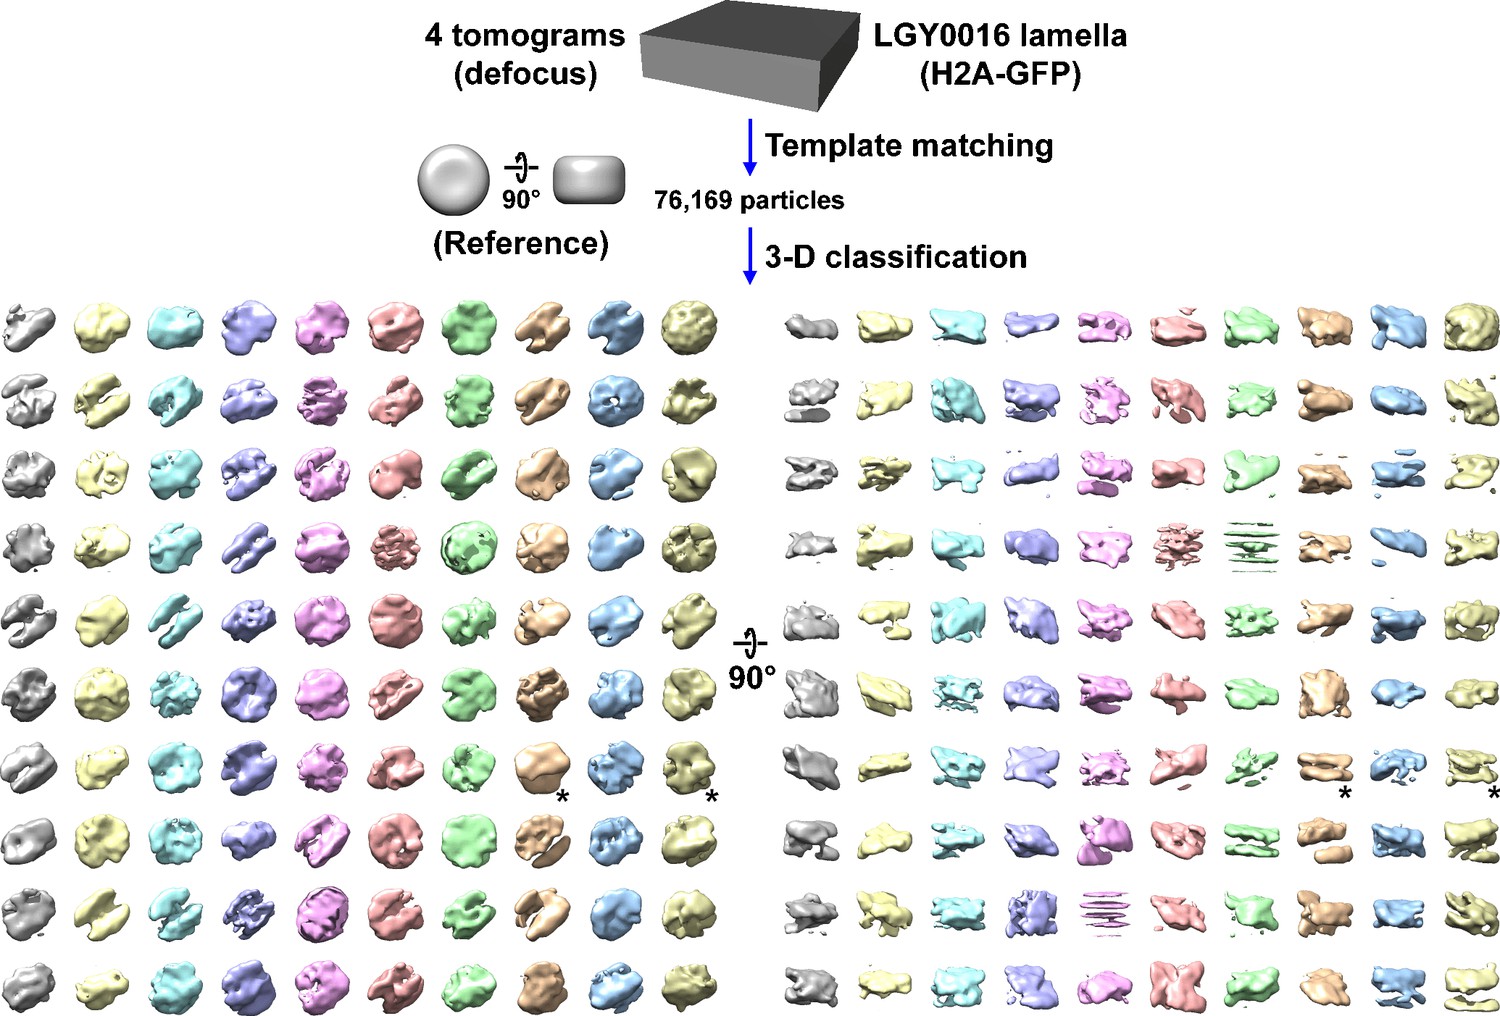
Direct 3D classification of LGY0016 (H2A-GFP) cell cryolamellae densities.
Class averages (3D) of nucleosome-like particles in cryotomograms of LGY0016 cell cryolamellae imaged with defocus phase contrast (defocus). The starred classes have two linear motifs.
Figure 4—figure supplement 5

Direct 3D classification of LGY0016 (H2A-GFP) cell cryosection densities in Volta phase plate (VPP) data.
Class averages (3D) of nucleosome-like particles in VPP cryotomograms of LGY0016 cell cryosections imaged with a VPP. The starred classes have two linear motifs.
Figure 4—figure supplement 6

Control Volta phase plate (VPP) subtomogram analysis of ribosomes in situ.
(A) Candidate ribosomes were template matched from a single VPP tomogram of the cytoplasm from Figure 1—figure supplement 11, using a 25-nm-diameter sphere as a reference. Direct 3D classification into ten classes led to six non-empty classes, of which two were of ribosomes. Note that template matching is insufficient to uniquely identify a macromolecular complex, particularly when the reference is a featureless body like a sphere or cylinder. A simple reference was used to reduce the model bias. Template matching done with featureless references generates substantial numbers of false positives, which are confidently removed by classification. Complexes are only considered as identified after the 3D classification step produces recognizable class averages. Therefore, the term ‘candidate ribosomes’ is used to describe the 3816 template-matching hits. (B) The 1150 ribosome subtomograms were pooled and 3D refined, producing an average at 28 Å resolution by the ‘gold-standard’ Fourier shell correlation (FSC) (0.143 cutoff) criterion and 33 Å resolution with an FSC = 0.5 cutoff. (C) Comparison of the in situ ribosome subtomogram average (STA) with density maps simulated from the yeast ribosome crystal structure (Ben-Shem et al., 2011) at three different resolutions.
Figure 4—figure supplement 7

Verification of (H3, H3-GFP) strains.
(A) Map of the HHT1-HHF1 locus in the parent (wild-type) strain BY4741 and the H3-GFP strains LGY0002 (H3, H3-RIPGLIN-GFP), LGY0007 (H3, H3-0aa-GFP), and LGY0070 (H3, H3-GGSGGS-GFP). Primers used for PCR verification are indicated with the half arrow symbols. (B) Agarose gel of PCR amplicons expected from LGY0002, LGY0007, and LGY0070 genomic DNA, in which the HHT1 locus is tagged with GFP. The only difference between the strains is the linker separating HHT1 and the GFP, which is too small to observe a difference in PCR amplicon sizes. (C) Immunoblot analysis of strains LGY0002, LGY0007, and LGY0070. The α-GFP antibody correctly detected the large H3-GFP fusion protein in LGY0002 (lane 3), LGY0007 (lane 4), and LGY0070 (lane 5), but not in BY4741 (lane 2, negative control). The α-H3 antibody detected H3 in all lanes, but failed to detect H3-GFP in LGY0002, LGY0007, and LGY0070. (D) DIC and GFP fluorescence confocal microscopy for LGY0002, LGY0007, and LGY0070 cells. In the left panel, the GFP signals are overlaid in green. In the right panel, GFP signals are rendered with inverted contrast.
-
Figure 4—figure supplement 7—source data 1
Agarose gel of PCR amplicons expected from LGY0002, LGY0007, and LGY0070 genomic DNA, in which the HHT1 locus is tagged with GFP, and LGY0071 genomic DNA, in which the HHF1 locus is tagged with GFP.
This data was also used in Figure 4—figure supplement 8, panel B. The unlabeled bands between the HHT1 and the HHF1 bands were duplicate loadings of LGY0071 genomic DNA PCR amplicons.
- https://cdn.elifesciences.org/articles/87672/elife-87672-fig4-figsupp7-data1-v1.zip
-
Figure 4—figure supplement 7—source data 2
Immunoblot analysis of strains LGY0002, LGY0007, LGY0070, and LGY0071 with α-GFP antibody.
This data was also used in Figure 4—figure supplement 8, panel C.
- https://cdn.elifesciences.org/articles/87672/elife-87672-fig4-figsupp7-data2-v1.zip
-
Figure 4—figure supplement 7—source data 3
Immunoblot analysis of strains LGY0002, LGY0007, and LGY0070 with α-H3 antibody.
H3-GFP was expected to appear between 40 kDa and 50 kDa in these strains, but the antibody failed to detect the fusion protein.
- https://cdn.elifesciences.org/articles/87672/elife-87672-fig4-figsupp7-data3-v1.zip
-
Figure 4—figure supplement 7—source data 4
Immunoblot analysis loading control of strains LGY0002, LGY0007, and LGY0070 with α-H4 antibody.
- https://cdn.elifesciences.org/articles/87672/elife-87672-fig4-figsupp7-data4-v1.zip
-
Figure 4—figure supplement 7—source data 5
DIC and GFP fluorescence confocal microscopy for LGY0002 cells.
- https://cdn.elifesciences.org/articles/87672/elife-87672-fig4-figsupp7-data5-v1.zip
-
Figure 4—figure supplement 7—source data 6
DIC and GFP fluorescence confocal microscopy for LGY0007 cells.
- https://cdn.elifesciences.org/articles/87672/elife-87672-fig4-figsupp7-data6-v1.zip
-
Figure 4—figure supplement 7—source data 7
DIC and GFP fluorescence confocal microscopy for LGY0070 cells.
- https://cdn.elifesciences.org/articles/87672/elife-87672-fig4-figsupp7-data7-v1.zip
Figure 4—figure supplement 8

Verification of (H4, H4-GFP) strain.
(A) Map of the HHT1-HHF1 locus in the parent (wild-type) strain BY4741 and the H4-GFP strain LGY0071. Primers used for PCR verification are indicated with the half arrow symbols. (B) Agarose gel of PCR amplicons expected from LGY0071 genomic DNA, in which the HHF1 locus is tagged with GFP. (C) Immunoblot analysis of strain LGY0071. The α-GFP antibody correctly detected the large H4-GFP fusion protein in LGY0071 (lane 3), but not in BY4741 (lane 2, negative control). The α-H4 antibody detected H4-GFP in LGY0071 and H4 in both lanes. (D) DIC and GFP fluorescence confocal microscopy for LGY0071 cells. In the left panel, the GFP signals are overlaid in green. In the right panel, GFP signals are rendered with inverted contrast.
-
Figure 4—figure supplement 8—source data 1
Immunoblot analysis of strain LGY0071 with α-H4 antibody.
- https://cdn.elifesciences.org/articles/87672/elife-87672-fig4-figsupp8-data1-v1.zip
-
Figure 4—figure supplement 8—source data 2
Immunoblot analysis loading control of strain LGY0071 with α-H3 antibody.
The unlabeled bands on the left were from an unrelated experiment.
- https://cdn.elifesciences.org/articles/87672/elife-87672-fig4-figsupp8-data2-v1.zip
-
Figure 4—figure supplement 8—source data 3
DIC and GFP fluorescence confocal microscopy for LGY0071 cells.
- https://cdn.elifesciences.org/articles/87672/elife-87672-fig4-figsupp8-data3-v1.zip
Figure 4—figure supplement 9
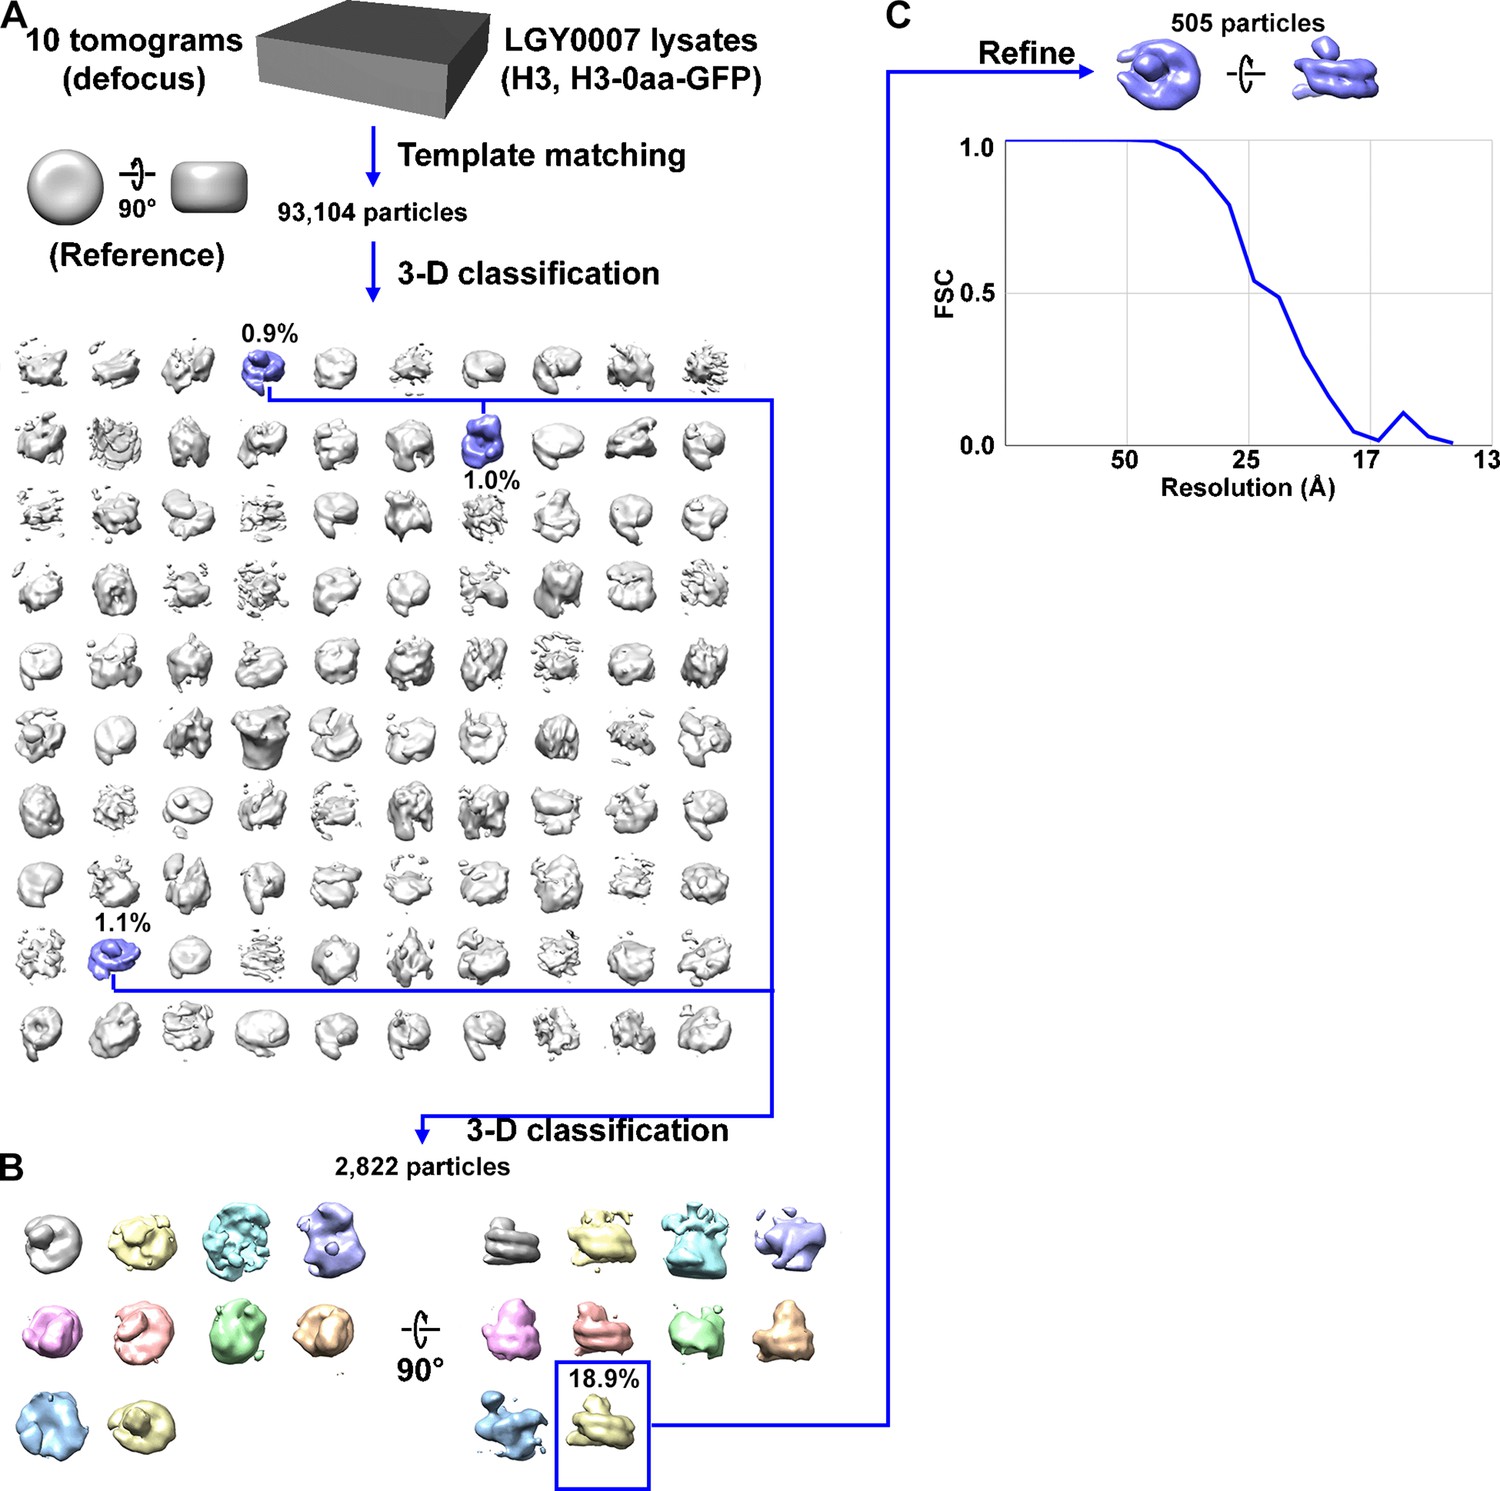
Direct 3D classification of LGY0007 (H3, H3-0aa-GFP) nuclear lysates.
(A) Class averages (3D) of nucleosome-like particles from nuclear lysates of LGY0007 cells, which express a wild-type copy of H3 and a H3-GFP that has no linker sequence. The canonical nucleosome-like class averages with an additional GFP density are shaded blue while the non-canonical nucleosome averages and canonical nucleosome-like class averages without any additional density are shaded gray. (B) The second round of 3D classification, using the canonical nucleosomes with an additional GFP density from panel A. The remove duplicates function of RELION was used to remove duplicate particles (defined as particles within a radius of 180 Å from another particle) from the indicated class average for the 3D refinement. Twenty-seven duplicate particles were removed before refining. (C) Refined density of LGY0007 nucleosomes isolated from nuclear lysates. The number of particles in the chosen class is labeled in black. The resolution is ~23 Å by the Fourier shell correlation (FSC) = 0.5 criterion.
Figure 4—figure supplement 10
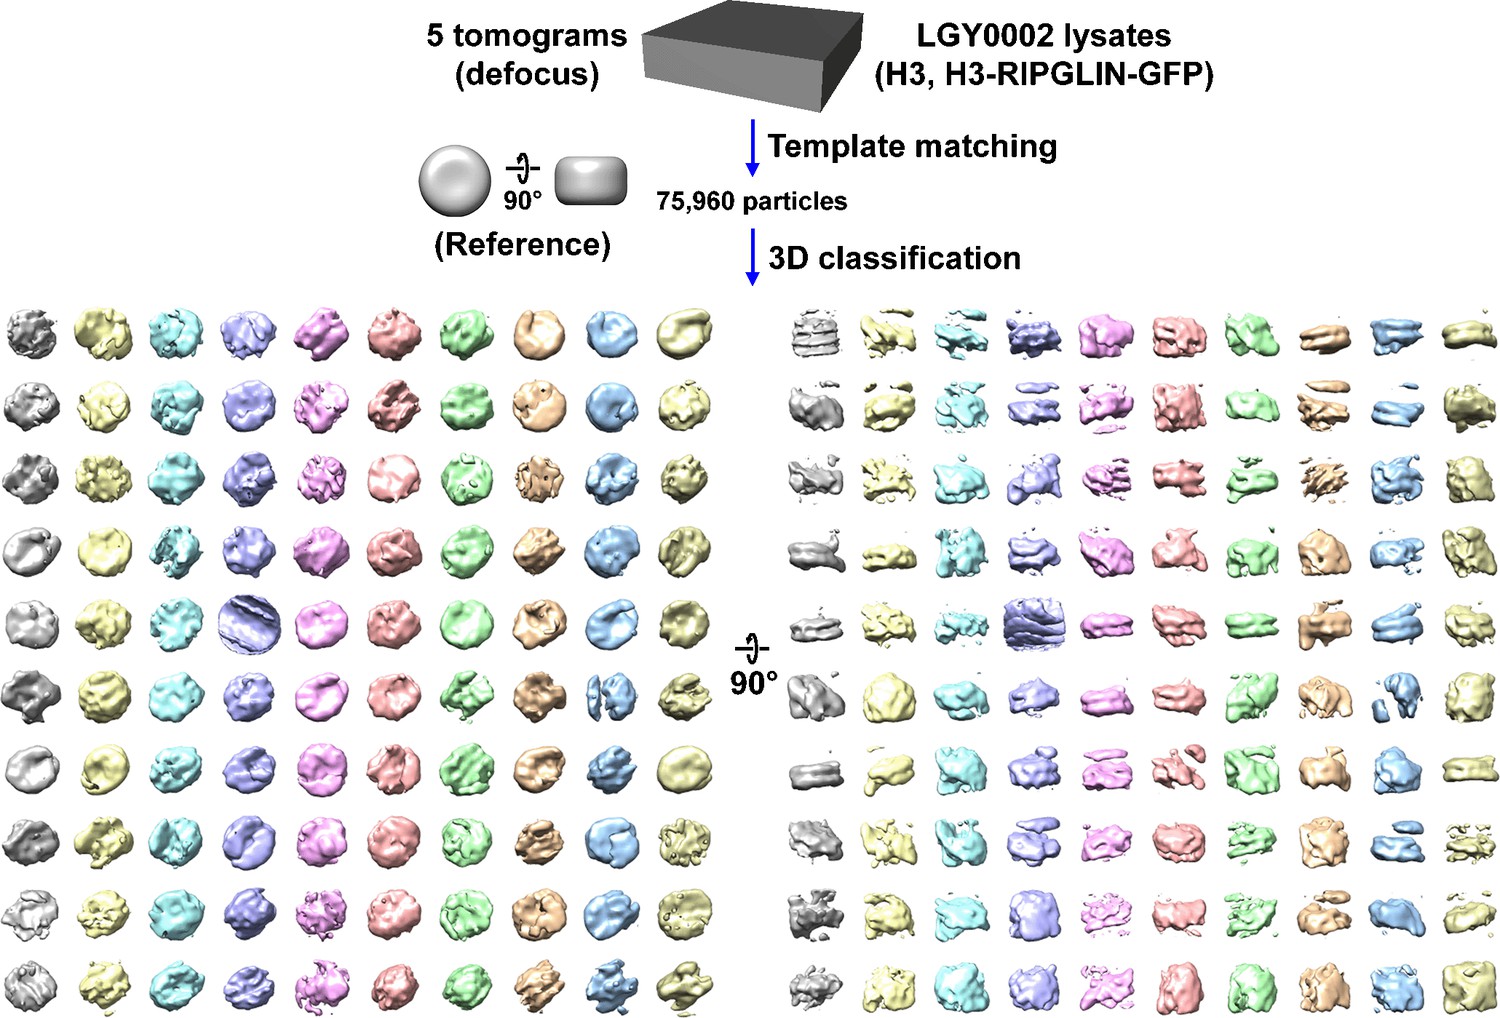
Direct 3D classification of LGY0002 (H3, H3-RIPGLIN-GFP) nuclear lysates.
Class averages (3D) of nucleosome-like particles from nuclear lysates of LGY0002 cells, which express a wild-type copy of H3 and a H3-GFP that has a RIPGLIN linker sequence. In this experiment, 2D classification was bypassed.
Figure 4—figure supplement 11
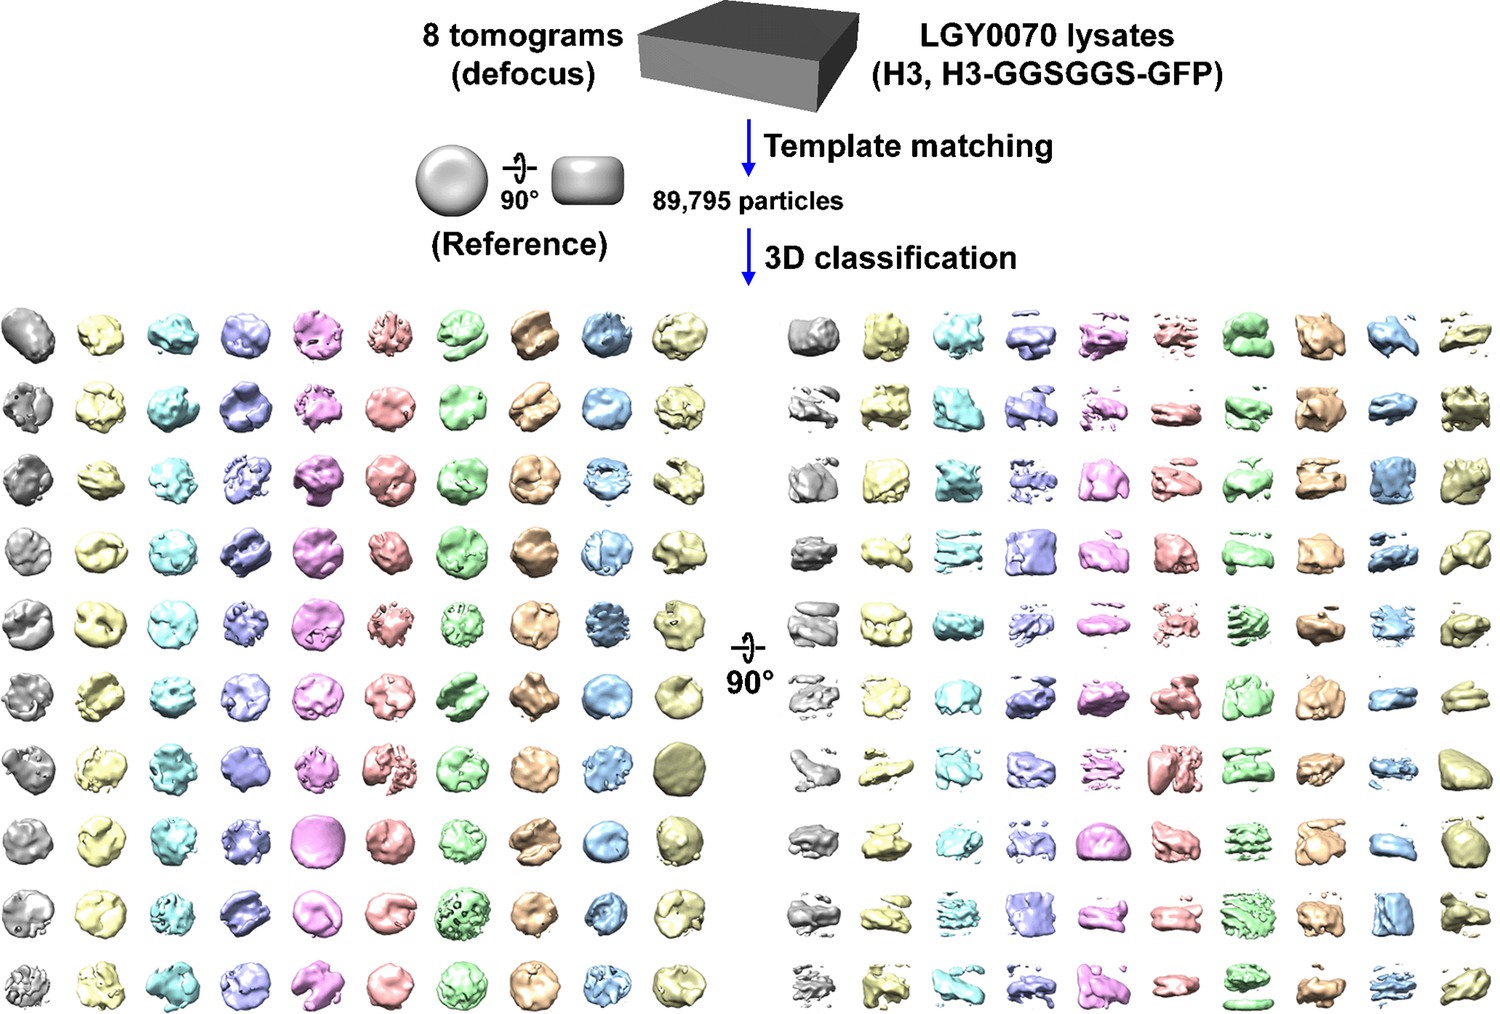
Direct 3D classification of LGY0070 (H3, H3-GGSGGS-GFP) nuclear lysates.
Class averages (3D) of nucleosome-like particles from nuclear lysates of LGY0070 cells, which express a wild-type copy of H3 and a H3-GFP that has a GGSGGS linker sequence. In this experiment, 2D classification was bypassed.
Figure 4—figure supplement 12
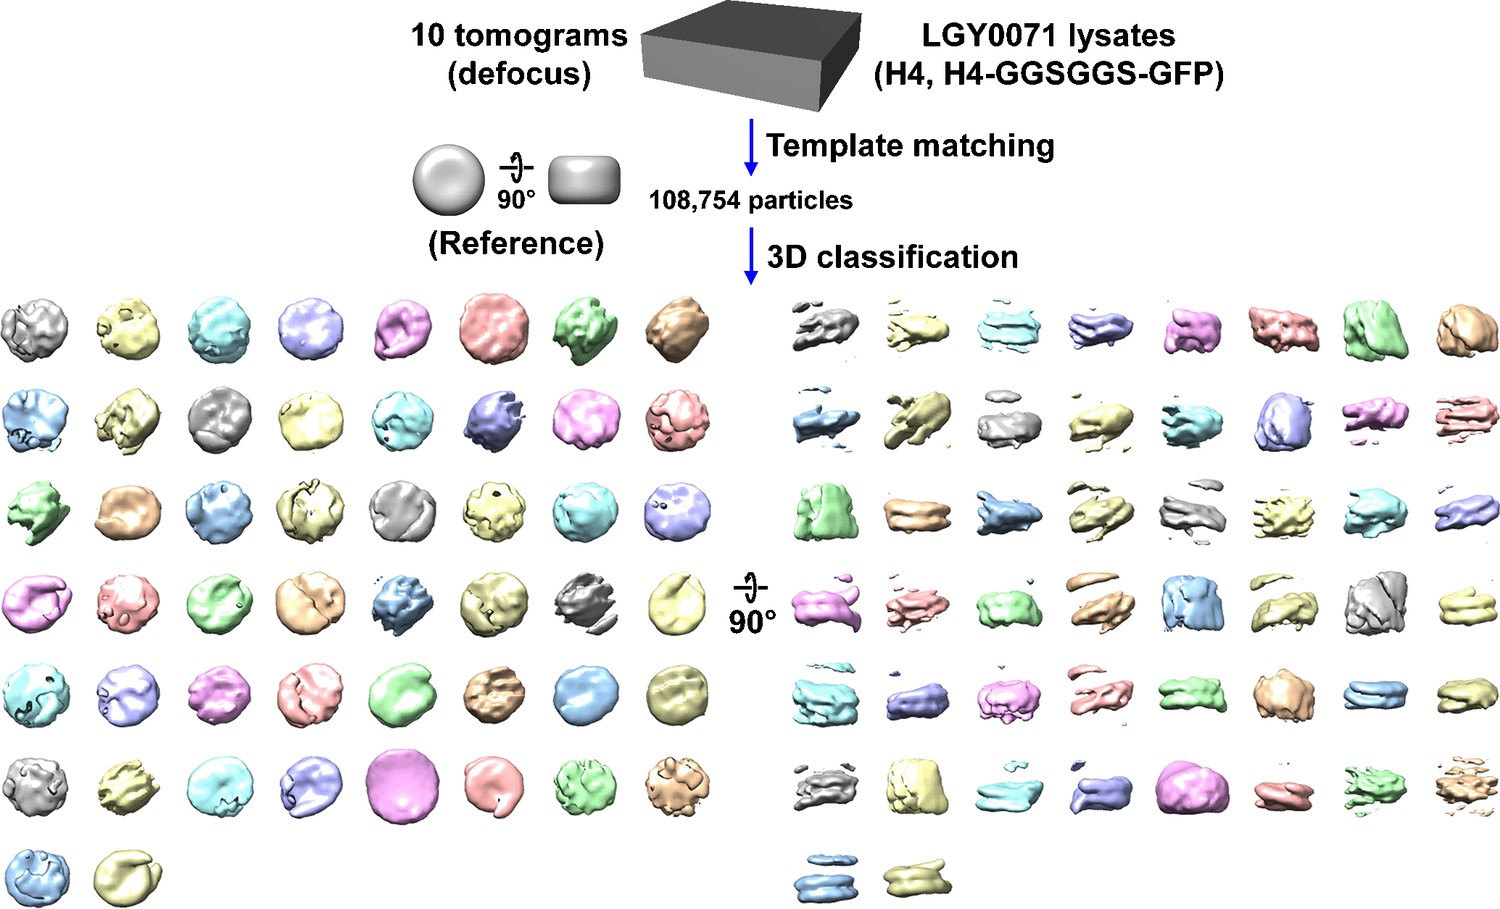
Direct 3D classification of LGY0071 (H4, H4-GGSGGS-GFP) nuclear lysates.
Class averages (3D) of nucleosome-like particles from nuclear lysates of LGY0071 cells, which express a wild-type copy of H4 and a H4-GFP that has a GGSGGS linker sequence. In this experiment, 2D classification was bypassed.
Figure 4—figure supplement 13

Overview of a LGY0007 (H3, H3-GFP) cell cryolamella, Volta phase plate (VPP) data.
Tomographic slice (12 nm) of a LGY0007 cell cryolamella imaged with a VPP. Some non-chromatin features are indicated: nuclear envelope (NE), megacomplex (M), and ribosome (R). The inset is a threefold enlargement of the boxed area. A nucleosome-like particle (n) is indicated.
Figure 4—figure supplement 14

Direct 3D classification of LGY0007 (H3, H3-GFP) cryolamellae densities.
Class averages (3D) of nucleosome-like particles in cryotomograms of LGY0007 cell cryolamellae. The cryolamellae were imaged with a Volta phase plate (VPP). In this experiment, 2D classification was bypassed.
Figure 4—video 1
Direct 3D classification of LGY0016 (H2A-GFP) nucleosome-like particles in Volta phase plate (VPP) tomograms of cell cryolamellae, round 1.
3D classification analysis of LGY0016 (H2A-GFP) nucleosome-like particles from cryolamellae imaged with a VPP. The initial reference is a featureless cylinder. There are 100 classes.
Figure 5 with 2 supplements
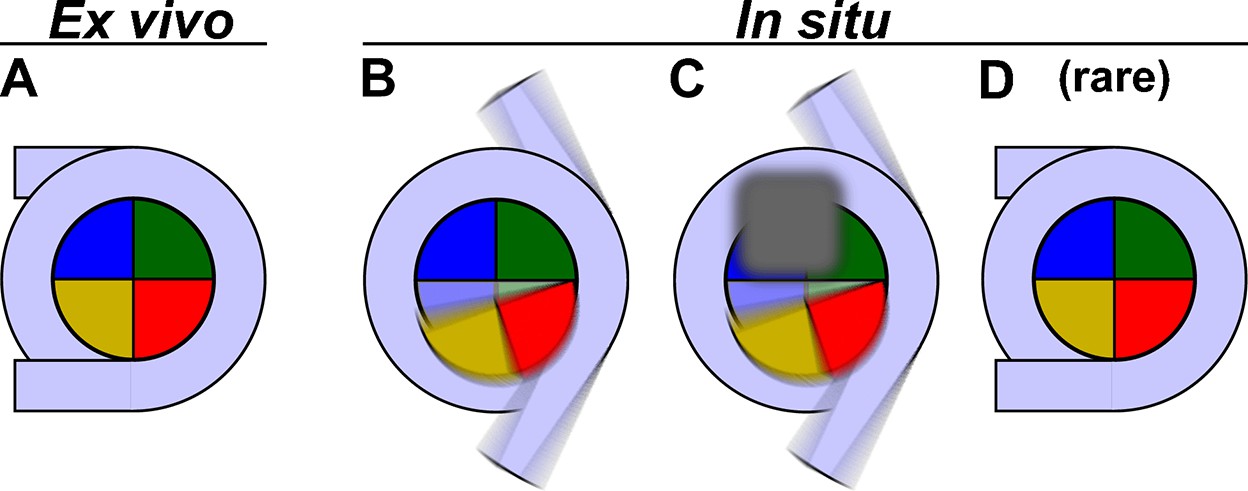
Models of yeast nucleosome heterogeneity.
Schematics of DNA (light blue) and histones (shaded pie slices) in the nucleosome disc view. The cartoons only illustrate the 147 bp of ‘core’ DNA. (A) Canonical nucleosome, in which all the histones and 147 bp of DNA are part of an ordered complex. (B) Nucleosome with alternative histone H2A-H2B (yellow, red) conformations and partially dissociated DNA. (C) Nucleosome bound to non-histone proteins (gray). The blurred gray box represents different proteins that can bind, thereby contributing to constitutional heterogeneity. The blurred appearance represents a large range of positions and orientations that protein and DNA components adopt inside cells, which would result in the absence of a class average resembling a canonical nucleosome. (D) Canonical nucleosomes are a minority conformation in situ.
Figure 5—figure supplement 1
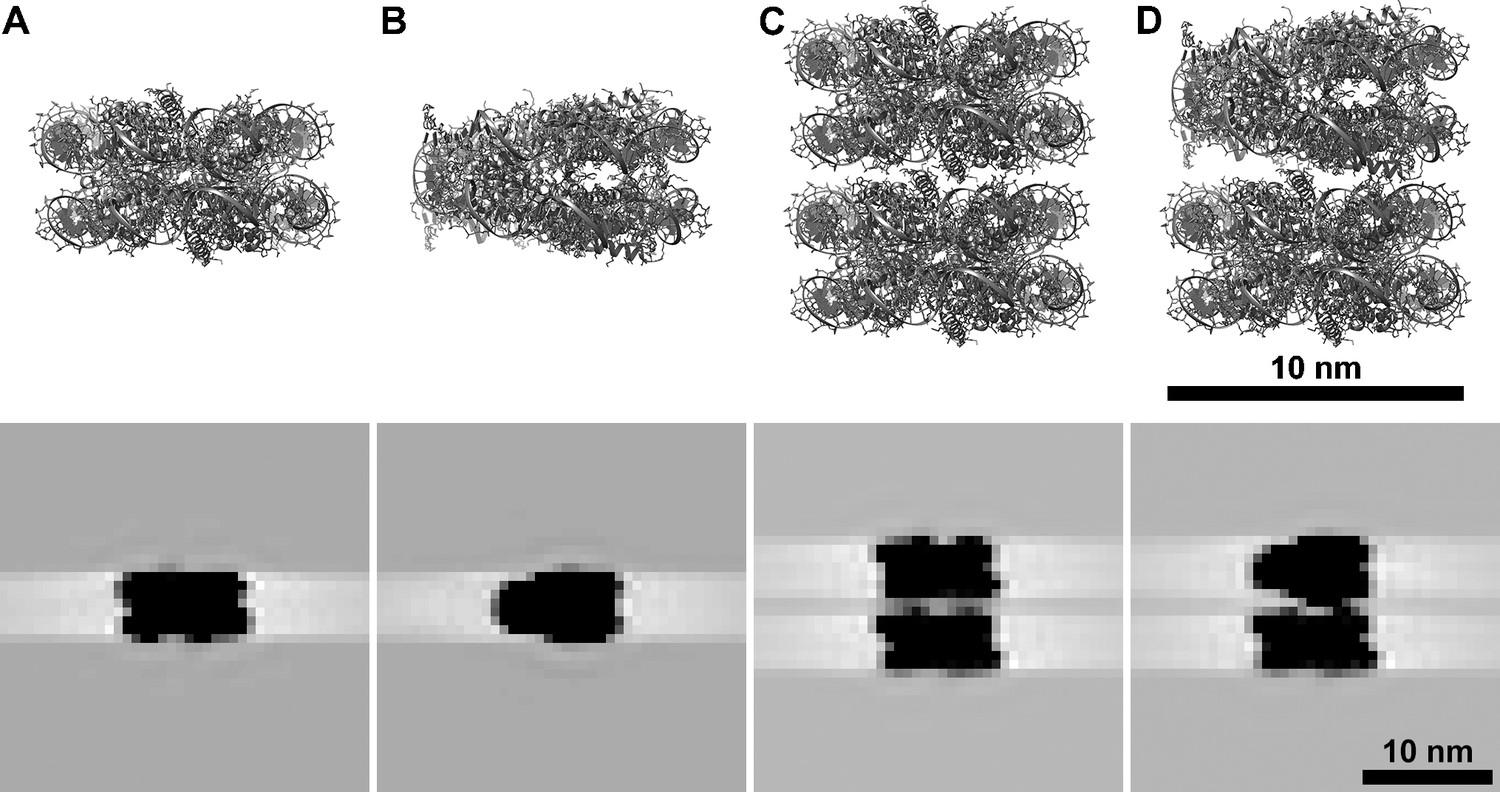
Simulated tomographic slices of single and stacked nucleosomes.
Atomic models (upper, from PDB 1KX5) were used to simulate tomographic slices (12 nm, lower). (A and B) Mononucleosomes in the gyre and side views, respectively. (C and D) Two examples of stacked nucleosomes. In panel C, both nucleosomes have the same orientation. In panel D, the upper nucleosome is rotated 90° along the Y axis relative to the lower nucleosome. The stacked nucleosomes were separated by 55 Å center-to-center along the Y axis to emulate a worst-case (for image processing) scenario. Note that these simulated tomographic slices are not intended to accurately model the image formation process. They serve to show how different side/gyre views of stacked nucleosomes appear.
Figure 5—figure supplement 2

Fourier power spectra analysis of tilt series images.
An image corresponding to an ~12° pre-tilt (to make the cryolamella perpendicular to the electron-optical axis to maximize the signal-to-noise ratio) was extracted from tilt series 20211117_004 and then Fourier transformed using (A) CTFFIND and (B) IMOD ctfplotter. Thon rings could not be detected in the CTFFIND 2D diagnostic image or the IMOD 1D radial average of the Fourier power spectrum.
Author response image 1
Tables
Appendix 1—key resources table
| Reagent type (species) or resource | Designation | Source or reference | Identifiers | Additional information |
|---|---|---|---|---|
| Gene (Saccharomyces cerevisiae) | HTA1 | Saccharomyces Genome Database | SGD:S000002633 | |
| Gene (S. cerevisiae) | HTB1 | Saccharomyces Genome Database | SGD:S000002632 | |
| Gene (S. cerevisiae) | HTA2 | Saccharomyces Genome Database | SGD:S000000099 | |
| Gene (S. cerevisiae) | HTB2 | Saccharomyces Genome Database | SGD:S000000098 | |
| Gene (S. cerevisiae) | HHT1 | Saccharomyces Genome Database | SGD:S000000214 | |
| Gene (S. cerevisiae) | HHF1 | Saccharomyces Genome Database | SGD:S000000213 | |
| Strain, strain base (S. cerevisiae) | BY4741 | EUROSCARF | Y00000 | MATa his3D1 leu2Δ0 met15Δ0 ura3Δ0, parent strain for transformation |
| Cell line (S. cerevisiae) | LGY0012 | This paper | (hta2-htb2)Δ0::KANMX, derived from BY4741 | |
| Cell line (S. cerevisiae) | LGY0015 | This paper | HTB1-GFP(S65T)(0aa linker)-HIS3MX, derived from BY4741 | |
| Cell line (S. cerevisiae) | LGY0016 | This paper | (hta2-htb2)Δ0::KANMX HTA1-GFP(S65T) (0aa linker)-HIS3MX, derived from LGY0012 | |
| Cell line (S. cerevisiae) | LGY0002 | This paper | HHT1-GFP(S65T)(RIPGLIN linker)- HIS3MX, derived from BY4741 | |
| Cell line (S. cerevisiae) | LGY0007 | This paper | HHT1-GFP(S65T)(0aa linker)-HIS3MX, derived from BY4741 | |
| Cell line (S. cerevisiae) | LGY0070 | This paper | HHT1-GFP(S65T)(GGSGGS linker)- HIS3MX, derived from BY4741 | |
| Cell line (S. cerevisiae) | LGY0071 | This paper | HHF1-GFP(S65T)(GGSGGS linker)- HIS3MX, derived from BY4741 | |
| Antibody | Anti-H2A (Rabbit polyclonal) | ActiveMotif | Cat# 39235, RRID:AB_2687477 | WB (1:1000) |
| Antibody | Anti-H2B (Rabbit polyclonal) | Abcam | Cat# ab1790, RRID:AB_302612 | WB (1:1000) |
| Antibody | Anti-H3 (Rabbit polyclonal) | Abcam | Cat# ab1791, RRID:AB_302613 | WB (1:1000) |
| Antibody | Anti-H4 (Rabbit polyclonal) | Abcam | Cat# ab10158, RRID:AB_296888 | WB (1:1000) |
| Antibody | Anti-GFP (Mouse monoclonal) | Santa Cruz Biotechnology | Cat# sc-9996, RRID:AB_627695 | WB (1:1000) |
| Antibody | Anti-rabbit IgG (Goat polyclonal) | Cell Signaling Technology | Cat# 7074, RRID:AB_2099233 | WB (1:5000) |
| Antibody | Anti-mouse IgG (Goat polyclonal) | Cell Signaling Technology | Cat# 7076, RRID:AB_330924 | WB (1:5000) |
| Recombinant DNA reagent | pFA6a-GFP(S65T)-His3MX6 (plasmid) | Addgene | RRID: Addgene_41598 | GFP tag with Histidine auxotrophy selection marker, contained in DH5-Alpha Escherichia coli |
| Recombinant DNA reagent | pFA6a-link-yoTagRFP-T-Kan (plasmid) | Addgene | RRID: Addgene_44906 | G418 resistance selection marker for gene deletion (RFP tag was not used), contained in DH5-Alpha E. coli |
| Sequence-based reagent | HTA1-GFP Tag F | This paper | PCR primers for fragment synthesis | AAAGAAGTCTGCCAAGGCT ACCAAGGCTTCTCAAGAATT AAGTAAAGGAGAAGAACTTTT |
| Sequence-based reagent | HTA1-GFP Tag R | This paper | PCR primers for fragment synthesis | TTTAGTTCCTTCCGCCTTCTTTAAAATACCAGAACCGATCGAATTCGAGCTCGTTTAAAC |
| Sequence-based reagent | HTB1-GFP Tag F | This paper | PCR primers for fragment synthesis | TACTAGAGCTGTTACCAAGTACTCTTCCTCTACTCAAGCAAGTAAAGGAGAAGAACTTTT |
| Sequence-based reagent | HTB1-GFP Tag R | This paper | PCR primers for fragment synthesis | TAAATAATAATATTAATTATAACCAAAGGAAGTGATTTCAGAATTCGAGCTCGTTTAAAC |
| Sequence-based reagent | HAB2 Del F | This paper | PCR primers for fragment synthesis | AAGAATGTTTGATTTGCTTTGTTTCTTTTCAACTCAGTTCCAGATCCGCTAGGGATAACA |
| Sequence-based reagent | HAB2 Del R | This paper | PCR primers for fragment synthesis | AAAAGAAAACATGACTAAATCACAATACCTAGTGAGTGACTCGATGAATTCGAGCTCG |
| Sequence-based reagent | HHT1-RIPGLIN-GFP Tag F | This paper | PCR primers for fragment synthesis | GGATATCAAGTTGGCTAGAAGATTAAGAGGTGAAAGATCACGGATCCCCGGGTTAATTAA |
| Sequence-based reagent | HHT1-GFP Tag F | This paper | PCR primers for fragment synthesis | GGATATCAAGTTGGCTAGAAGATTAAGAGGTGAAAGATCAAGTAAAGGAGAAGAACTTTT |
| Sequence-based reagent | HHT1-GFP Tag R | This paper | PCR primers for fragment synthesis | TTTTGTTCGTTTTTTACTAAAACTGATGAC AATCAACAAAGAATTCGAGCTCGTTTAAAC |
| Sequence-based reagent | HHT1-GGSGGS-GFP Tag F | This paper | PCR primers for fragment synthesis | TCCAAAAGAAGGATATCAAGTTGGCTAGAAGATTAAGAGGTGAAAGATCAGGTGGATCTGGTGGATCTAGTAAAGGAGAAGAACTTTT |
| Sequence-based reagent | HHT1-GFP Tag R (Long) | This paper | PCR primers for fragment synthesis | TTTATTGTGTTTTTGTTCGTTTTTTACTAAAACTGATGACAATCAACAAAGAATTCGAGCTCGTTTAAAC |
| Sequence-based reagent | HHF1-GGSGGS-GFP Tag F | This paper | PCR primers for fragment synthesis | TTGTTTATGCTTTGAAGAGACAAGGTAGAACCTTATACGGTTTCGGTGGTGGTGGATCTGGTGGATCTAGTAAAGGAGAAGAACTTTT |
| Sequence-based reagent | HHF1-GFP Tag R | This paper | PCR primers for fragment synthesis | CGAATCCCAAATATTTGCTTGTTGTTACCGTTTTCTTAGAATTAGCTAAAGAATTCGAGCTCGTTTAAAC |
| Sequence-based reagent | FA1 | This paper | PCR primers for confirmation | CGGTGGTAAAGGTGGTAAAG |
| Sequence-based reagent | RA1 | This paper | PCR primers for confirmation | TCGTTTCTGATAAACCAGGT |
| Sequence-based reagent | RG | This paper | PCR primers for confirmation | CCGTTTCATATGATCTGGGT |
| Sequence-based reagent | FH | This paper | PCR primers for confirmation | GACCATTTGCTGTAATCGAC |
| Sequence-based reagent | RK | This paper | PCR primers for confirmation | CCTTATTTTTGACGAGGGGA |
| Sequence-based reagent | RB2 | This paper | PCR primers for confirmation | ATTAACCGGGATTCACTGAC |
| Sequence-based reagent | RA2 | This paper | PCR primers for confirmation | CAGTTCTTGAGAAGCTTTGG |
| Sequence-based reagent | RA2.2 | This paper | PCR primers for confirmation | CTGGACGAAGACGAAGTAAT |
| Sequence-based reagent | FB1 | This paper | PCR primers for confirmation | ATGTCTGCTAAAGCCGAAAA |
| Sequence-based reagent | RB1 | This paper | PCR primers for confirmation | AGTCAGCGACATCTGTCTTT |
| Sequence-based reagent | FT1 | This paper | PCR primers for confirmation | AAGCAAACAGCAAGAAAGTC |
| Sequence-based reagent | RT1 | This paper | PCR primers for confirmation | CTTCTGACAGCAAGGGTATT |
| Sequence-based reagent | FF1 | This paper | PCR primers for confirmation | ATGTCCGGTAGAGGTAAAGG |
| Sequence-based reagent | RF1 | This paper | PCR primers for confirmation | ACACACGAAAATCCTGTGAT |
| Commercial assay, kit | QIAprep Spin Miniprep Kit (250) | QIAGEN | Cat# 27106 | |
| Commercial assay, kit | QIAquick PCR Purification Kit (50) | QIAGEN | Cat# 28104 | |
| Commercial assay, kit | DNeasy Blood & Tissue Kit (50) | QIAGEN | Cat# 69504 | |
| Commercial assay, kit | Yeast Nuclei Isolation Kit | Abcam | ab206997 | |
| Chemical compound, drug | G418 | Thermo Fisher | 10131035 | (50 mg/mL) |
| Software, algorithm | TFS Tomo4 | Thermo Fisher | ||
| Software, algorithm | Leginon | Suloway et al., 2009 | RRID:SCR_016731 | |
| Software, algorithm | SerialEM 3.8.6 | Mastronarde, 2003 | RRID:SCR_017293 | |
| Software, algorithm | PACE-tomo | Eisenstein et al., 2023 | ||
| Software, algorithm | MotionCor2 | Zheng et al., 2017 | RRID:SCR_016499 | |
| Software, algorithm | IMOD 4.11 | Mastronarde, 1997 | RRID:SCR_003297 | |
| Software, algorithm | PEET 1.15 | Heumann, 2016 | ||
| Software, algorithm | Bsoft 1.8.8 | Heymann and Belnap, 2007 | RRID:SCR_016503 | |
| Software, algorithm | RELION 3.0.8 | Kimanius et al., 2016; Scheres, 2012 | RRID:SCR_016274 | |
| Software, algorithm | UCSF Chimera 1.13.1 | Pettersen et al., 2004 | RRID:SCR_002959 | |
| Software, algorithm | Auxilliary cryoEM scripts | Gan, 2019 | https://github.com/anaphaze/ot-tools | |
| Software, algorithm | Auxilliary cryoEM scripts | Gaullier, 2021 | https://github.com/Guillawme/cryoEM-scripts | |
| Other | rCutSmart Buffer | New England BioLabs | Cat# B6004 | Buffer for restriction digestion using NEB restriction enzymes |
| Other | SalI Restriction Enzyme | New England BioLabs | Cat# R0138 | Cut plasmids at the restriction site 5’-GTCGAC-3’ |
| Other | EcoRV Restriction Enzyme | New England BioLabs | Cat# R0195 | Cut plasmids at the restriction site 5’-GATATC-3’ |
| Other | Q5 High-Fidelity 2× Master Mix | New England BioLabs | Cat# M0492 | Contains Q5 DNA Polymerase, deoxynucleotides and Mg2+ in buffer, for PCR amplification |
| Other | Salmon sperm DNA | Sigma-Aldrich | D9156 | 10 mg/mL, used for lithium acetate transformation of yeast cells. |
| Other | FloroSafe DNA Stain | Axil Scientific | BIO-5170-1ml | Staining of PCR products in agarose gel after gel electrophoresis |
| Other | 4× Laemmli Sample Buffer | Bio-Rad | #1610747 | Preparation of TCA-precipitated proteins for SDS-PAGE |
| Other | Clarity Western ECL Substrate | Bio-Rad | #1705061 | Visualization of protein bands bound by HRP-conjugated antibodies in immunoblots |
Additional files
-
Supplementary file 1
Table of genotypes of strains used in this paper.
- https://cdn.elifesciences.org/articles/87672/elife-87672-supp1-v1.xlsx
-
Supplementary file 2
Table of PCR primers.
All primers are listed in the direction 5’ → 3’.
- https://cdn.elifesciences.org/articles/87672/elife-87672-supp2-v1.xlsx
-
Supplementary file 3
Table of antibodies for immunoblots.
CST = Cell Signaling Technology.
- https://cdn.elifesciences.org/articles/87672/elife-87672-supp3-v1.xlsx
-
Supplementary file 4
Table of confocal microscopy details.
- https://cdn.elifesciences.org/articles/87672/elife-87672-supp4-v1.xlsx
-
Supplementary file 5
Table of cryo-electron tomography (cryo-ET) details.
- https://cdn.elifesciences.org/articles/87672/elife-87672-supp5-v1.xlsx
-
Supplementary file 6
Table of cryotomogram details.
All data reported in this table were used for subtomogram analysis and were deposited as EMPIAR-10678. The K2 and K3 raw data were collected in super-resolution mode, with ½ the pixel size reported in the table. Pixel size therefore refers to the camera’s ‘bin ×1’ pixel. * Refined defocus (∆f) values are reported for defocus phase-contrast data while nominal defoci are reported for Volta phase-contrast (VPP) data. ∆tilt = tilt increment. Figure = figures that show this dataset; those without a figure number were used for subtomogram averaging. ∆tilt = tilt increment. Camera: FII = Falcon II, K2 = K2 GIF, K3 = K3 GIF. Thickness is measured from the reconstructed tomogram. For cryosections, the thickness is variable due to the presence of crevasses. Residual = alignment residual, in nanometers.
- https://cdn.elifesciences.org/articles/87672/elife-87672-supp6-v1.xlsx
-
Supplementary file 7
Table of total nucleosome-like particles analyzed.
- https://cdn.elifesciences.org/articles/87672/elife-87672-supp7-v1.xlsx
-
Supplementary file 8
Table of nucleus volume sampled for subtomogram analysis.
- https://cdn.elifesciences.org/articles/87672/elife-87672-supp8-v1.xlsx
-
MDAR checklist
- https://cdn.elifesciences.org/articles/87672/elife-87672-mdarchecklist1-v1.pdf
Download links
A two-part list of links to download the article, or parts of the article, in various formats.
Downloads (link to download the article as PDF)
Open citations (links to open the citations from this article in various online reference manager services)
Cite this article (links to download the citations from this article in formats compatible with various reference manager tools)
Heterogeneous non-canonical nucleosomes predominate in yeast cells in situ
eLife 12:RP87672.
https://doi.org/10.7554/eLife.87672.3


