Mesotrode allows chronic simultaneous mesoscale cortical imaging and subcortical or peripheral nerve spiking activity recording in mice
- University of British Columbia, Department of Psychiatry, Kinsmen Laboratory of Neurological Research, Canada
- Djavad Mowafaghian Centre for Brain Health, University of British Columbia, Canada
Figures
Figure 1
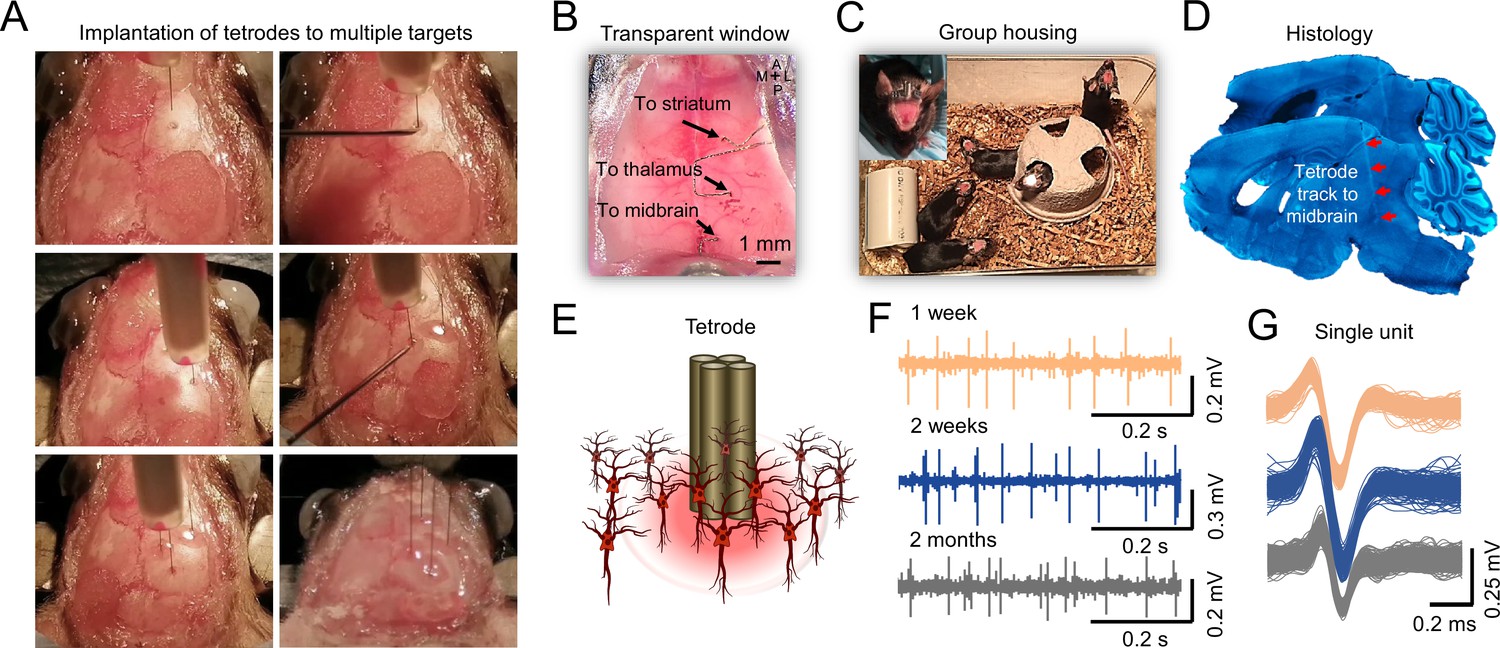
Chronic tetrodes recording compatible with mesoscale transcranial Imaging.
(A) Images of skull surface during tetrode implantation. Panels depict the location of 4 tetrodes placed in skull burr holes using a micromanipulator. (B) Image showing transcranial window with tetrodes placed in the striatum, thalamus, and midbrain. (C) Chronic tetrode recording is compatible with group-housed mice. (D) Post-mortem histology is performed to confirm the tetrode location. (E) Cartoon of tetrode and local neurons. (F) Example of long-term recording using transcranial imaging window plus tetrodes. (G) Sorted spikes from (F) (brown, blue, and gray indicate 1 week, 2 weeks, and 2 months after tetrode implantation).
Figure 2
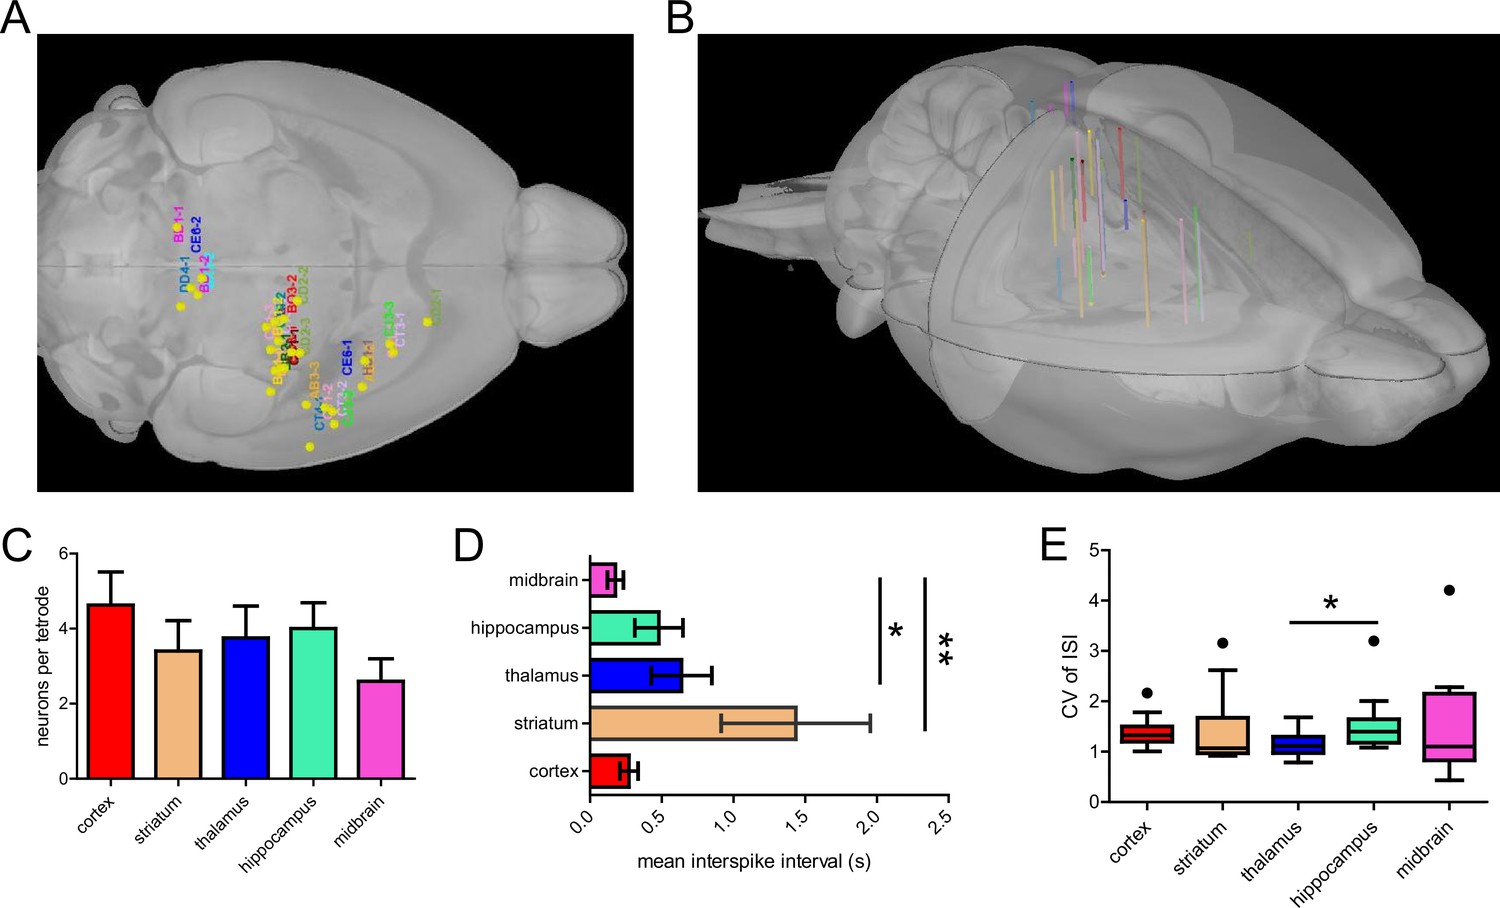
Group statistics on tetrode implantation across mice.
(A) Labels corresponding to mouse IDs (n=14 mice) were registered to a 3D mouse brain model based on tetrode locations. (B) Side view of the 3D reconstruction of 29 tetrode tracks implanted in 14 mice registered to the 3D mouse brain model. (C) The mean number of well-isolated neurons recorded per tetrode implanted in different brain regions. (D) Mean inter-spike interval (ISI) of neurons recorded in different brain regions (Dunn’s Multiple Comparison Test, striatum vs midbrain, p<0.01, thalamus vs midbrain, p<0.05, n=14 mice). (E) Mean coefficient of variation of ISIs of neurons across brain regions (Dunn’s Multiple Comparison Test, thalamus vs hippocampus, p<0.05, n=14 mice).
Figure 3
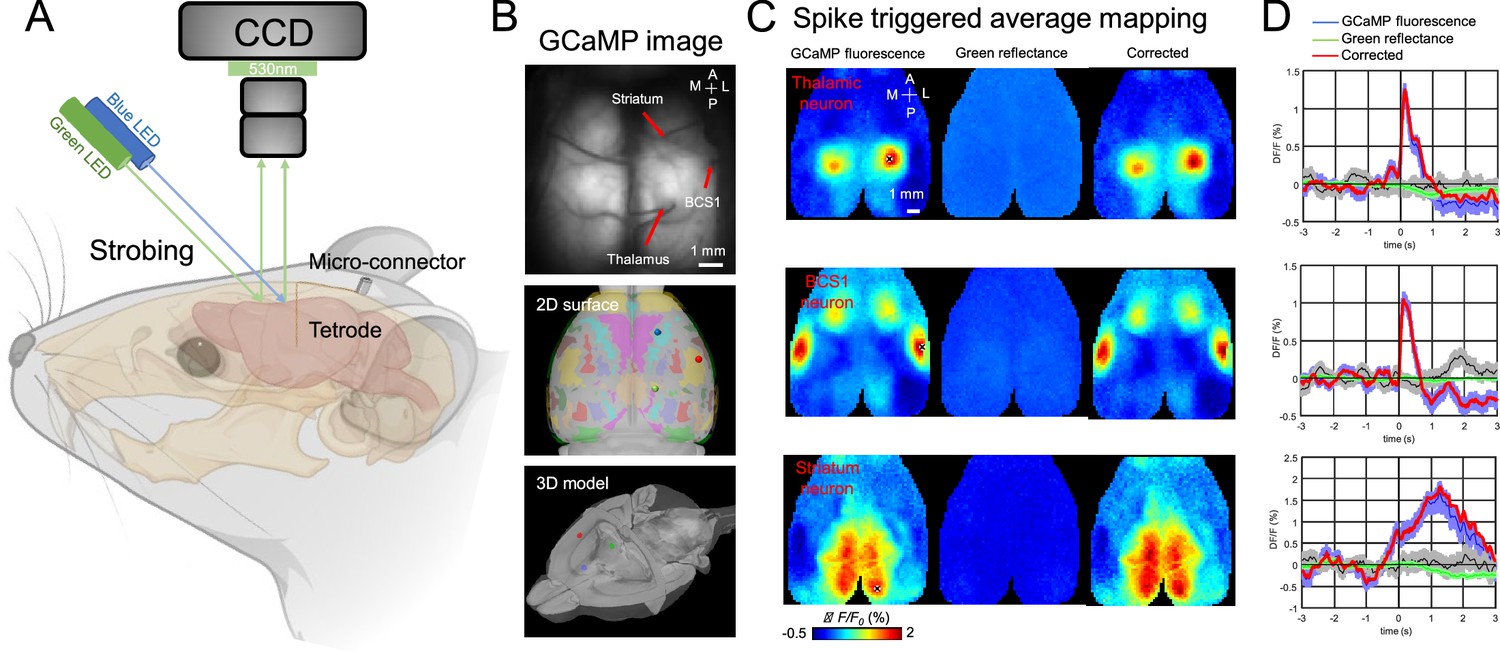
Recording setup and example spike-triggered average maps.
(A) Illustration of experiment setup incorporating wide-field imaging, and tetrode recording with simultaneous behavioral monitoring. (B) Example tetrodes implantation in the thalamus, BCS1, and striatum. The middle and bottom panel shows the tetrode location registered in a 3D model of the mouse brain. (C) Spike-triggered average of GCaMP6s fluorescence (left), hemodynamic signal (middle, green reflectance), and hemodynamic-subtracted cortical maps (right) of thalamic, BCS1, and striatal neurons. (D) Average traces of GCaMP6s epi-fluorescence (blue), hemodynamic signal (green reflectance), and hemodynamic-subtracted signal (red) surrounding spikes of single neurons, and random trigger average traces (black). The gray bands correspond to the standard deviation of random trigger average traces.
Figure 4
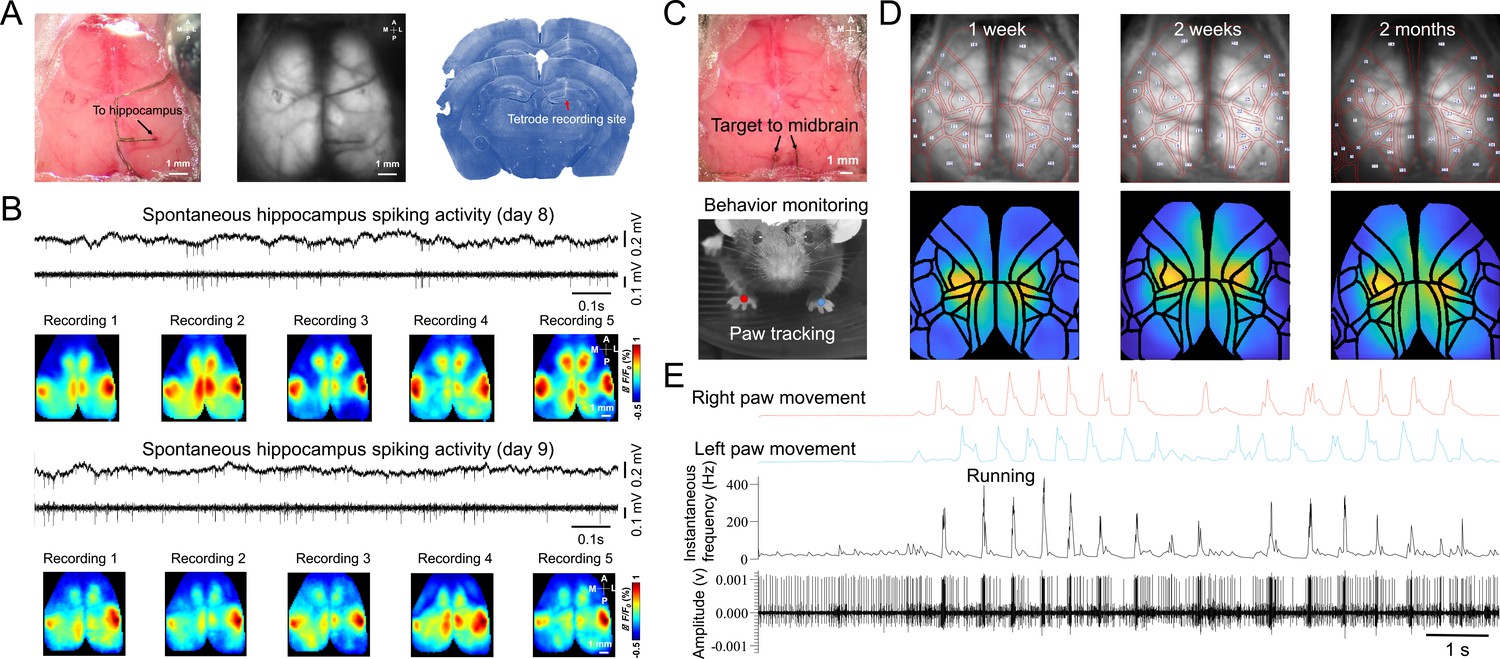
Chronic spike-triggered average maps of hippocampus and midbrain neurons.
(A) Unfiltered brain RGB image showing the position of the tetrode (left), GCaMP6 fluorescence image (middle), and histology showing the recording site of the tetrode (right). (B) Example raw and high-pass filtered (>300 Hz) electrophysiological traces of hippocampal recording 7 days after tetrode implantation and STMs of the hippocampal neuron across recording sessions(top). Another day of hippocampal recording and STMs of the hippocampal neuron across recording sessions(bottom). (C) Unfiltered brain RGB image showing the position of the tetrode (top) and behavior video recording (bottom). (D) Top: Ca2+ images recorded 1 week (left), 2 weeks (middle), and 2 months (right) after tetrode implanted in the midbrain overlaid with automatically registered brain atlas using Mesonet. Bottom: STMs of the midbrain neuron recorded at the same time points as Top. (E) Synchronized traces of paw movements, instantaneous firing rate, and electrophysiological signals of the midbrain neuron are shown in (C).
Figure 5
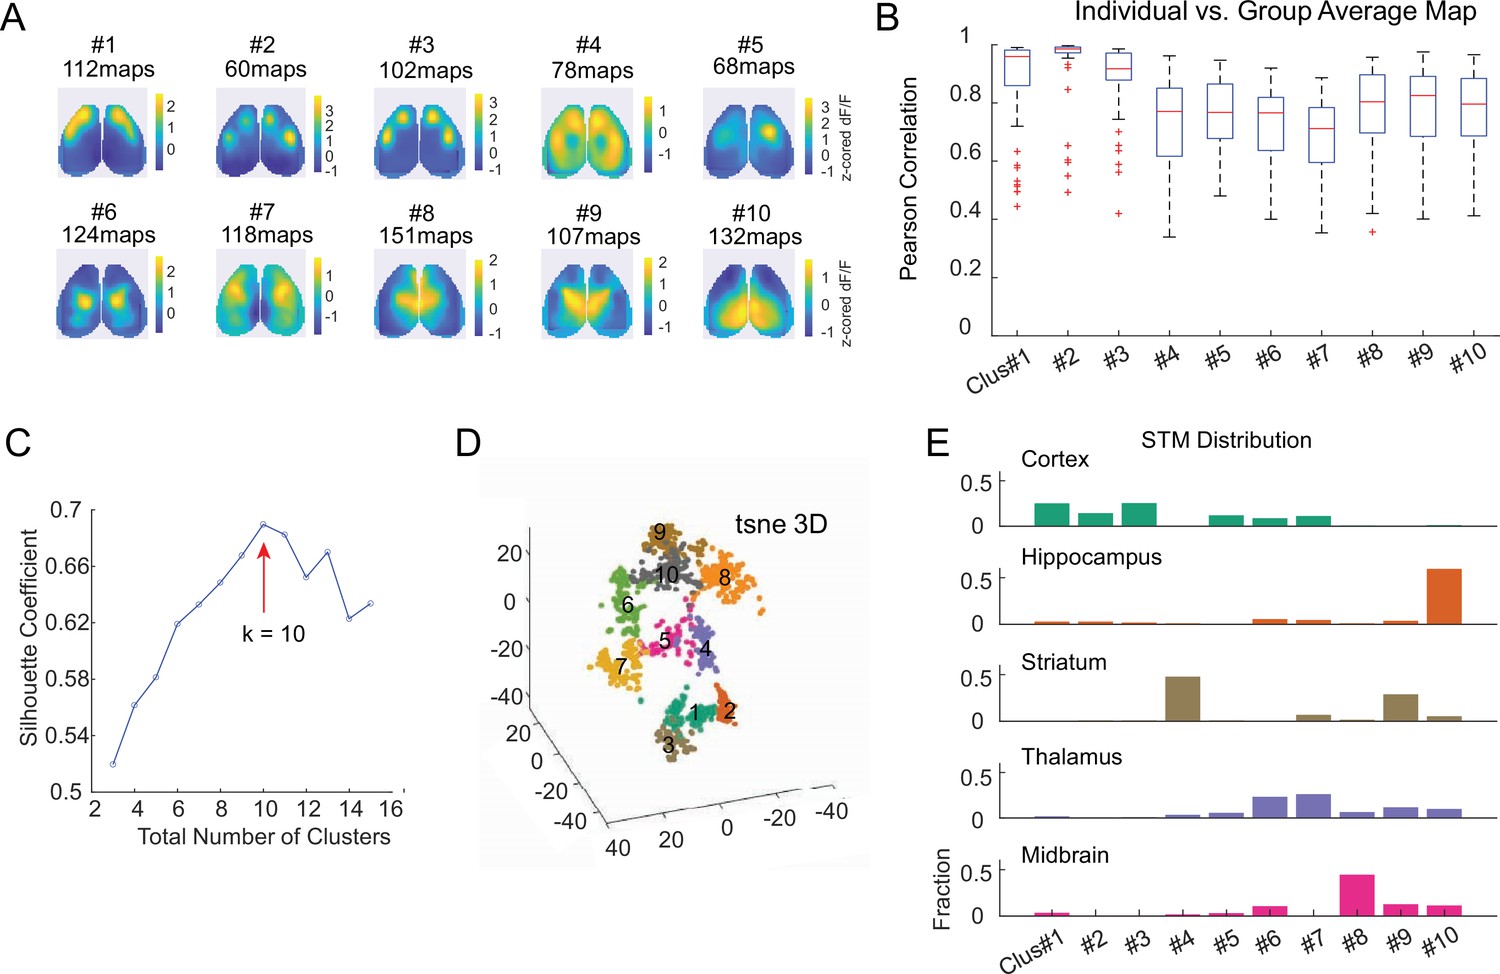
Clustering STMs of cortical/subcortical neurons.
(A) Average z-scored STM of each cluster. Each cluster represents a unique cortical functional network that individual neurons were associated with. STMs of the same neurons recorded during different sessions were included (1146 total STMs from 110 neurons of 14 mice). (B) Box plot showing the correlation between individual STM and average STM of its assigned cluster. (C) Silhouette coefficient of varying numbers of clusters to validate the optimal number of clusters. (D) 3D-t-SNE plot showing dimensionality reduced representation of clustered individual STMs. (E) The proportion of neurons in each cortical and subcortical region assigned to each STM cluster.
Figure 6 with 7 supplements
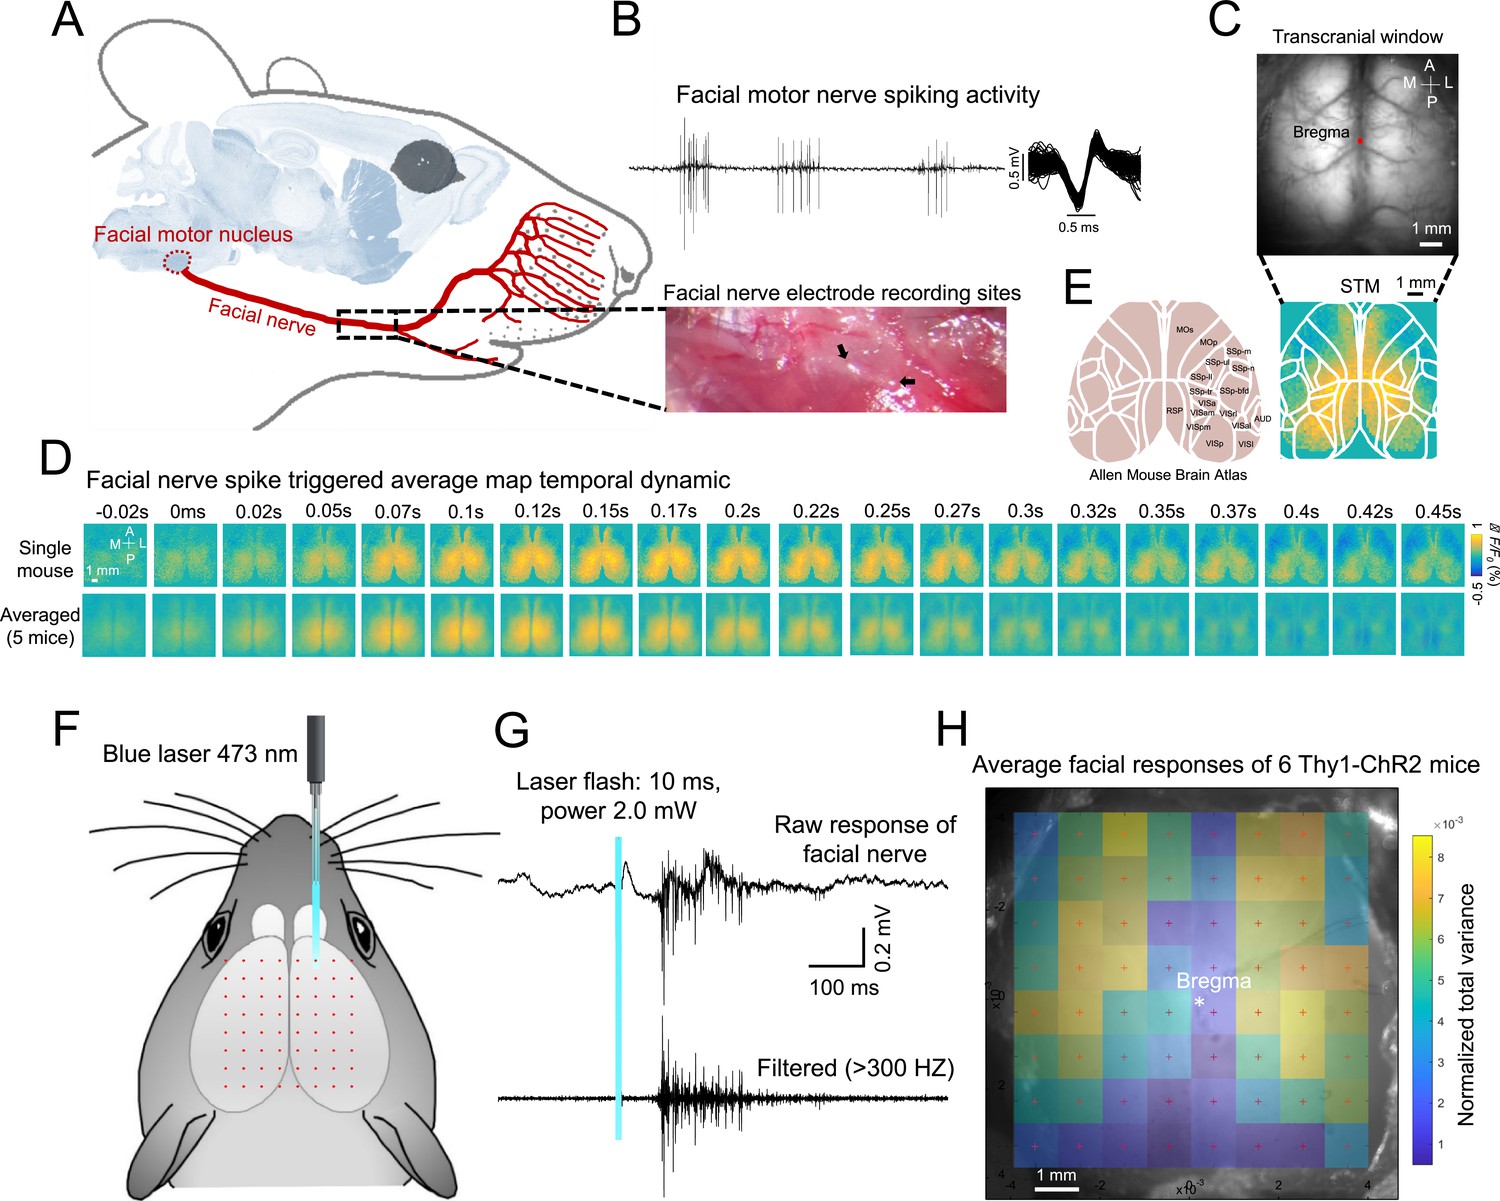
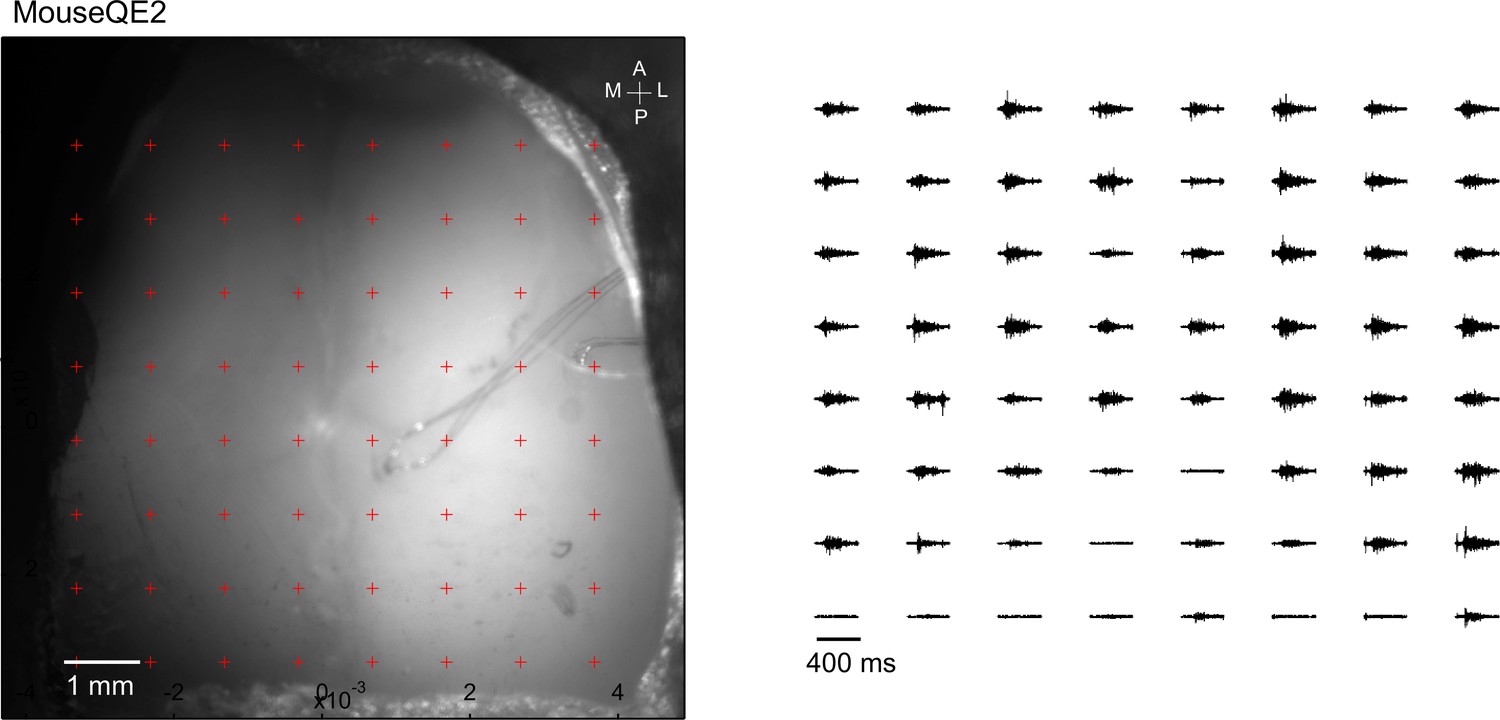
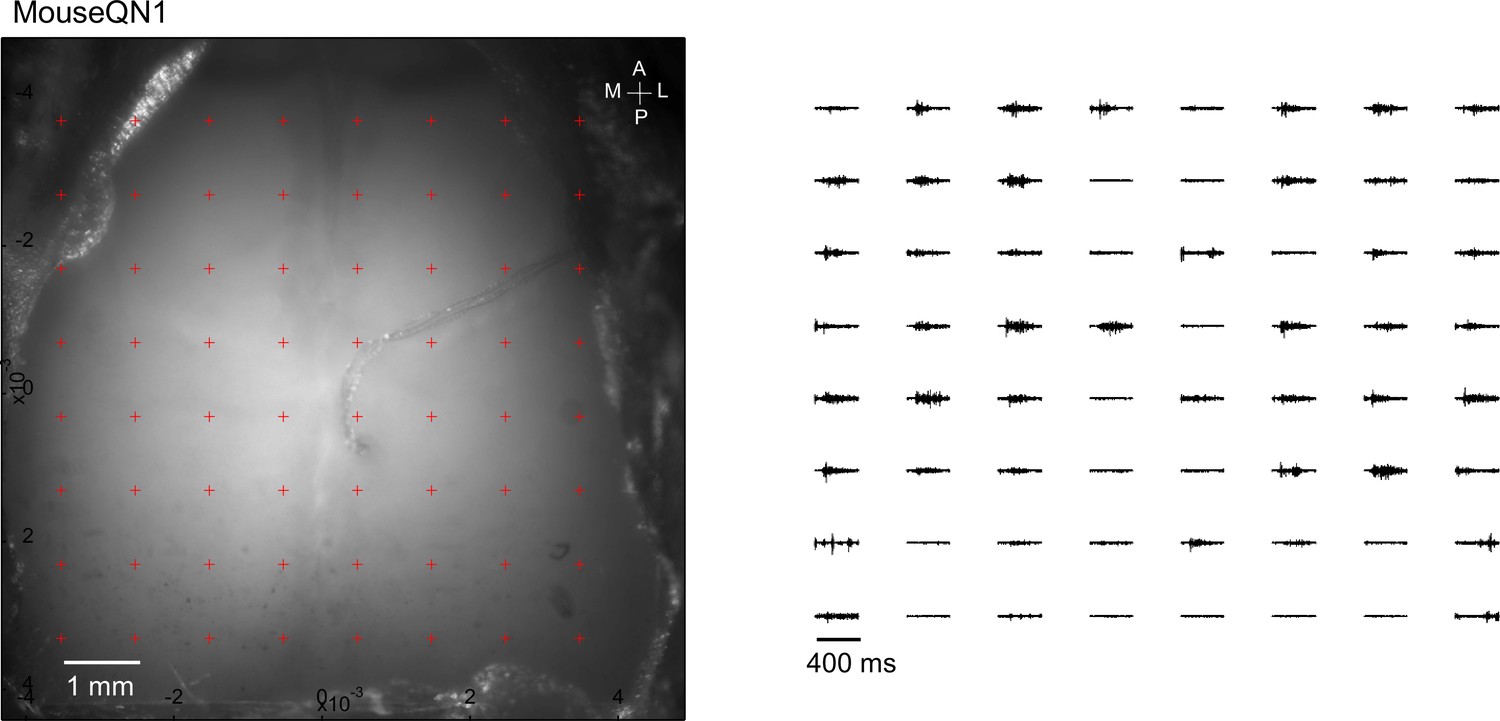
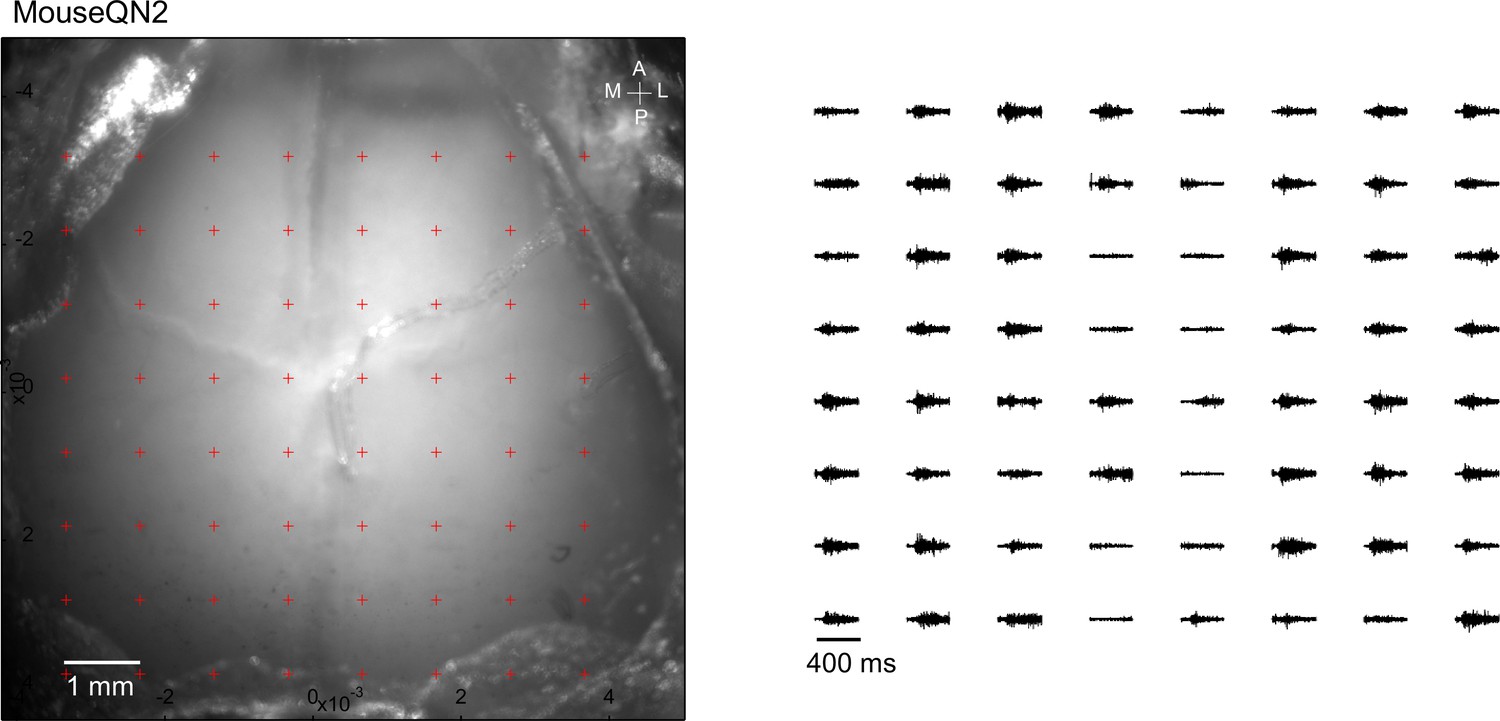
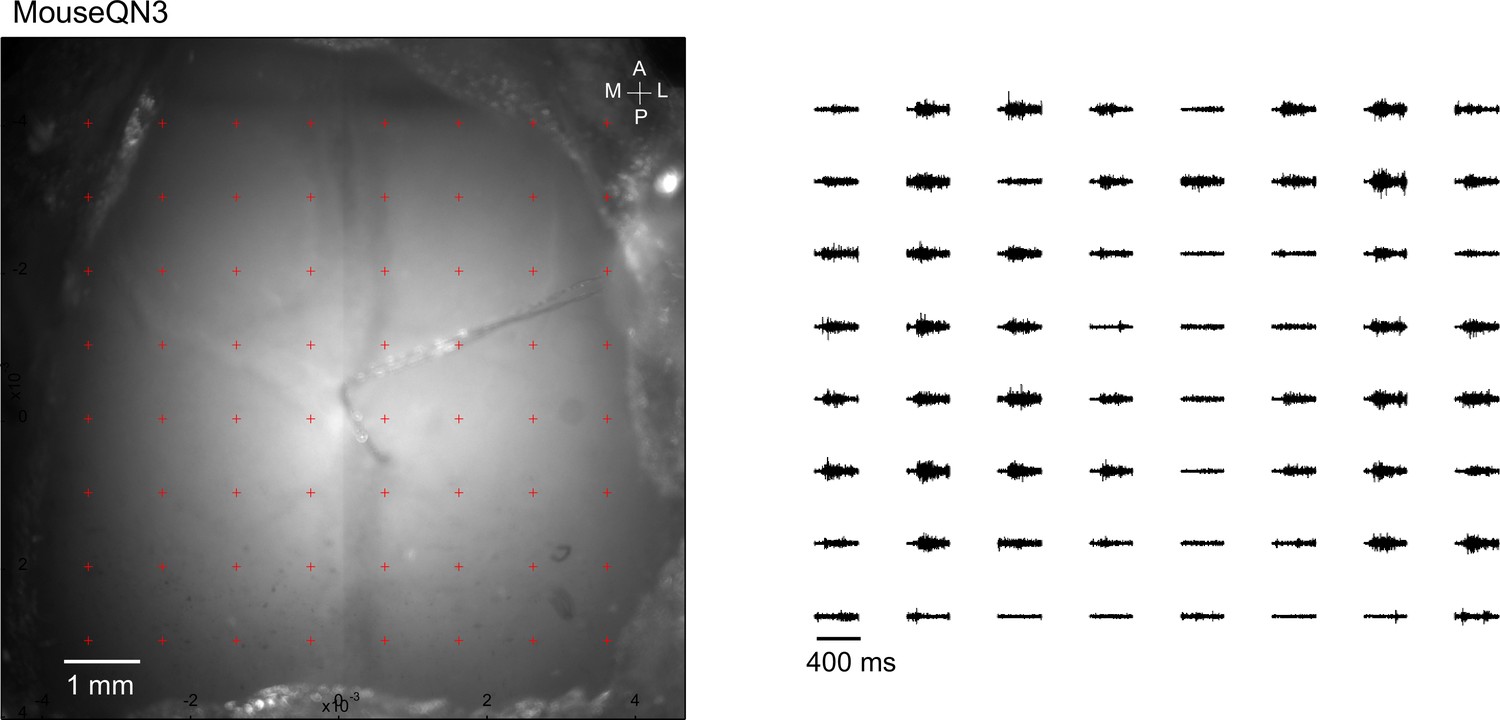
Spike-triggered and optogenetics mapping facial nerve spiking associated cortical maps.
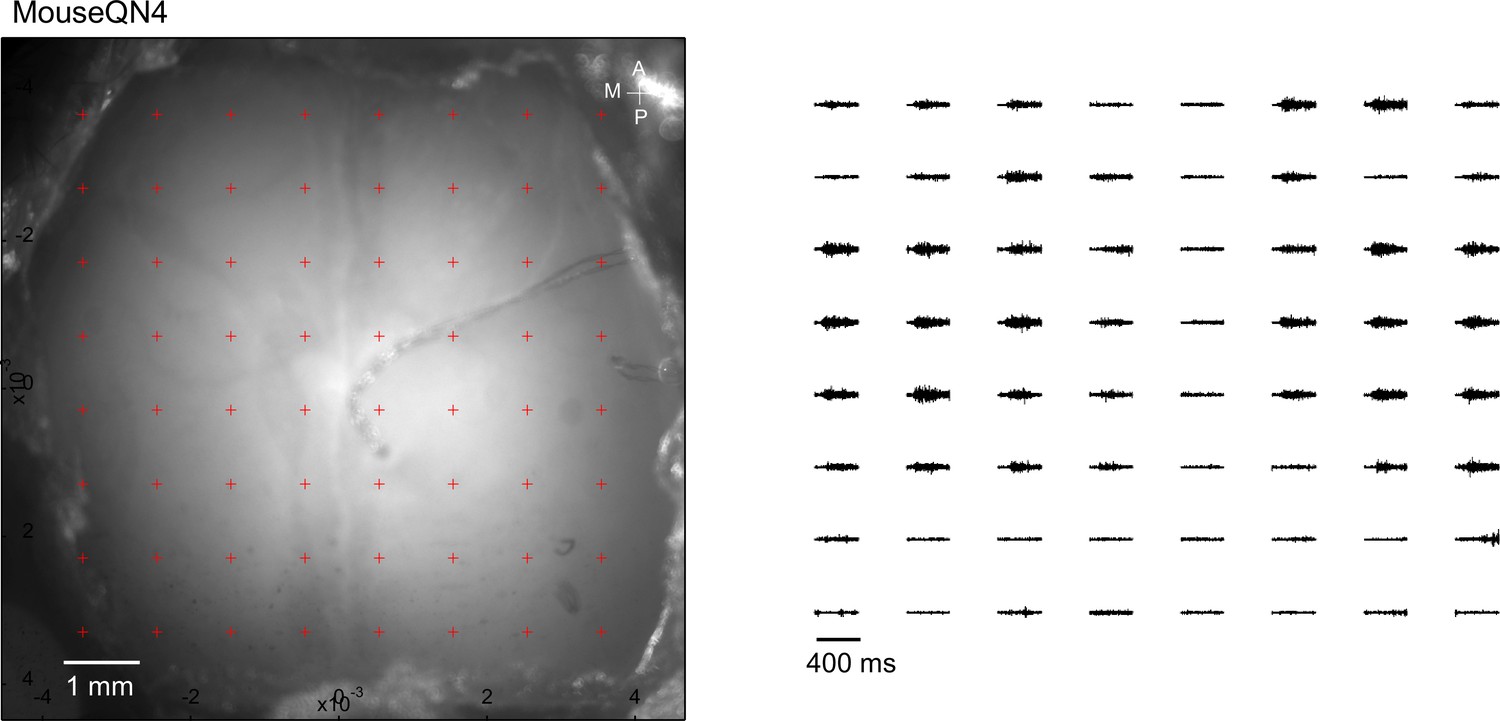
(A) Mouse anatomy illustrates facial motor nucleus axons (facial nerve) that innervate facial muscles. Micro-wire was implanted in the facial nerve. (B) Example spiking activity recorded from facial motor nerve using the micro-wire. (C) Example calcium imaging during facial nerve recording. (D) Facial nerve spike-triggered average map temporal dynamics surrounding facial nerve spikes (t=0ms) of a single mouse (top row) or the average of 5 mice (bottom row). (E) Reference atlas (white outlines; 2004 Allen Institute for Brain Science. Allen Mouse Brain Atlas. Available from: http://mouse.brain-map.org/) (F) Illustration of automated light-based mapping of the dorsal cortex (8x8 grid) by photoactivation of Thy1-ChR2 mice. (G) Example single trial facial nerve response after light stimulation. (H) Average change of facial nerve responses of 6 mice represented on a 2D color-coded map corresponding to each stimulation coordinate overlayed on an example cortical image of Thy1-ChR2 mouse. The amplitude of the average change for each stimulation coordinate corresponds to the total variance of all the trials (>5 trials, within 200ms after stimulus) where there is no facial nerve spiking before the stimulus.
Figure 6—figure supplement 1
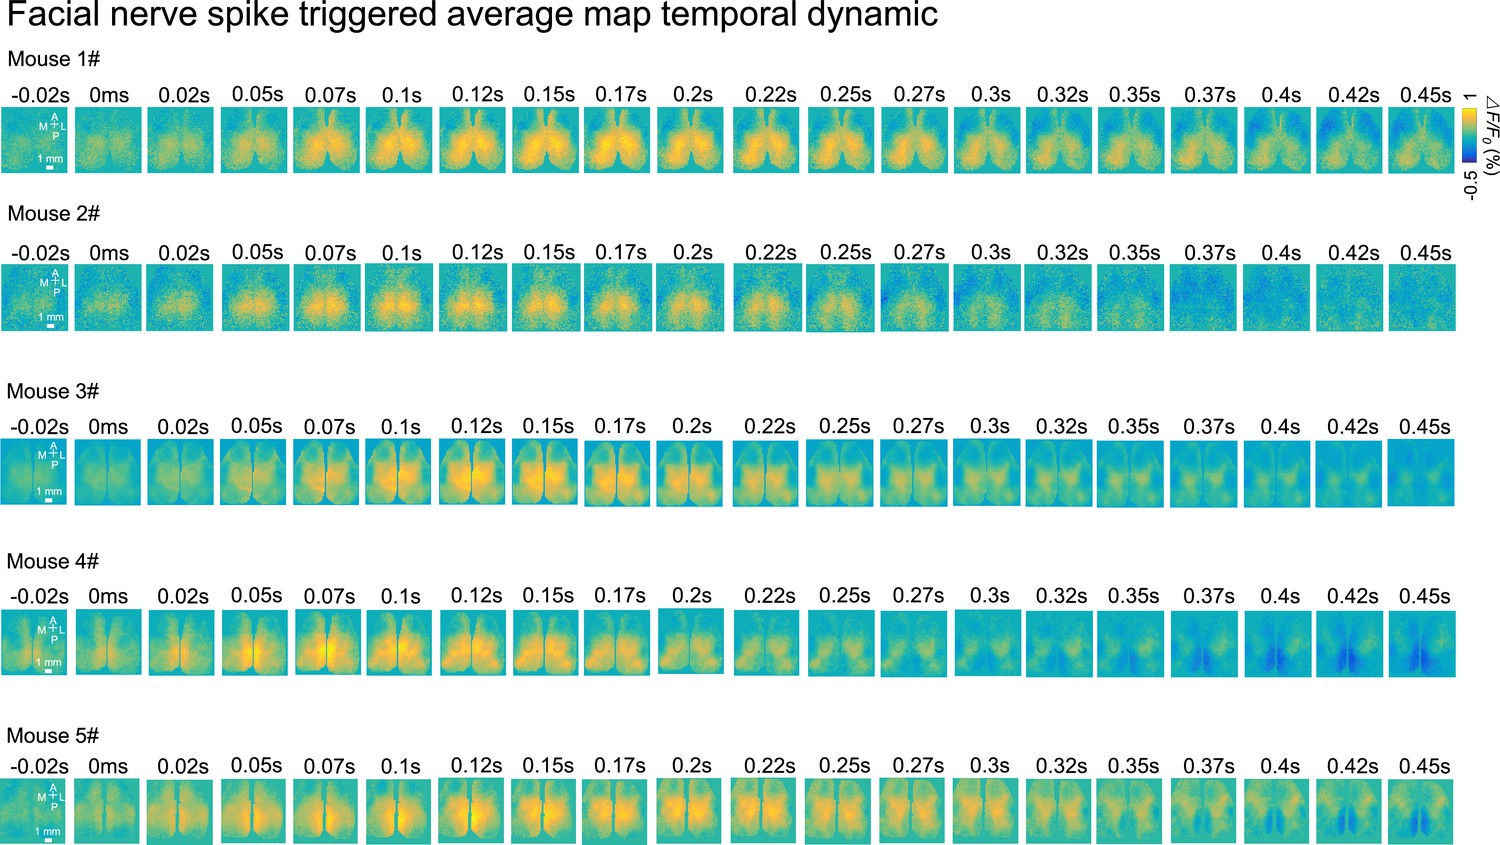
Facial nerve spike-triggered average maps of 5 mice.
Figure 6—figure supplement 2
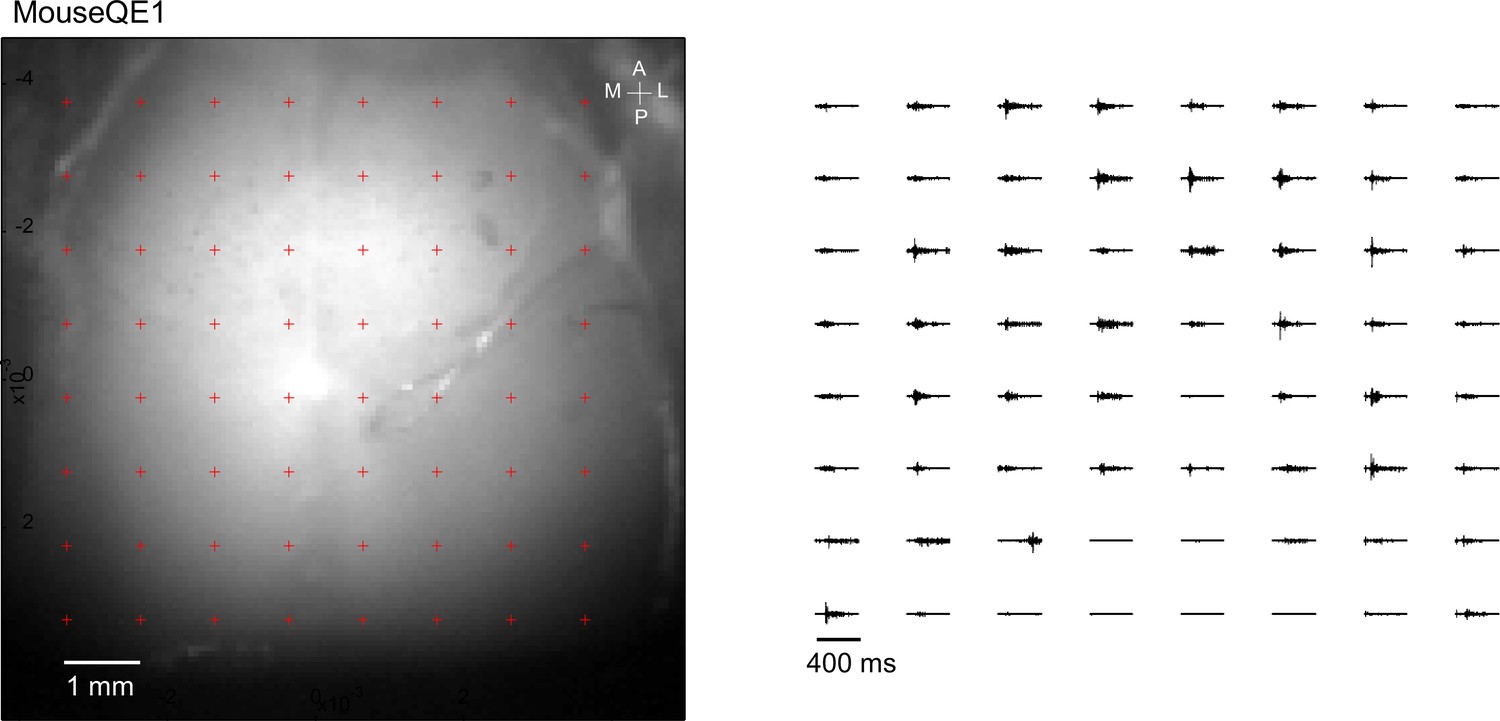
Optogenetic mapping of facial nerve responses (blue laser, 10ms, 2.0 mW) in a Thy1-ChR2 mouse.
Averaged responses (>5 trials) were normalized to the range of 0 and 1 (right).
Figure 6—figure supplement 3
Optogenetic mapping of facial nerve responses (blue laser, 10ms, 2.0 mW) in a Thy1-ChR2 mouse.
Averaged responses (>5 trials) were normalized to the range of 0 and 1 (right).
Figure 6—figure supplement 4
Optogenetic mapping of facial nerve responses (blue laser, 10ms, 2.0 mW) in a Thy1-ChR2 mouse.
Averaged responses (>5 trials) were normalized to the range of 0 and 1 (right).
Figure 6—figure supplement 5
Optogenetic mapping of facial nerve responses (blue laser, 10ms, 2.0 mW) in a Thy1-ChR2 mouse.
Averaged responses (>5 trials) were nomalized to the range of 0 and 1 (right).
Figure 6—figure supplement 6
Optogenetic mapping of facial nerve responses (blue laser, 10ms, 2.0 mW) in a Thy1-ChR2 mouse.
Averaged responses (>5 trials) were normalized to the range of 0 and 1 (right).
Figure 6—figure supplement 7
Optogenetic mapping of facial nerve responses (blue laser, 10ms, 2.0 mW) in a Thy1-ChR2 mouse.
Averaged responses (>5 trials) were normalized to the range of 0 and 1 (right).
Figure 7
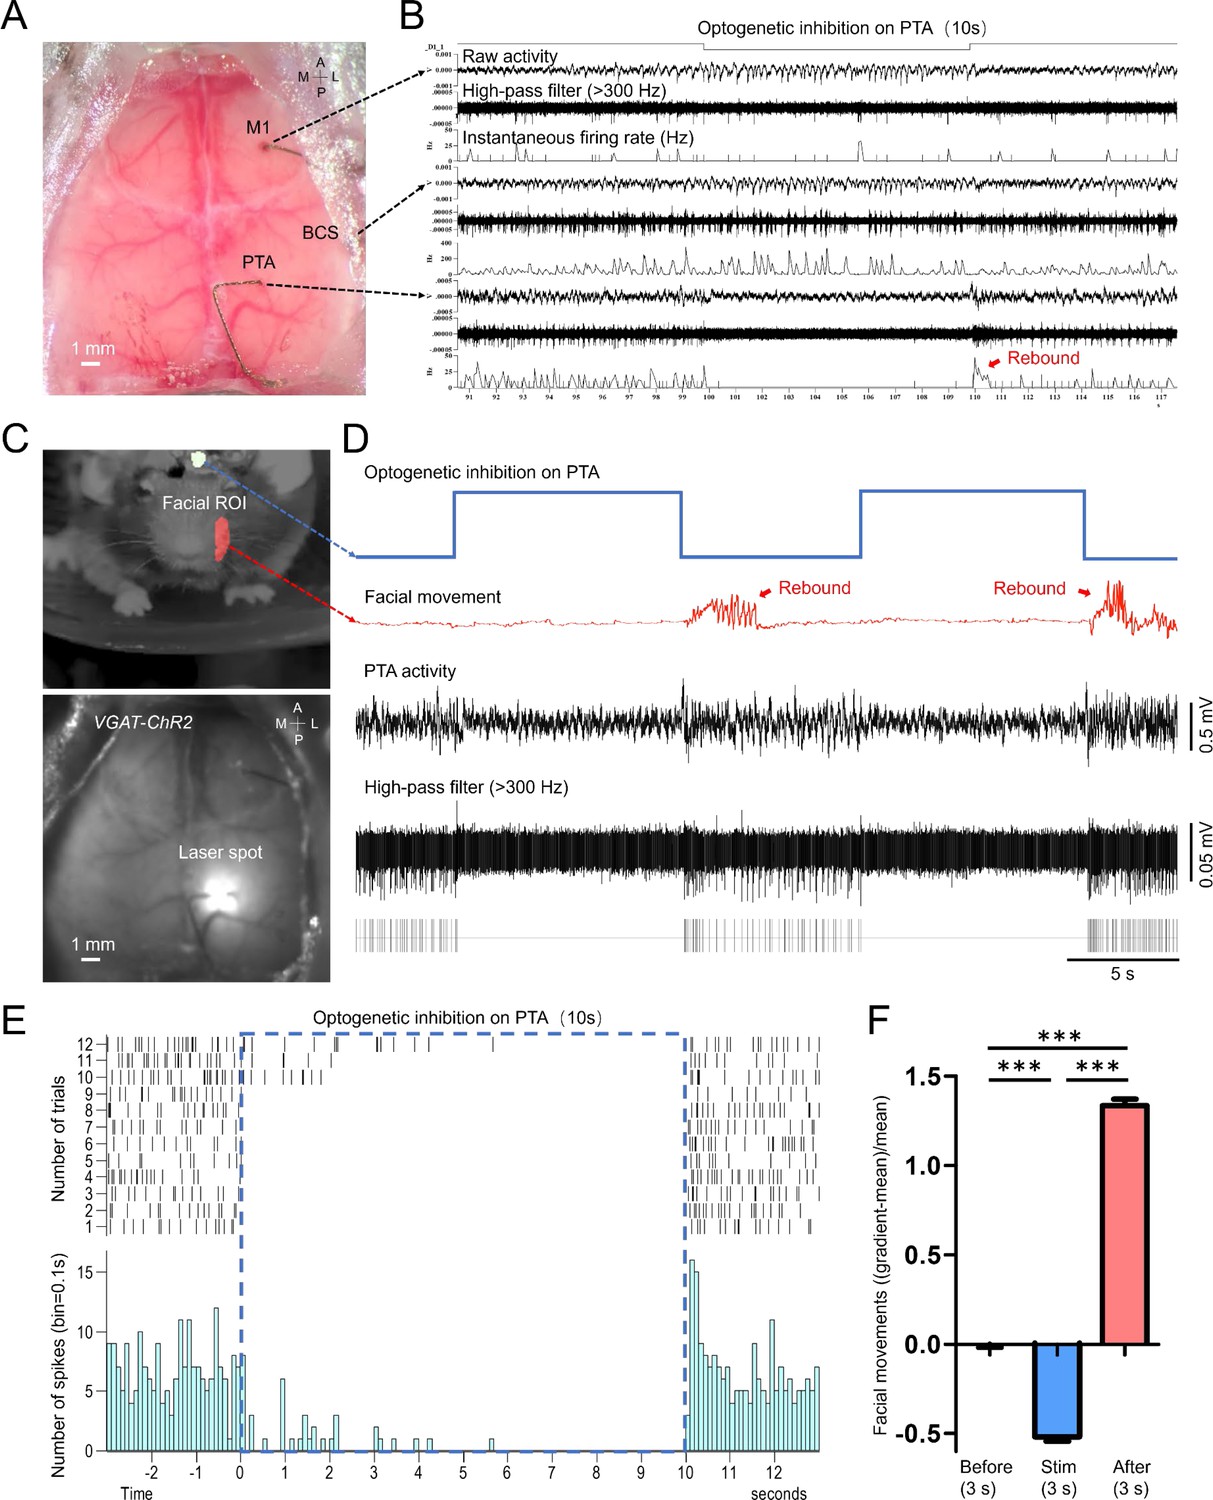
Optogenetic inhibition of the PTA area significantly reduced the facial movement of the mouse.
(A) Unfiltered brain RGB image showing the position of the tetrodes. (B) Simultaneous cellular electrophysiological recording in the cortical regions of M1, BCS, and PTA with optogenetic inhibition on the PTA region. (C) Behavioral image showing masks used for facial movement detection (top). Brain image of a VGAT-ChR2 mouse (ChR2 expressed in cortical inhibitory neurons) with laser targeting the PTA area (bottom). (D) Synchronized traces of optogenetic activation of PTA inhibitory neurons, facial movement, and LFP of the PTA region. Inhibiting the PTA region strongly inhibited facial nerve activity. Cessation of PTA inhibition reliably induced rebound PTA neuron firing and facial movements. (E) The neuronal firing of 12 trials of optogenetic inhibition in PTA. (F) Facial movements ((gradient-mean)/mean) 3 s before, 3 s during, and 3 s immediately after optogenetic inhibition in PTA for 29 trials (Dunn’s Multiple Comparison Test, p<0.001, n=3 mice).
Videos
Video 1
Video of the 4D spatiotemporal whole-brain dynamics of mesoscale cortical calcium imaging and subcortical neuronal firing.
Brain activity data was registered in a 3D mouse brain model. Calcium dynamic intensity and neuronal firing rate of subcortical neurons (Top) were color-coded in the ROIs in the 3D mouse brain model (bottom left). The calcium dynamic was overlaid on a cortical atlas (bottom right).
Video 2
Simultaneous recording of behavior video (left), L-VTA neuronal firing (middle), and wide-field calcium imaging (right) in a behaving mouse.
Video 3
Simultaneous recording of behavior video (left), facial nerve spiking activity (middle), and wide-field calcium imaging (right) during mouse whiskering.
Video 4
Video of the facial response after optogenetic stimulation (blue laser, 10ms) of PTA in a Thy1-ChR2 mouse.
Video 5
Video of the facial response after optogenetic inhibition (blue laser, 10 s) of PTA in a VGAT-ChR2 mouse.
Tables
Table 1
Abbreviation used to define different cortical/sub-cortical areas.
| Mop (M1) | Primary motor area |
|---|---|
| Mos (M2) | Secondary motor area |
| SSp-m | Primary somatosensory area, mouse |
| SSp-ul | Primary somatosensory area, upper limb |
| SSp-ll | Primary somatosensory area, lower limb |
| SSp-n | Primary somatosensory area, nose |
| SSp-bfd | Primary somatosensory area, barrel field |
| SSp-tr | Primary somatosensory area, trunk |
| VISp | Primary visual area |
| VISa | Anterior visual area |
| VISam | Anteromedial visual area |
| VISpm | Posteromedial visual area |
| VISrl | Rostrolateral visual area |
| VISal | Anterolateral visual area |
| VISI | Lateral visual area |
| RSP | Retrosplenial area |
| AUD | Auditory areas |
| PTA | Parietal association area |
| HPF | Hippocampal formation |
| VTA | Ventral tegmental area |
Additional files
Download links
A two-part list of links to download the article, or parts of the article, in various formats.
Downloads (link to download the article as PDF)
Open citations (links to open the citations from this article in various online reference manager services)
Cite this article (links to download the citations from this article in formats compatible with various reference manager tools)
Mesotrode allows chronic simultaneous mesoscale cortical imaging and subcortical or peripheral nerve spiking activity recording in mice
eLife 12:RP87691.
https://doi.org/10.7554/eLife.87691.2


