Rubella virus tropism and single-cell responses in human primary tissue and microglia-containing organoids
- Department of Neurological Surgery, University of California, San Francisco, United States
- Eli and Edythe Broad Center for Regeneration Medicine and Stem Cell Research, University of California, San Francisco, United States
- Department of Anatomy, University of California, San Francisco, United States
- Department of Psychiatry and Behavioral Sciences, University of California, San Francisco, United States
- Weill Institute for Neurosciences, University of California, San Francisco, United States
- Department of Biochemistry and Biophysics, University of California, San Francisco, United States
- Chan Zuckerberg Biohub, United States
Figures
Figure 1 with 1 supplement
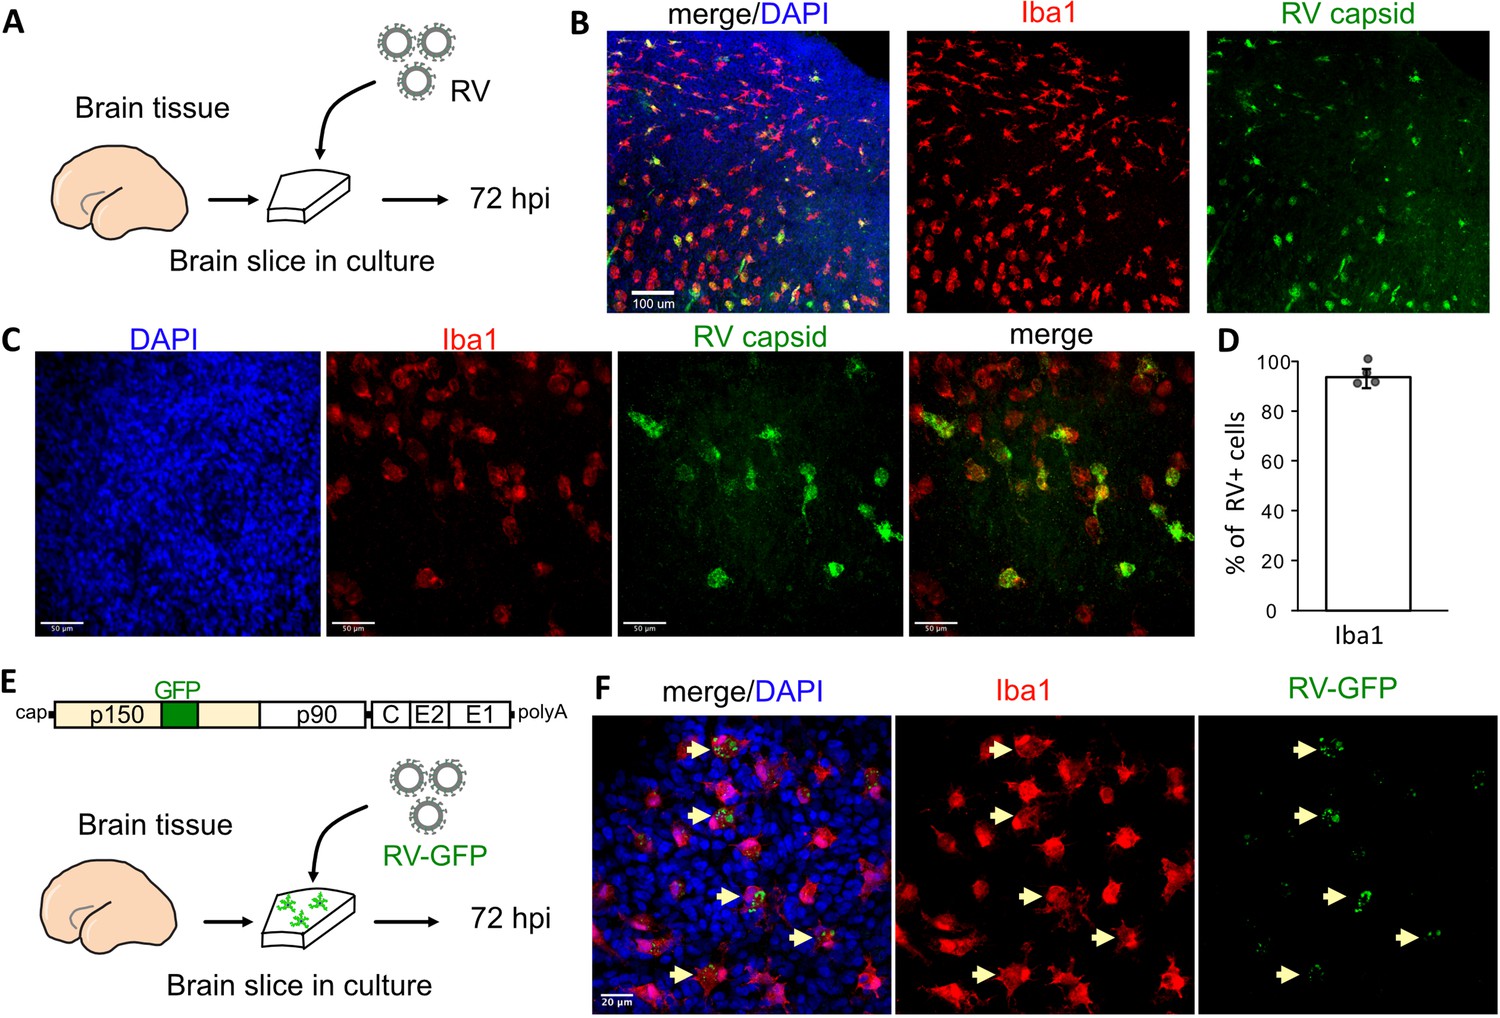
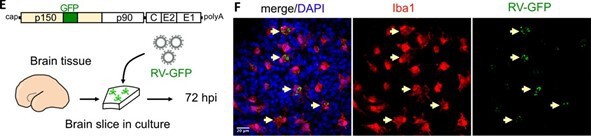
Rubella virus (RV) infects primary human microglia in cultured brain slices.
(A) Schematic for brain slice infection. Mid-gestation (GW18-23) human brain slices were infected with RV for 72 hr. (B, C) Immunostaining for RV capsid and Iba1 in cultured cortical slices at 72 hpi, at 10× (scale bar 100 μm) (B) and at 40× magnification (scale bar 50 μm) (C). (D) Quantification of RV capsid-positive cells co-labeled with microglial marker Iba1: 764/819 (93.3%) of RV+ cells were microglia based on Iba1 staining across four biological replicates. Error bars denote standard deviation. (E) Diagram of viral genome of GFP-expressing RV (RV-GFP). Cortical brain slices were infected with RV-GFP for 72 hr. (F) Examples of GFP fluorescence and Iba1 immunostaining at 72 hpi of cultured cortical slices with GFP-RV, at 62× (scale bar 20 μm). GFP expression of modified RV is localized to Iba1-positive microglia cells (arrows).
Figure 1—figure supplement 1
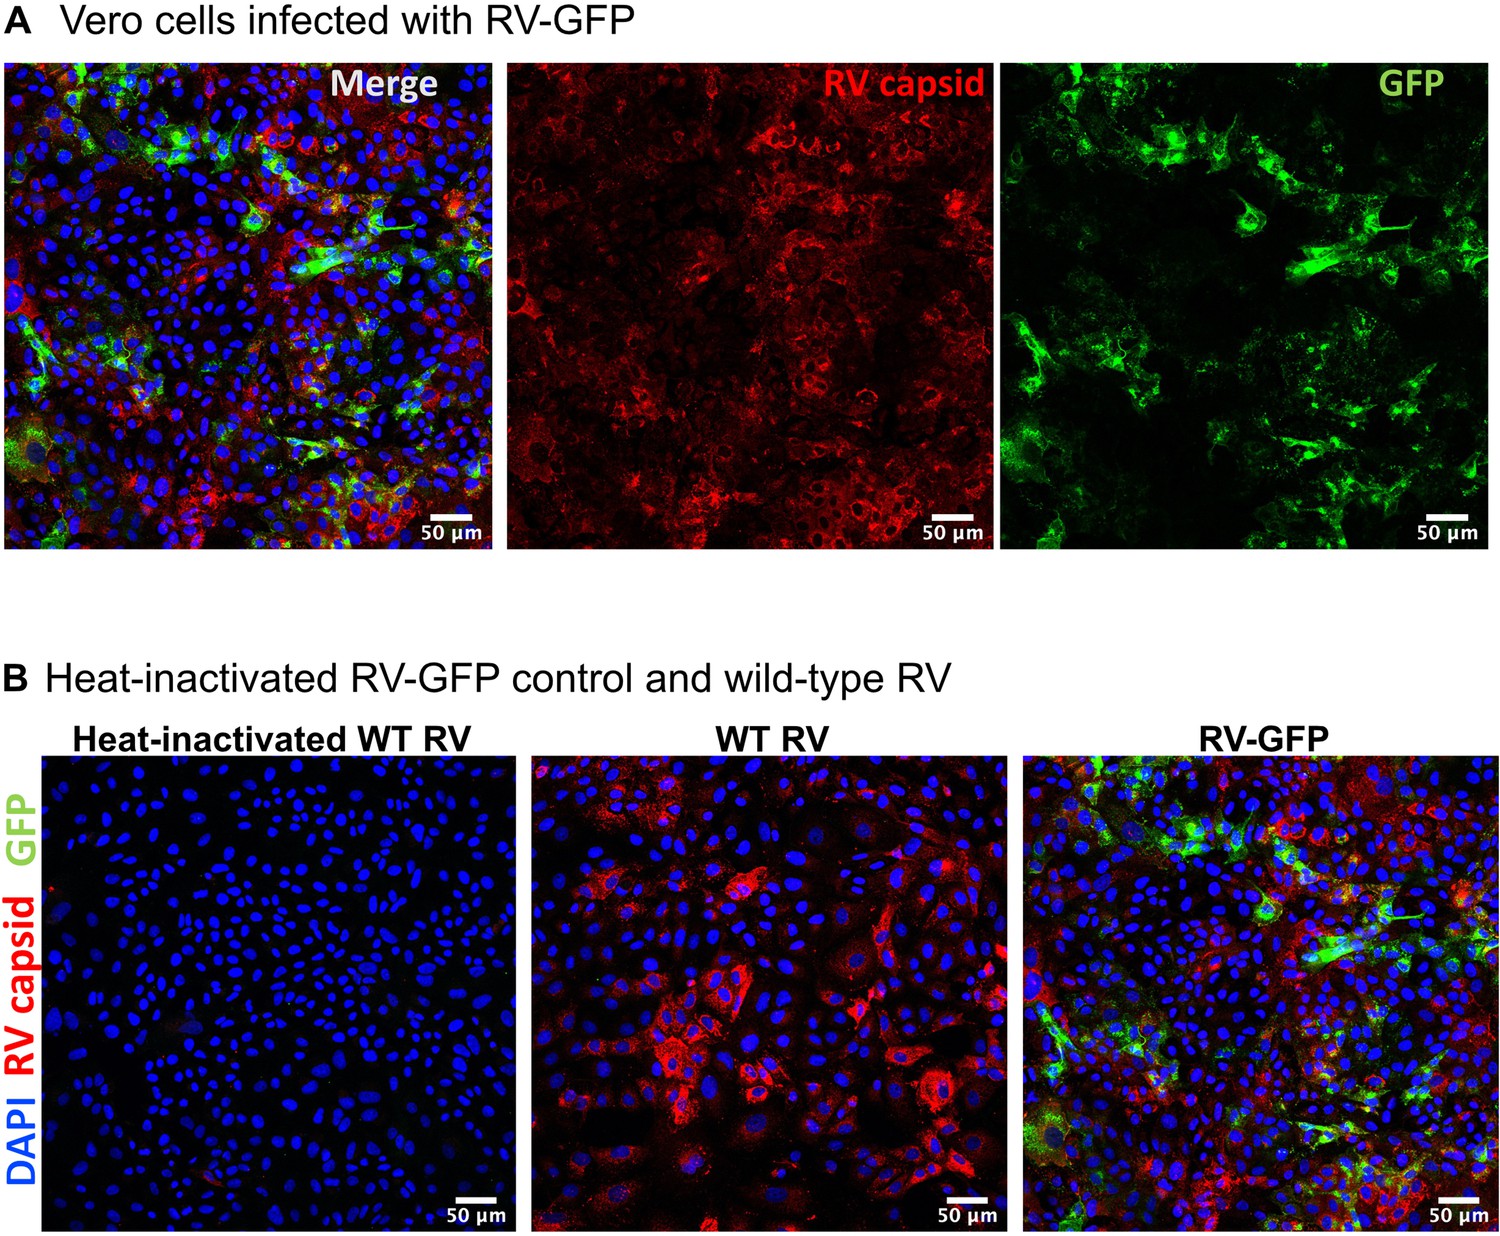
GFP expression in rubella virus (RV)-infected Vero cells.
(A) Co-localization of RV viral capsid and GFP expression in Vero cells. (B) Heat-inactivated wild type RV, parental wild type RV strain, and GFP-expressing RV construct in Vero cells. RV-GFP image is the same as in A.
Figure 2 with 2 supplements
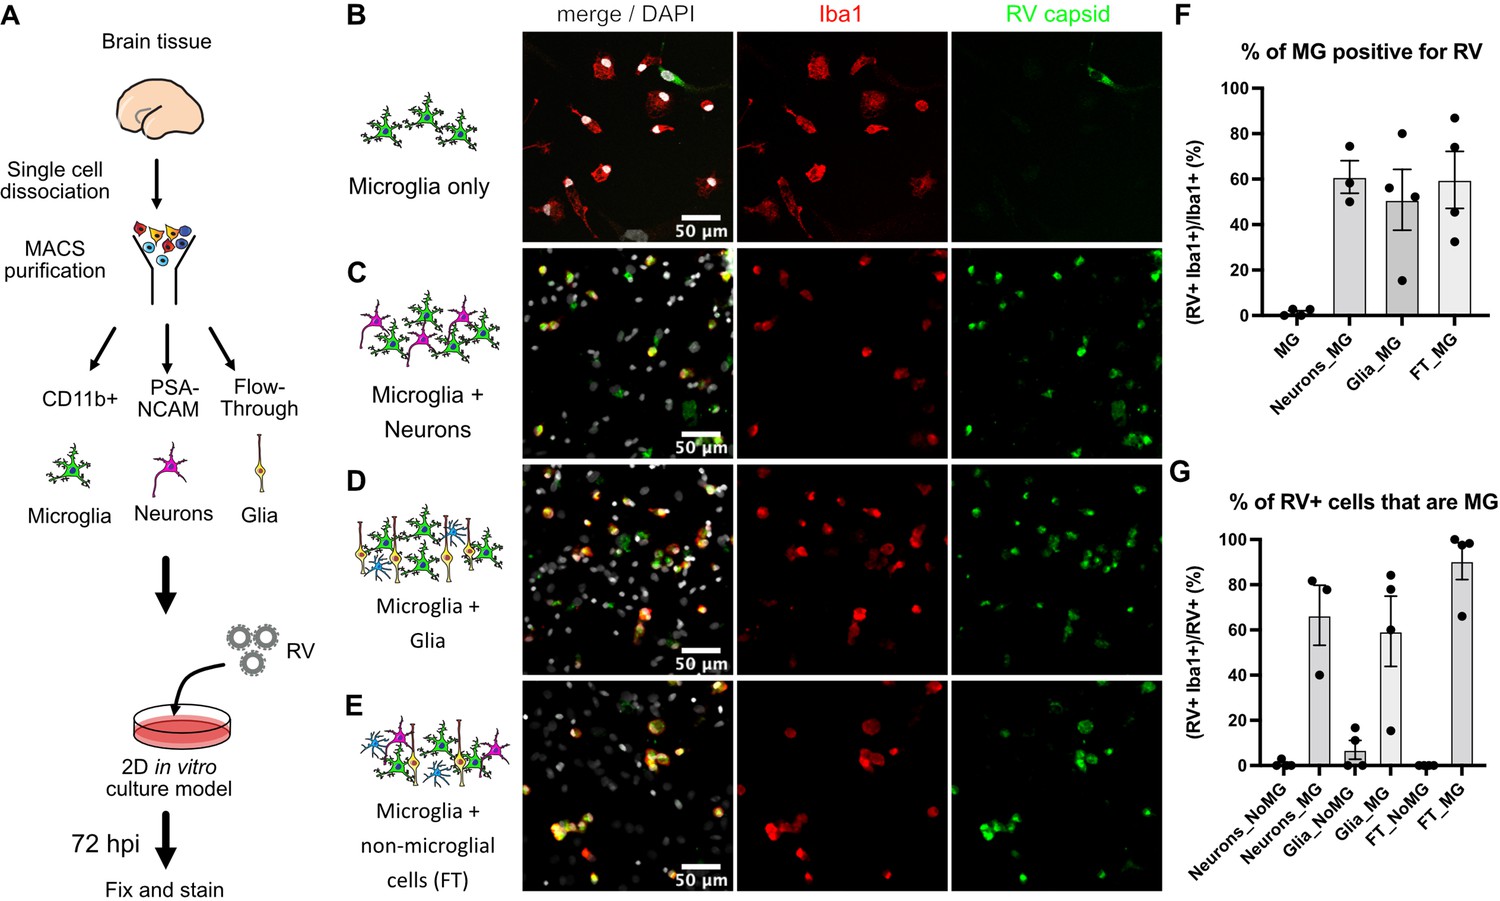
Rubella virus (RV) infection of microglia is dependent on the presence of other cells.
(A) Schematic of rubella infection. Primary prenatal brain tissue was dissociated and different cell types were purified using magnetic-activated cell sorting (MACS). Microglia cells were cultured alone or in combination with neurons, glial cells, or all cell types. 2D cultures were infected with RV for 72 hr and processed for immunostaining. (B–E) Representative images of microglia cultured with different cell types. Cell cultures were stained for microglia marker Iba1 (red), RV capsid (green), and DAPI (gray; on the overlay Merge channel). (B) Purified microglia only. (C) Microglia and neurons (purified with PSA-NCAM magnetic beads) co-cultured at 1:5 ratio. (D) Microglia and glial cell types (flow-through fraction after PSA-NCAM magnetic beads) cultured together at 1:5 ratio. (E) Microglia cultured with non-microglial cells (flow-through after CD11b magnetic beads; mixed cell populations) at 1:5 ratio. (F) Quantification of RV capsid immunopositivity among microglia (Iba1+) for conditions in B–E. FT: flow-through after microglia MACS purification. Error bars denote SEM. Each data point (N=4) represents a field of view from the same experimental batch and represents a technical replicate. (G) Quantification of microglia (Iba1+) among RV capsid-positive cells.
Figure 2—figure supplement 1
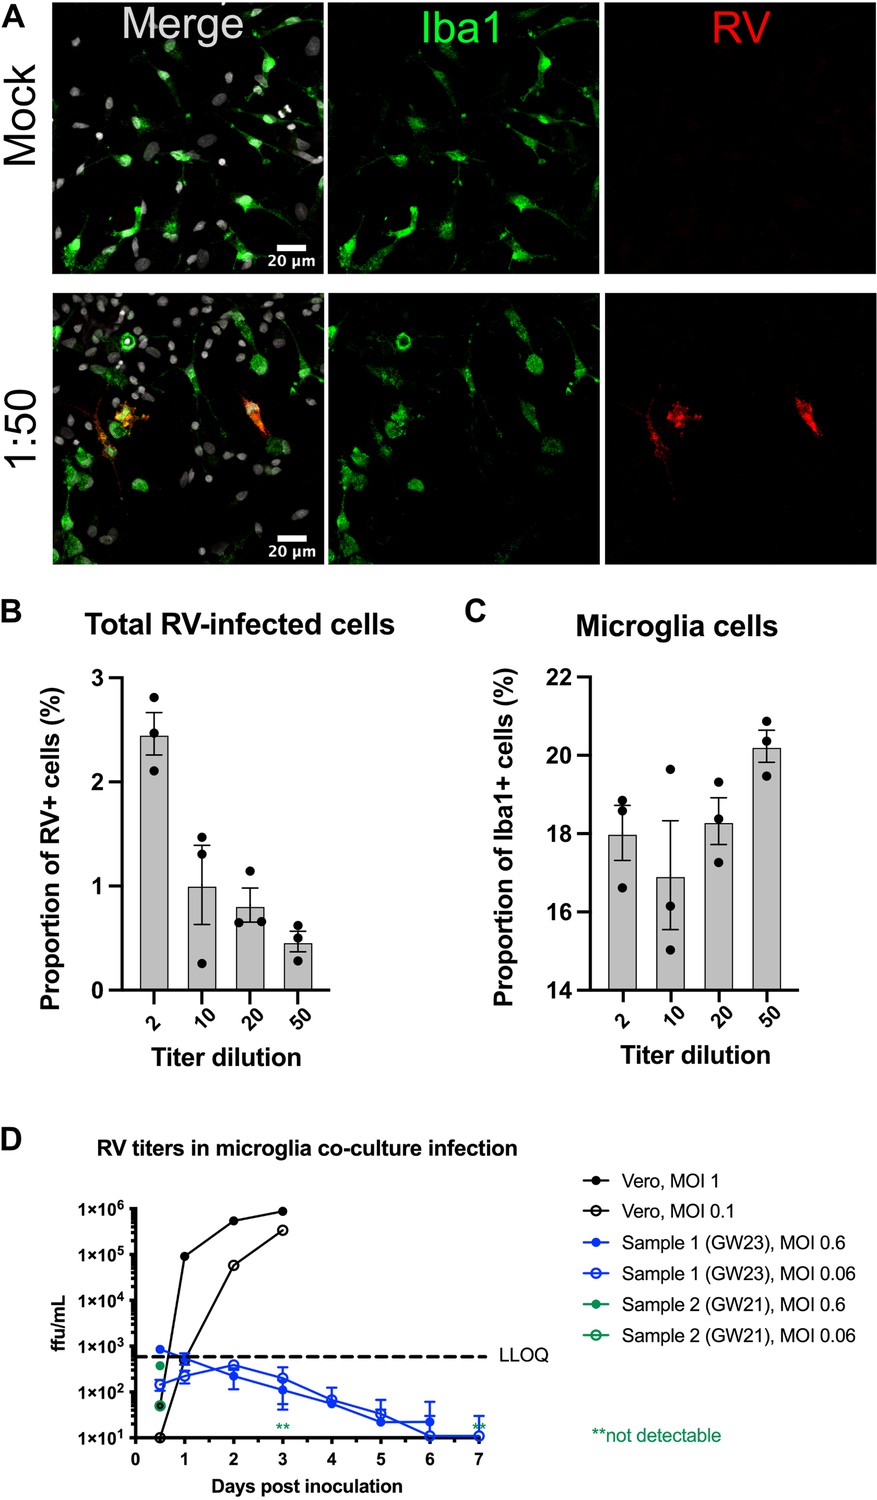
Rubella virus (RV) inoculum dilution in mixed co-cultures of microglia and non-microglia cells.
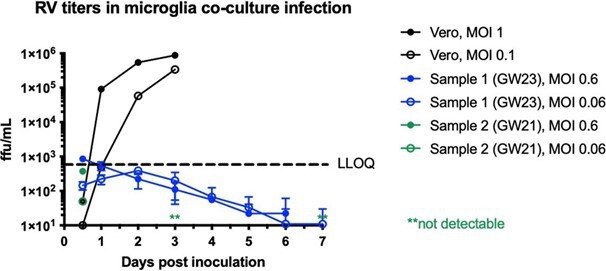
(A) Representative images of co-cultures inoculated with mock virus or with RV viral stock diluted at 1:50. (B) Quantifications of cells immunopositive for RV capsid across different inoculum dilutions show a decrease in the overall proportion of RV capsid-positive cells at lower titers. Columns represent mean with standard error means. Dots represent individual wells (N=3). (C) Proportion of microglia is not changed across different viral stock dilutions. Columns represent means with standard error means. Dots represent individual wells (N=3). (D) RV titering experiment performed in Vero cells (positive control) or dissociated microglia co-cultures. In primary microglia co-cultures, viral titer falls below detection levels after several days of infection.
Figure 2—figure supplement 2
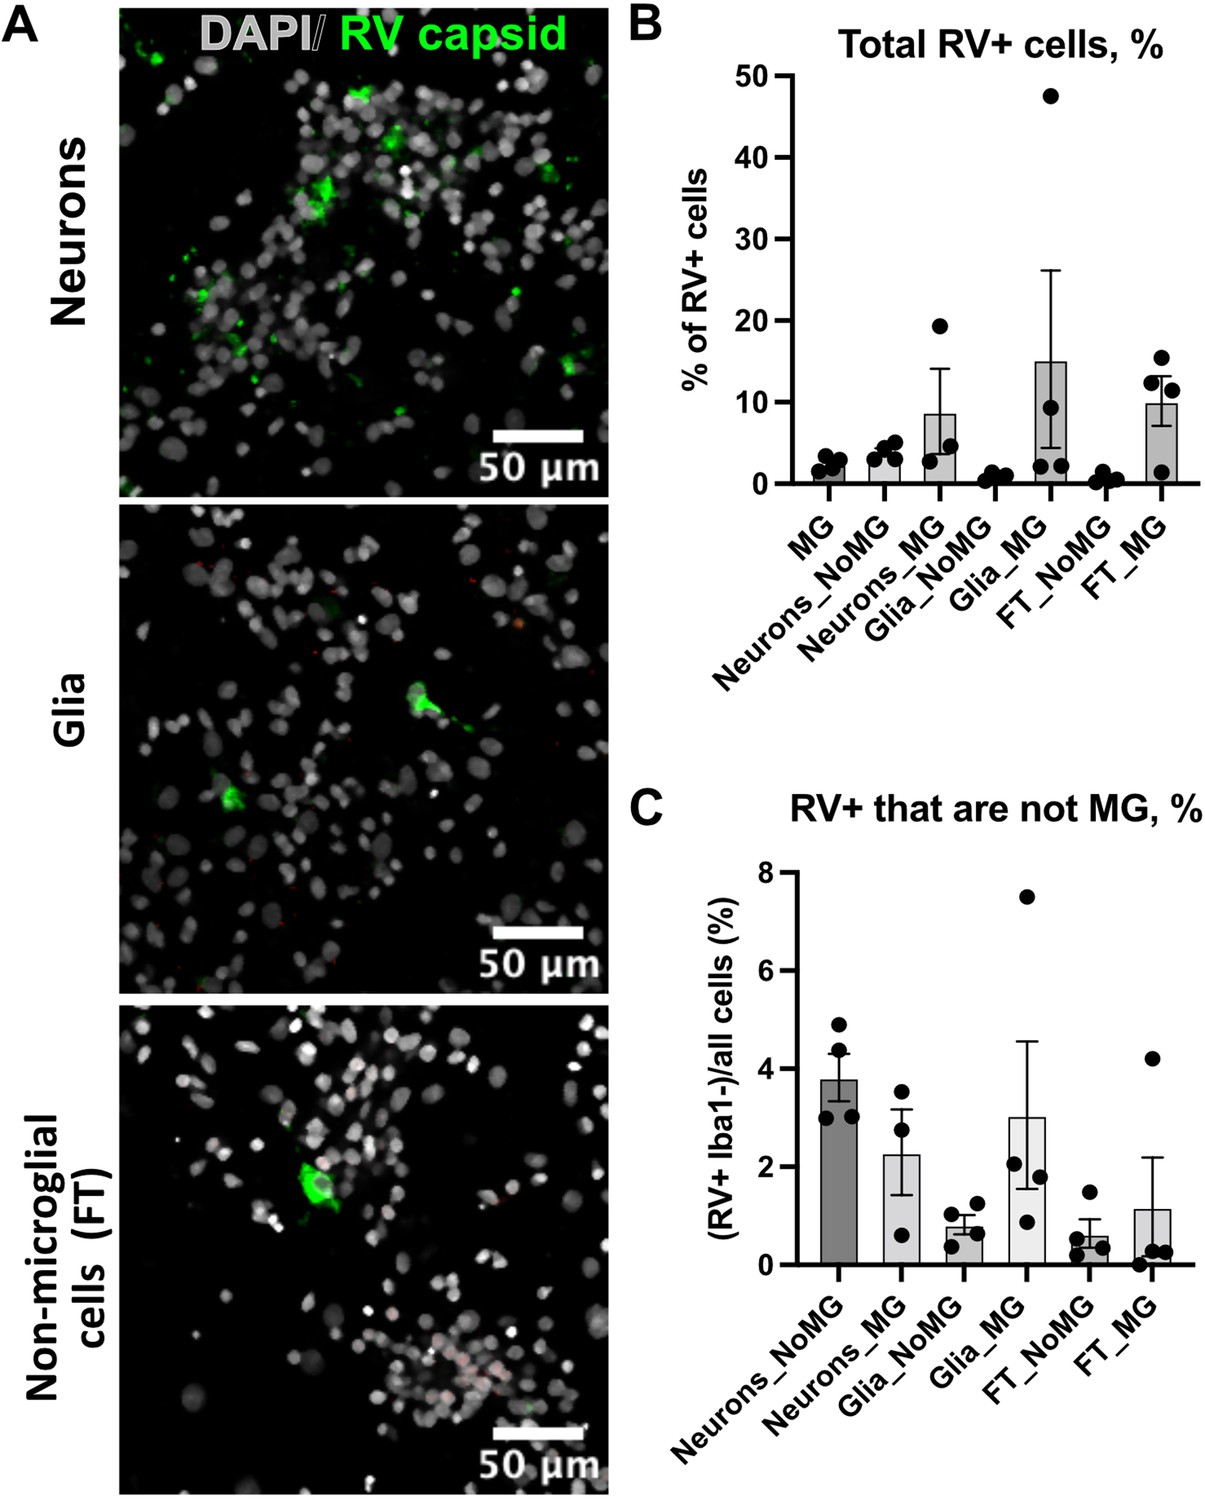
Rubella infection in non-microglia cells.
(A) Representative images of different cell types depleted of microglia. Cell cultures were stained with rubella virus (RV) capsid (green) and DAPI. (B) Quantification of total cells that are positive for RV capsid across conditions. Columns represent mean with standard error means. Each data point (N=4) represents a field of view from the same experimental batch and represents a technical replicate. (C) Quantification of RV+ cells that are not microglia across different cell populations. No statistically significant difference was detected in RV infectivity in cells cultured with or without microglia.
Figure 3
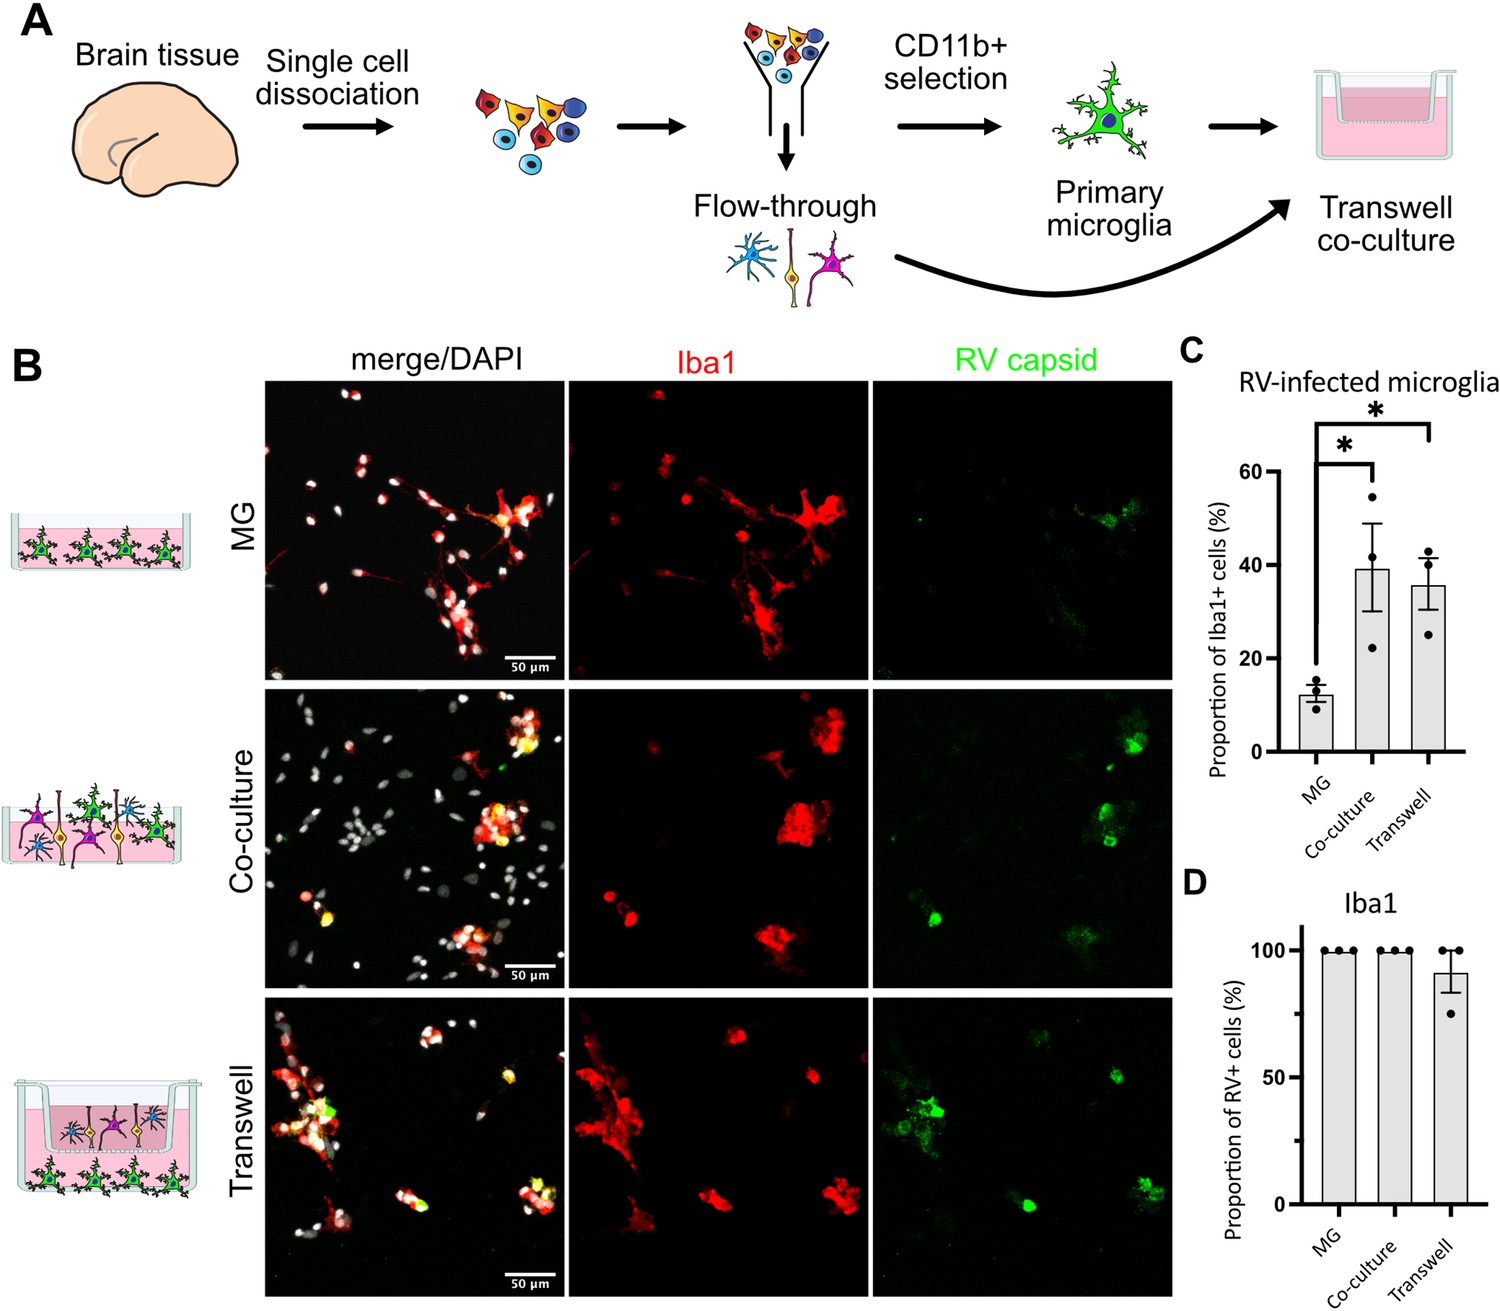
Direct cell-cell contact is not required for microglia infection by rubella virus (RV).
(A) Schematic for experimental setup. Primary human brain tissue was dissociated, and microglia were cultured with or without microglia-depleted flow-through portion. Cells were co-cultured in direct contact or in solution-permeable chambered transwells (TW). (B) Representative images of microglia-enriched cultures (top row), microglia cultured with other cell types in the same well (middle row), and microglia cultured in the bottom compartment with other cell types cultured in a permeable transwell chamber (bottom row) infected with RV for 72 hr. (C) Quantification of RV capsid immunopositivity among microglia (Iba1+). Three fields of view across the same experiment were quantified for each condition and represent technical replicates. Error bars represent SEM. p-value between microglia and co-culture condition is 0.0479. p-value between microglia and transwell condition is 0.0159. (D) Quantification of microglia (Iba1+) among RV capsid-positive cells.
Figure 4

Microglia in neuroimmune organoids are infected with rubella virus (RV).
(A) Primary human microglia were transplanted into brain organoids and resulting neuroimmune organoids were exposed to RV. After 72 hr or 2 weeks organoids were processed for immunofluorescence validation (this figure) or single-cell RNA sequencing (scRNAseq) analysis (Figure 5). (B) Representative immunofluorescence images of brain organoids without microglia subjected to RV exposure for 72 hr. Radial glial cells are labeled with Sox2 (cyan), microglia are labeled with Iba1 (red), and RV is labeled with anti-RV capsid antibody (green). Scale bar is 50 μm. (C) Representative immunofluorescence images of brain organoids with microglia at 72 hr (top panel) or 2 weeks (bottom panel) after RV exposure. Radial glial cells are labeled with Sox2 (cyan), microglia are labeled with Iba1 (red), and RV is labeled with anti-RV capsid antibody (green). Dashed boxes represent zoomed-in examples of microglia cells. Scale bar is 50 μm.
Figure 5 with 1 supplement

Rubella virus (RV) exposure of brain organoids leads to interferon response.
(A) Single-cell RNA sequencing analysis identified 13 clusters, including neurons and glial cells (Div.: dividing cells, RG: radial glia, Astros: astrocytes, IPCs: intermediate progenitor cells). (B) Dot plot depicting cluster marker genes for each cluster. (C) Uniform manifold approximation and projection (UMAP) plots of organoids colored by the presence or absence of microglia. (D) UMAP plots of organoids colored by the presence or absence of RV treatment. (E) Feature plot for expression levels of IFITM3. (F) IFITM3 expression in all cells across different conditions. (G) Representative images of IFITM3 immunofluorescence in brain organoids with microglia with wild type RV (bottom panel) or heat-inactivated control (top panel) 72 hr post-infection. IFITM3 is labeled in magenta, microglia are labeled with Iba1 (green), cell nuclei are labeled with DAPI (gray). (H) Quantification of fluorescence intensity of IFITM3 normalized to DAPI intensity per organoid. Columns represent mean of four organoids. Dots represent averages across several sections for each individual organoid. Error bars represent SEM. Unpaired parametric Student’s t-test was used to compare the two groups in H–I. p-value = 0.04. (I) Quantification of fluorescence intensity of DAPI staining per organoid. p-value = 0.22.
-
Figure 5—source data 1
Cluster marker genes for brain organoid single-cell RNA sequencing (scRNAseq) dataset, related to Figure 5.
- https://cdn.elifesciences.org/articles/87696/elife-87696-fig5-data1-v1.xlsx
-
Figure 5—source data 2
Differentially expressed genes detected in brain organoid single-cell RNA sequencing (scRNAseq) dataset, related to Figure 5.
- https://cdn.elifesciences.org/articles/87696/elife-87696-fig5-data2-v1.xlsx
Figure 5—figure supplement 1
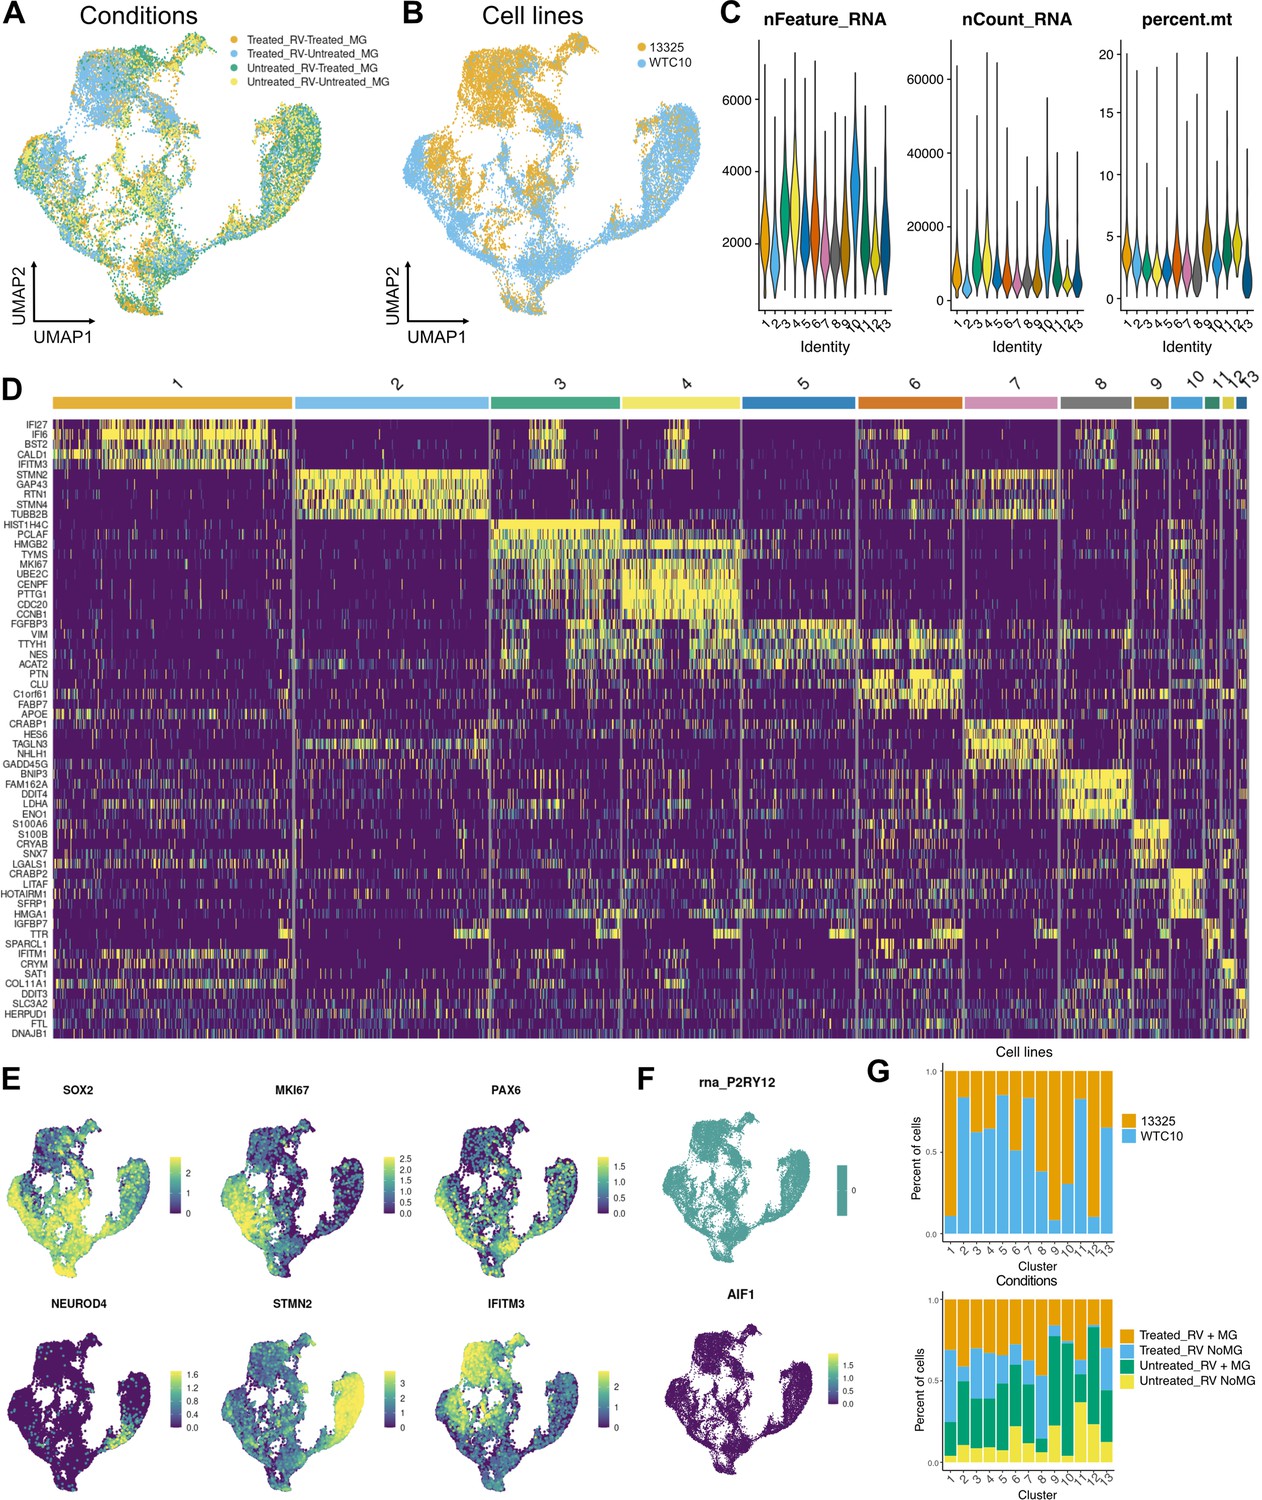
Single-cell RNA sequencing (scRNAseq) analysis of brain organoids.
(A) Uniform manifold approximation and projection (UMAP) of brain organoids colored by condition. (B) UMAP colored by individual cell line. Two iPSC lines, 13325 and WTC10, were used for the scRNAseq experiment. Cell line details are described in Materials and methods. (C) By-cluster distribution of quality control metrics of scRNAseq data, including total number of genes detected in each cell (‘nFeature_RNA’), total number of molecules detected within a cell (‘nCount_RNA’), and percent of mitochondrial reads (‘percent mito’). (D) Heatmap of top cluster marker genes for each cluster. (E) Feature plots for select cluster marker genes. SOX2 represents radial glia cells and astrocytes; MKI67 is a marker of dividing cells; PAX6 labels intermediate progenitor cells; NEUROD4 is a neuronal differentiation gene and a marker for immature neurons and neural progenitor cells; STMN2 is a marker for neurons; IFITM3 is a marker for interferon response. (F) Feature plots for microglia markers. Top – no canonical microglia marker P2RY12 was detected in the dataset. Bottom – rare AIF1-positive cells are scattered throughout all clusters. (G) Contribution of a cell line (top) and each condition (bottom) to each cluster composition.
Figure 6

NOVA1 expression is reduced in response to rubella virus (RV) exposure.
(A) Differentially expressed genes in different cell types in response to RV treatment without (top panel) and with microglia (bottom panel). IPCs – intermediate progenitor cells. In the presence of microglia, fewer differentially expressed genes in response to RV treatment were identified across all major cell types. In organoids with microglia, NOVA1 trended toward a decrease in IPCs and neurons (labeled in blue in the panel). Kolmogorov-Smirnov test was used on DEGs with p-value <0.05. ***<0.001, NS – not significant, *<0.05. (B) Violin plot for NOVA1 that is differentially expressed in response to RV and presence of microglia. IPCs – intermediate progenitor cells, RG – radial glia, Div. – dividing cells, EN – excitatory neurons. (C) Representative images of RV-exposed organoids with microglia at 2 weeks post-exposure, stained with DAPI for cell nuclei (blue), NOVA1 (magenta), NeuN for neurons (green), and EOMES for intermediate progenitor cells (cyan). (D) Cell number quantification for NeuN+ neurons that were also positive for NOVA1 in control (heat-inactivated RV) or RV condition. Averages of 3-5 sections (technical replicates) across 3 organoids (biological replicates, individual data points) where used for quantification in D-G. Unpaired parametric Student’s t-test was used to compare the two groups in D–G. p-value = 0.088. (E) Cell number quantification for EOMES+ intermediate progenitors that were also positive for NOVA1 in control (heat-inactivated RV) or RV condition. p-value = 0.0042. (F) Cell number quantification for NeuN+ neurons per organoid area displayed in 1000 cells × mm2 or organoid surface area in control (heat-inactivated RV) or RV condition. p-value = 0.0004. (G) Cell number quantification for EOMES+ intermediate progenitor cells per organoid area displayed in 1000 cells × mm2 or organoid surface area in control (heat-inactivated RV) or RV condition. p-value = 0.86.
Author response image 1

Rubella virus titering experiment performed in Vero cells (positive control) or dissociated microglia co-cultures.
In primary microglia co- cultures, viral titer falls below detection levels after several days of infection.
Author response image 2

Author response image 3

Modest increase in RV RNA over time in brain slice infections.
Rubella virus RNA measured by qPCR relative to GAPDH gene, in n=3 samples (2 technical replicates each condition). Brain slices were exposed to RV, then collected at end of inoculation (4 hours post infection), or at 3 or 5 days post infection, and processed for RNA extraction and RT-qPCR.
Author response image 4

After 2 weeks post infection, microglia remain positive for RV capsid.
Author response image 5

After 2 weeks post infection, microglia remain positive for RVOrganoids without microglia do not show positive RV immunofluorescence.
Author response image 6

P2RY12 co-localizes with Iba1 in primary brain tissue from gestational week 17.5, including cells with more ameboid morphology (arrows).
Author response image 7

Examples of microglia with round (top) and ramified (bottom) morphology that co-localize with RV capsid staining.
Author response image 8
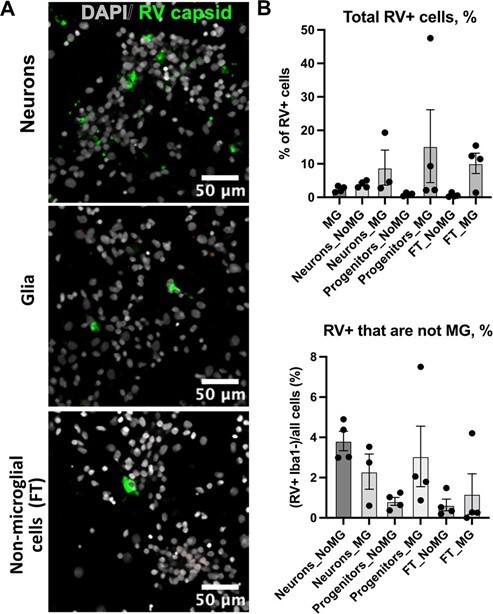
Rubella infection in non-microglia cells.
(A) Representative images of different cell types depleted of microglia. Cell cultures were stained RV capsid (green) and DAPI. (B) Quantification of total cells that are positive for RV capsid across conditions. (C) Quantification of RV+ cells that are not microglia across different cell populations. No statistically significant difference was detected in RV infectivity in cells c-cultured with or without microglia.
Author response image 9

Organoids without microglia do not show positive RV immunofluorescence.
Author response image 10

Data composition depending on condition.
A. Cell number contribution from organoids with and without microglia. B. Contribution of each condition to each cluster composition.
Author response image 11

Quantification of RV+ cells that are not microglia across different cell populations.
No statistically significant difference was detected in RV infectivity in cells cultured with or without microglia.
Author response image 12

Rubella infection in non-microglia cells.
(A) Representative images of different cell types depleted of microglia. Cell cultures were stained RV capsid (green) and DAPI. (B) Quantification of total cells that are positive for RV capsid across conditions. (C) Quantification of RV+ cells that are not microglia across different cell populations. No statistically significant difference was detected in RV infectivity in cells c-cultured with or without microglia.
Author response image 13

Rubella virus titering experiment performed in Vero cells (positive control) or dissociated microglia co-cultures.
In primary microglia co- cultures, viral titer falls below detection levels after several days of infection.
Author response image 14

J2 antibody labels dsRNA in both RV-exposed and control heat- inactivated virus conditions, presumably due to native dsRNA that is not unique to the viral replication.
Author response image 15

Microglia in organoids co-localize with RV capsid staining.
Author response image 16
Rubella virus titering experiment performed in Vero cells (positive control) or dissociated microglia co-cultures.
In primary microglia co- cultures, viral titer falls below detection levels after several days of infection.
Author response image 17

Modest increase in RV RNA over time in brain slice infections.
Rubella virus RNA measured by qPCR relative to GAPDH gene, in n=3 samples (2 technical replicates each condition). Brain slices were exposed to RV, then collected at end of inoculation (4 hours post infection), or at 3 or 5 days post infection, and processed for RNA extraction and RT-qPCR.
Author response image 18

J2 antibody labels dsRNA in both RV-exposed and control heat- inactivated virus conditions, presumably due to native dsRNA that is not unique to the viral replication.
Author response image 19

FISH probes to positive strand (genomic) and negative strand (replication template) RV RNA in Vero cells and microglia co-cultures.
(A) Representative images of Vero cells infected with RV (top row) or Zika virus as control (bottom row). At 72hpi, cells were fixed and processed for immunofluorescence with anti-RV capsid antibody (RVcap) or Zika virus antibody (Zika4G2), and then FISH was performed using probes to positive strand (+) or negative strand (-) RV RNA. Negative strand RV RNA difficult to visualize at low-power magnification, and required quantification within cell borders defined by wheat germ agglutinin staining with results in panel B. (B) In Vero cells, negative strand RV RNA is detected in strongly infected cells. Infection strength determined by intensity of RV capsid immunofluorescence staining and positive strand RV RNA (RVcap/(+) 2/3 indicates robust infection, RVcap/(+) 1 indicates weak infection). ZIKVinf = Zika virus infected control. (C) In microglia co-cultures, positive strand RV RNA detected in cells with RV capsid immunopositivity (RVcap_pos). RVinf = RV infected. RVHI = heat-inactivated RV. (D) In microglia co-cultures, negative strand RV RNA quantification not significantly different between mock, heat-inactivated RV (RVHI), or RV- infected conditions (RVinf), including cells with weak positive-strand RV RNA (RVinf, (+)<8) or cells with stronger positive-strand RV RNA (RVinf, (+)>=8). Two biological replicates (bHR60 and bHR61), n indicates number of cells counted.
<bold>Author response image 20.</bold>
<bold>Author response image 21.</bold>

Rubella infection in non-microglia cells.
(A) Representative images of different cell types depleted of microglia. Cell cultures were stained RV capsid (green) and DAPI. (B) Quantification of total cells that are positive for RV capsid across conditions. (C) Quantification of RV+ cells that are not microglia across different cell populations. No statistically significant difference was detected in RV infectivity in cells c-cultured with or without microglia.
Author response image 23

Organoids labeled with splice regulator NOVA1 (magenta), neuronal marker NeuN (green) and intermediate progenitor cell marker EOMES (cyan).
Author response image 22

Microglia in organoids co-localize with RV capsid staining.
Organoid with microglia were exposed to RV for 72 hrs or two weeks.
Additional files
Download links
A two-part list of links to download the article, or parts of the article, in various formats.
Downloads (link to download the article as PDF)
Open citations (links to open the citations from this article in various online reference manager services)
Cite this article (links to download the citations from this article in formats compatible with various reference manager tools)
Rubella virus tropism and single-cell responses in human primary tissue and microglia-containing organoids
eLife 12:RP87696.
https://doi.org/10.7554/eLife.87696.3


