Searching for molecular hypoxia sensors among oxygen-dependent enzymes
- Department of Pharmaceutical Chemistry, University of California San Francisco, San Francisco, United States
- Department of Psychiatry, University of California, San Francisco, United States
- Hypoxia Research Laboratory, University of California San Francisco, San Francisco, United States
- Center for Health Equity in Surgery and Anesthesia, University of California San Francisco, San Francisco, United States
- Anesthesia and Perioperative Care, University of California San Francisco, San Francisco, United States
Figures
Figure 1
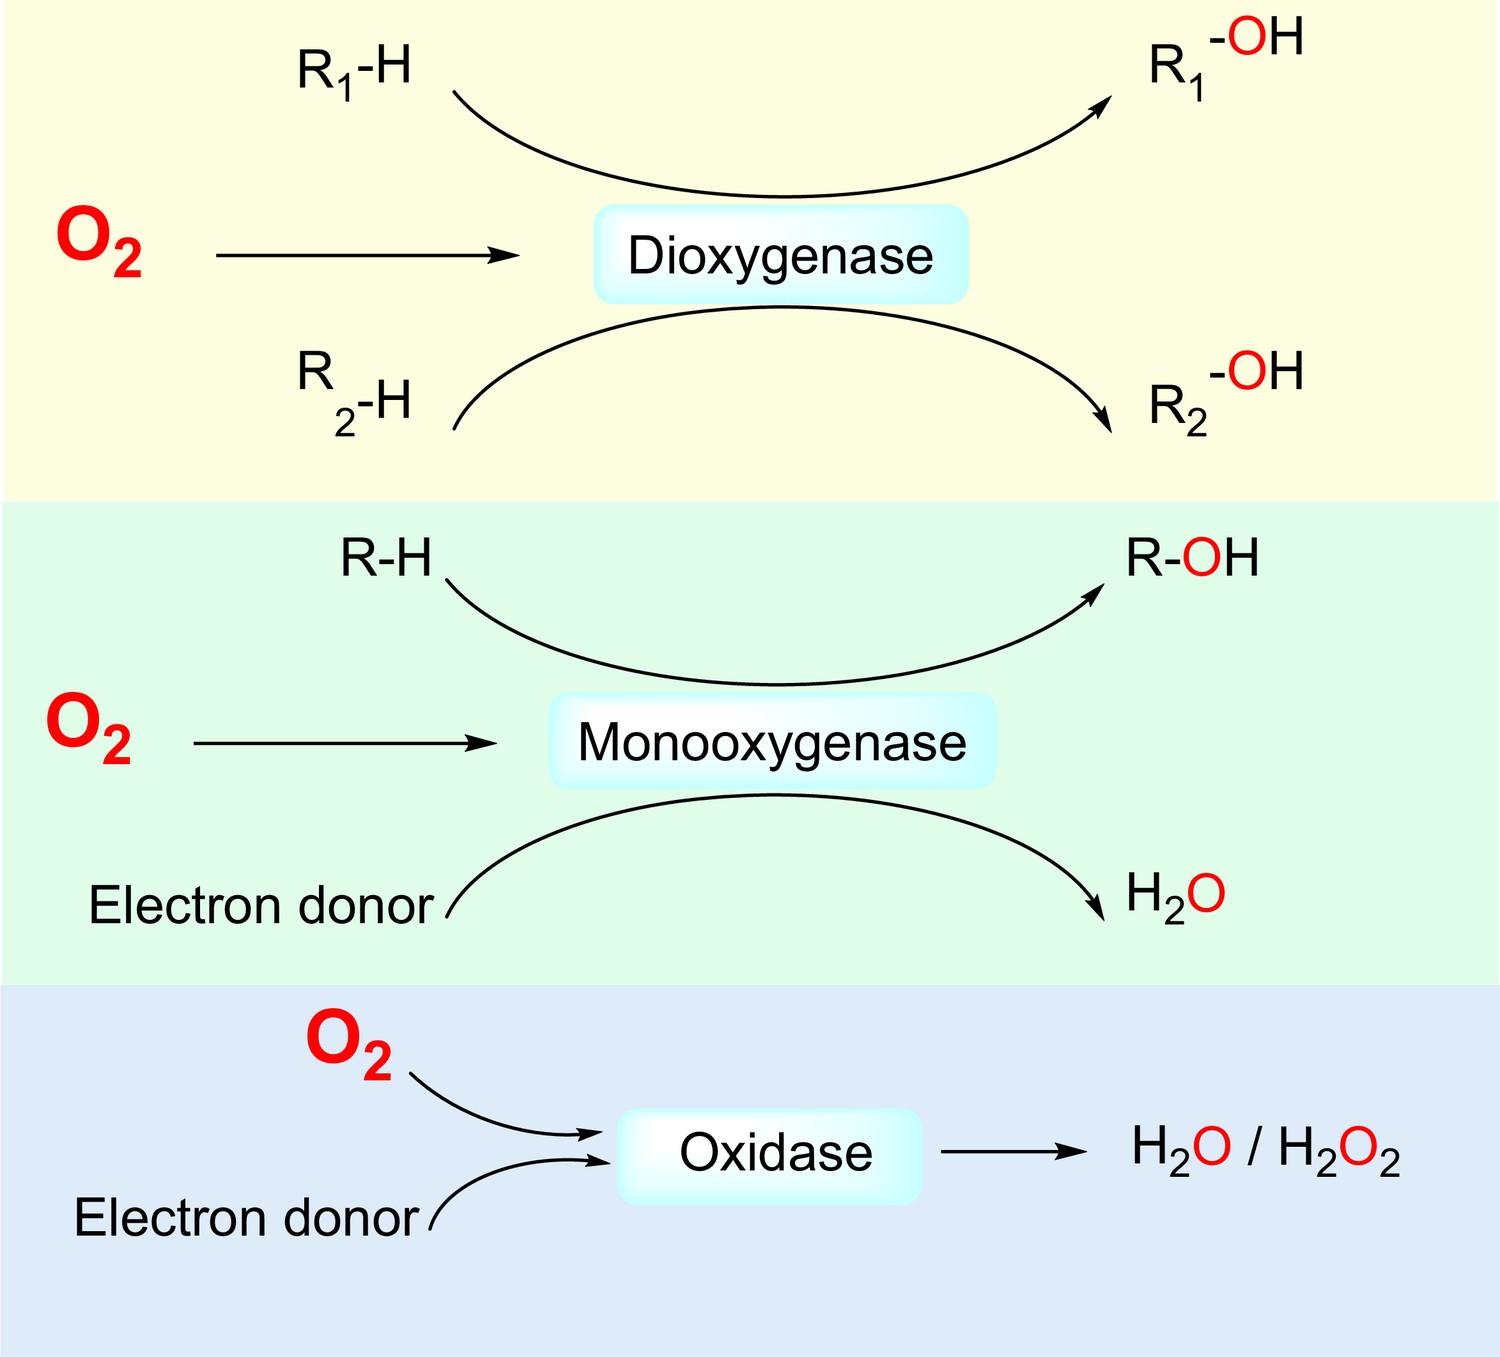
Three classes of by O2-dependent enzymes (dioxygenases, monooxygenases, and oxidases) and the reactions they catalyze.
Dioxygenases catalyze the insertion of both oxygen atoms of the dioxygen molecule into substrates. Monooxygenases catalyze the insertion of one oxygen atom of the dioxygen molecule into a substrate and the other oxygen atom is reduced to H2O. Oxidases catalyze the reduction of dioxygen to H2O or H2O2.
Figure 2
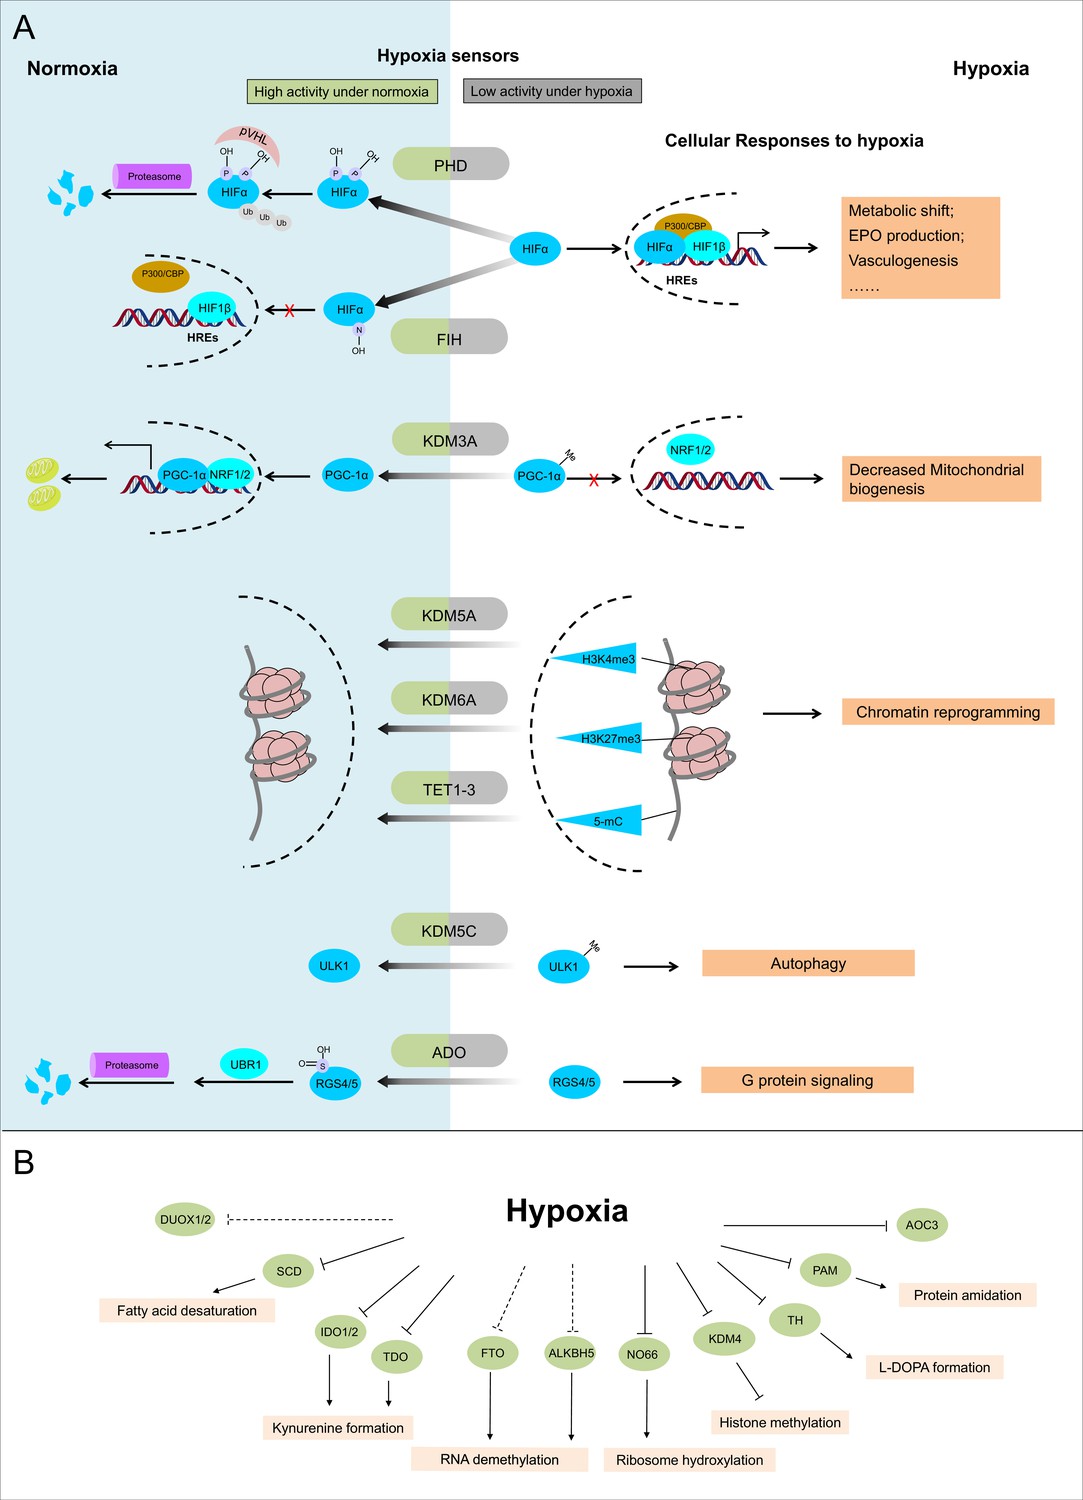
Known and candidate sensors for hypoxia inside O2-dependent enzymes.
(A) Known hypoxia sensors and their corresponding cellular responses to hypoxia. Decreased O2 concentration inhibits activities of hypoxia sensors in O2-dependent enzyme category and results in changes downstream signaling pathway as the cellular response to hypoxia. PHD catalyzes the hydroxylation at two prolyl residues of HIFα, and then the hydroxylated HIFα is recognized and ubiquitylated by pVHL. Following ubiquitilation, HIFα is degraded by proteasome. During hypoxia, activity of PHD is diminished and HIFα is stabilized. Accumulated HIFα translocates to the nucleus, and in dimerization with HIF1β, recruits other transcriptional coactivators (p300, CBP), binds with the hypoxia response elements (HREs) and activates the transcription of HIF target genes. The products of these genes participate in adaptation to hypoxia including metabolic shift, EPO production, vasculogenesis, etc. FIH catalyzes the asparaginyl hydroxylation of HIFα, and this hydroxylation inhibits HIFα from recruiting transcriptional coactivators. Compared with PHD, FIH is inhibited by more severe hypoxia. KDM3A catalyzes the demethylation of K244 monomethylation of PGC-1α, which is a transcriptional coactivator and regulates mitochondrial biogenesis. Under normoxia, PGC-1α binds with transcriptional factor NRF1/2 and activates the transcription of nucleus-encoded mitochondrial genes. Under hypoxia, the inhibited activity of KDM3A leads to accumulation of K224 monomethylation at PGC-1α. The maintained monomethylation at K224 of PGC-1α reduces its binding ability with NRF1/2 and results in decreased mitochondrial biogenesis. KDM5A catalyzes the demethylation at Lys4 of histone H3 (H3K4). Hypoxia inhibits its activity and results in the hypermethylation at H3K4, which is responsible for the gene activation. Similarly, hypoxia also inhibits KDM6A, and results in the hypermethylation at its target site H3K27 and gene repression. TET methylcytosine dioxygenases (TET1, TET2, and TET3) catalyze conversion of DNA 5-methylcytosine (5-mC) to the 5-hydroxymethylcytosine (5hmC) and mediates DNA demethylation. Hypoxia reduces TET activity and causes DNA hypermethylation. Together, these proteins sense hypoxia and lead to transcription alteration by chromatin reprogramming. KDM5C catalyzes the demethylation of ULK1 R170me2s, which regulates ULK1 activity. Under normoxia, R170me2s of ULK1 is removed by KDM5C and ULK1 remains inactive. Under hypoxia, the inhibited activity of KDM5C leads to accumulation of ULK1 R170me2s, and results in ULK1 activation and autophagy induction. ADO catalyzes the thiol oxidation at the N terminal Cys of a protein, which then triggers its degradation through N-degron pathway. Hypoxia inhibits the activity of ADO and leads to the stabilization of its substrates. One of the identified ADO substrates is RSG4/5, regulators of the G protein signaling. Stabilization of RGS4/5 results in the modulation of G-protein-coupled calcium ion signaling. (B) Candidate O2 sensors with reduced enzymatic activities in hypoxia. Hypoxia leads to: inhibition of KDM4A and KDM4B and accumulated hypermethylation at H3K9; inhibition of SCD and increased cellular fatty acid saturation; inhibition of IDO and changes of immunoregulation; inhibition of PAM and reduced protein amidation; in vitro inhibition of RIOX1 and RIOX2 which are responsible for ribosome hydroxylation; in vitro inhibition of AOC3; RNA hypermethylation possibly through inhibition of FTO/ALKBH5; potential inhibition of DUOX1 and DUOX2. PHD: prolyl hydroxylase domain-containing protein; HIF: hypoxia-inducible factor; pVHL: von Hippel-Lindau protein E3 ligase; CBP, cyclic-AMP response element binding protein binding protein; EPO: erythropoietin; FIH: factor inhibiting HIF1; KDM: JmjC (Jumonji C) domain lysine demethylase; PGC: peroxisome proliferator-activated receptor gamma coactivator; NRF: nuclear respiratory factor; TET: ten-eleven translocation methylcytosine dioxygenases; ADO: cysteamine (2-aminoethanethiol) dioxygenase; RGS: regulators of G protein signalling; SCD: stearoyl-CoA desaturases; IDO: indoleamine 2,3-dioxygenase; AOC: amine oxidase, copper containing; PAM: peptidylglycine α-amidating monooxygenase; RIOX: ribosomal oxygenase, FTO: fat mass and obesity-associated protein; ALKBH: AlkB homolog; DUOX: dual oxidase.
Figure 3 with 3 supplements
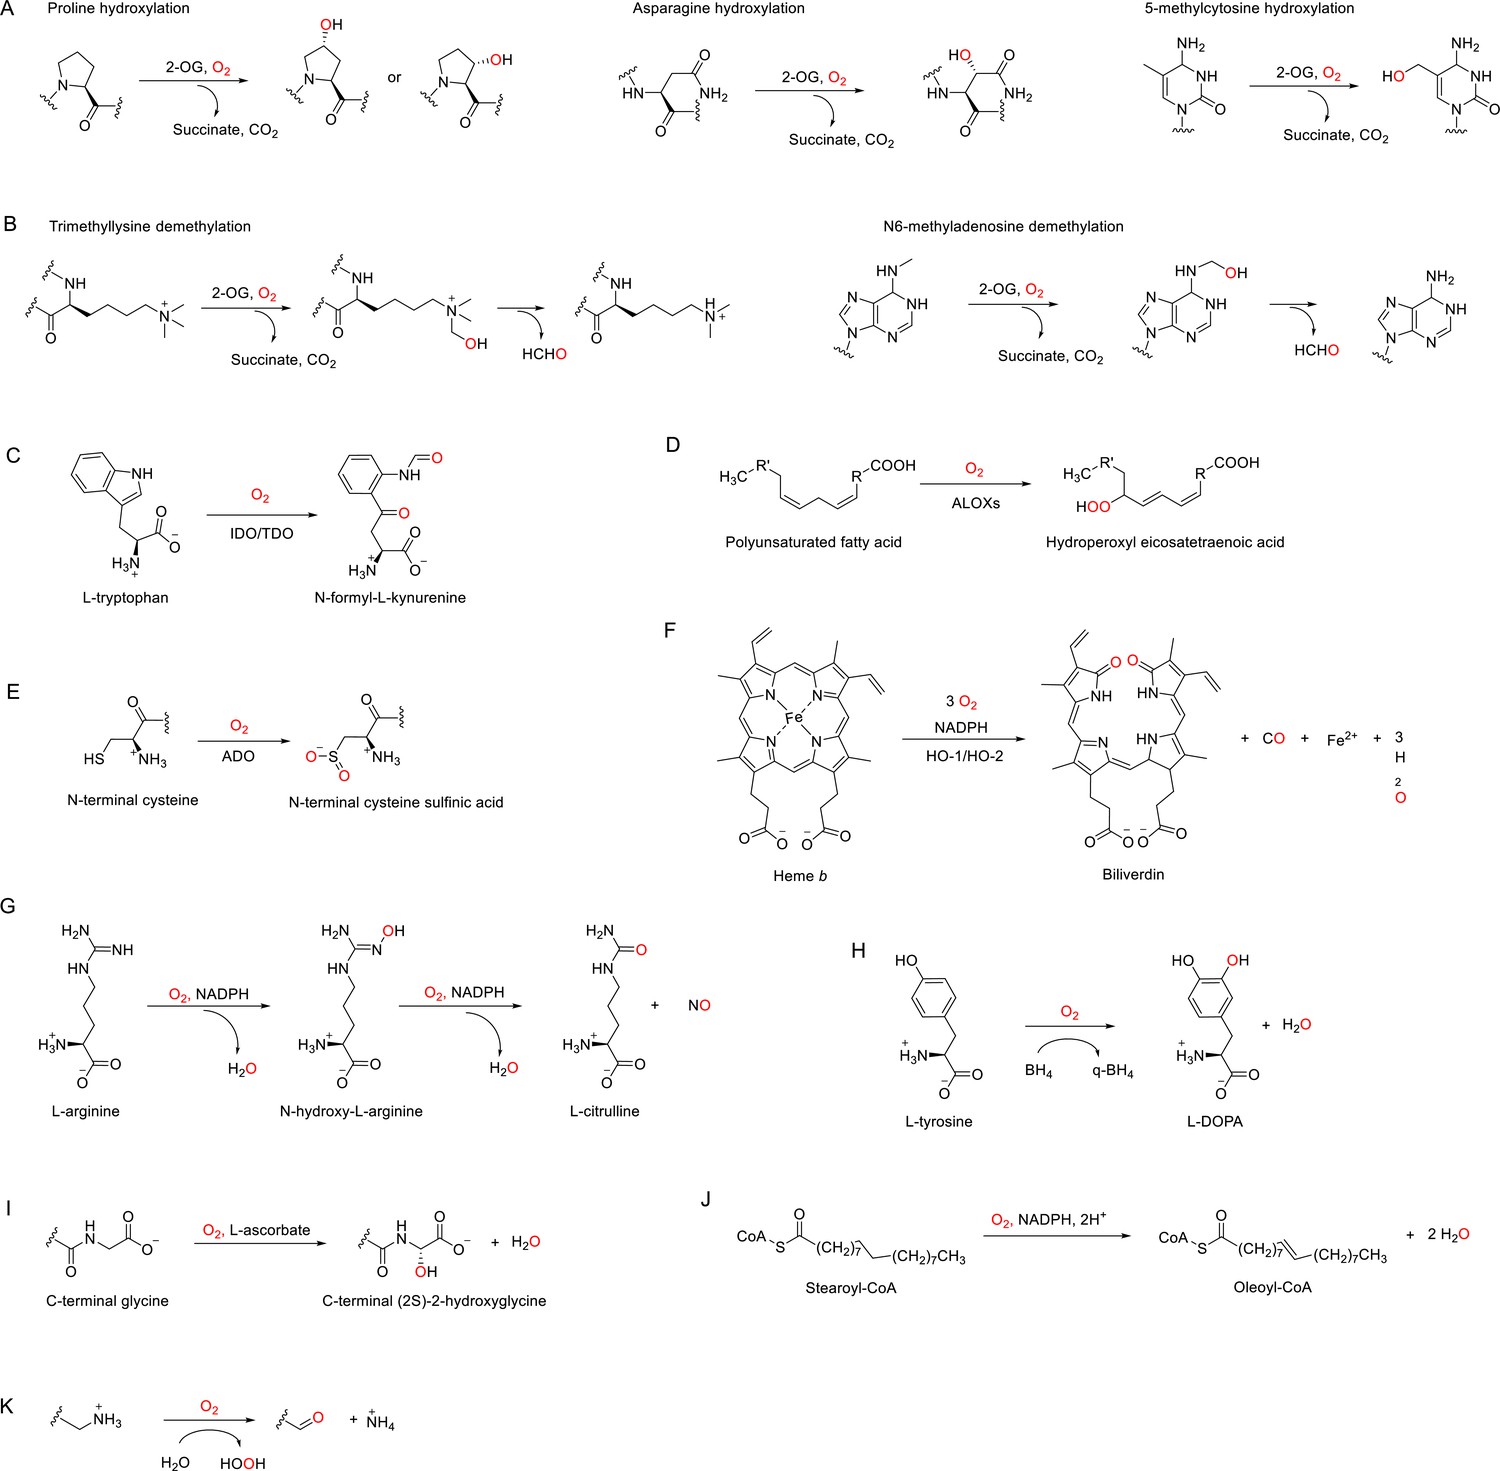
Enzymatic reactions catalyzed by discussed O2-dependent enzymes.
(A) Examples of hydroxylation reactions catalyzed by 2-OG-dependent dioxygenases. (B) Examples of demethylation reactions catalyzed by 2-OG-dependent dioxygenases. (C–K) Reactions catalyzed by indoleamine 2,3-dioxygenase (IDO)/tryptophan 2,3-dioxygenase (TDO) (C), arachidonate lipoxygenases (ALOXs) (D), (2-aminoethanethiol) dioxygenase (ADO) (E), heme oxygenases (HOs) (F), nitric oxide synthases (NOSs) (G), tyrosine 3-hydroxylase (TH) (H), peptidylglycine α-amidating monooxygenase (PAM) (I), stearoyl-CoA desaturase 1 (SCD1), (J) and copper amine oxidases (CAOs) (K).
Figure 3—figure supplement 1
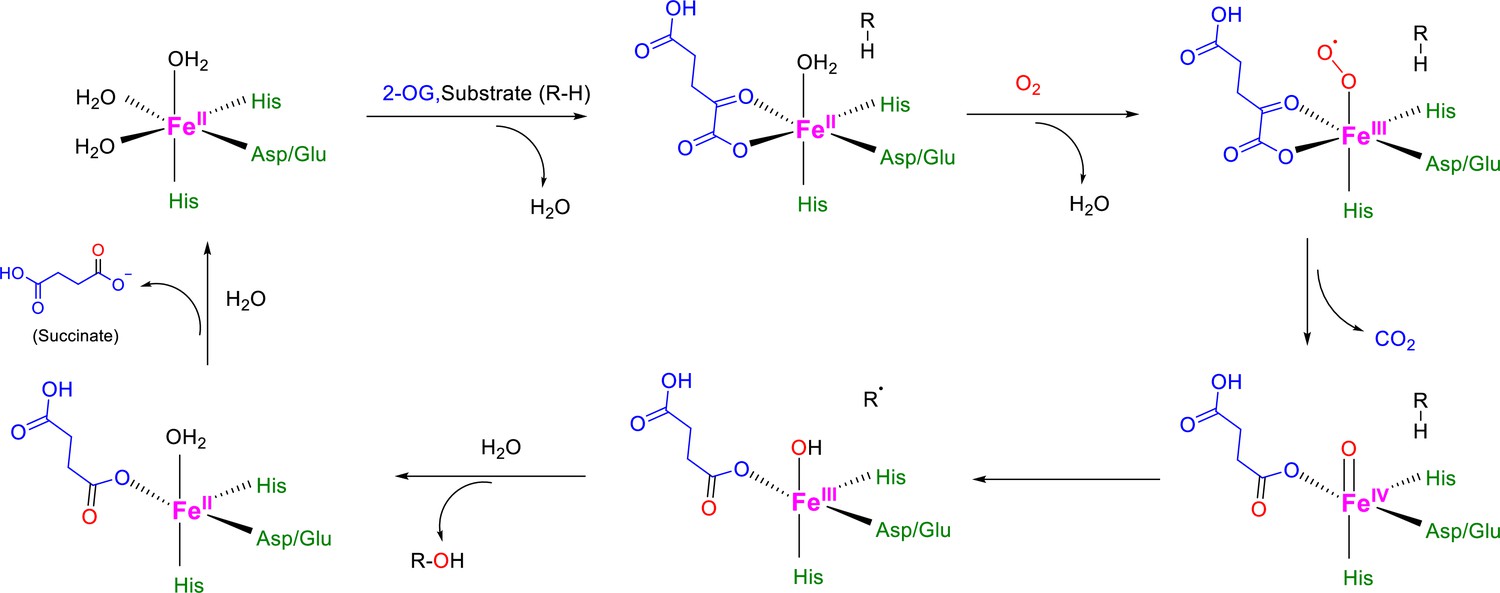
Catalytic mechanism for 2-OG-dependent dioxygenases.
2-OG-dependent dioxygenases share consensus mechanisms for the catalyzed hydroxylation (Islam et al., 2018; Fletcher and Coleman, 2020; Rose et al., 2011): the Fe(II) at the catalytic center is initially coordinated by 2 His side chains and a carboxylate from Glu or Asp, plus three additional H2O molecules to complete the octahedral coordination geometry. Then, bidentate coordination of 2-OG to Fe(II) replaces 2 H2O molecules, and the third Fe(II)-bound H2O molecule leaves after the binding of the primary substrate into the active site, making a vacant coordination site for O2. After the binding and activation of O2 at the Fe(II) center, one of the O2 atoms inserts into the primary substrate for hydroxylation, while the other O2 atom facilitates the oxidative decarboxylation of 2-OG, forming succinate and CO2 as co-products.
Figure 3—figure supplement 2

O2-binding sites for dioxygenases using heme.
The heme Fe(II) is coordinated by the four N atoms from the porphyrin and one N atom from one histidyl residue in the catalytic pocket, leaving the vacant coordination site for O2 binding and activation (Singleton et al., 2014).
Figure 3—figure supplement 3
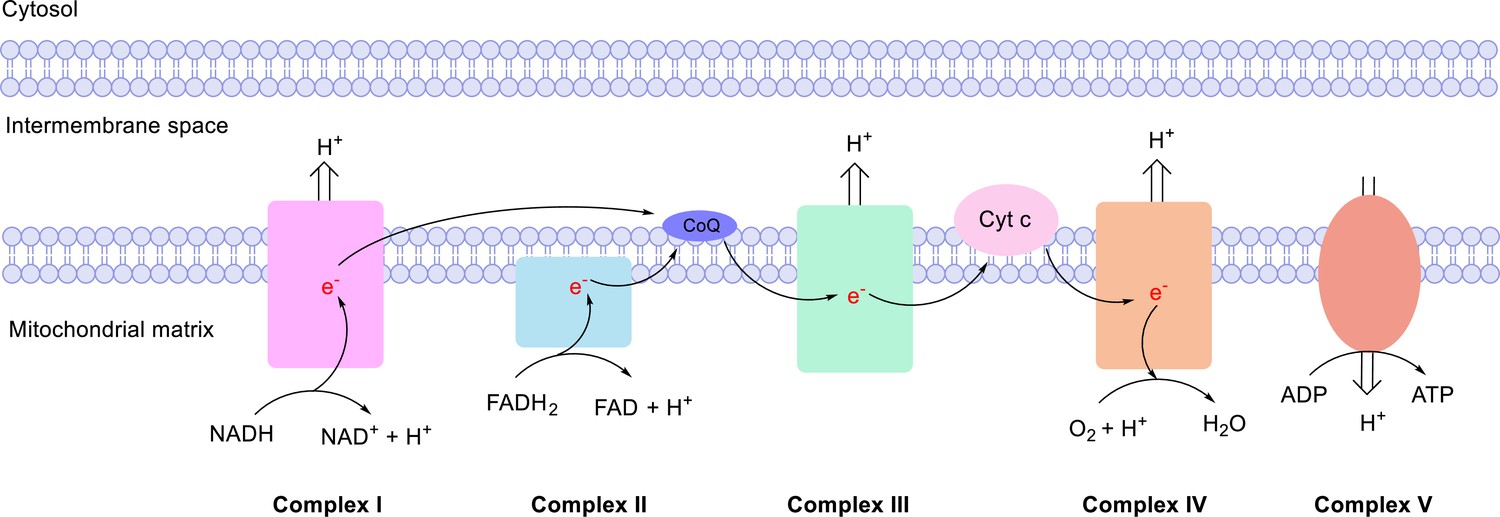
Mitochondrial electron transport chain (ETC).
The ETC consists of NADH ubiquinone oxireductase (Complex I), succinate dehydrogenase (Complex II), CoQH2-cytochrome c reductase (Complex III), and cytochrome c oxidase (Complex IV). In the ETC, electrons are transported from the NADH or FADH2 to ubiquinone at Complex I or II, then to cytochrome c at Complex III, and finally to O2 at Complex IV. This process is coupled with ATP generation at ATP synthase (Complex V) to form the oxidative phosphorylation (OxPhos) process, which is the major source of energy production.
Tables
Table 1
Physiological O2 distribution in different organs/tissues*.
| Organ/tissue | %O2 | pO2 (mmHg) | Concentration(μM) |
|---|---|---|---|
| Ambient air | 21 | 160 | 206 |
| Alveoli | 14 | 104 | 134 |
| Arterial blood | 13 | 100 | 129 |
| Kidney | 4–9.5 | 30–73 | 39–94 |
| Liver | 4–7 | 30–54 | 39–69 |
| Heart | 2–6 | 15–46 | 19–59 |
| Brain | 3–5 | 23–39 | 29–50 |
| Small intestine | 2–9 | 15–69 | 19–89 |
| Large intestine | 0–6 | 0–46 | 0–59 |
| Bone marrow | 1.5–7 | 11–54 | 14–69 |
-
*
The O2 levels in different organs are adjusted from references Burmester and Hankeln, 2014; Lecomte et al., 2005; Hatefi, 1985; Zaccara et al., 2019; Ball et al., 2014 and the partial pressure and concentration are calculated according to references Ortiz-Prado et al., 2019; Carreau et al., 2011; Jagannathan et al., 2016; Cigognini et al., 2016; Donovan et al., 2010; Mas-Bargues et al., 2019; Place et al., 2017.
Table 2
Categories of O2-dependent enzymes.
| Category | Subcategory by catalytic center | Metal species at catalytic center | Ligands for the metal species at catalytic center (cofactor/substrate and enzyme residues) | Number of enzymes |
|---|---|---|---|---|
| Dioxygenase | 2-OG-dependent dioxygenase | Fe | 2-OG, His, His, Asp/Glu | 59 |
| Heme-dependent dioxygenase | Fe | Heme, His | 5 | |
| Lipoxygenase | Fe | His, His, His, Ile, His/Asa/Asn/none | 6 | |
| Others | Fe | His, His, His/Asp/Glu* | 10 | |
| Monooxygenase | Heme-dependent monooxygenase | Fe | Heme, Cys/His/Glu | 61 |
| Non-Heme Fe-dependent monooxygenase | Fe | His, His, His/Asp/Glu* | 9 | |
| Cu-dependent monooxygenase | Cu | His, His, Met | 5 | |
| Flavin-dependent monooxygenase | None (uses flavin) | N/A | 12 | |
| Others† | N/A | N/A | 2 | |
| Oxidase | Heme-copper | Fe and Cu | His, His, His for Cu; Heme and His for Fe | 1 |
| Fe-dependent oxidase | Fe | Varies | 14 | |
| Cu-dependent oxidase | Cu | Varies | 7 | |
| Flavin-dependent oxidase | None (uses flavin) | N/A | 25 | |
| Others† | N/A | N/A | 5 |
-
*
Substrates/cofactor ligands for this category varies for each member depending on the reaction it catalyzes.
-
†
Members in this category are not fully studied.
Table 3
Direct HIF modulator in 2-OG-dependent dioxygenases.
| Gene symbol | Protein name | Type of reaction | Hydroxylation sites in HIFα | Non-HIF substrate examples |
|---|---|---|---|---|
| EGLN1 | PHD2 | Prolyl hydroxylation | HIF1α Pro402, Pro564; HIF2α Pro405, Pro531; HIF3α Pro492 | FLNA, Akt |
| EGLN2 | PHD1 | Prolyl hydroxylation | HIF1α Pro402, Pro564; HIF2α Pro405, Pro531; HIF3α Pro492 | FOXO3, Cep192, TP53 |
| EGLN3 | PHD3 | Prolyl hydroxylation | HIF1α Pro564; HIF2α Pro405, Pro531; HIF3α Pro492 | ATF-4, ADRB2, TP53 |
| HIF1AN | FIH1 | Asparaginyl hydroxylation | HIF1α Asn803, HIF2α Asn847 | IκBα, Notch, OTUB1, RIPK4 |
Table 4
Reported Km values of O2-dependent enzymes.
Km values vary based on the assay method and tested substrate. Some enzymes have multiple Km values listed, reflecting measurements from different studies.
| Category | Enzyme* | Km for O2 | Assay details | Reference |
|---|---|---|---|---|
| Dioxygenase | 250 μM | In vitro radioactivity 2-OG turnover assay with HIF1α (556–574) peptide as substrate | Hirsilä et al., 2003 | |
| 1746 μM | In vitro time-resolved fluorescence resonance energy transfer assay with P564-HIF1α peptide (DLEMLAPYIPMDDDFQL) as substrate | Dao et al., 2009 | ||
| 67 μM | In vitro O2 consumption assay with HIF1α (502–697) peptide as substrate | Ehrismann et al., 2007 | ||
| 81 μM | In vitro O2 consumption assay with HIF1α (530–698) peptide as substrate | Ehrismann et al., 2007 | ||
| 230 μM | In vitro radioactivity 2-OG turnover assay with HIF1α (556–574) peptide as substrate | Hirsilä et al., 2003 | ||
| PHD3 | 230 μM | In vitro radioactivity 2-OG turnover assay with HIF1α (556–574) peptide as substrate | Hirsilä et al., 2003 | |
| KDM4E | 197 μM | In vitro O2 consumption assay with ARK(me3)STGGK peptide as substrate | Cascella and Mirica, 2012 | |
| 173 μM | In vitro MALDI-TOF-MS assay with H31−15K9me3 peptide as substrate | Hancock et al., 2017 | ||
| 57 μM | In vitro O2 consumption assay with ARK(me3)STGGK peptide substrate | Cascella and Mirica, 2012 | ||
| 60 μM | In vitro radioactivity 2-OG turnover assay with histone H3(1–19)K9me3 as substrate | Chakraborty et al., 2019 | ||
| KDM6A | 180 μM | In vitro radioactivity 2-OG turnover assay with histone H3(21–44)K27(me3) as substrate | Chakraborty et al., 2019 | |
| KDM4C | 158 μM | In vitro O2 consumption assay with ARK(me3)STGGK peptide substrate | Cascella and Mirica, 2012 | |
| KDM4B | 150 μM | In vitro radioactivity 2-OG turnover assay with histone H3(1–19)K9me3 as substrate | Chakraborty et al., 2019 | |
| 90 μM | In vitro radioactivity 2-OG turnover assay with HIF1α (788–822) peptide as substrate | Koivunen et al., 2004 | ||
| 90 μM | In vitro radioactivity 2-OG turnover assay with histone H3(1–21)K4me3 as substrate | Chakraborty et al., 2019 | ||
| KDM3A | 75 μM (7.6% O2) † | In vitro demethylation-formaldehyde dehydrogenase-coupled reaction assay with K224-monomethylated PGC-1α peptide as substrate | Qian et al., 2019 | |
| KDM5B | 40 μM | In vitro radioactivity 2-OG turnover assay with histone H3(1–21)K4me3 as substrate | Chakraborty et al., 2019 | |
| P4HA1 | 40 μM | Standard P4H activity assay with (Pro-Pro-Gly)10 (Peptide Institute) as a substrate | Hirsilä et al., 2003 | |
| KDM5C | 35 μM | In vitro radioactivity 2-OG turnover assay with histone H3(1–21)K4me3 as substrate | Chakraborty et al., 2019 | |
| TET1 | 30 μM | In vitro radioactivity 2-OG turnover assay with oligonucleotides containing a 5-mC as substrate | Laukka et al., 2016 | |
| 3.0 μM (0.31% O2) † | In vitro DNA hydroxymethylation assay with genomic DNA as substrate | Thienpont et al., 2016 | ||
| TET2 | 30 μM | In vitro radioactivity 2-OG turnover assay with oligonucleotides containing a 5-mC as substrate | Laukka et al., 2016 | |
| 5.2 μM (0.53% O2) * | In vitro DNA hydroxymethylation assay with genomic DNA as substrate | Thienpont et al., 2016 | ||
| KDM5D | 25 μM | In vitro radioactivity 2-OG turnover assay with histone H3(1–21)K4me3 as substrate | Chakraborty et al., 2019 | |
| KDM6B | 20 μM | In vitro radioactivity 2-OG turnover assay with histone H3(21–44)K27(me3) as substrate | Chakraborty et al., 2019 | |
| IDO1 | 11.5–24 μM | In vitro O2 consumption assay with L-Trp as substrate | Kolawole et al., 2015 | |
| PTGS1 | 10 μM (sheep) | In vitro radioactivity label assay with [1-14C]arachidonic acid as substrate | Juránek et al., 1999 | |
| PTGS2 | 13 μM (mouse) | In vitro radioactivity label assay with [1-14C]arachidonic acid as substrate | Juránek et al., 1999 | |
| ALOX5 | 13 μM (porcine) | In vitro radioactivity label assay with [1-14C]arachidonic acid as substrate | Juránek et al., 1999 | |
| ALOX12 | 13 μM | In vitro radioactivity label assay with [1-14C]arachidonic acid as substrate | Juránek et al., 1999 | |
| ALOX15 | 26 μM (porcrine) | In vitro radioactivity label assay with [1-14C]arachidonic acid as substrate | Juránek et al., 1999 | |
| ALOX15 | 26 μM (rabbit) | In vitro radioactivity label assay with [1-14C]arachidonic acid as substrate | Juránek et al., 1999 | |
| ADO | >500 μM | In vitro UPLC-MS-TOF assay with RGS4(2–15) peptide as substrate | Masson et al., 2019 | |
| Monooxygenase | 350 μM (rat) | In vitro heme-NO complex formation assay with L-arginine as substrate | Abu-Soud et al., 1996 | |
| 130 μM (mouse) | In vitro heme-NO complex formation assay with L-arginine as substrate | Abu-Soud et al., 2001 | ||
| NOS3 (eNOS) | 4 μM (bovine) | In vitro heme-NO complex formation assay with L-arginine as substrate | Abu-Soud et al., 2000 | |
| 25 μM (bovine) | In vitro heme-NO complex formation assay with N-hydroxy-L-arginine as substrate | Abu-Soud et al., 2000 | ||
| TH | 16.2 μM (low-activity state); 46.1 μM (high- activity state); | In vitro radioactivity label assay with 3H-tyrosine as substrate | Rostrup et al., 2008 | |
| 12.6–26.7 μM (low-activity state); 28.8–42.9 μM (high-activity state)‡; | In vitro oxygraphic assay with tyrosine as substrate | Rostrup et al., 2008 | ||
| 2.6–3.9 μM (2–3 mmHg, rat) * | In vitro radioactivity label assay with 3H-tyrosine as substrate | Katz, 1980 | ||
| TPH1 | 3.9~12.9 μM (3–10 mmHg, rat) † | In vitro radioactivity label assay with 3H-tryptophan as substrate | Katz, 1980 | |
| PAH | 17 μM | In vitro oxygraphic assay with phenylalanine as substrate | Rostrup et al., 2008 | |
| PAM | 70 μM (rat) | In vitro radioactivity label assay with [α-2H2]-N-acylglycine of different chain length as substrates | McIntyre et al., 2010 | |
| Oxidase | Cytochrome c oxidase | <0.1 μM (rat) | In vitro O2 consumption assay measuring O2 consumption of purified rat mitochondria at low phosphate potential ([ATP]/[ADP]*[Pi]) | Bienfait et al., 1975 |
| 1–3 μM (rat) | In vitro O2 consumption assay measuring O2 consumption of purified rat mitochondria at high phosphate potential | Bienfait et al., 1975 | ||
| 0.5 μM (mouse) | Cellular assay measuring the ‘apparent K (m)’ for O2 or p 50 of respiration in 32D cells using high-resolution respirometry | Scandurra and Gnaiger, 2010 | ||
| AOC3 | 38 μM | In vitro enzymatic assay using purified human AOC3 | Shen et al., 2012 |
-
*
O2-dependent enzymes that are known sensors are highlighted in bold; that are reported to be inhibited under hypoxia are highlighted in a light orange background; that are reported to be associated with positive selections in high-altitude populations are highlighted in red (also see Table 6).
-
†
Km of these enzyme were reported with units as % O2 or mmHg, and calculated according to Mas-Bargues et al., 2019; Place et al., 2017.
-
‡
Combined data for TH1/3/4 splicing isoforms.
Table 5
JmjC domain-containing histone demethylases and their substrates*.
(A = activating transcription, S = silencing transcription).
| KDM class | Members (gene symbol) | Histone lysyl residue substrates | Other substrates |
|---|---|---|---|
| KDM2 | KDM2A | H3K36me1/me2 (A) | p65, NF-κB |
| KDM2B | H3K36me1/me2 (A), H3K4me3 (A) | ||
| KDM3 | KDM3A | H3K9me1/me2 (S) | PGC-1α K224me |
| KDM3B | H3K9me1/me2 (S) | ||
| JJMJD1C | H3K9me1/me2 (S) | ||
| KDM4 | KDM4A | H3K9me2/me3 (S), H3K36me2 (A), H1.4K26me2/me3 | WIZ, CDYL1, CSB, and G9a |
| KDM4B | H3K9me2/me3 (S), H3K36me2 (A), H1.4K26me2/me3 | WIZ, CDYL1, CSB, and G9a | |
| KDM4C | H3K9me2/me3 (S), H3K36me2 (A), H1.4K26me2/me3 | WIZ, CDYL1, CSB, and G9a | |
| KDM4D | H3K9me2/me3 (S) | ||
| KDM4E | H3K9me3 (S) | H3R2me2/me1, H3R8me2/me1, H3R26me2/me1, H4R3me2 | |
| KDM5 | KDM5A | H3K4me2/me3 (A) | |
| KDM5B | H3K4me2/me3 (A) | ||
| KDM5C | H3K4me2/me3 (A) | H3R2me2/me1, H3R8me2, H4R3me2a, ULK1R170me2a | |
| KDM5D | H3K4me2/me3 (A) | ||
| KDM6 | KDM6A | H3K27me2/me3 (S) | |
| KDM6B | H3K27me2/me3 (S) | ||
| KDM6C | |||
| KDM7 | KDM7A | H3K9me1/me2 (S), H3K27me1/me2 (S) | |
| PHF8 | H3K27me1/me2 (S), H4K20me1 | ||
| PHF2 | H3K9me2/me3 (S) | ||
| Jmjc domain only | NO66 | H3K4me2/me3 (A), H3K36me2/me3 (A) | Rpl8 |
| MINA53 | H3K9me3 (S) | Rpl27a | |
| KDM8 | H3K36me2 (A) | NFATc1 | |
| JMJD6 | H3R2me2,H4R3me2/me1, U2AF2/U2AF65, LUC7L2 |
-
*
Known hydroxylation/demethylation sites are indicated.
Table 6
O2-dependent enzymes encoded by genes associated with positive selection in different high-altitude populations.
-
*
Known hypoxia sensors are highlighted in red.
Additional files
-
Supplementary file 1
Detailed information of 221 oxygen-dependent enzymes in human.
- https://cdn.elifesciences.org/articles/87705/elife-87705-supp1-v1.xlsx
Download links
A two-part list of links to download the article, or parts of the article, in various formats.
Downloads (link to download the article as PDF)
Open citations (links to open the citations from this article in various online reference manager services)
Cite this article (links to download the citations from this article in formats compatible with various reference manager tools)
Searching for molecular hypoxia sensors among oxygen-dependent enzymes
eLife 12:e87705.
https://doi.org/10.7554/eLife.87705


