A computationally informed comparison between the strategies of rodents and humans in visual object recognition
- Department of Brain and Cognition & Leuven Brain Institute, Belgium
- Department of Neurobiology, Harvard Medical School, United States
Figures
Figure 1 with 3 supplements
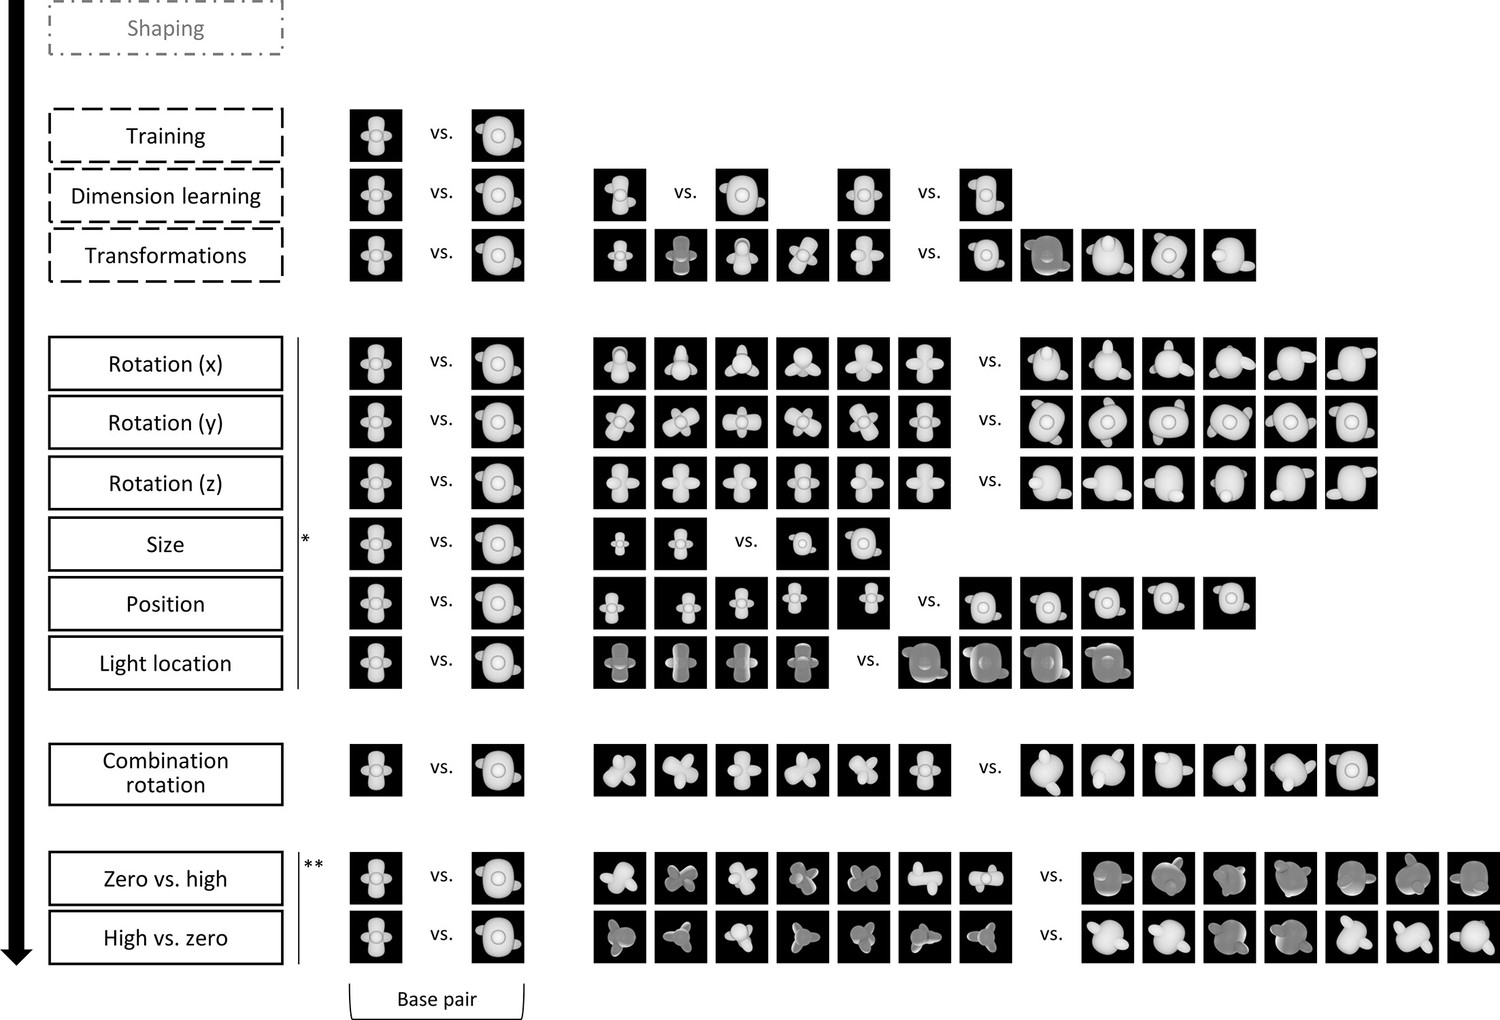
The design of the animal study, including the stimuli.
Animals started with a standardized shaping procedure, followed by three training protocols, as indicated by the dashed outline. In these protocols, animals received real reward, that is, reward for touching the target. The target corresponds to the concave object in all training protocols. The rats received correction trials for incorrect answers, that is, touching the convex object. After the three training protocols, the animals went through a number of testing protocols. The order of the first six protocols (*) and the last two testing protocols (**) was counterbalanced between the animals. During testing protocols, animals received one-third old trials and two-third new trials. In the new trials, they received random reward in 80% of the trials, whereas in the old trials, they received real reward and correction trials if necessary. Again, the target in the testing protocols correspond to the concave objects, whereas the distractors correspond to the convex objects.
Figure 1—figure supplement 1
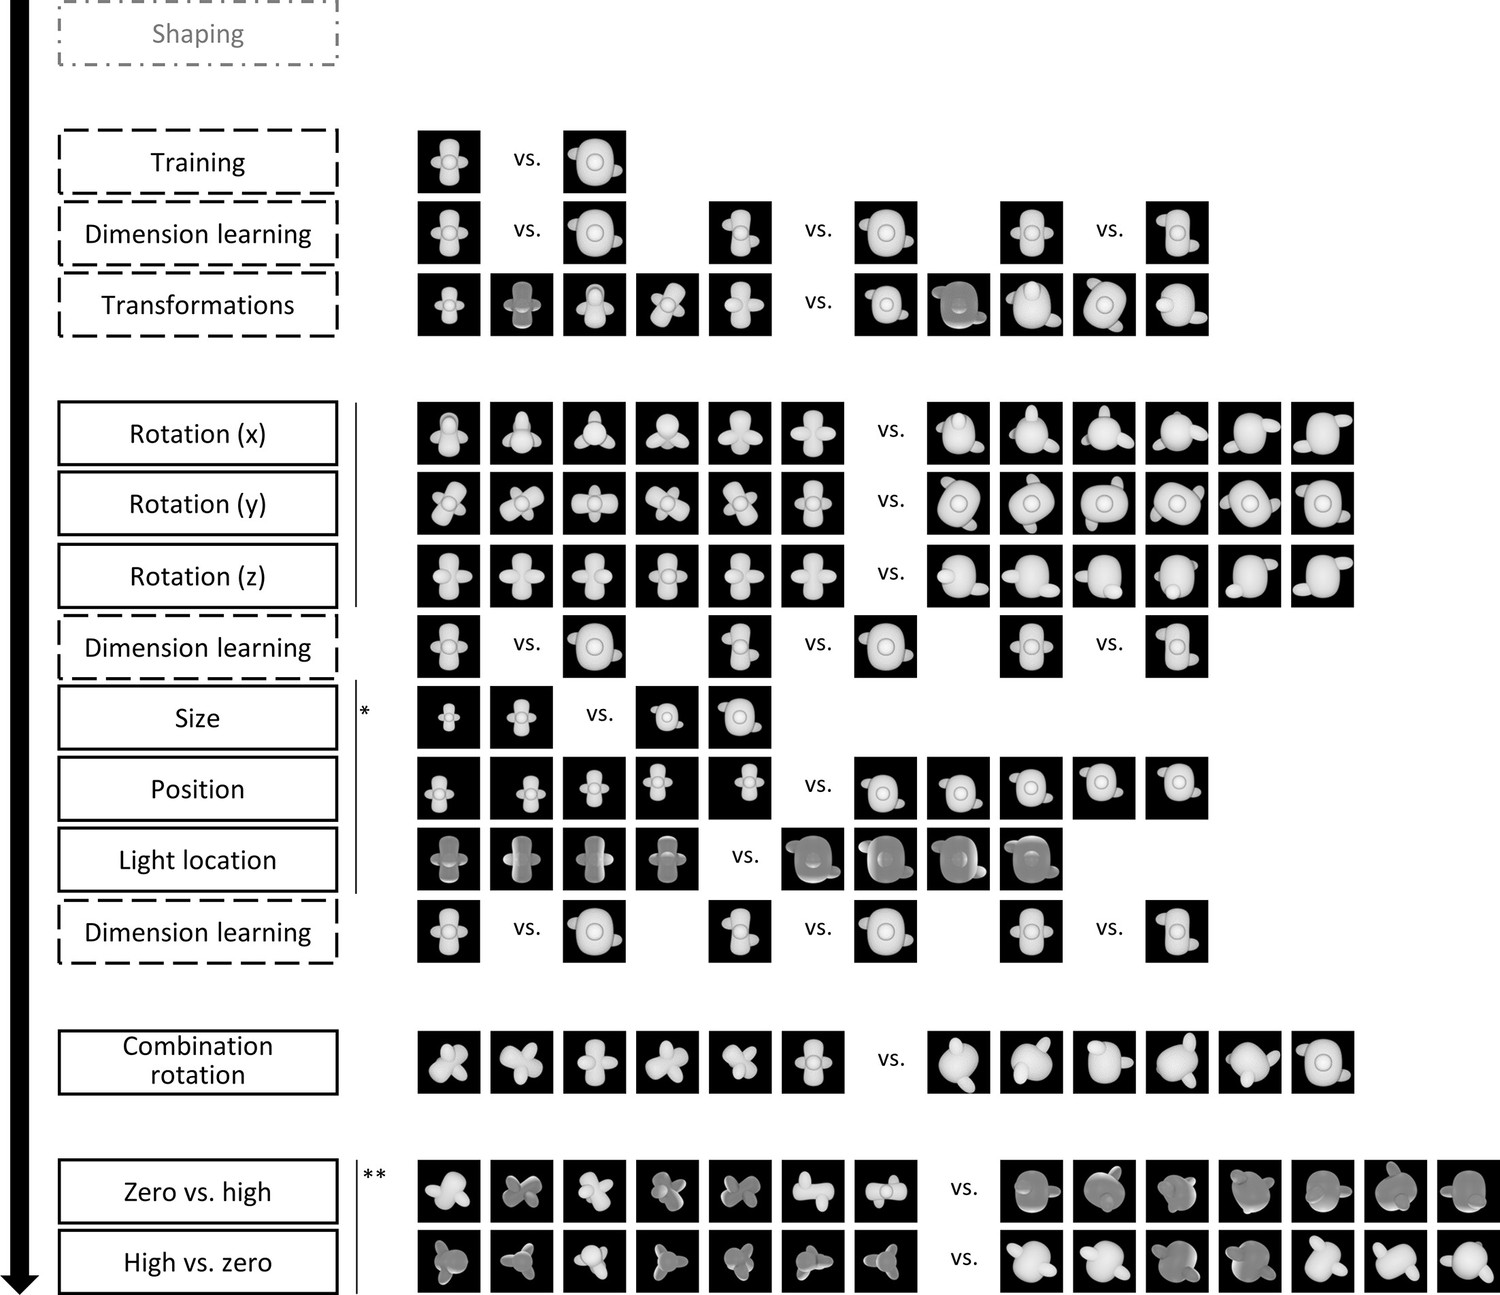
Design of the online human study.
The design of the human study resembles the design of the animal study, with minor adaptations. We removed the one-third old trials in the test protocols but included two additional dimension learning protocols.
Figure 1—figure supplement 2
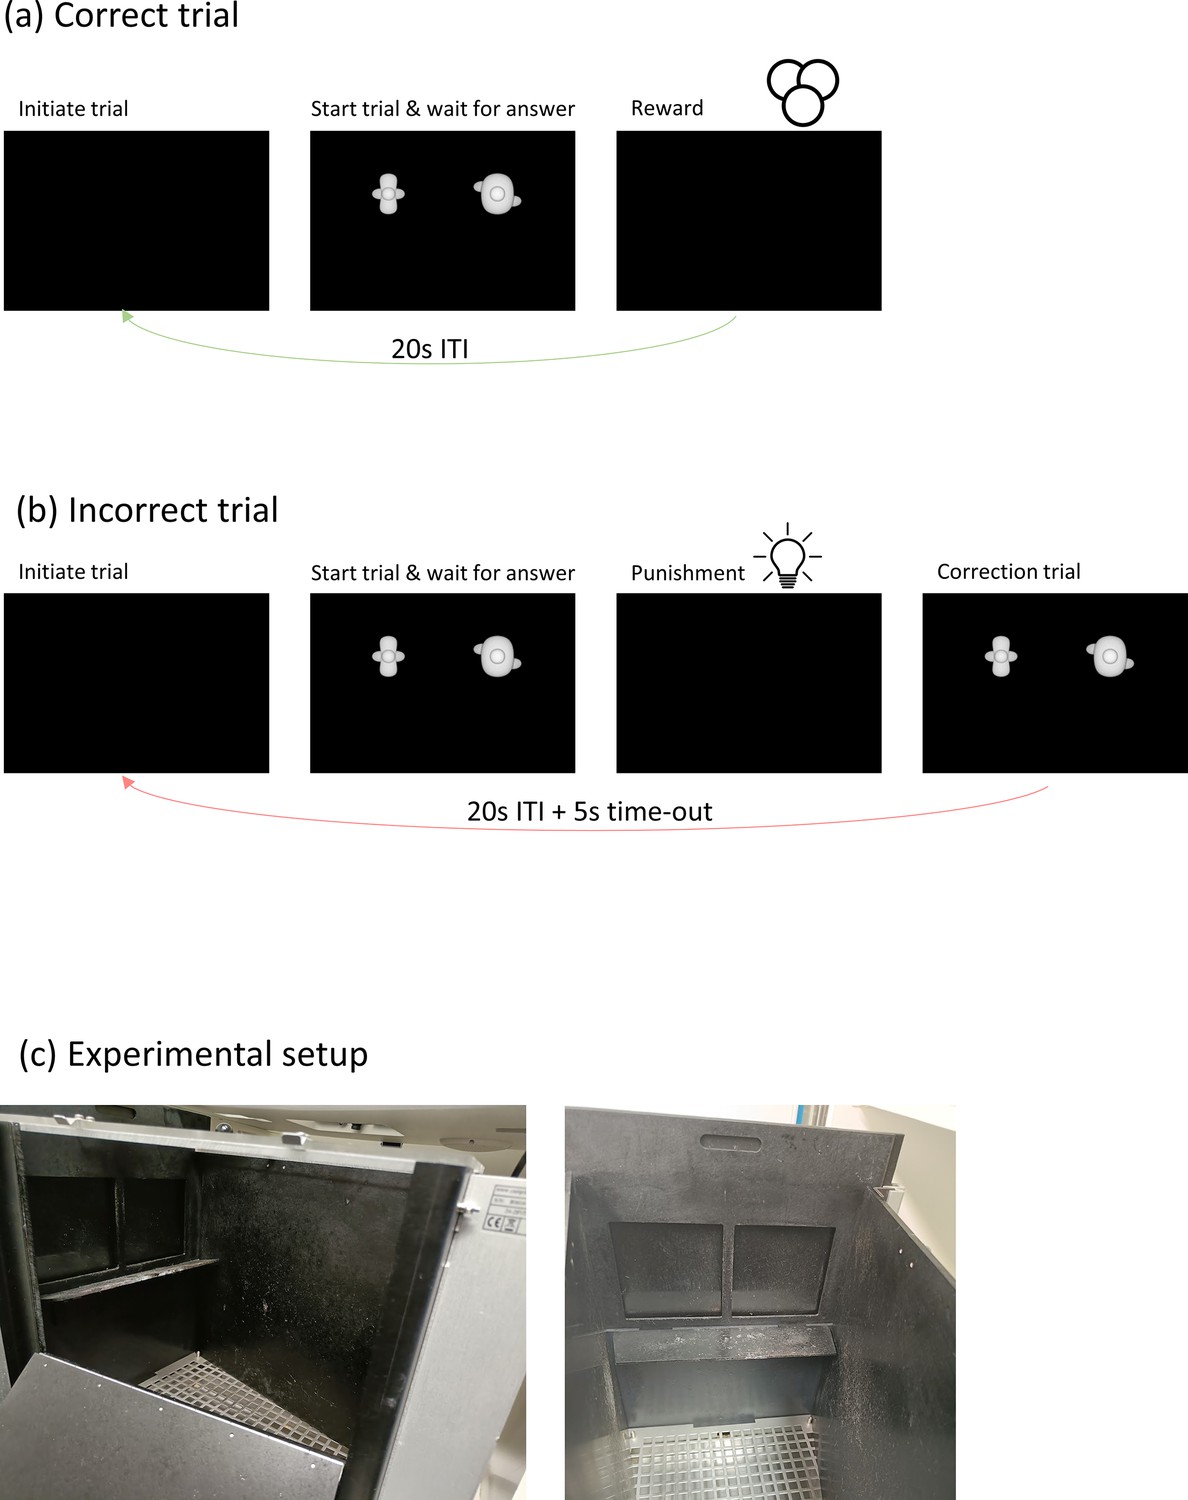
Trial and experimental setup information.
Timeline of a correct trial (a) and an incorrect trial (b). In case of a correct trial, animals receive a reward in the form of sugar pellets for touching the target. If they answer incorrectly, they do not receive sugar pellets but instead the house light is turned on. For training protocols, a correction trial is added. (c) shows images of the experimental setup.
Figure 1—figure supplement 3

Design of the pilot study.
Figure 2
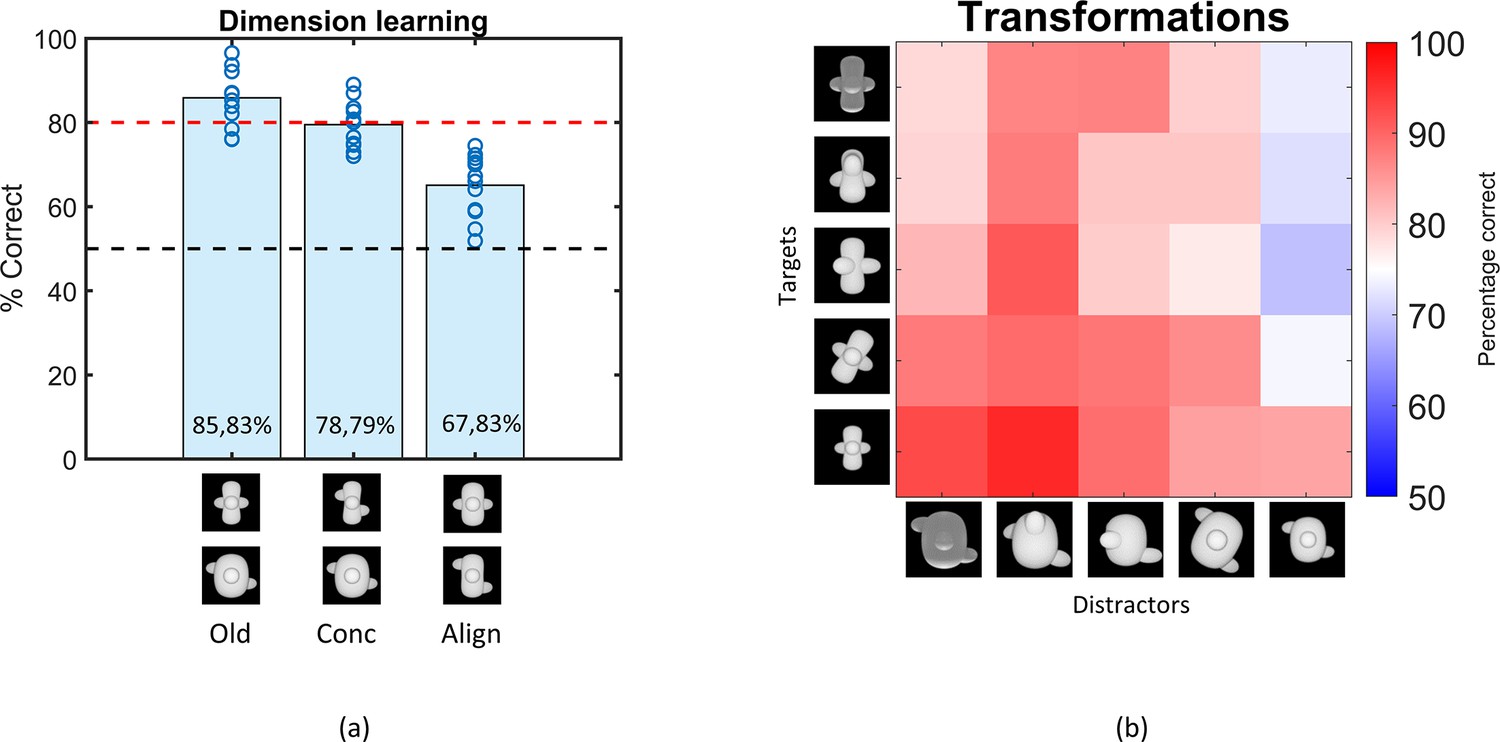
Results of the Dimension learning and Transformations training protocol.
(a) Results of the dimension learning training protocol. The black dashed horizontal line indicates chance-level performance and the red dashed line represents the 80% performance threshold. The blue circles on top of each bar represent individual rat performances. The three bars represent the average performance of all animals on the old pair (Old), the pair that differs only in concavity (Conc), and on the pair that differs only in alignment (Align). (b) Results of the transformations training protocol. Each cell of the matrix indicates the average performance per stimulus pair, pooled over all animals. The columns represent the distractors, whereas the rows separate the targets. The colour bar indicates the performance correct. Testing across transformations.
Figure 3 with 1 supplement
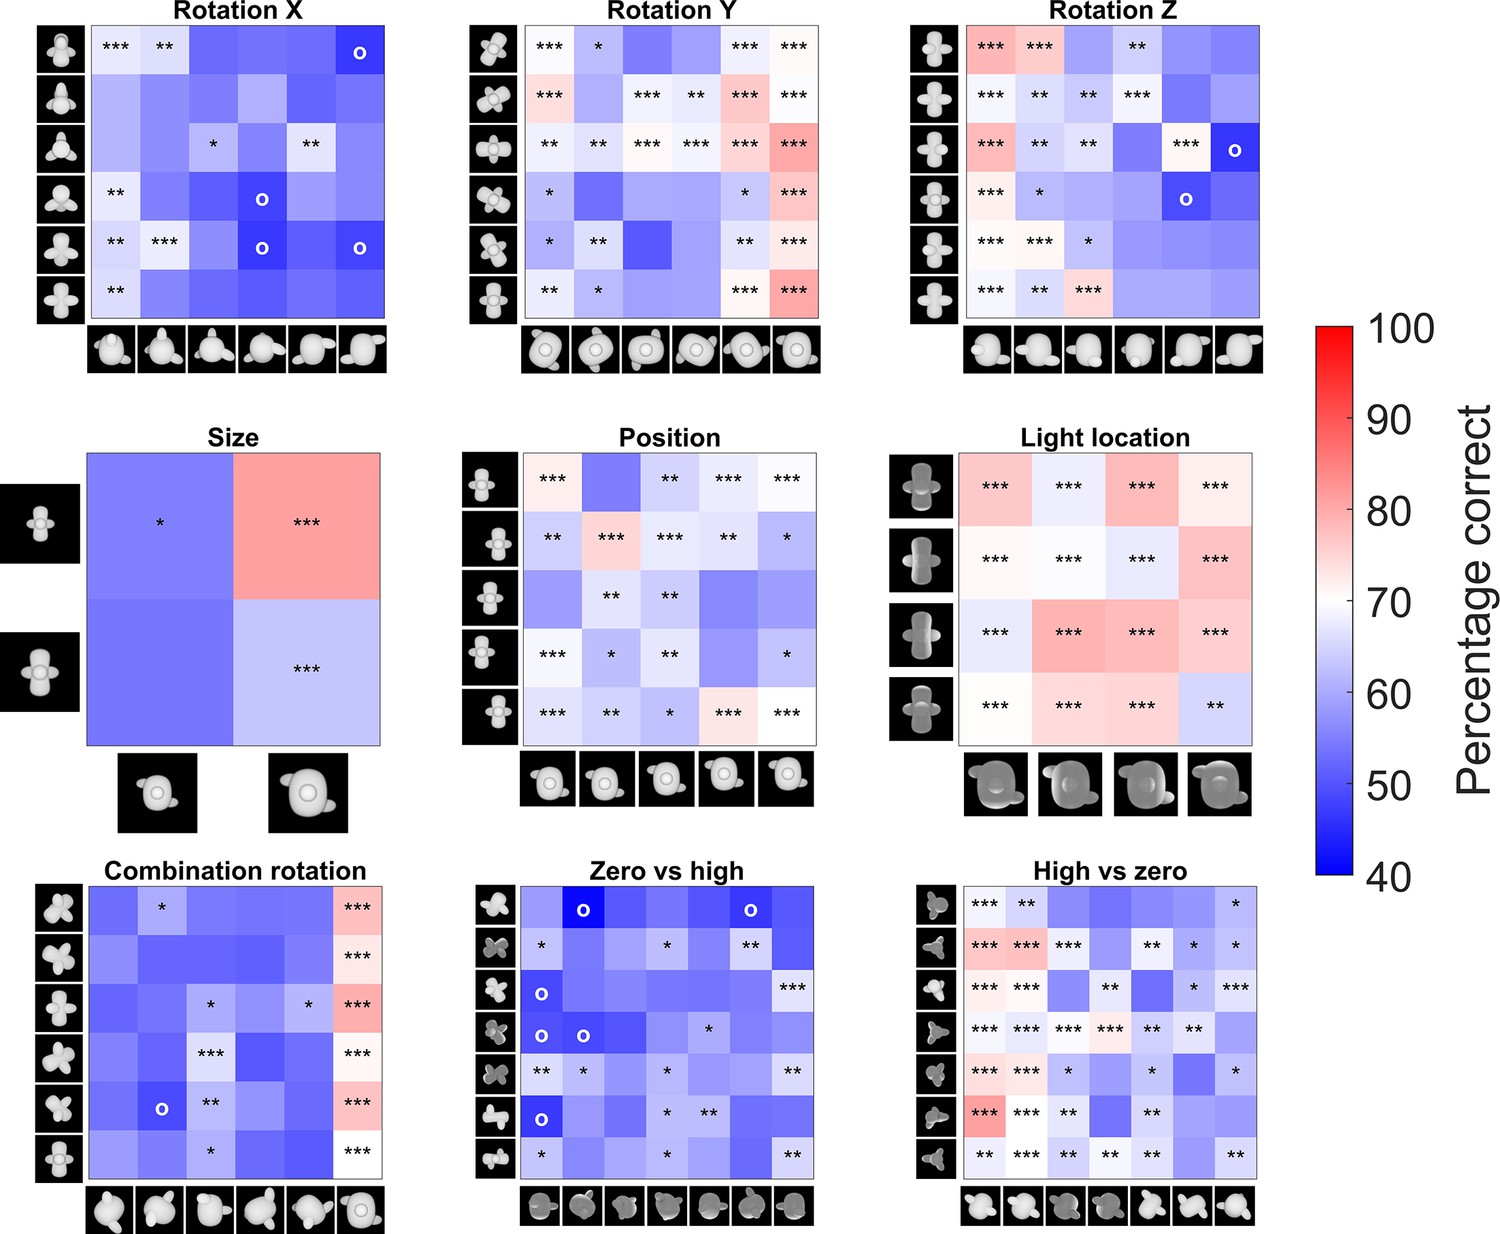
Pairwise percentage matrices of all nine testing protocols for the rat data.
The colour bar indicates the percentage correct of the pooled responses of all animals together. The redder a cell is, the higher the average performance. Values below 40% accuracy are indicated in the highest intensity of blue. Cells with an ‘o’ marker indicate a below-chance performance, whereas cells with an *, **, or *** marker indicate a performance that is significantly higher than chance level (p-value <0.05, <0.01, or <0.001 respectively). This was calculated with a binomial test on pooled performance of all animals.
Figure 3—figure supplement 1
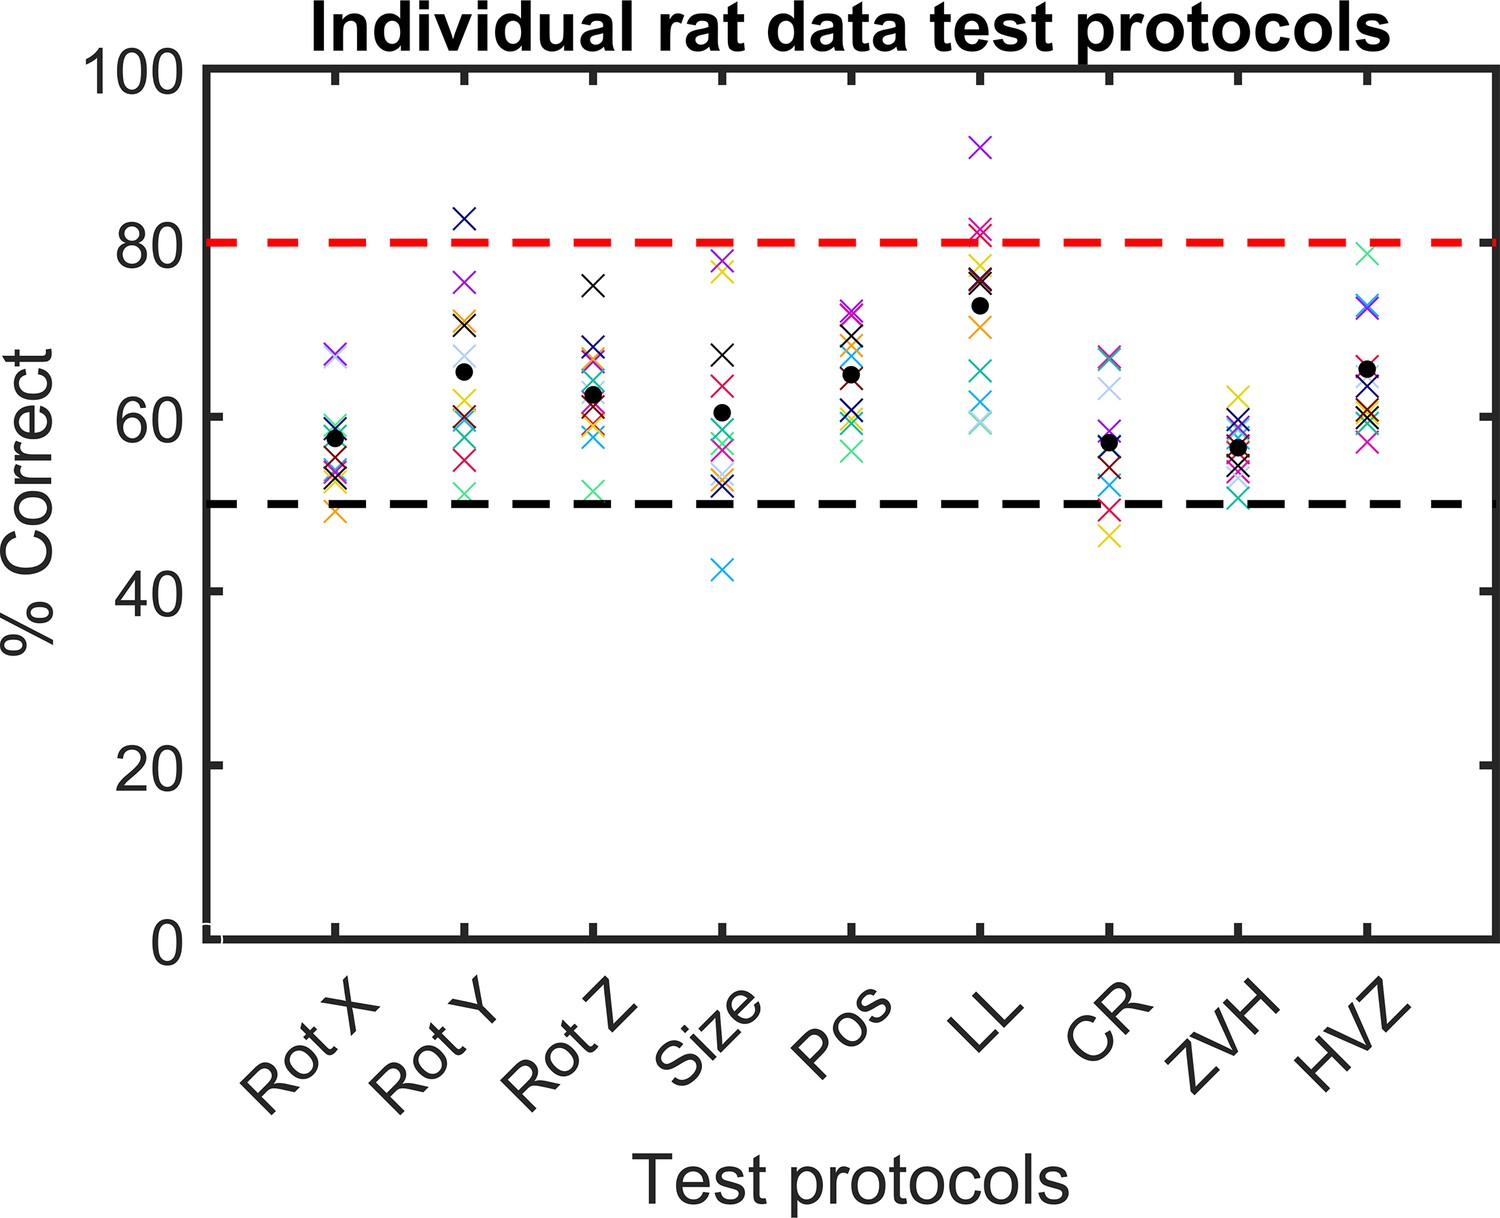
Individual rat accuracy for each testing protocol.
The black circle indicates the average accuracy across all rats together. Each coloured cross represents the accuracy of one rat.
Figure 4
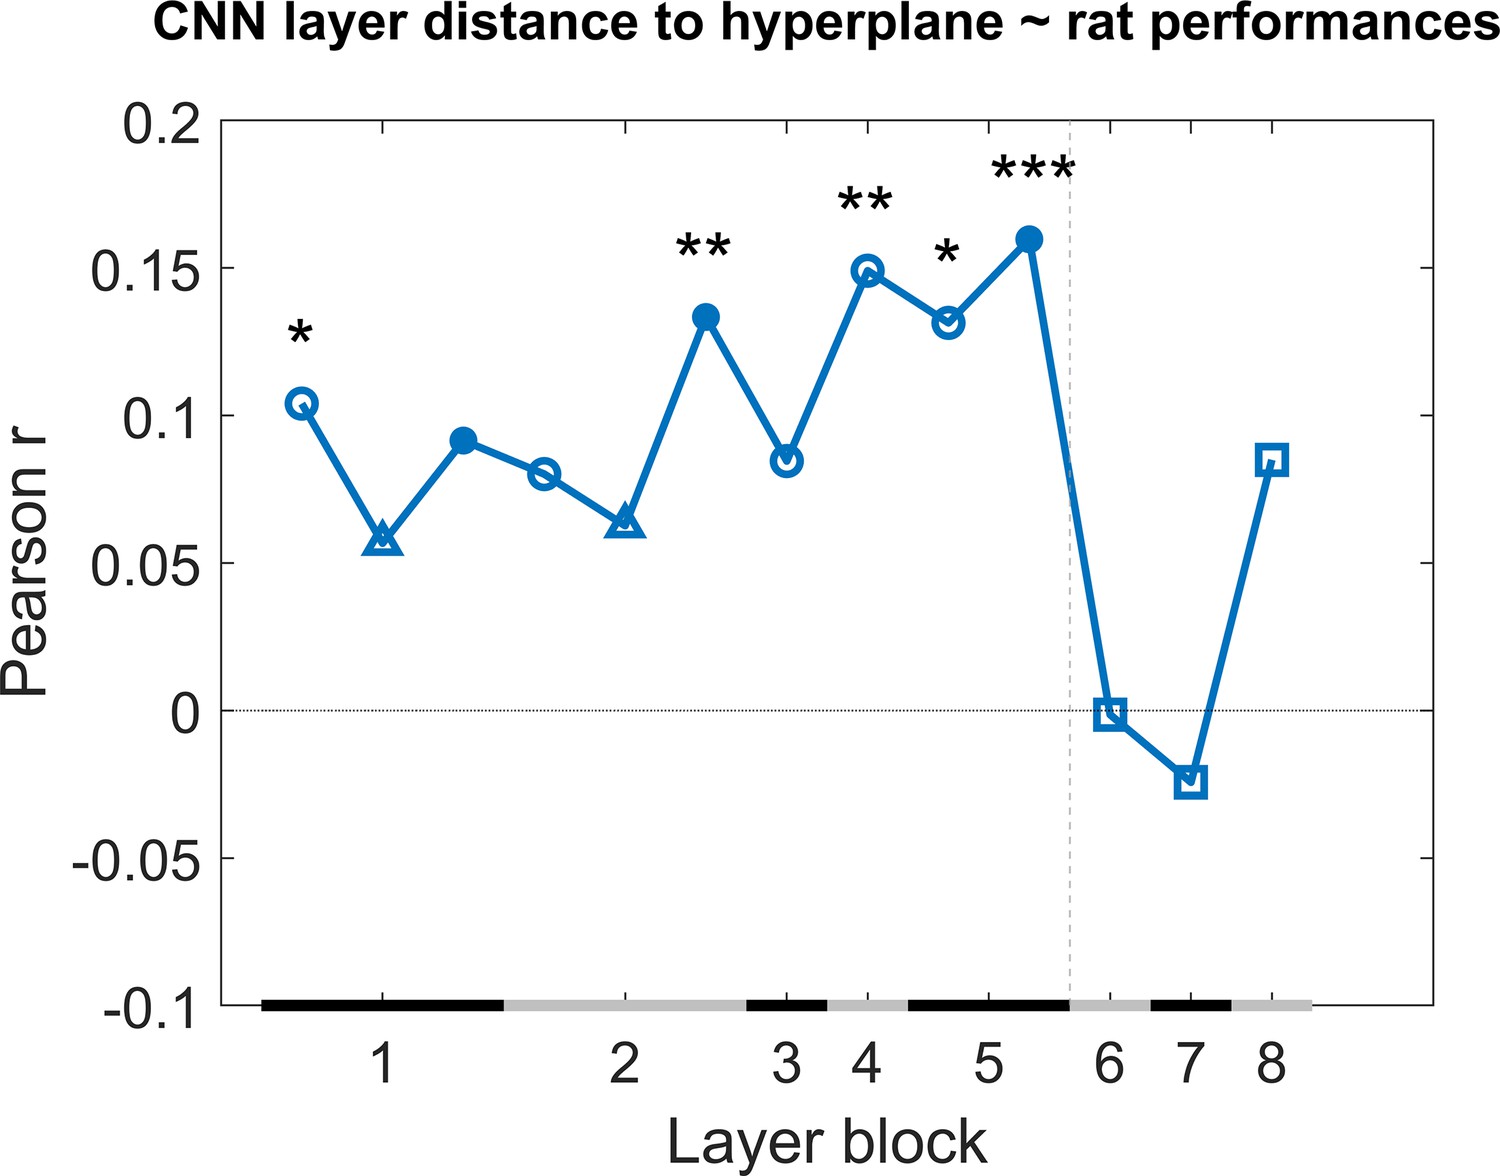
Correlation of the classification score for single target/distractor pairs between single convolutional deep neural network (CNN) layers and the rat performance for all nine test protocols together.
The black and grey horizontal lines on the x-axis indicate the layer blocks (block 1 consisting of conv1, norm1, pool1; block 2 consisting of conv2, norm2, pool2; block 3–4 corresponding to conv3-4, respectively; block 5 consisting of conv5, pool5; block 6-7-8 corresponding to fc6-7-8, respectively). The vertical grey dashed line indicates the division between convolutional and fully connected layer blocks. The horizontal dashed line indicates a correlation of 0. The different markers indicate different sorts of layers: circle for convolutional layers, triangle for normalization layers, point for pool layers, and squares for fully connected layers. The asterisks indicate significant correlations according to a permutation test (*<0.05, **<0.01, and ***<0.001).
Figure 5
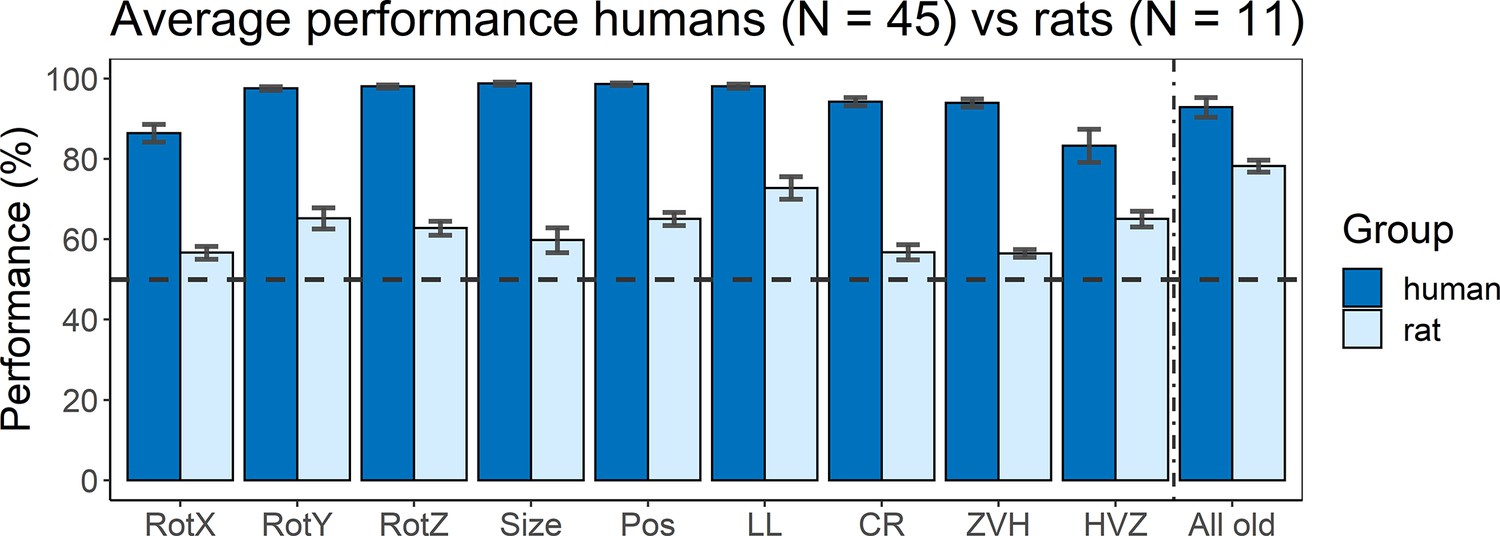
Average performance of humans versus rats.
On the x-axis, the nine test protocols in addition to the performance on all old stimuli are presented in the following order: rotation X (RotX), rotation Y (RotY), rotation Z (RotZ), size, position (Pos), light location (LL), combination rotation (CR), zero vs. high (ZVH), high vs. zero (HVZ), and all old. The dashed horizontal line indicates chance level. The error bars indicate standard error over humans/rats (N = 45 for humans, N = 11 for rats).
Figure 6
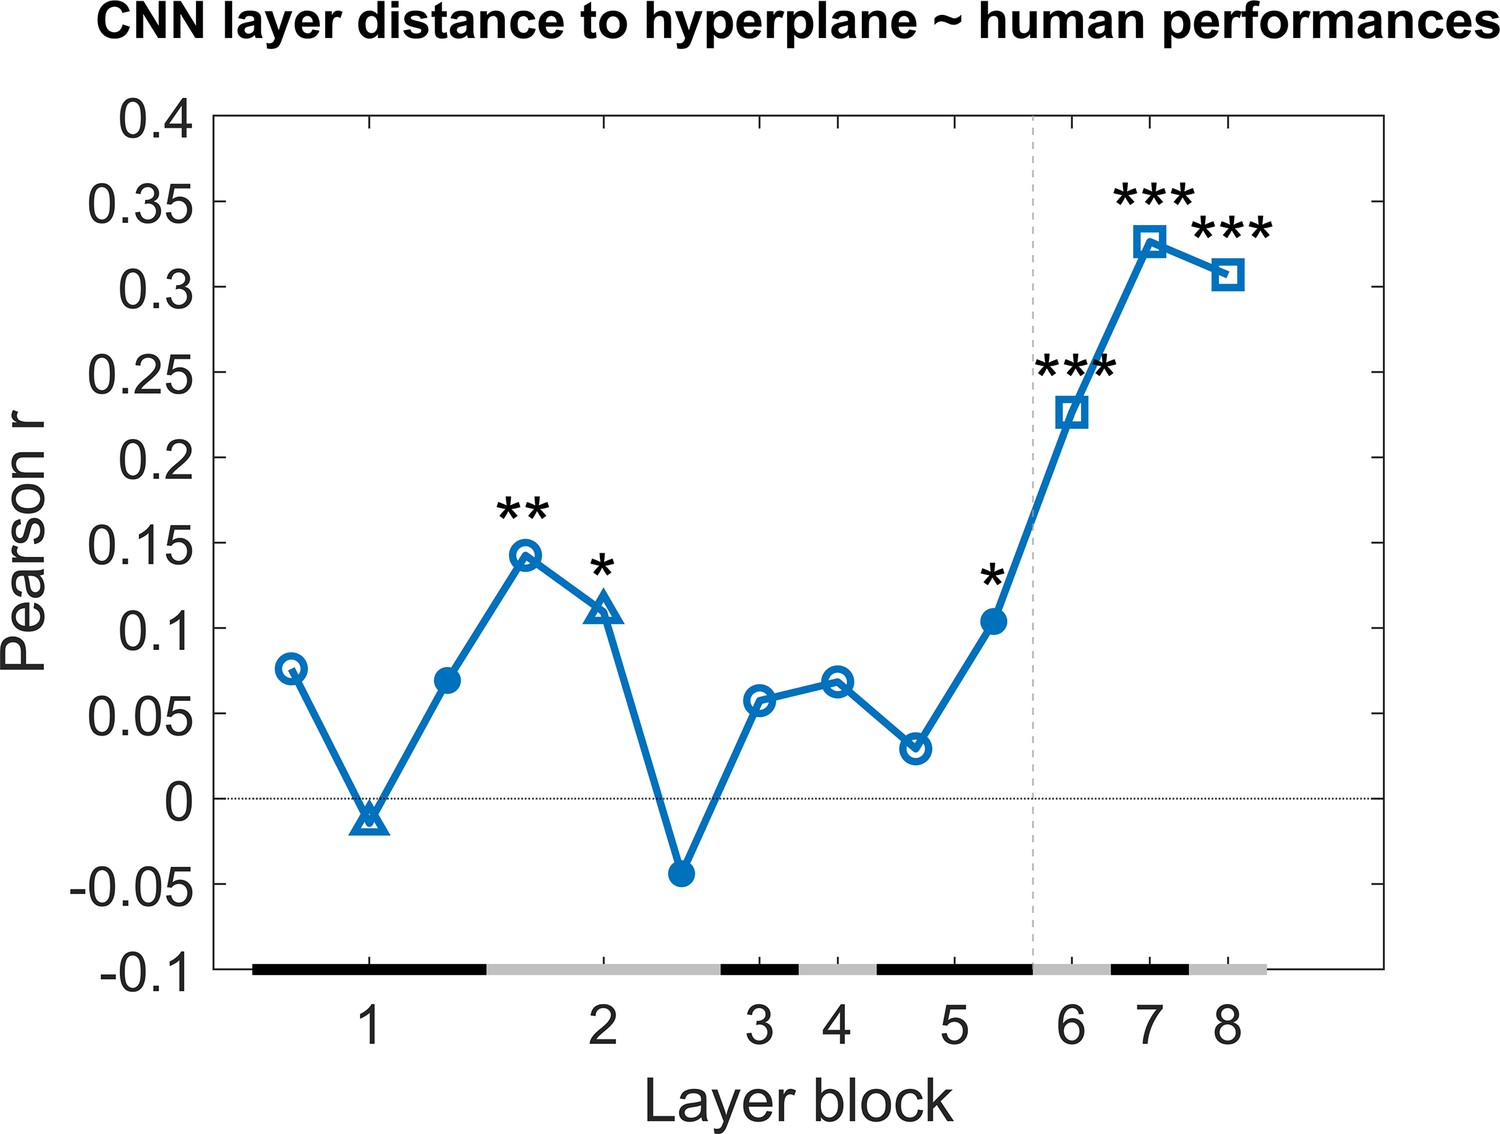
Correlation of the classification score for single target/distractor pairs between single convolutional deep neural network (CNN) layers and the human performance for all nine test protocols together.
The naming convention on the x-axis corresponds to the layers of the network, identical as in Figure 4. The black and grey horizontal lines on the x-axis indicate the layer blocks (block 1 consisting of conv1, norm1, pool1; block 2 consisting of conv2, norm2, pool2; block 3–4 corresponding to conv3-4, respectively; block 5 consisting of conv5, pool5; block 6-7-8 corresponding to fc6-7-8, respectively). The vertical grey dashed line indicates the division between convolutional and fully connected layer blocks. The horizontal dashed line indicates a correlation of 0. The different markers indicate different sorts of layers: circle for convolutional layers, triangle for normalization layers, point for pool layers, and squares for fully connected layers. The asterisks indicate significant correlations according to a permutation test (*<0.05, **<0.01, and ***<0.001).
Figure 7 with 3 supplements
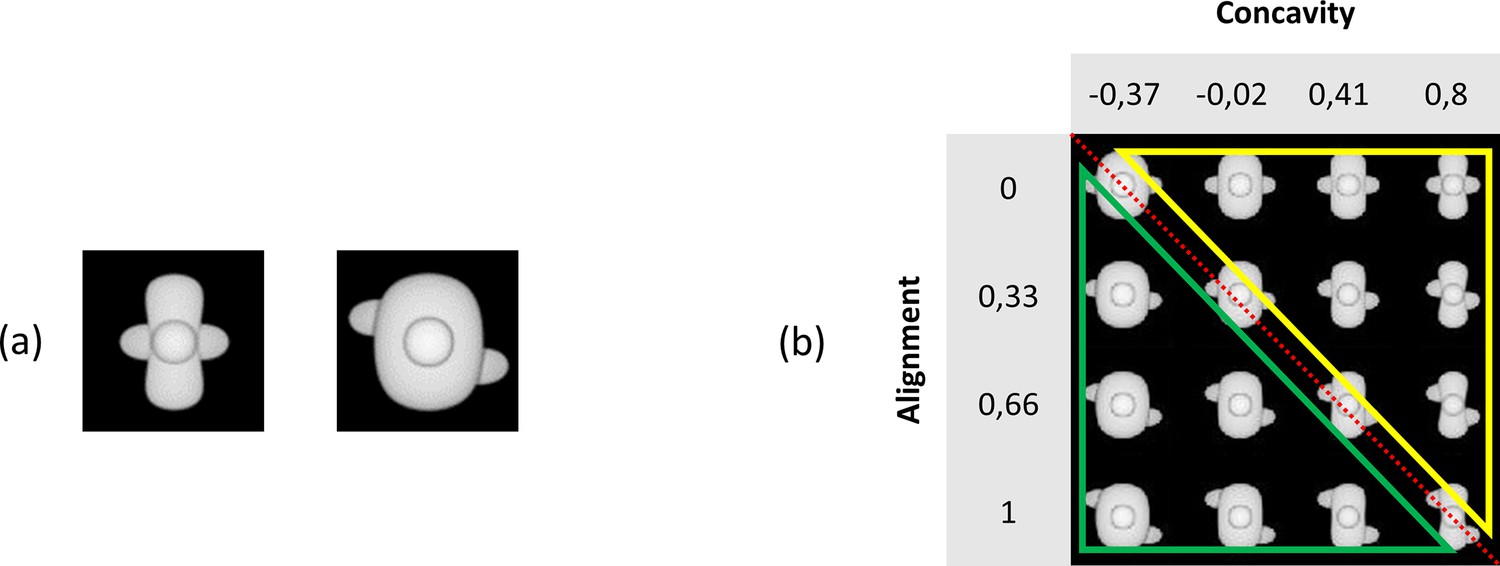
Illustration of the base pair and our stimulus grid.
(a) The base pair of the main experiment. (b) The chosen 4 × 4 stimulus grid. The red diagonal dotted line indicates the ambiguous stimuli that can be seen as target as well as distractor. All stimuli below this line (green triangle) indicate the distractor sub-grid, whereas all stimuli above this line (yellow triangle) highlight the target sub-grid.
Figure 7—figure supplement 1

Illustration of the 4 × 11 stimulus grid.
We chose 11 values for concavity, ranging between –0.5 and 0.8, and 4 values for alignment, ranging between 0 and 1.
Figure 7—figure supplement 2
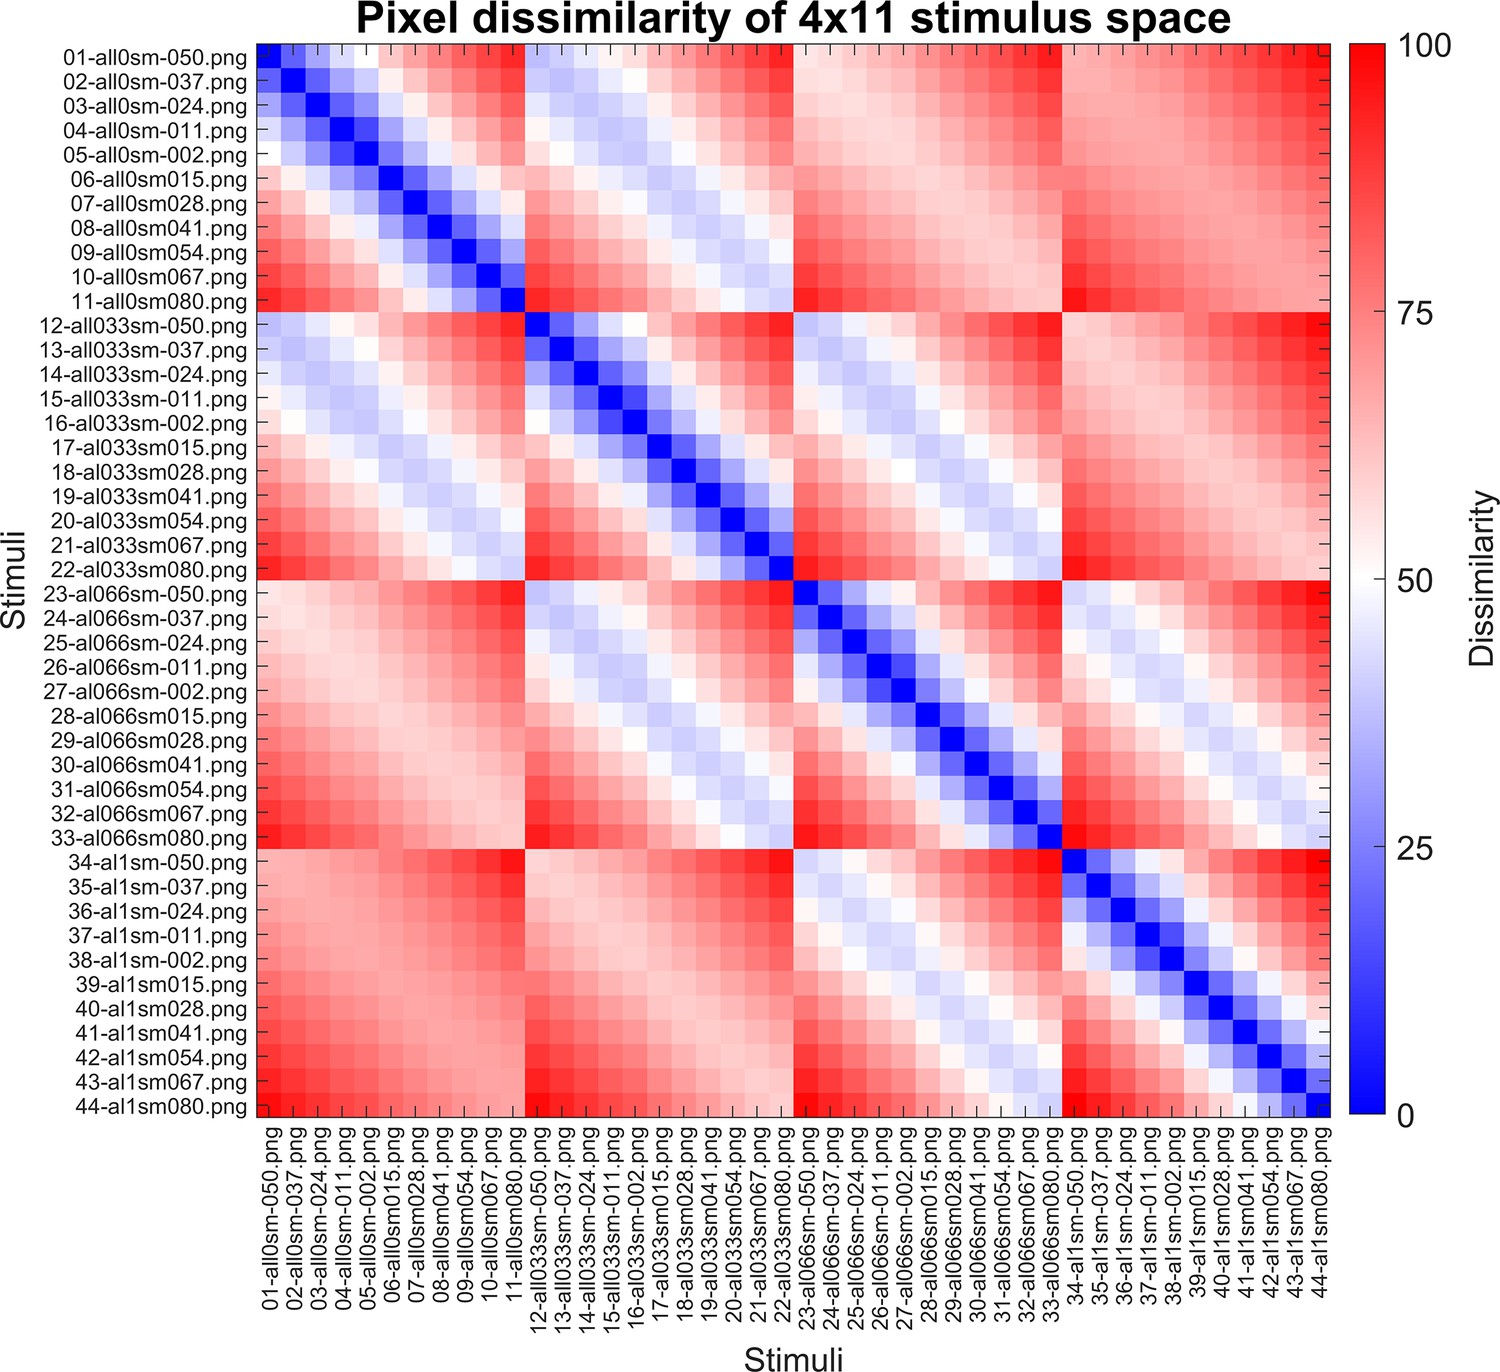
The pixel dissimilarity matrix of the 4 × 11 stimulus grid.
This matrix is calculated in the exact same way as Schnell et al., 2023. The colour bar indicates pixel dissimilarity values, normalized between 0 and 100. The higher this value, and thus the redder a cell, the more dissimilar two stimuli are. The naming convention of the stimuli is as follows: XX-alYYsmZZZ.png, where XX is an ordering number, YY indicates the alignment level, and ZZZ indicates the concavity (smoothness) level.
Figure 7—figure supplement 3
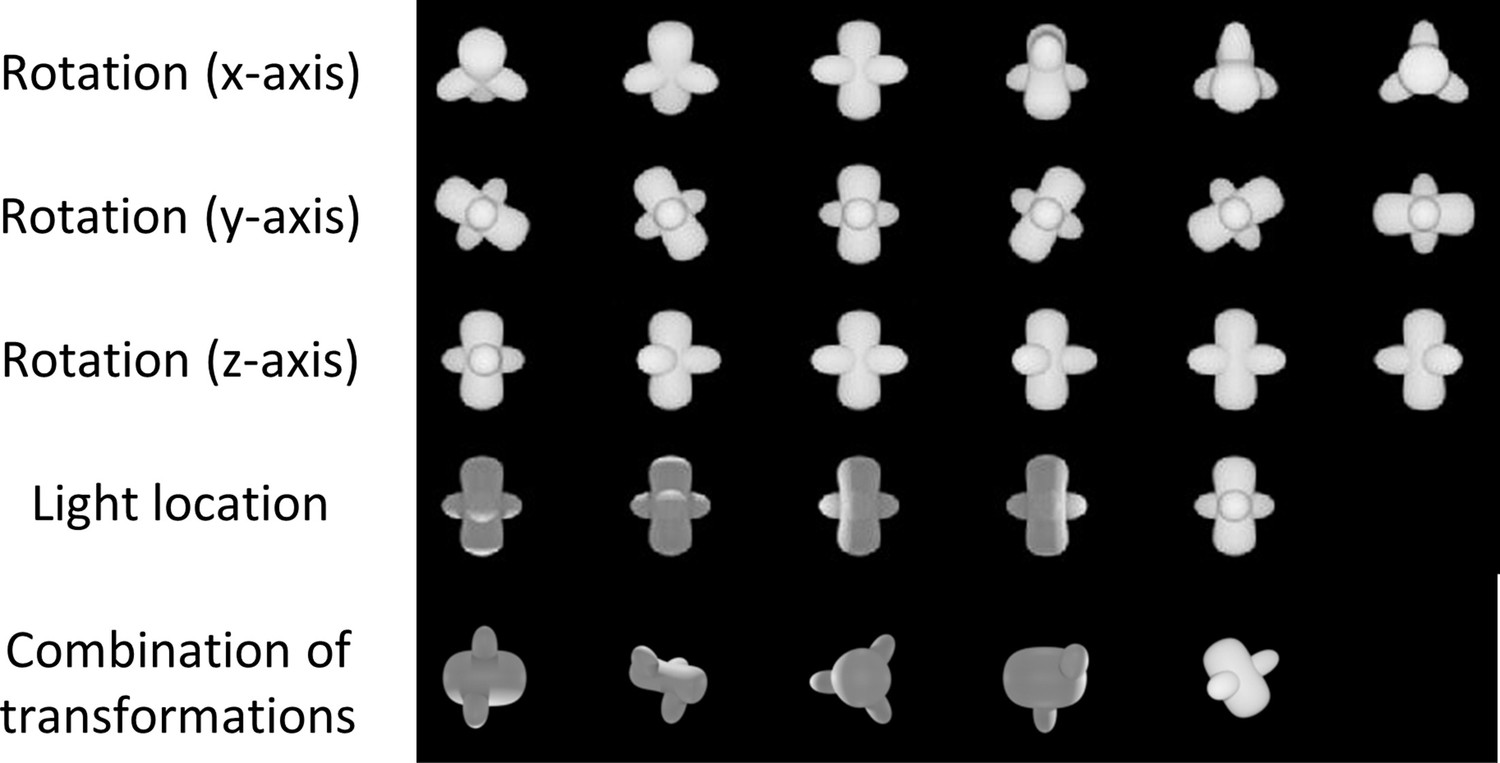
Identity-preserving transformations on one of the basic stimuli.
The first three rows show rotation along the x-axis, y-axis, and z-axis, respectively, always in angles of 30°, 60°, 90°, 120°, 150°, and 180°. The fourth row illustrates the light location transformation. The last row shows some combinations of transformations, with different values for the alignment and concavity parameter.
Figure 8
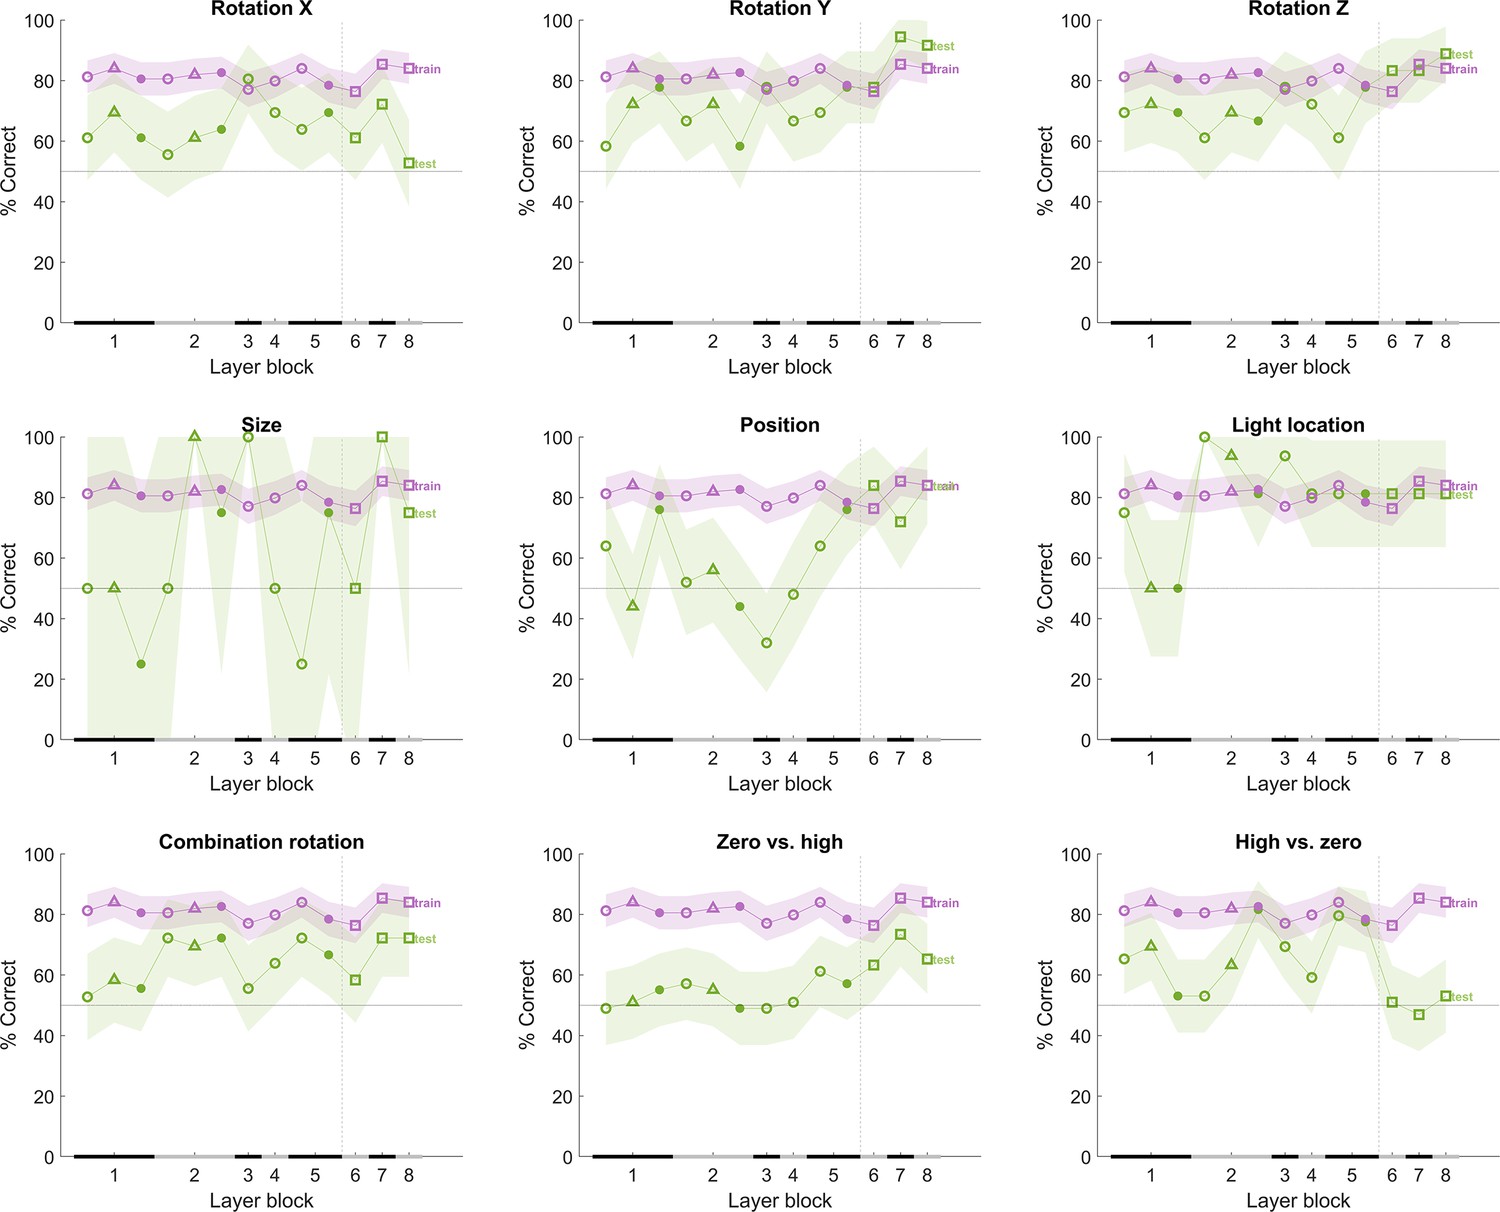
The performance of the convolutional deep neural network (CNN) after training on our training stimuli, with noise added to its input.
The naming convention on the x-axis corresponds to the layers of the network, identical as in Figure 4. The performance (y-axis) illustrates that each layer is challenged by at least part of the test protocols. The purple line indicates the training performance, and the green line indicates the test performance of the neural network. The x-axis on each subplot indicates the block of the layer: layer blocks 1–8 correspond to (convolutional layer 1, normalization layer 1, pool layer 1), (convolutional layer 2, normalization layer 2, pool layer 2), convolutional layer 3, convolutional layer 4 (convolutional layer 5, pool layer 5), fully connected layer 6, fully connected layer 7, and fully connected layer 8, respectively. The black and grey horizontal lines on the x-axis indicate the layer blocks (block 1 consisting of conv1, norm1, pool1; block 2 consisting of conv2, norm2, pool2; block 3–4 corresponding to conv3-4, respectively; block 5 consisting of conv5, pool5; block 6-7-8 corresponding to fc6-7-8, respectively). The vertical grey dashed line indicates the division between convolutional and fully connected layer blocks. The horizontal dashed line indicates chance level. The shaded error bounds correspond to 95% confidence intervals calculated using Jackknife standard error estimates, as done previously in Vinken and Op de Beeck, 2021. The different markers indicate different sorts of layers: circle for convolutional layers, triangle for normalization layers, point for pool layers, and squares for fully connected layers.
Author response image 1

Author response image 2

Additional files
-
Supplementary file 1
Supplementary tables.
(a) Results of binomial test on the six test protocols with the pooled data of all animals together, on the old trials and the new trials. (b) Marginal means and standard deviation of the rotation X and rotation Z protocols. (c) Correlation between neighbouring layers of the deep neural network. (d) Results of the linear regression model with rat performances. (e) Results of the linear regression model with human performances. (f) Average number of trials (SD) per test protocol and per stimulus pair (SP). (g) The two criteria of choosing a CNN-informed stimulus set. (h) Overview of the human experiment. (i) An overview of the performance of the animals on the first six test protocols.
- https://cdn.elifesciences.org/articles/87719/elife-87719-supp1-v1.docx
-
Supplementary file 2
Information about the pilot study.
- https://cdn.elifesciences.org/articles/87719/elife-87719-supp2-v1.docx
-
MDAR checklist
- https://cdn.elifesciences.org/articles/87719/elife-87719-mdarchecklist1-v1.pdf
Download links
A two-part list of links to download the article, or parts of the article, in various formats.
Downloads (link to download the article as PDF)
Open citations (links to open the citations from this article in various online reference manager services)
Cite this article (links to download the citations from this article in formats compatible with various reference manager tools)
A computationally informed comparison between the strategies of rodents and humans in visual object recognition
eLife 12:RP87719.
https://doi.org/10.7554/eLife.87719.3


