A generative model of electrophysiological brain responses to stimulation
- Center for Functionally Integrative Neuroscience, Department of Clinical Medicine, Aarhus University, Denmark
- Department of Psychiatry, Oxford University, United Kingdom
Figures
Figure 1

Left and middle: single-trial example of the generated signal (in blue) and its constitutive components (in red): instantaneous phase, frequency, and amplitude, as well as an additive non-oscillatory and oscillatory response components; the left panel reflects a phase resetting plus frequency entrainment effect, while the middle panel corresponds to an additive oscillatory response.
Right: real (filtered) magnetoencephalography data collected during passive stimuli viewing; the red curves are the analytically computed phase, frequency, and amplitude (via the Hilbert transform).
Figure 2
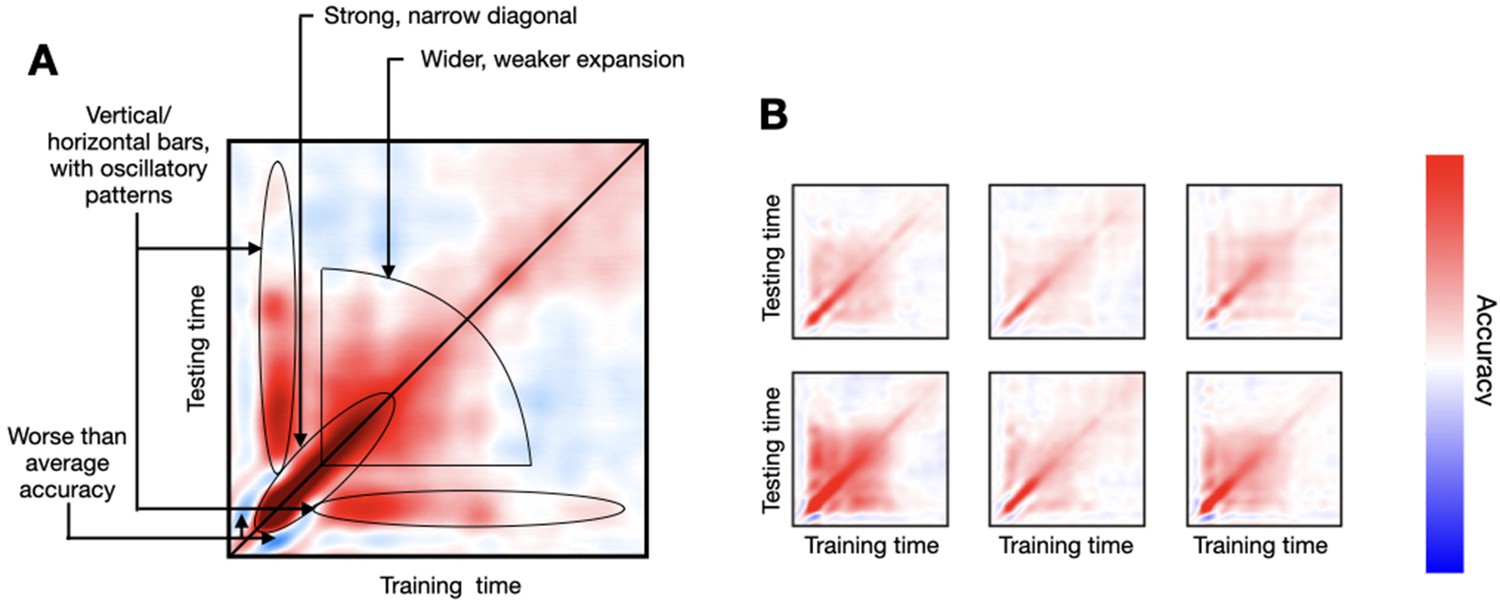
Empirical decoding results from (real) data, where subjects underwent a passive viewing experiment.
(A) One example subject’s temporal generalisation matrix (TGM), where the different characteristic features have been highlighted. (B) TGMs from six example subjects.
Figure 3

Examples of two configurations based on phase resetting and frequency entrainment (left) and additive oscillatory responses (middle), shown together with results obtained from real data (right).
The top panels show temporal generalisation matrices (TGMs) from standard decoding analysis. The bottom panels show average evoked responses (ERP/F) for the sampled signal (blue) and its components (red); the two stimuli are represented with different tonalities of blue or red.
Figure 4

Having more dimensions (channels) carrying stimulus-specific information, but with a larger degree of stochasticity, produces more realistic decoding patterns than having fewer dimensions with a lower degree of stochasticity.
Here, stochasticity referred to the channels’ probability of activation.
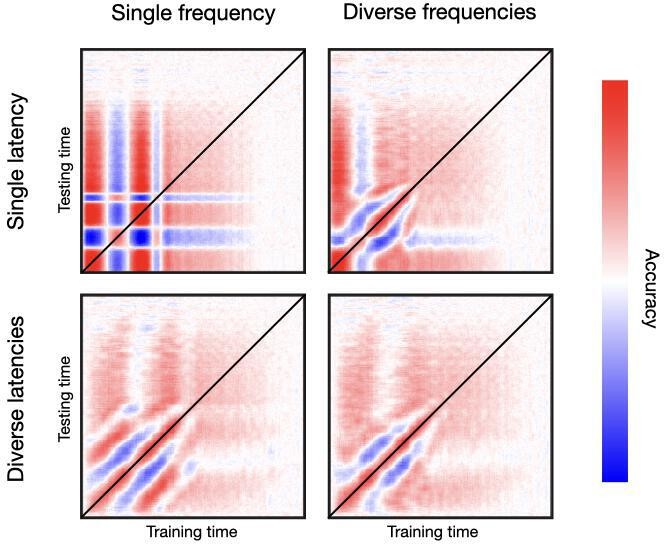
Figure 5 with 1 supplement

Oscillatory responses to stimulation occur in a diversity of frequencies and latencies across channels.
Top row, single latency of response; bottom row, diverse latencies across channels. Left column, single frequency; right column, diverse frequencies across channels. Bottom-right is the most realistic temporal generalisation matrix (TGM).
Figure 5—figure supplement 1
Phase reset plus frequency entrainment effect.
Top row, single latency of response; bottom row, diverse latencies across channels; left column, single frequency; right column; diverse frequencies across channels.
Figure 6

An additive non-oscillatory response is needed to produce realistic temporal generalisation matrices (TGMs) with a broadening of decoding accuracy at later stages of the trial.
(A) By increasing the strength of the non-oscillatory response, the broadening of accuracy becomes more prominent. (B) Changing the nature of the phasic relationship between the slower and the faster (oscillatory component) greatly influences the TGM, from having all channels in-phase (left) towards having all channels anti-phase (right).
Figure 7
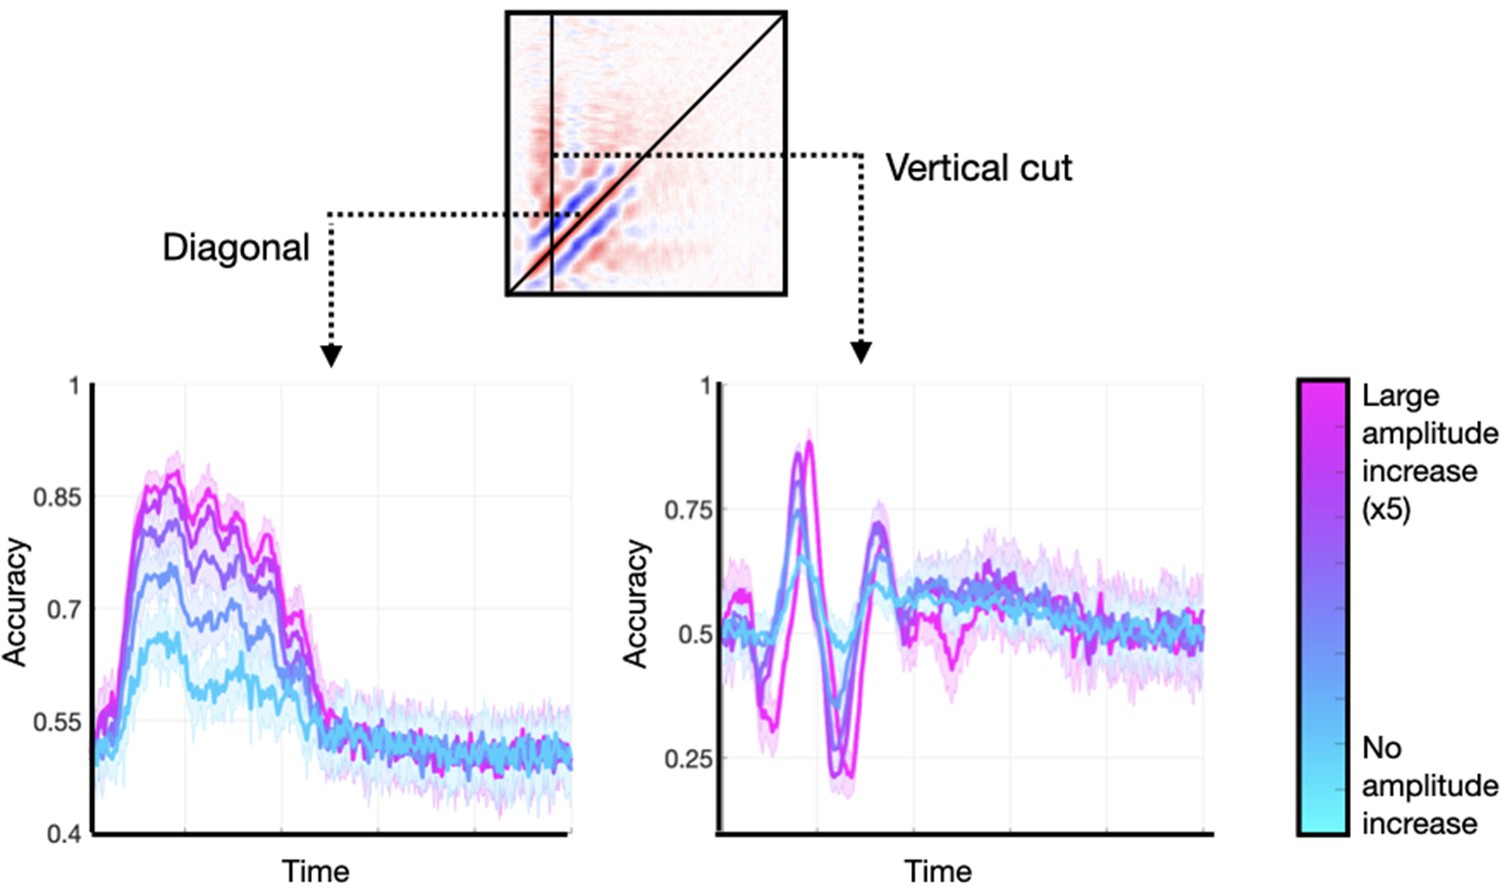
Enhancing the amplitude of the stimulus-relevant oscillation is not strictly necessary to produce realistic temporal generalisation matrices (TGMs), but it can enlarge the effects.
Two features of the TGM are highlighted: the diagonal, and a vertical slice at the time point of maximum accuracy.
Figure 8
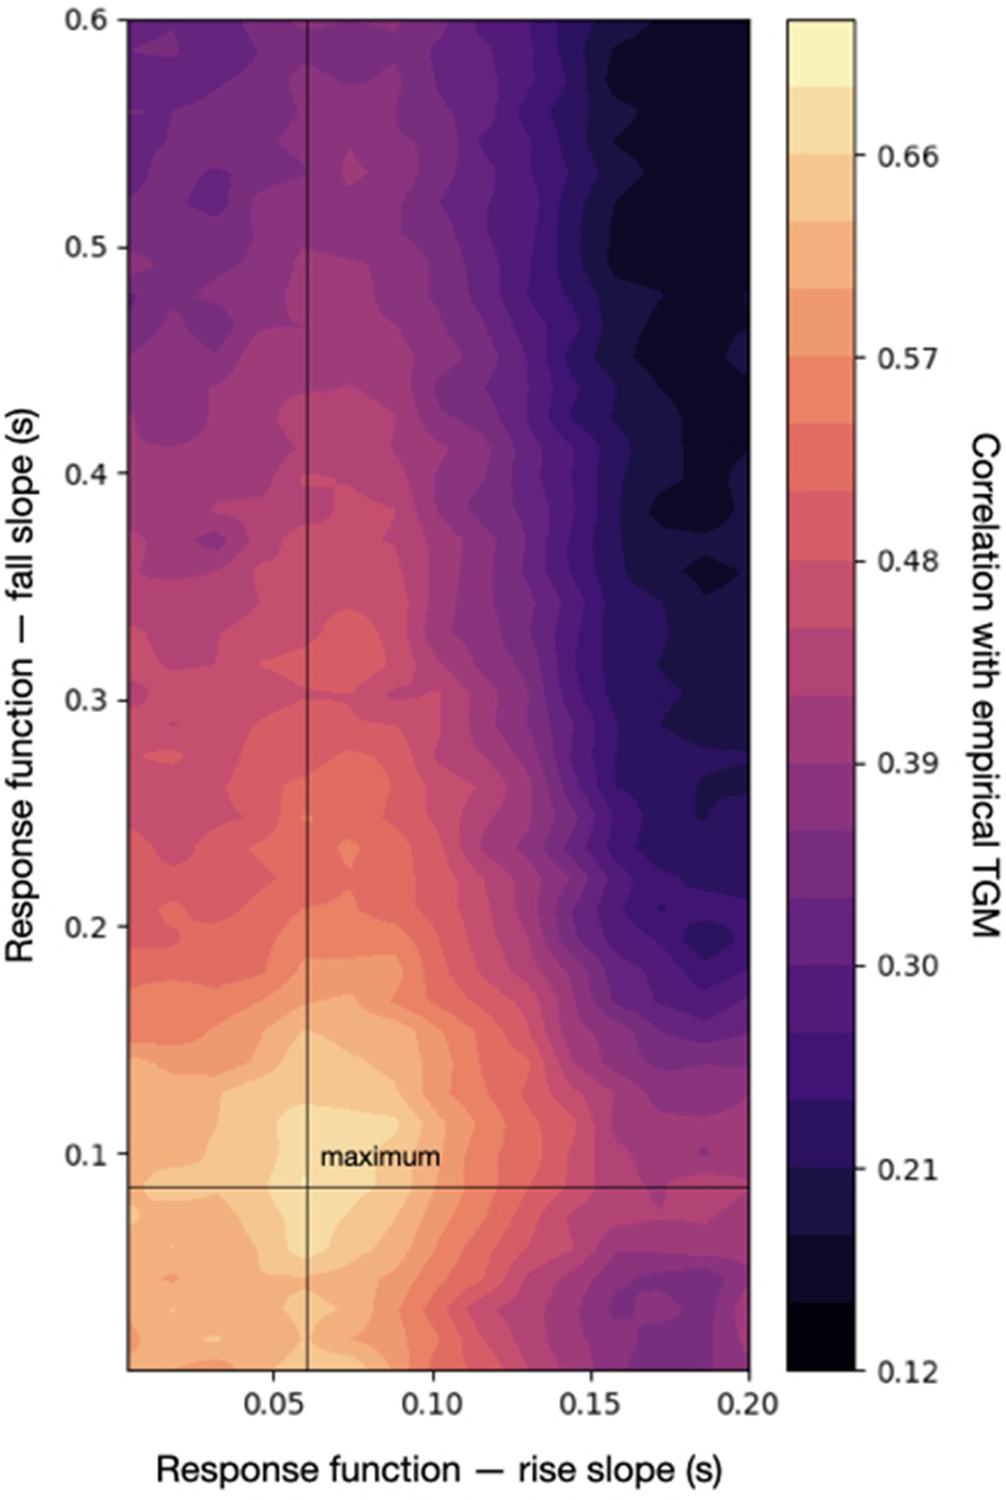
Correlation between an empirical temporal generalisation matrix (TGM) and the sampled TGM (averaged across 10 runs of the simulation) across a range of configurations of the response function, which defines the temporal dynamics of the effect.
The maximum correlation with the empirical TGM is slightly over 0.7.
Tables
Table 1
genephys configuration hyperparameters.
| Parameter | Math. notation |
|---|---|
| Frequency autoregressive parameter | |
| Amplitude autoregressive parameter | |
| Frequency range | |
| Amplitude range | |
| Measurement noise standard deviation | |
| Channel activation probability | |
| Number of relevant channels | |
| Response function—latency | |
| Response function—rise slope | |
| Response function—fall slope | |
| Target phase, mean | |
| Target phase, standard deviation | |
| Additive oscillatory response, phase | |
| Additive oscillatory response, amplitude | |
| Additive oscillatory response, frequency | |
| Amplitude modulation | |
| Additive non-oscillatory response, mean | |
| Additive non-oscillatory response, standard deviation |
Additional files
Download links
A two-part list of links to download the article, or parts of the article, in various formats.
Downloads (link to download the article as PDF)
Open citations (links to open the citations from this article in various online reference manager services)
Cite this article (links to download the citations from this article in formats compatible with various reference manager tools)
A generative model of electrophysiological brain responses to stimulation
eLife 12:RP87729.
https://doi.org/10.7554/eLife.87729.3


