SMARCAD1 and TOPBP1 contribute to heterochromatin maintenance at the transition from the 2C-like to the pluripotent state
- Centre for Genomic Regulation (CRG), The Barcelona Institute of Science and Technology, Spain
- Universitat Pompeu Fabra, Spain
- Department of Genetics, The Alexander Silberman Institute of Life Sciences, Edmond J. Safra Campus, The Hebrew University of Jerusalem, Israel
- The Edmond and Lily Safra Center for Brain Sciences, Edmond J. Safra Campus, The Hebrew University of Jerusalem, Israel
- ICREA, Spain
- Medical Research Institute, Guangdong Provincial People's Hospital (Guangdong Academy of Medical Sciences), Southern Medical University, China
Figures
Figure 1 with 1 supplement
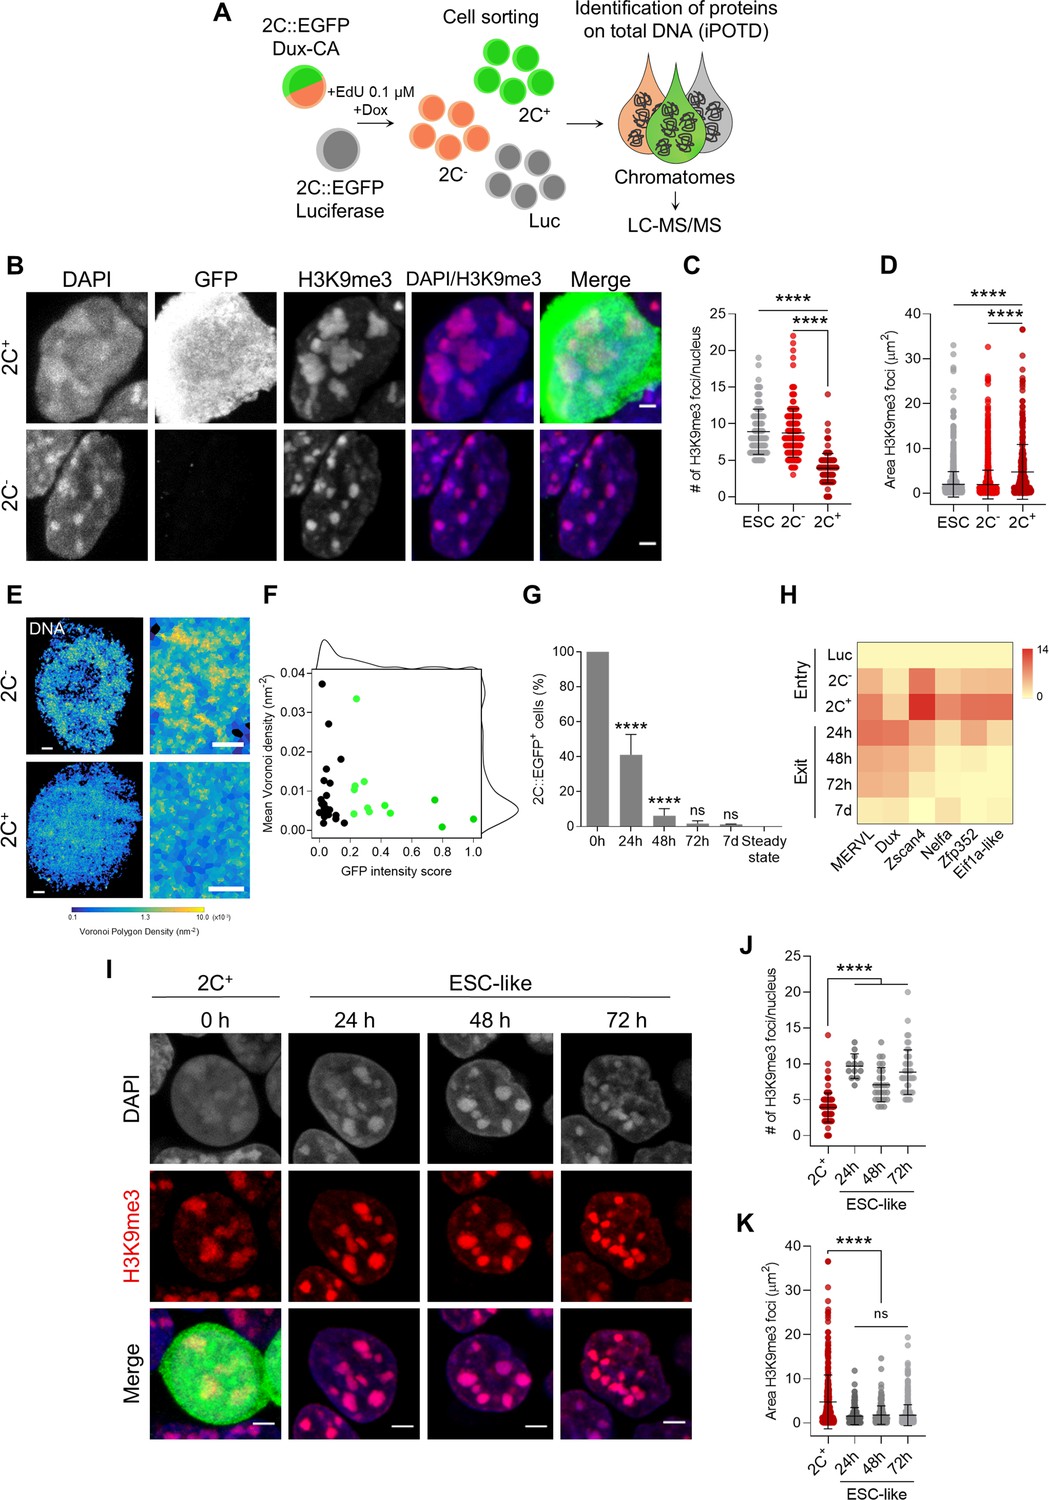
Entry in the 2C-like state is characterized by the remodeling of H3 lysine 9 trimethylation (H3K9me3) heterochromatin, which is reverted upon 2C+ exit.
(A) Schematic representation of the samples collected to perform the identification of protein on total DNA (iPOTD) workflow. LC-MS/MS, liquid chromatography-tandem mass spectrometry. (B) Representative immunofluorescence images of the 2C::EGFP reporter and H3K9me3 in 2C- and 2C+ cells. Scale bar, 2 µm. (C) Quantification of the number of H3K9me3 foci in embryonic stem cells (ESCs), 2C- and 2C+ cells. Data are presented as scatter dot plots with line at mean ± SD (n>3 independent cultures, ESCs=103 cells, 2C-=170 cells, and 2C+=119 cells). p<0.0001**** by one-way ANOVA (Tukey’s multiple comparisons test). (D) Quantification of H3K9me3 foci area in ESCs, 2C- and 2C+ cells. Data are presented as scatter dot plots with line at mean ± SD (n>3 independent cultures, ESCs=1712 foci, 2C-=1445 foci, and 2C+=340 foci). p<0.0001**** by one-way ANOVA (Tukey’s multiple comparisons test). (E) Voronoi tessellation rendering of super-resolution images of DNA in 2C- and 2C+ cells. Full nuclei (left; scale bar, 1 µm) and zoomed images (right; scale bar, 400 nm) are shown. (F) Biaxial density plot showing mean Voronoi density of DNA (inverse of the polygon area) as a measure of chromatin compaction and GFP intensity score in 2C- and 2C+ cells. Cells with a GFP intensity score >0.2 are colored in green. Black dots indicate 2C- cells and green dots indicate 2C+ cells. Each dot represents a single cell (2C-=23 cells and 2C+=12 cells). (G) Quantification of the percentage of 2C-like cells 24 hr, 48 hr, 72 hr, and 7 days after 2C+ cell sorting. The endogenous 2C-like fluctuation was used as the steady-state condition. Data are presented as mean ± SD (n=3 independent experiments). p=0.7656ns, p<0.0001**** by one-way ANOVA (Tukey’s multiple comparisons test). (H) Heat map representation of MERVL, Dux, Zscan4, Nelfa, Zfp352, and Eif1a-like expression in luciferase (Luc), 2C- and 2C+ sorted cells (entry) and in ESC-like cells at 24 hr, 48 hr, 72 hr, and 7 days (7d) after 2C+ sorting. Data are presented as log2 fold change (FC) values to luciferase detected by quantitative real-time PCR (qRT-PCR). (I) Representative immunofluorescence images of H3K9me3 at 0 hr (2C+ before exit), 24 hr, 48 hr, and 72 hr after 2C-like state exit. Scale bar, 3 µm. (J) Quantification of the number of H3K9me3 foci in 2C+ cells and at 24 hr, 48 hr, and 72 hr after 2C-like state exit. Data are presented as scatter dot plots with line at mean ± SD (n=2 independent cultures, 2C+=119 cells, same dataset plotted in B; ESC-like 24 hr=12 cells; ESC-like 48 hr=27 cells; ESC-like 72 hr=49 cells). p<0.0001**** by one-way ANOVA (Tukey’s multiple comparisons test). (K) Quantification of H3K9me3 foci area in 2C+ cells and at 24 hr, 48 hr, and 72 hr after 2C-like state exit. Data are presented as scatter dot plots with line at mean ± SD (n=2 independent cultures, 2C+=340 foci, same dataset plotted in C; ESC-like 24 hr=168 foci; ESC-like 48 hr=238 foci; ESC-like 72 hr=605 foci). p>0.05ns, p<0.0001**** by one-way ANOVA (Tukey’s multiple comparisons test).
Figure 1—figure supplement 1

Characterization of Dux-derived 2C-like cells.
(A) Representative live-cell images of stable luciferase and Dux-CA embryonic stem cell (ESC) lines upon doxycycline (Dox) induction. Scale bar, 20 µm. (B) Representative immunofluorescence images of the 2C::EGFP reporter in the Dux-CA line in control (-Dox) and Dux overexpressing (+Dox) conditions showing activation of the 2C::EGFP reporter after 24 hr of Dox administration. Scale bar, 50 µm. (C) Representative fluorescence-activated cell sorting (FACS) plots showing GFP+ cells in the Dux-CA line without (-Dox) and after 24 hr of Dox treatment (+Dox). (D) Effect of Dux overexpression on the activation of the 2C::EGFP reporter by flow cytometry. Data are presented as mean ± SD (n=3 independent cultures). p<0.0001**** by one-way ANOVA (Tukey’s multiple comparisons test). (E) Representative immunofluorescence images out of two experiments of the 2C::EGFP reporter and the endogenous pluripotency transcription factor OCT4 after 24 hr of Dox induction. Arrowheads indicate 2C+ cells. Dashed lines indicate nuclei contour. Scale bar, 5 µm. (F) Quantitative real-time PCR (qRT-PCR) of Dux, MERVL, and major satellites (MajSat) in ESCs, 2C- and 2C+ sorted cells. Data are presented as mean ± SE (n≥2, 2C- and 2C+ samples are technical replicates). (G) Cell cycle profile of non-induced luciferase (Luc) control ESCs, 2C- and 2C+ cells (left). Quantification of the percentage of ESCs, 2C- and 2C+ cells in different phases of the cell cycle (right). Data are presented as mean ± SD (n>3 independent cultures). p>0.05ns, p=0.0289*, p<0.0001**** by two-way ANOVA (Dunnett’s multiple comparisons test). (H) Quantification of the percentage of control ESCs (Ctrl) and 2C+ cells in different phases of the cell cycle. 2C+ cells induced from several Dux overexpressing clonal lines generated in our laboratory were analyzed. An independent Dux-CA clonal line was included for comparison (Hendrickson et al., 2017). Data are presented as mean ± SE (n≥3, technical replicates).
Figure 2 with 1 supplement
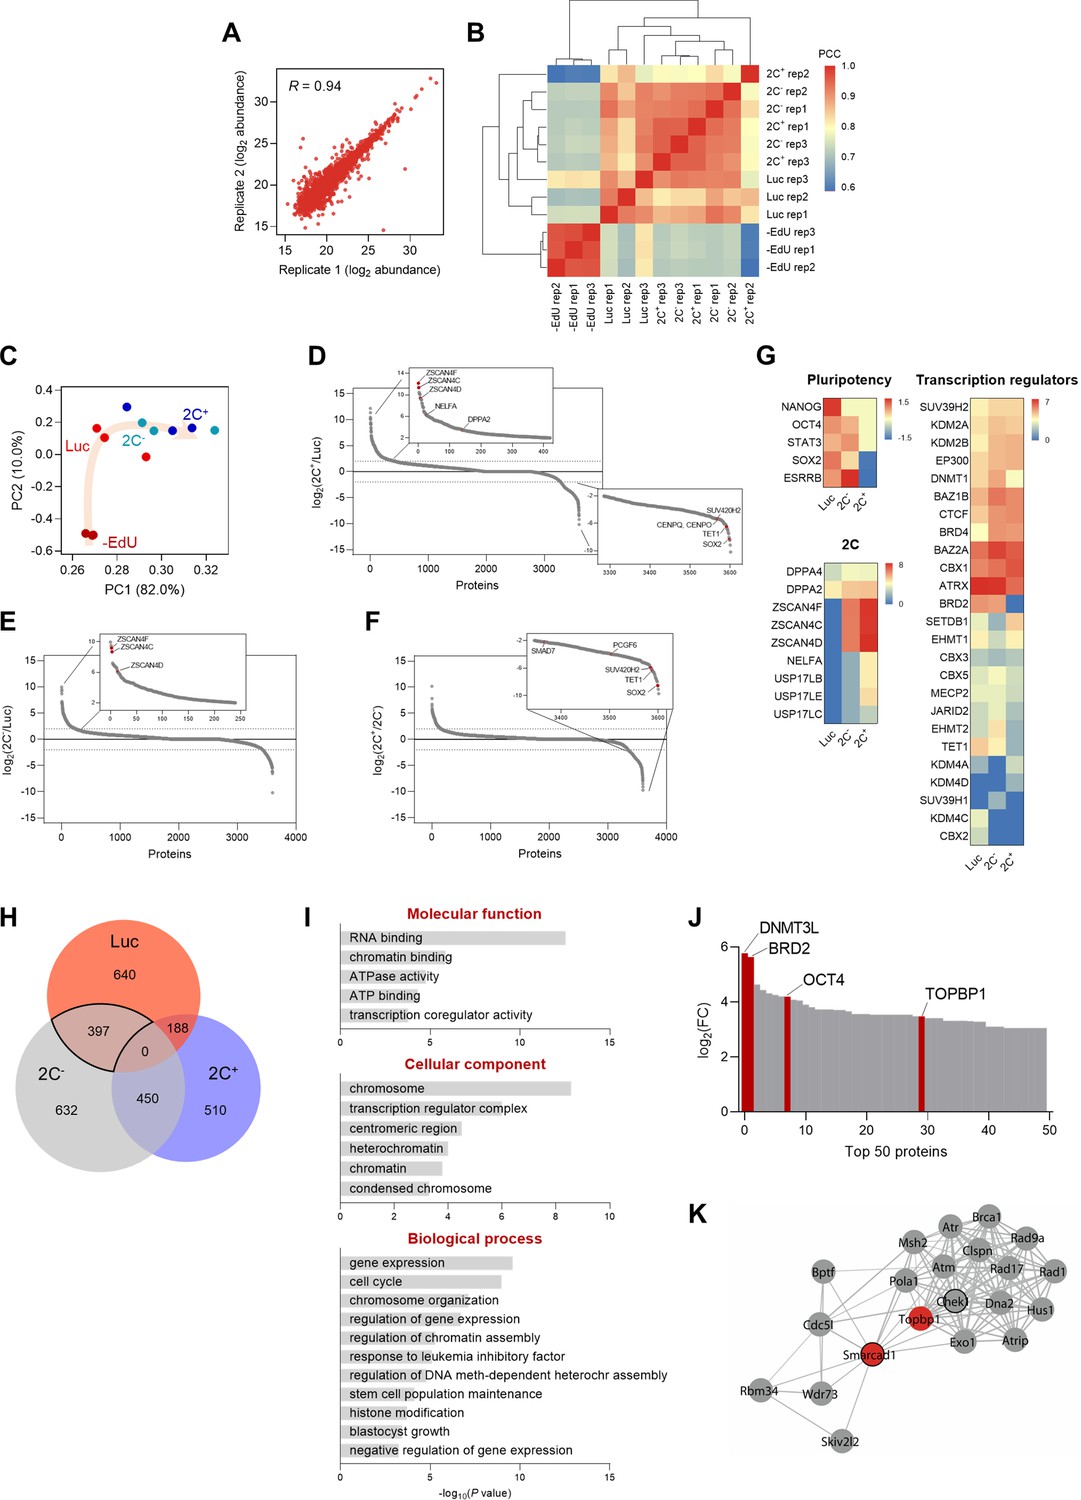
Chromatin-bound proteome profiling allows the identification of dynamic chromatome changes during 2C-like cell reprogramming.
(A) Reproducibility between replicates of independent chromatome preparations. Correlation between replicate 1 and replicate 2 from the 2C- condition is shown. R indicates Pearson’s R. (B) Correlation matrix showing reproducibility among independent replicates of –EdU, Luc, 2C- and 2C+ protein abundances. Hierarchical clustering analysis of the individual replicates is also shown. PCC, Pearson’s correlation coefficient. (C) Principal component analysis (PCA) of the chromatome dataset. Each point corresponds to a single replicate. Beige arrow indicates the 2C-like reprogramming trajectory. (D) Protein enrichment analysis of the comparison between 2C+ and Luc chromatomes. Red dots indicate known regulators of the 2C-like state, which were found enriched in the 2C+ chromatome (upper panel), and novel factors that were found depleted from the 2C+ chromatome (lower panel). Dashed lines indicate log2 fold change (FC)±2. (E) Protein enrichment analysis of the comparison between 2C- and Luc chromatomes. Red dots indicate known regulators of the 2C-like state, which were found enriched in the 2C- chromatome. Dashed lines indicate log2 FC±2. (F) Protein enrichment analysis of the comparison between 2C+ and 2C- chromatomes. Red dots indicate novel factors that were found depleted from the 2C+ chromatome. Dashed lines indicate log2 FC±2. (G) Heat map representation of the chromatin-bound abundance of pluripotency transcription factors, 2-cell-specific factors, and transcriptional regulators in Luc, 2C- and 2C+ cells. Data are presented as log2 FC of PSM values to –EdU. PSM, peptide spectrum match. (H) Venn diagram indicating the overlap between the identified proteins enriched in Luc, 2C- and 2C+ chromatomes after SAINT analysis. Specifically, an average enrichment value was computed from the respective pairwise comparisons (i.e. Luc vs 2C-; Luc vs 2C+; 2C- vs Luc; 2C- vs 2C+), and proteins were selected on the basis of a minimum of FC≥2. The solid line highlights the 397 proteins enriched in the Luc and 2C- chromatomes that were not enriched in the 2C+ chromatome. (I) Gene ontology analysis of the commonly enriched chromatin-bound proteins identified in (H). (J) Distribution of the top 50 chromatin-bound proteins identified in the Luc and 2C- chromatomes ranked by log2 FC. (K) Functional protein network of TOPBP1 interactors. TOPBP1 and SMARCAD1 nodes are colored in red. The black node border indicates chromatin remodeling function. Network edges indicate the degree of confidence prediction of the interaction. Protein interaction data were retrieved from the STRING database (Szklarczyk et al., 2017).
Figure 2—figure supplement 1
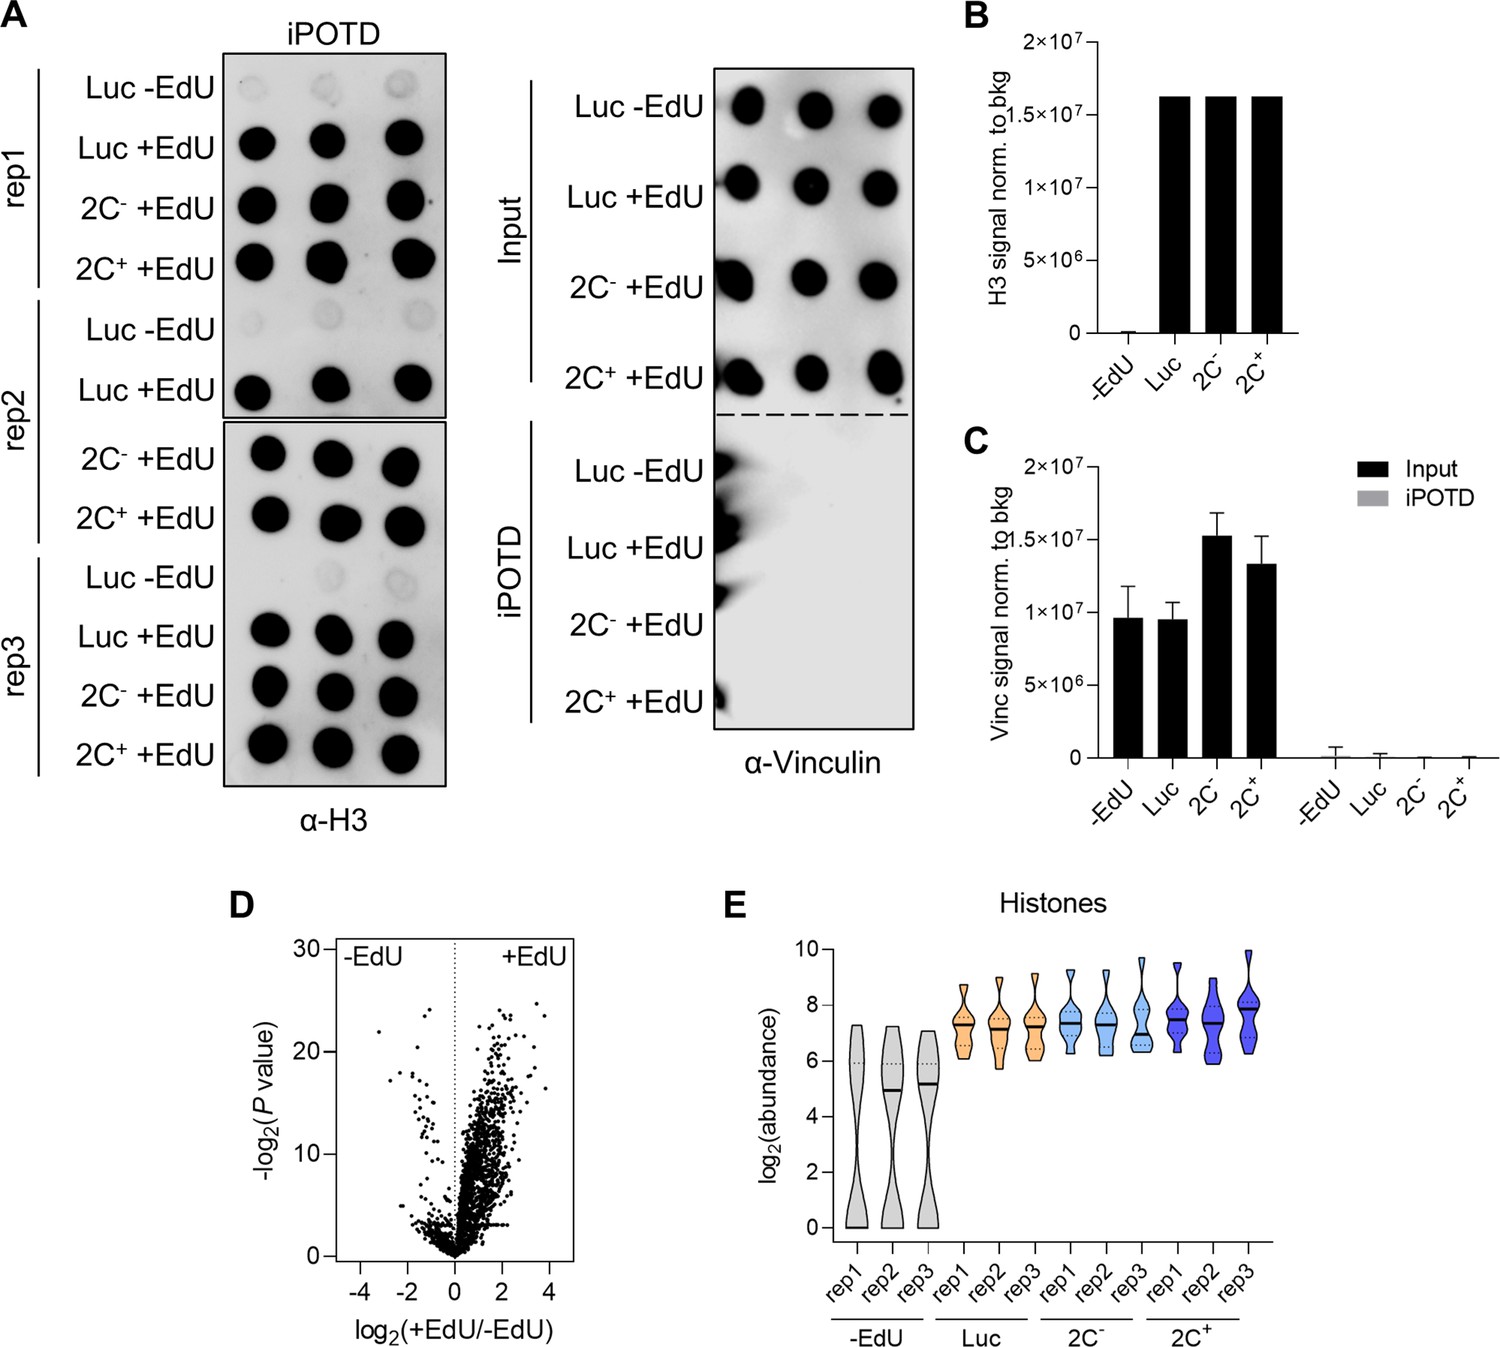
Chromatin proteomics of 2C-like cells.
(A) Independent DNA-mediated chromatin pull-down (iPOTD) eluates from sorted luciferase, 2C- and 2C+ replicates in the absence or presence of EdU (±EdU) were analyzed by dot blot with an anti-H3 antibody (left). Input and eluates from equivalent preparations were incubated with an anti-vinculin antibody (right). Each condition was spotted in triplicates. (B) Quantification of histone H3 signal detected by dot blot in the absence or presence of EdU. Data are presented as mean ± SD of H3 signal normalized to the background. (C) Quantification of vinculin (Vinc) signal detected by dot blot in input or iPOTD samples. Data are presented as mean ± SD of vinculin signal normalized to the background. (D) Volcano plot of proteins identified by mass spectrometry after DNA-mediated chromatin pull-down in Luc and –EdU conditions. 2396 proteins were enriched in the Luc (+EdU) chromatome compared with the control –EdU condition (fold change>1). (E) Abundance of histones in the individual replicates from –EdU, Luc, 2C- and 2C+ conditions. The following histones were included in the analysis: core histones H2A, H2B, and H4, macro-H2A.1, macro-H2A.2, H2A.V, H2A.X, H3.3, and CENP-A. Violin plot shows median with a solid line and quartiles with dashed lines. Original membranes corresponding to A are provided as a source data file (Figure 2—figure supplement 1—source data 1 and Figure 2—figure supplement 1—source data 2). The signal intensity of the membranes in A has been digitally adjusted solely for visualization purposes.
-
Figure 2—figure supplement 1—source data 1
Original membranes corresponding to Figure 2—figure supplement 1A.
- https://cdn.elifesciences.org/articles/87742/elife-87742-fig2-figsupp1-data1-v1.zip
-
Figure 2—figure supplement 1—source data 2
Original membranes corresponding to Figure 2—figure supplement 1A with labels.
- https://cdn.elifesciences.org/articles/87742/elife-87742-fig2-figsupp1-data2-v1.zip
Figure 3 with 2 supplements
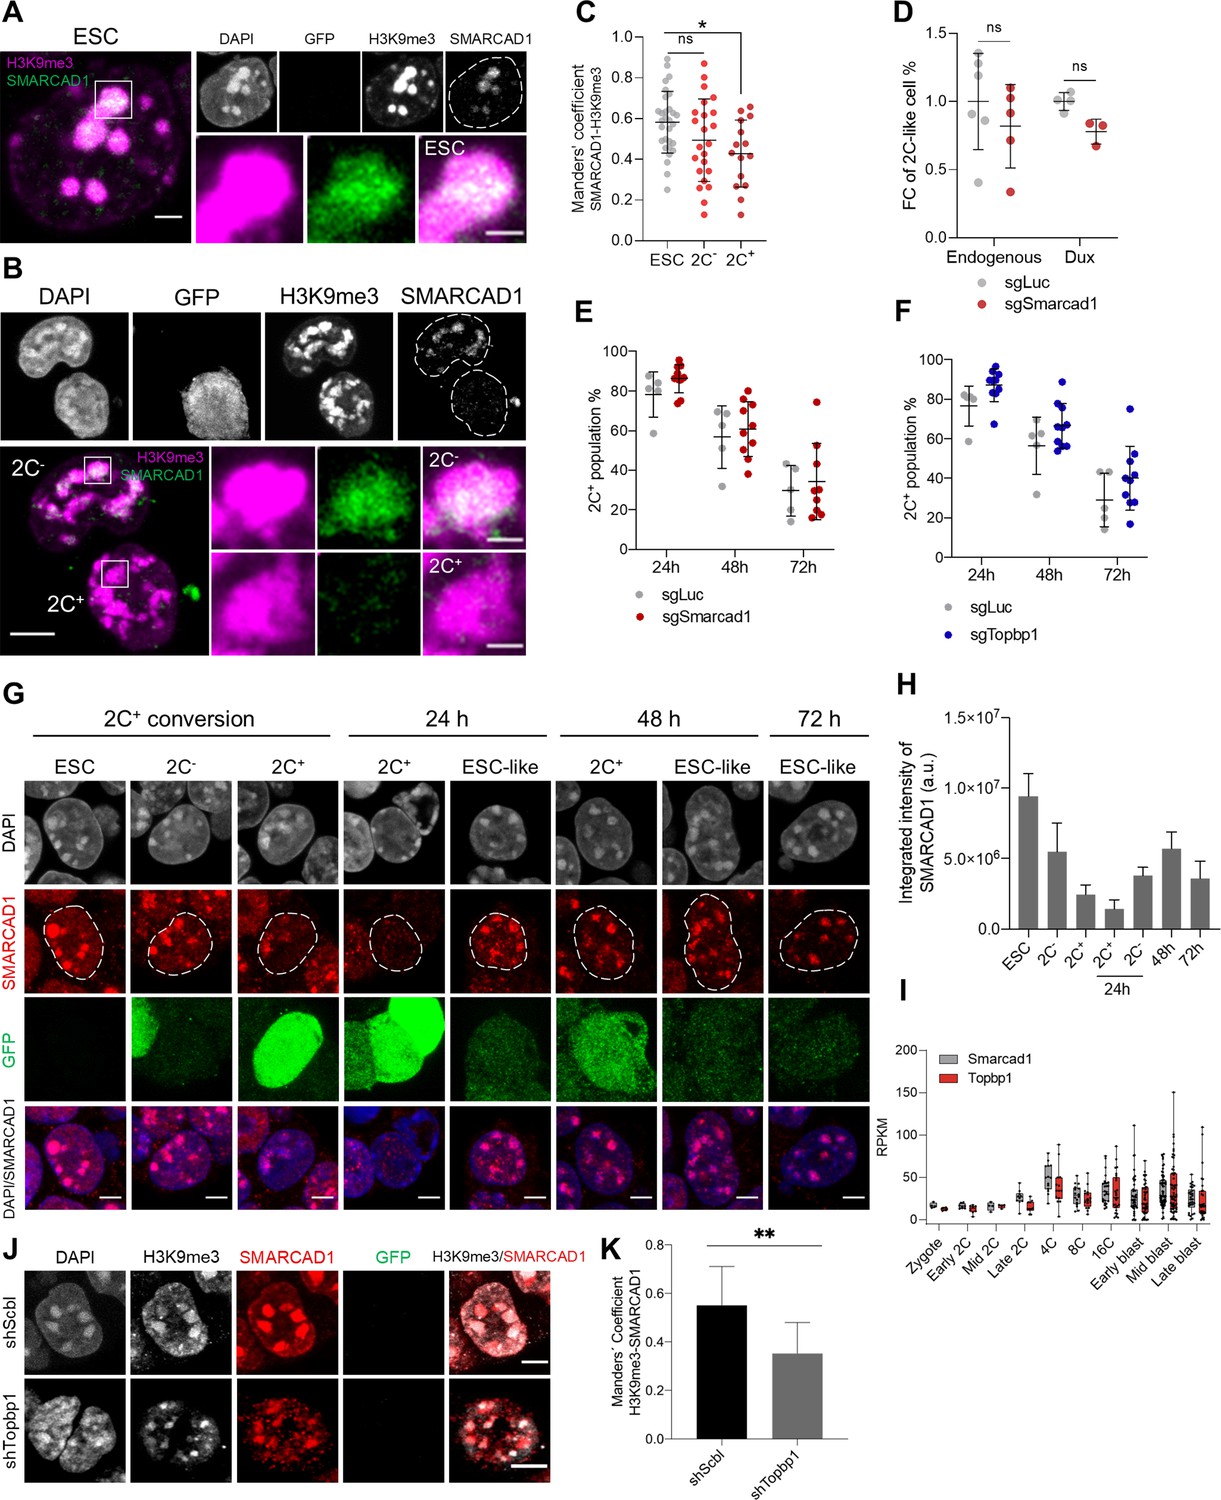
SMARCAD1 associates with H3 lysine 9 trimethylation (H3K9me3) in embryonic stem cells (ESCs) and its nuclear localization is reduced in the 2C-like state.
(A) Representative immunofluorescence images of H3K9me3 and SMARCAD1 in ESCs. Dashed lines indicate nuclei contour. Scale bar, 2 µm. Zoomed images of H3K9me3 and SMARCAD1 foci are shown for comparisons. Scale bar, 1 µm. (B) Representative immunofluorescence images of H3K9me3 and SMARCAD1 in 2C- and 2C+ cells. Dashed lines indicate nuclei contour. Scale bar, 5 µm. Zoomed images of H3K9me3 and SMARCAD1 foci are shown for comparisons. Scale bar, 1 µm. (C) Co-localization analysis showing Manders’ coefficient between SMARCAD1 and H3K9me3 in ESCs, 2C- and 2C+ cells. Data are presented as scatter dot plots with line at mean ± SD from ESC (n=30), 2C- (n=23), 2C+ (n=15) SMARCAD1-H3K9me3 foci. p>0.05ns, p=0.0124* by one-way ANOVA (Dunnett’s multiple comparisons test). (D) Impact of targeting Smarcad1 (sgSmarcad1) on the endogenous fluctuation and the Dux-induced 2C-like conversion. Data are presented as scatter dot plots with line at mean ± SD (n≥3 independent CRISPR-Cas9 KO rounds). p=0.4286ns, p=0.0571ns by Mann-Whitney test. (E) Impact of targeting Smarcad1 (sgSmarcad1) on the 2C-like cell percentage during the 2C+ exit (24 hr, 48 hr, and 72 hr). Data are presented as scatter dot plots with line at mean ± SD (n=5 independent CRISPR-Cas9 KO rounds). Individual points indicate scores of technical replicates. p=0.1174ns at 24 hr, p=0.6158ns at 48 hr, p=0.6441ns at 72 hr by multiple t-test. (F) Impact of targeting Topbp1 (sgTopbp1) on the 2C-like cell percentage during the 2C+ exit (24 hr, 48 hr, and 72 hr). Data are presented as scatter dot plots with line at mean ± SD (n=5 independent CRISPR-Cas9 KO rounds). Individual points indicate scores of technical replicates. p=0.0503ns at 24 hr, p=0.1589ns at 48 hr, p=0.2166ns at 72 hr by multiple t-test. (G) Representative immunofluorescence images of SMARCAD1 and the 2C::EGFP reporter along the ESCs to 2C+ reprogramming and during the 2C+ exit (24 hr, 48 hr, and 72 hr). Dashed lines indicate nuclei contour. Scale bar, 4 µm. (H) SMARCAD1 integrated intensity analysis along the conversion of ESCs into 2C+ cells and during the 2C+ exit (24 hr, 48 hr, and 72 hr). Data are presented as mean ± SD. (I) Single-cell RNA-seq (scRNA-seq) expression profile of Smarcad1 and Topbp1 in preimplantation mouse embryos. Data are presented as min-max boxplots with line at median. Each dot represents a single cell. scRNA-seq data was obtained from Deng et al., 2014. RPKM, reads per kilobase of transcript per million mapped reads. (J) Representative immunofluorescence images of H3K9me3, SMARCAD1, and the 2C::EGFP reporter in Topbp1 knockdown (shTopbp1) and control scramble (shScbl) cells. Scale bar, 5 μm. (K) Co-localization analysis showing Manders’ coefficient between H3K9me3 and SMARCAD1 in Topbp1 knockdown (shTopbp1) and control scramble (shScbl) cells. Data are presented as mean ± SD (n=2 independent cultures). p=0.0066** by unpaired two-tailed Student’s t-test.
Figure 3—figure supplement 1
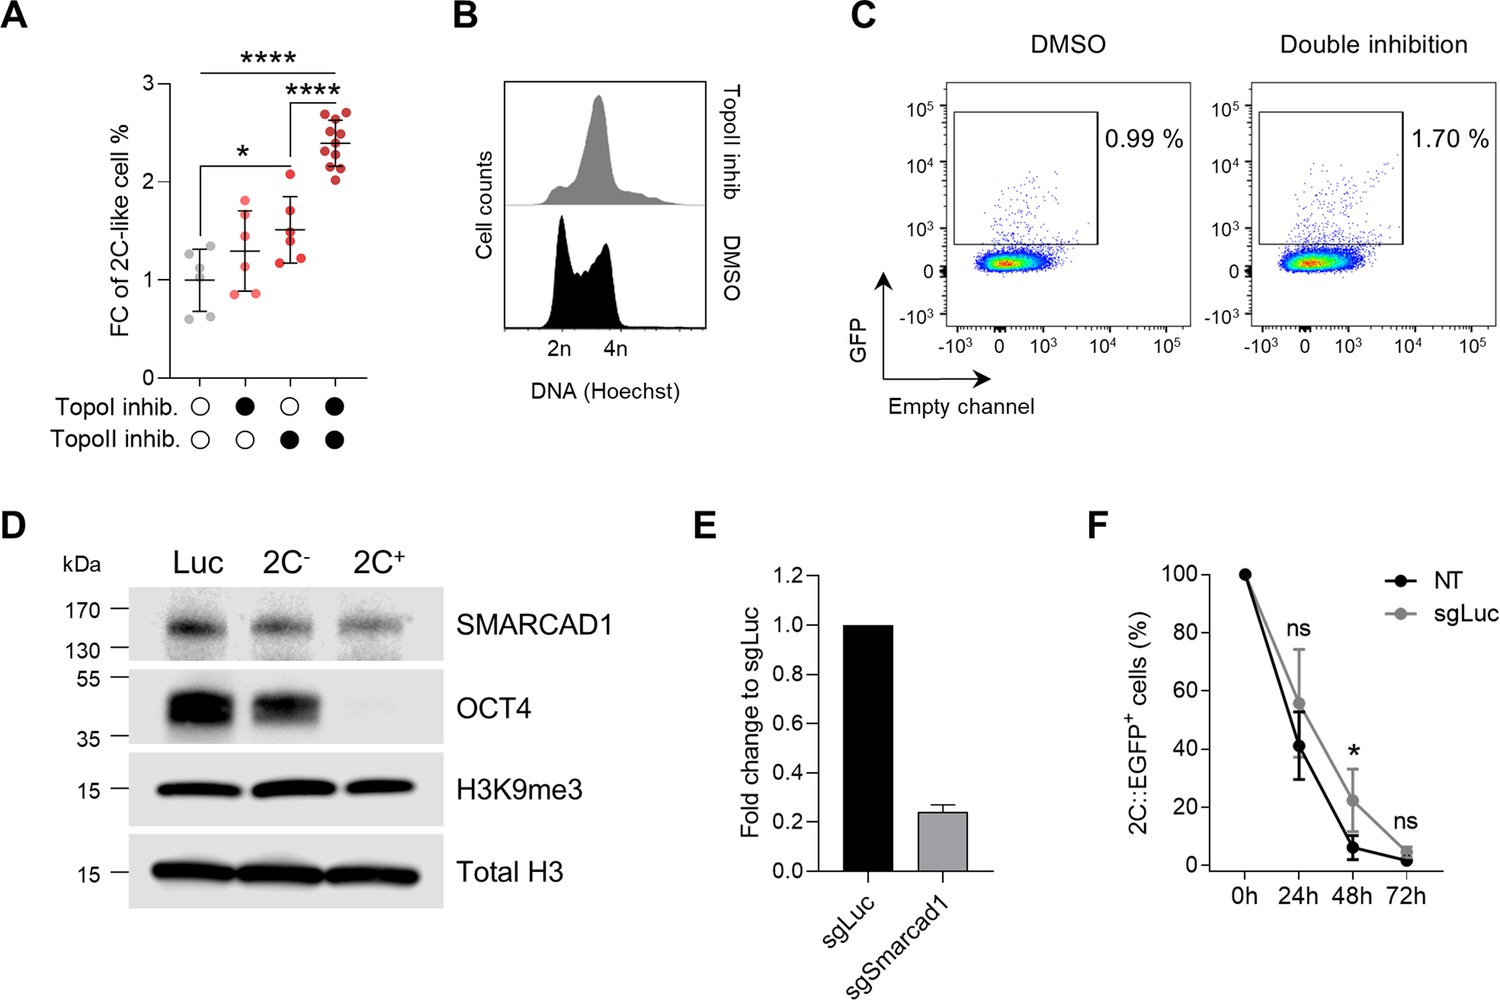
Pharmacological and genetic perturbations in 2C-like cells.
(A) Quantification of the percentage of 2C+ cells after inhibition of DNA topoisomerase I (TopoI inhib.), DNA topoisomerase II (TopoII inhib.) or its combined inhibition. Data are presented as scatter dot plots with line at mean ± SD (n≥3 independent experiments). p=0.0421*, p<0.0001**** by one-way ANOVA (Tukey’s multiple comparisons test). (B) Cell cycle profile of DMSO and DNA topoisomerase II inhibited embryonic stem cells (ESCs). (C) Representative fluorescence-activated cell sorting (FACS) plots showing GFP+ cells in DMSO and double DNA topoisomerase inhibition conditions. (D) Representative western blots for luciferase (Luc), 2C- and 2C+ cells. SMARCAD1, OCT4, H3K9me3, and total histone H3 blots are shown. (E) Quantitative real-time PCR (qRT-PCR) of Smarcad1 in control luciferase (sgLuc) and Smarcad1-targeted (sgSmarcad1) mCherry+ sorted ESCs 48 hr after CRISPR-Cas9 single guide RNA (sgRNA) delivery. Data are presented as mean ± SD from two replicates transfected in independent rounds of sgRNA delivery. Independent sgRNAs targeting the same target gene were used in each round. (F) Quantification of the percentage of 2C-like cells 24 hr, 48 hr, and 72 hr after 2C+ cell sorting in non-transfected (NT) and luciferase-targeted (sgLuc) ESCs. Data are presented as mean ± SD. p>0.05ns, p=0.0463* by two-way ANOVA (Sidak’s multiple comparisons test). Original membranes corresponding to D are provided as a source data file (Figure 3—figure supplement 1—source data 1 and Figure 3—figure supplement 1—source data 2).
-
Figure 3—figure supplement 1—source data 1
Original membranes corresponding to Figure 3—figure supplement 1D.
- https://cdn.elifesciences.org/articles/87742/elife-87742-fig3-figsupp1-data1-v1.zip
-
Figure 3—figure supplement 1—source data 2
Original membranes corresponding to Figure 3—figure supplement 1D with labels.
- https://cdn.elifesciences.org/articles/87742/elife-87742-fig3-figsupp1-data2-v1.zip
Figure 3—figure supplement 2
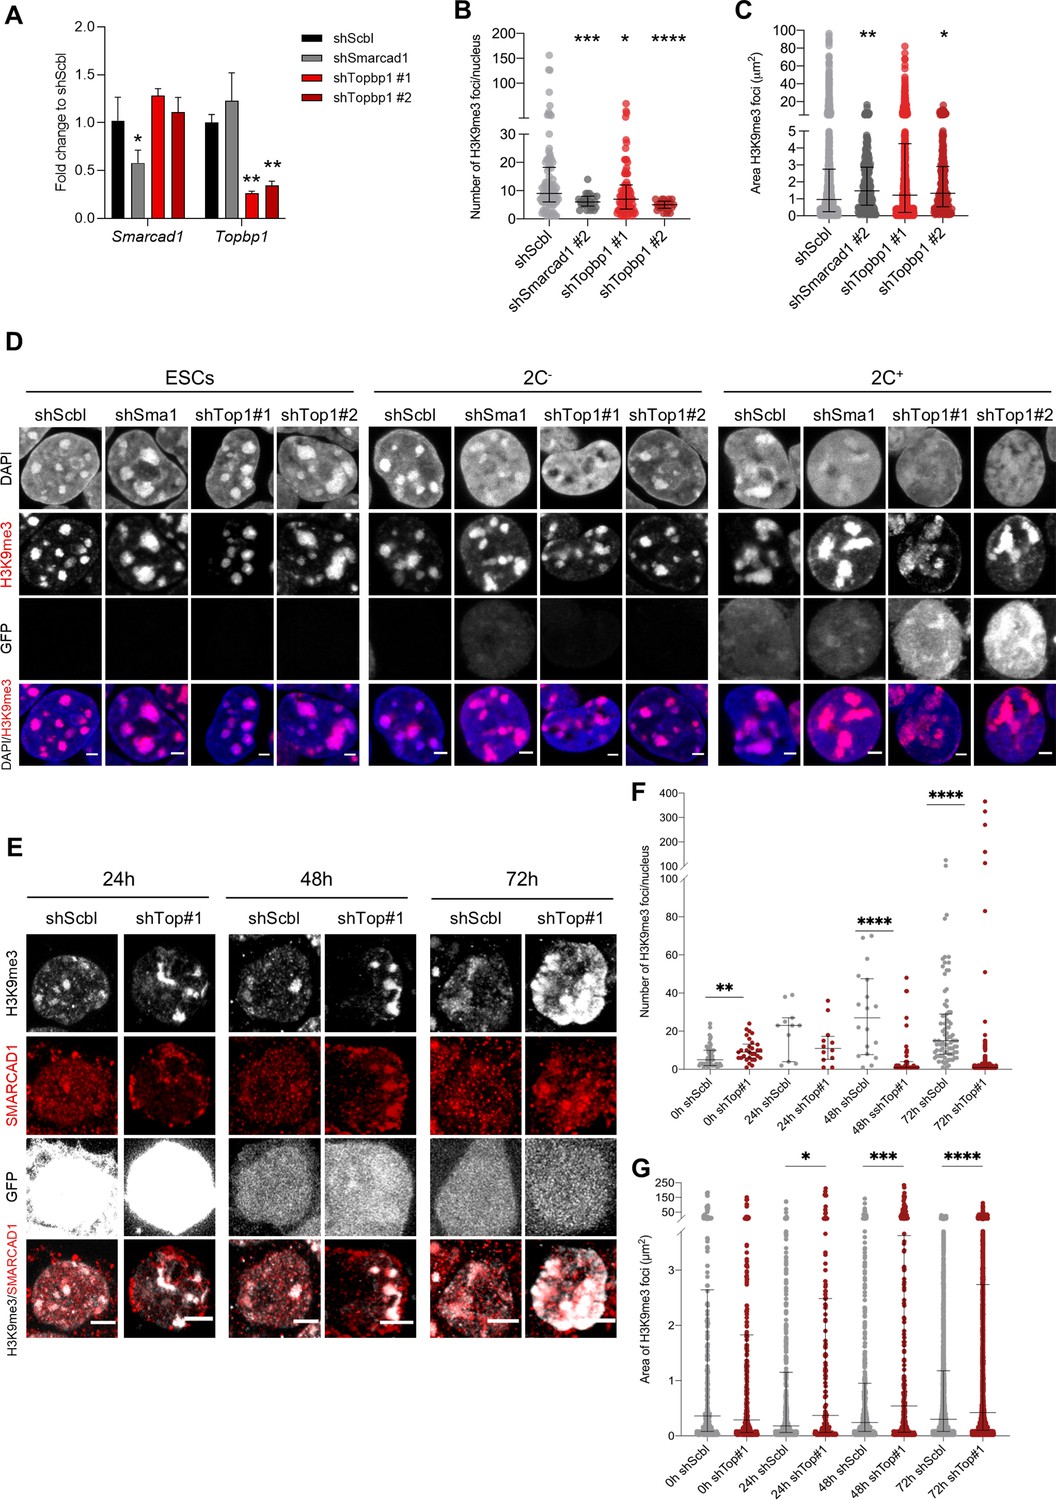
H3 lysine 9 trimethylation (H3K9me3) foci analysis in Smarcad1 and Topbp1 knockdown embryonic stem cells (ESCs), 2C- and 2C+ cells.
(A) Quantitative real-time PCR (qRT-PCR) of Smarcad1 and Topbp1 in Smarcad1 knockdown (shSmarcad1), Topbp1 knockdown (shTopbp1 #1, and shTopbp1 #2) and control scramble (shScbl) ESCs. Data are presented as mean ± SD (n=3 independent experiments). p=0.0268*, p=0.0010**, p=0.0020** by one-way ANOVA (Dunnett’s multiple comparisons test). (B) Quantification of the number of H3K9me3 foci in shScbl, shSmarcad1, shTopbp1 #1, and shTopbp1 #2 ESCs. Data are presented as scatter dot plots with line at median ± interquartile range (n>3 independent cultures; shScbl=90 cells, shSmarcad1=25 cells, shTopbp1 #1=81 cells, and shTopbp1 #2=22 cells). p=0.0009***, p=0.0217*, p<0.0001**** by Mann-Whitney test. (C) Quantification of H3K9me3 foci area in shScbl, shSmarcad1, shTopbp1 #1, and shTopbp1 #2 ESCs. Data are presented as scatter dot plots with line at median ± interquartile range (n>3 independent cultures; shScbl=1241 foci, shSmarcad1=281 foci, shTopbp1 #1=1004 foci, and shTopbp1 #2=225 foci). p=0.0016**, p=0.2260ns, p=0.0103* by Mann-Whitney test. (D) Representative immunofluorescence images of H3K9me3 and the 2C::EGFP reporter during the ESCs to 2C+ reprogramming in Smarcad1 knockdown (shSmarcad1), Topbp1 knockdown (shTopbp1 #1 and shTopbp1 #2) and control scramble (shScbl) cells. Scale bar, 2 μm. (E) Representative immunofluorescence images of H3K9me3, SMARCAD1, and the 2C::EGFP reporter during the 2C+ exit (24 hr, 48 hr, and 72 hr) in Topbp1 knockdown (shTopbp1 #1) and control scramble (shScbl) cells. Scale bar, 5 μm. (F) Quantification of the number of H3K9me3 foci in 2C+ cells in shScbl and shTopbp1 #1 (shTop#1) samples at 0 hr, 24 hr, 48 hr, and 72 hr after 2C-like state exit. Data are presented as scatter dot plots with line at median ± interquartile range (n=2 independent cultures; shScbl 0 hr=49 cells, shTop#1 0 hr=30 cells, shScbl 24 hr=13 cells, shTop#1 24 hr=12 cells, shScbl 48 hr=18 cells, shTop#1 48 hr=48 cells, shScbl 72 hr=83 cells, shTop#1 72 hr=515 cells). p=0.0086**, p=0.1546ns, p<0.0001****, p<0.0001**** by Mann-Whitney test. (G) Quantification of H3K9me3 foci area in 2C+ cells in shScbl and shTopbp1 #1 (shTop#1) samples at 0 hr, 24 hr, 48 hr, and 72 hr after 2C-like state exit. Data are presented as scatter dot plots with line at median ± interquartile range (n=2 independent cultures; shScbl 0 hr=342 foci, shTop#1 0 hr=304 foci, shScbl 24 hr=481 foci, shTop#1 24 hr=158 foci, shScbl 48 hr=537 foci, shTop#1 48 hr=271 foci, shScbl 72 hr=2634 foci, shTop#1 72 hr=3477 foci). p=0.1037ns, p=0.0163*, p=0.0002***, p<0.0001**** by Mann-Whitney test.
Figure 4 with 1 supplement
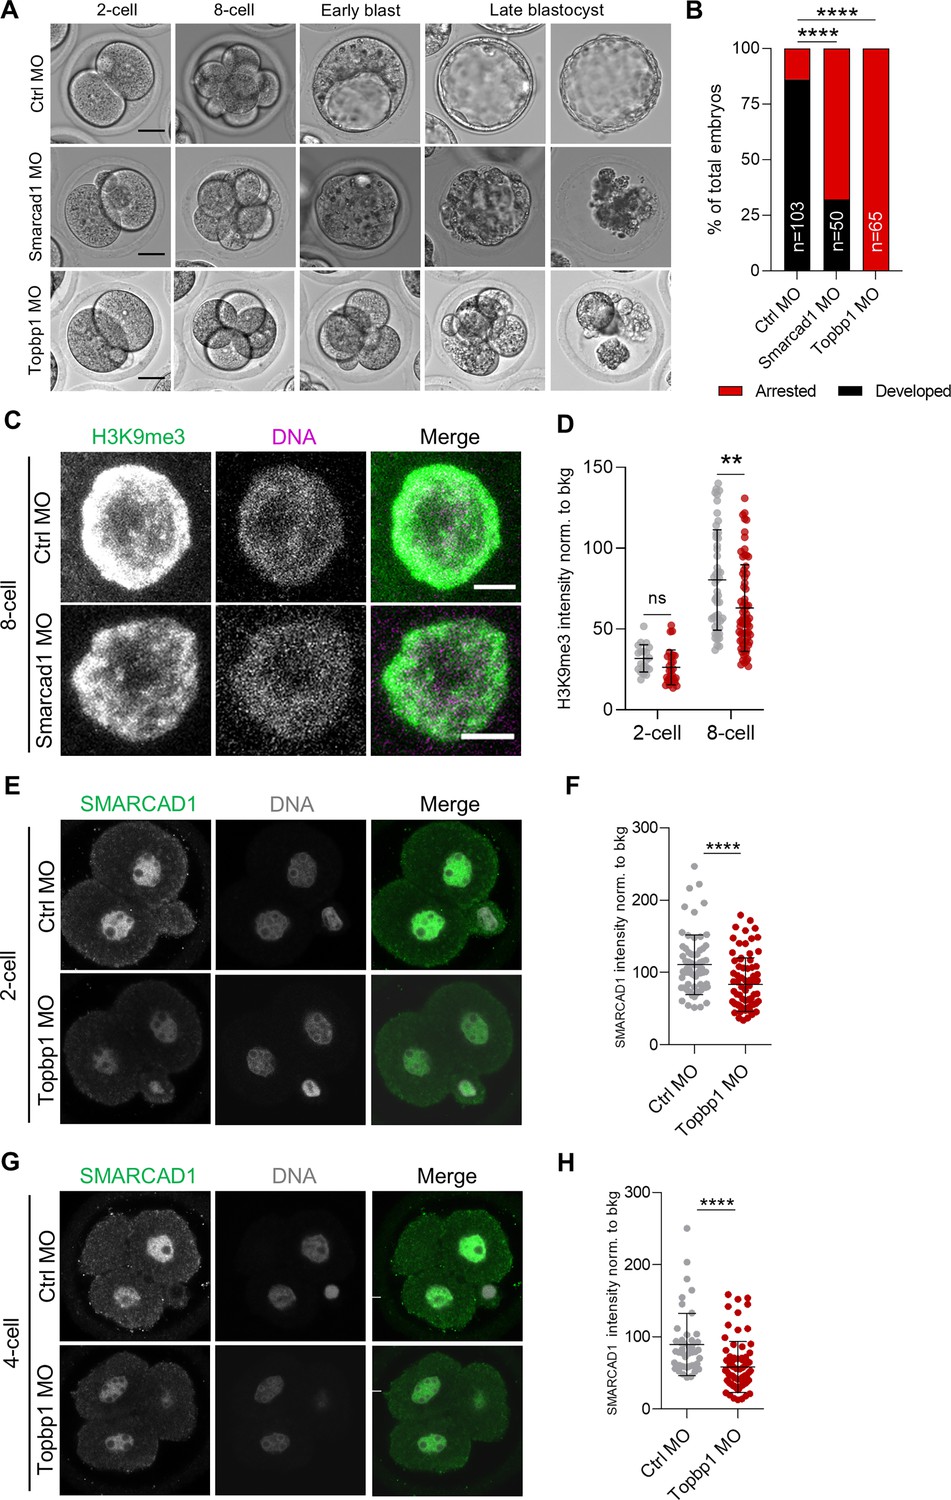
SMARCAD1 and TOPBP1 downregulation impairs embryo development.
(A) Representative embryos from control (Ctrl), Smarcad1 and Topbp1 morpholino-injected (MO) groups from 2-cell (E1.5) to late blastocyst stage (E5.5). Scale bar, 20 µm. (B) Quantification of the percentage of arrested or fully developed embryos at late blastocyst stage (E4.5). p<0.0001**** by Fisher’s exact test (Ctrl MO=103 embryos, Smarcad1 MO=50 embryos, Topbp1 MO=65 embryos). (C) Representative immunofluorescence images of H3 lysine 9 trimethylation (H3K9me3) in Ctrl and Smarcad1 MO embryos at 8-cell stage (E2.5) embryos. Representative blastomere nuclei are shown. Scale bar, 5 µm. (D) Quantification of H3K9me3 mean fluorescence intensity in control (Ctrl, gray dots) and Smarcad1 MO (red dots) embryos at 2-cell (E1.5) and 8-cell stage (E2.5). Data are presented as scatter dot plots with line at mean ± SD (2-cell: Ctrl MO=12 embryos, Smarcad1 MO=15 embryos; 8-cell: Ctrl MO=16 embryos, Smarcad1 MO=20 embryos). H3K9me3 signal was normalized to the average background signal. p=0.0618ns and p=0.0016** by unpaired two-tailed Student’s t-test. (E) Representative immunofluorescence images of SMARCAD1 in Ctrl and Topbp1 MO embryos at 2-cell stage (E1.5) embryos. Representative blastomere nuclei are shown. Scale bar, 10 µm. (F) Quantification of SMARCAD1 mean fluorescence intensity in Ctrl and Topbp1 MO embryos at 2-cell (E1.5). Data are presented as scatter dot plots with line at mean ± SD (Ctrl MO=38 embryos, Topbp1 MO=44 embryos). SMARCAD1 signal was normalized to the average background signal. p<0.0001**** by unpaired two-tailed Student’s t-test. (G) Representative immunofluorescence images of SMARCAD1 in Ctrl and Topbp1 MO embryos at 4-cell stage (E2.0) embryos. Representative blastomere nuclei are shown. Scale bar, 10 µm. (H) Quantification of SMARCAD1 mean fluorescence intensity in Ctrl and Topbp1 MO embryos arrested at 4-cell. Data are presented as scatter dot plots with line at mean ± SD (Ctrl MO=20 embryos, Topbp1 MO=31 embryos). SMARCAD1 signal was normalized to the average background signal. p<0.0001**** by unpaired two-tailed Student’s t-test.
Figure 4—figure supplement 1
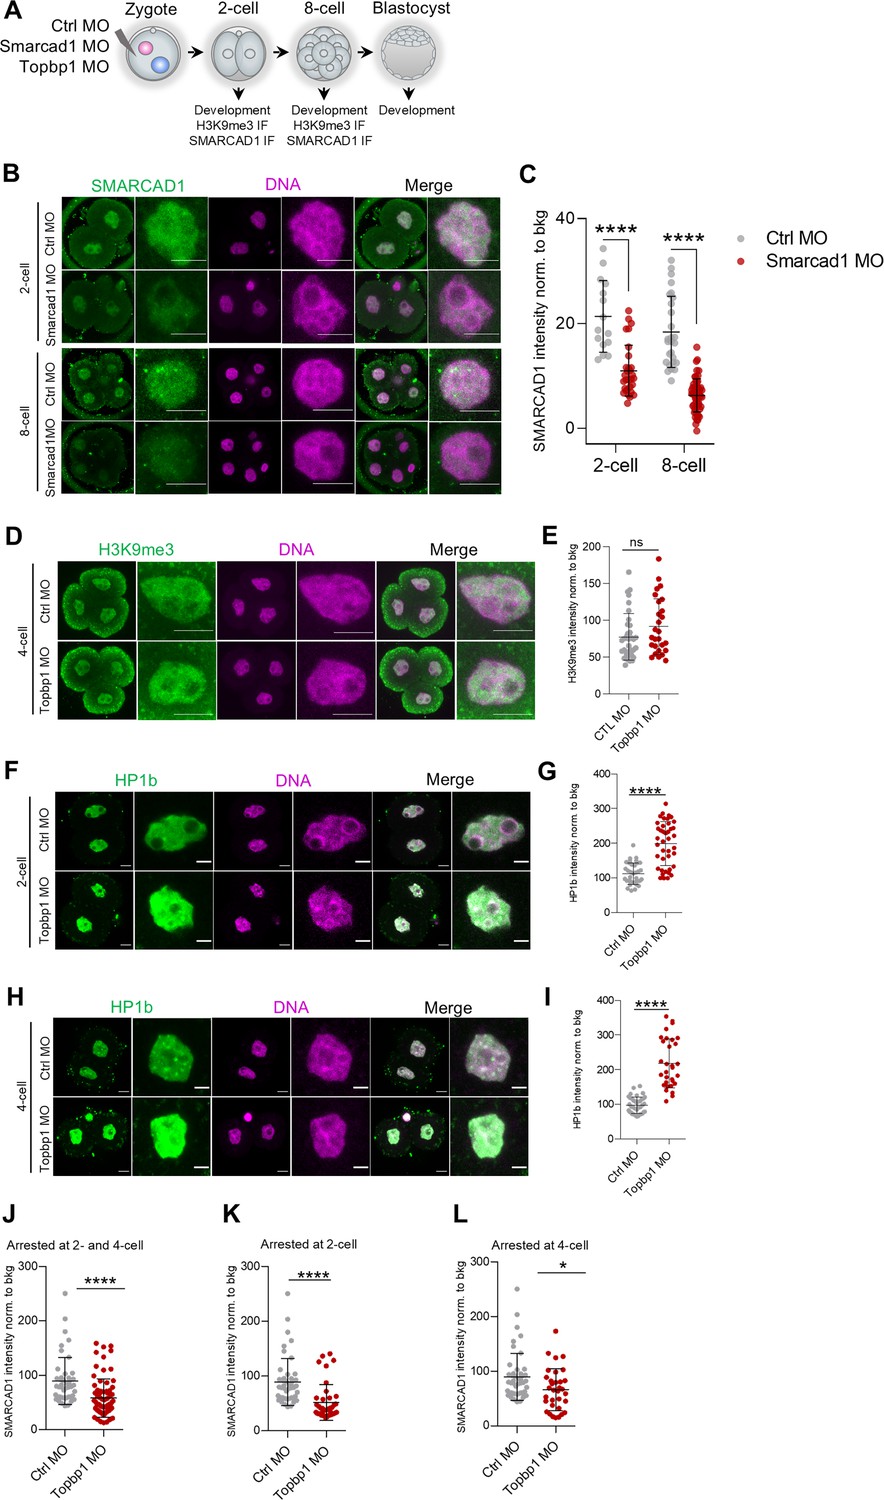
SMARCAD1 downregulation in mouse embryos.
(A) Schematic representation of the experimental design to assess SMARCAD1 and TOPBP1 function in early mouse embryo development. Morpholino antisense oligos (MOs) targeting Smarcad1, Topbp1, and a scrambled control (Ctrl) sequence were microinjected into the cytoplasm of zygotes (E0.5 embryos). Embryo development was monitored daily from the 2-cell stage (E1.5) until the late blastocyst stage (E5.5). (B) Representative immunofluorescence images of SMARCAD1 in Ctrl and Smarcad1 MO embryos at 2-cell (E1.5) and 8-cell stage (E2.5) embryos. Representative blastomere nuclei are shown. Scale bar, 5 µm. (C) Quantification of SMARCAD1 mean fluorescence intensity in Ctrl and Smarcad1 MO embryos at 2-cell (E1.5) and 8-cell stage (E2.5). Data are presented as scatter dot plots with line at mean ± SD (2-cell: Ctrl MO=8 embryos, Smarcad1 MO=15 embryos; 8-cell: Ctrl MO=11 embryos, Smarcad1 MO=15 embryos). SMARCAD1 signal was normalized to the average background signal. p<0.0001**** by unpaired two-tailed Student’s t-test. (D) Representative immunofluorescence images of H3 lysine 9 trimethylation (H3K9me3) in Ctrl and Topbp1 MO embryos at 4-cell (E2.0) embryos. Representative blastomere nuclei are shown. Scale bar, 5 µm. (E) Quantification of H3K9me3 mean fluorescence intensity in Ctrl and Topbp1 MO embryos at 4-cell (E 2.0) embryos. Data are presented as scatter dot plots with line at mean ± SD (Ctrl MO=35 embryos, Topbp1 MO=27 embryos). H3K9me3 signal was normalized to the average background signal. (F) Representative immunofluorescence images of HP1β in Ctrl and Topbp1 MO embryos at 2-cell (E1.5) embryos. Representative blastomere nuclei are shown. Scale bar, 10 µm. (G) Quantification of HP1β mean fluorescence intensity in Ctrl and Topbp1 MO embryos at 2-cell (E1.5). Data are presented as scatter dot plots with line at mean ± SD (Ctrl MO=20 embryos, Topbp1 MO=21 embryos). HP1β signal was normalized to the average background signal. p<0.0001**** by unpaired two-tailed Student’s t-test. (H) Representative immunofluorescence images of HP1β in Ctrl and Topbp1 MO embryos at 4-cell (E2.0) embryos. Representative blastomere nuclei are shown. Scale bar, 10 µm. (I) Quantification of HP1β mean fluorescence intensity in Ctrl and Topbp1 MO embryos at 4-cell (E2.0). Data are presented as scatter dot plots with line at mean ± SD (Ctrl MO=16 embryos, Topbp1 MO=13 embryos). HP1β signal was normalized to the average background signal. p<0.0001**** by unpaired two-tailed Student’s t-test. (J) Quantification of SMARCAD1 mean fluorescence intensity in Ctrl and Topbp1 MO embryos arrested at 2-cell and 4-cell stage (E2.0). Data are presented as scatter dot plots with line at mean ± SD (Ctrl MO=20 embryos, Topbp1 MO=31 embryos). SMARCAD1 signal was normalized to the average background signal. p<0.0001**** by unpaired two-tailed Student’s t-test. (K) Quantification of SMARCAD1 mean fluorescence intensity in Ctrl and Topbp1 MO embryos arrested at 2-cell stage. Data are presented as scatter dot plots with line at mean ± SD (Ctrl MO=20 embryos, Topbp1 MO=21 embryos). SMARCAD1 signal was normalized to the average background signal. p<0.0001**** by unpaired two-tailed Student’s t-test. (L) Quantification of SMARCAD1 mean fluorescence intensity in Ctrl and Topbp1 MO embryos arrested at 4-cell stage. Data are presented as scatter dot plots with line at mean ± SD (Ctrl MO=20 embryos, Topbp1 MO=11 embryos). SMARCAD1 signal was normalized to the average background signal. p<0.0174* by unpaired two-tailed Student’s t-test.
Tables
Table 1
List of top oligos used for cloning shRNAs.
| shRNA name | Top oligo (5’ to 3’) |
|---|---|
| shScbl | GTCACGATAAGACAATGAT |
| shSmarcad1 | CCTCCCTTCTAAACCAAAGTT |
| shTopbp1 #1 | CCTGAATTTGAATCACTGGTT |
| shTopbp1 #2 | GCTCTTAGAAACTGCGAGAAT |
Table 2
List of oligos used for quantitative real-time PCR (qRT-PCR).
| Gene name | Forward (5’ to 3’) | Reverse (5’ to 3’) |
|---|---|---|
| Dux | GGAGAAGAGATACCTGAGCTTCAA | AATCTGAGACCCCCATTCG |
| MERVL | CTCTACCCACTTGGACCATATGAC | GAGGCTCCAAACAGCATCTCTA |
| MajSat | GCACACTGAAGGACCTGGAATATG | GATTTCGTCATTTTTCAAGTCGTC |
| Zscan4 | GAGATTCATGGAGAGTCTGACTGATGAGTG | GCTGTTGTTTCAAAAGCTTGATGACTTC |
| Nelfa | TGCTAGTGGACACAGTGTTCGA | TTGAAGCGTGTCCACTGGCC |
| Zfp352 | CCAGGACCCTGCAATACACA | TACAGGTTGTCTCCTGTGTGC |
| Eif1a-like | AACAGGCGCAGAGGTAAAAA | CTTATATGGCACAGCCTCCT |
| Smarcad1 | AAATTCAGCAAAGACACAGTGATT | CAGAAGGAAGGTCATGGGATT |
| Topbp1 | GCGCCACCAGCAATGTG | TGTACAGGATACAGTTACGTCAGACATTA |
| Gapdh | TCAAGAAGGTGGTGAAGCAGG | ACCAGGAAATGAGCTTGACAAA |
| β-actin | GCTGTATTCCCCTCCATCGTG | CACGGTTGGCCTTAGGGTTCAG |
Table 3
List of top oligos used for cloning single guide RNAs (sgRNAs).
| sgRNA name | Genomic sequence | Strand | sgRNA target sequence | PAM |
|---|---|---|---|---|
| sgSmarcad1 #1 | NC_000072.6 | Antisense | AACAGAGCACATTTAAACTG | GGG |
| sgSmarcad1 #2 | NC_000072.6 | Sense | AGTCTGTAAAACAGCCGCGA | GGG |
| sgTopbp1 #1 | NC_000075.6 | Sense | GAAGCAGAGTGAGCTCAATG | GGG |
| sgTopbp1 #2 | NC_000075.6 | Antisense | GTGATTTGCTAAGAATACCA | AGG |
| sgLuciferase | ACAACTTTACCGACCGCGCC |
Additional files
-
Supplementary file 1
Spreadsheet containing proteomic data.
(A) List of protein groups identified by mass spectrometry in –EdU, Luc, 2C- and 2C+ cells. (B) Input data for Significance Analysis of INTeractome (SAINT) analysis. (C) SAINT results of the comparison 2C- vs Luc and 2C+ vs Luc. (D) SAINT results of the comparison Luc vs 2C- and 2C+ vs 2C-. (E) SAINT results of the comparison Luc vs 2C+ and 2C- vs 2C+. (F) Total number of peptide spectrum matches (PSM) per protein in the different cells and conditions tested.
- https://cdn.elifesciences.org/articles/87742/elife-87742-supp1-v1.xlsx
-
MDAR checklist
- https://cdn.elifesciences.org/articles/87742/elife-87742-mdarchecklist1-v1.pdf
Download links
A two-part list of links to download the article, or parts of the article, in various formats.
Downloads (link to download the article as PDF)
Open citations (links to open the citations from this article in various online reference manager services)
Cite this article (links to download the citations from this article in formats compatible with various reference manager tools)
SMARCAD1 and TOPBP1 contribute to heterochromatin maintenance at the transition from the 2C-like to the pluripotent state
eLife 12:RP87742.
https://doi.org/10.7554/eLife.87742.3


