β-Arrestin-dependent and -independent endosomal G protein activation by the vasopressin type 2 receptor
- Wellcome-Wolfson Institute for Experimental Medicine, School of Medicine, Dentistry and Biomedical Sciences, Queen’s University Belfast, United Kingdom
- School of Pharmacy, Queen’s University Belfast, United Kingdom
- Department of Molecular Pathobiology, New York University College of Dentistry, United States
- NYU Pain Research Center, New York University College of Dentistry, United States
Figures
Figure 1 with 1 supplement
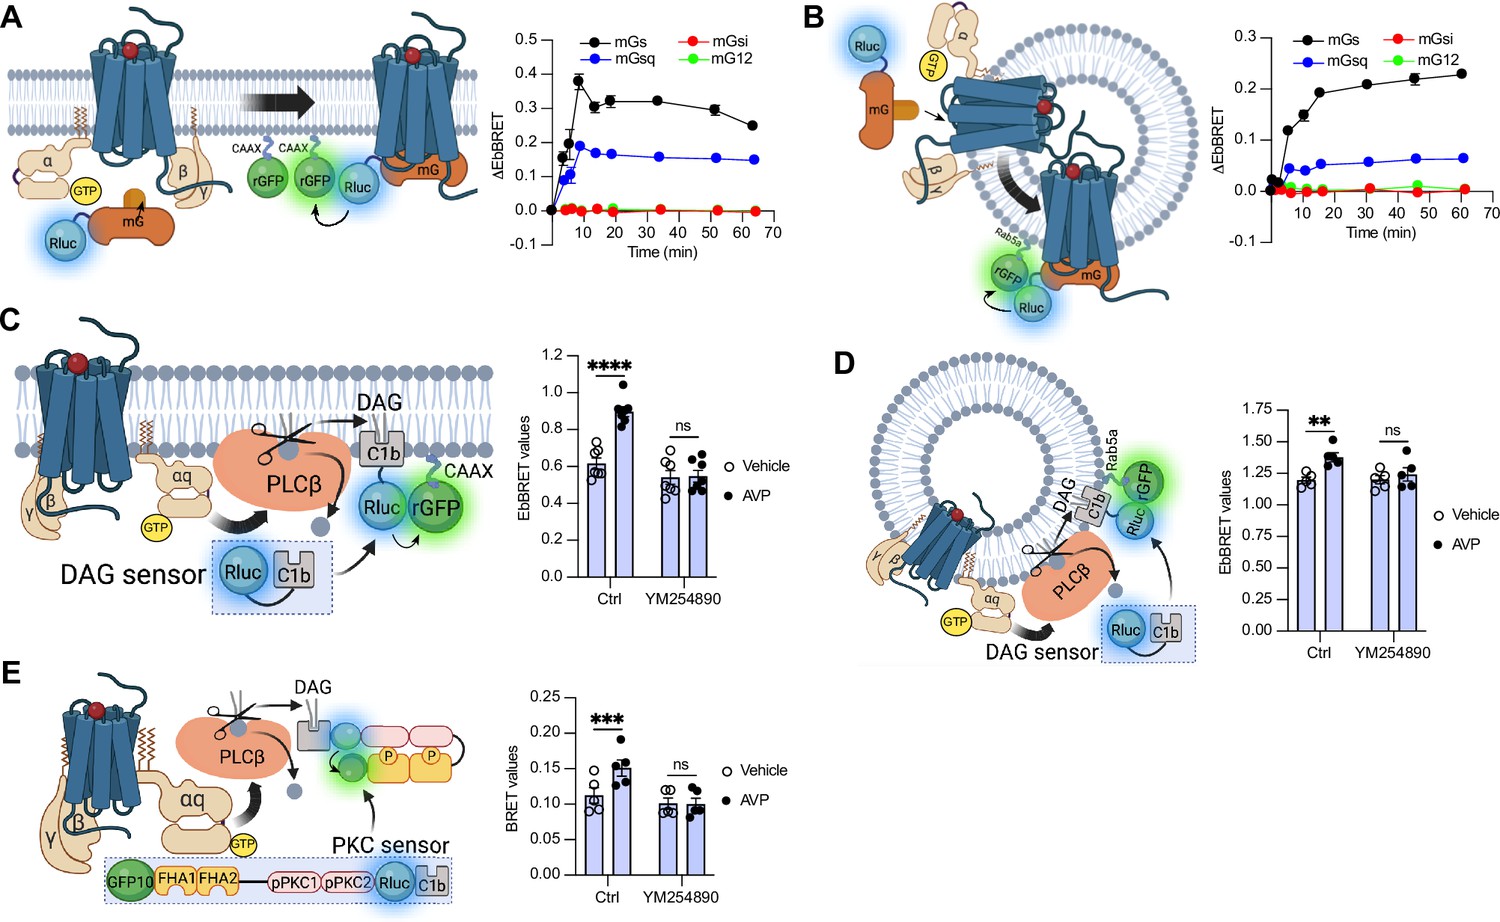
Activation of Gαs and Gαq at plasma membrane and early endosomes by vasopressin type 2 receptor (V2R) monitored by bioluminescence resonance energy transfer (BRET).
(A) Left: Illustration of enhanced bystander bioluminescence resonance energy transfer (EbBRET) biosensors used to monitor G protein activation at the plasma membrane. Right: Kinetics of the recruitment of mG proteins at the plasma membrane upon stimulation of V2R with 1 μM arginine vasopressin (AVP) or vehicle. (B) Left: Illustration of EbBRET biosensors used to monitor G protein activation at the early endosomes. Right: Kinetics of the recruitment of mG proteins to early endosomes upon stimulation of V2R with 1 μM AVP. (C) Left: Illustration of the BRET-based biosensor used to monitor diacylglycerol (DAG) production at the plasma membrane. Right: DAG generated at the plasma membrane upon a 10-min stimulation of V2R with 1 μM AVP or vehicle in cells pre-treated 30 min with 0.1 μM YM254890 or vehicle. (D) Left: Illustration of the BRET-based biosensor used to monitor DAG production at the early endosomes. Right: DAG generated at early endosomes upon a 10-min stimulation of V2R with 1 μM AVP in cells pre-treated 30 min with 0.1 μM YM254890 or vehicle. (E) Left: Illustration of the BRET-based protein kinase C (PKC) biosensor used to monitor PKC activation. Right: Activation of PKC upon 10 min of stimulation of V2R with 1 μM AVP. For the kinetics, n = 3 (mGs, mGsi, and mGsq) or n = 4 (mG12) independent experiments. For the experiments using the DAG biosensor, n = 7 and n = 5 for measurements at plasma membrane and early endosomes, respectively. For the experiments using the PKC biosensor, n = 5. Asterisks mark statistically significant differences between vehicle and AVP treatments as assessed by two-way analysis of variance (ANOVA) and Sidak’s post hoc test for multiple comparisons (**p ≤ 0.01, ***p ≤ 0.001, ****p ≤ 0.0001). Data are shown as mean ± standard error on mean.
-
Figure 1—source data 1
Raw data on Figure 1.
- https://cdn.elifesciences.org/articles/87754/elife-87754-fig1-data1-v1.xlsx
Figure 1—figure supplement 1
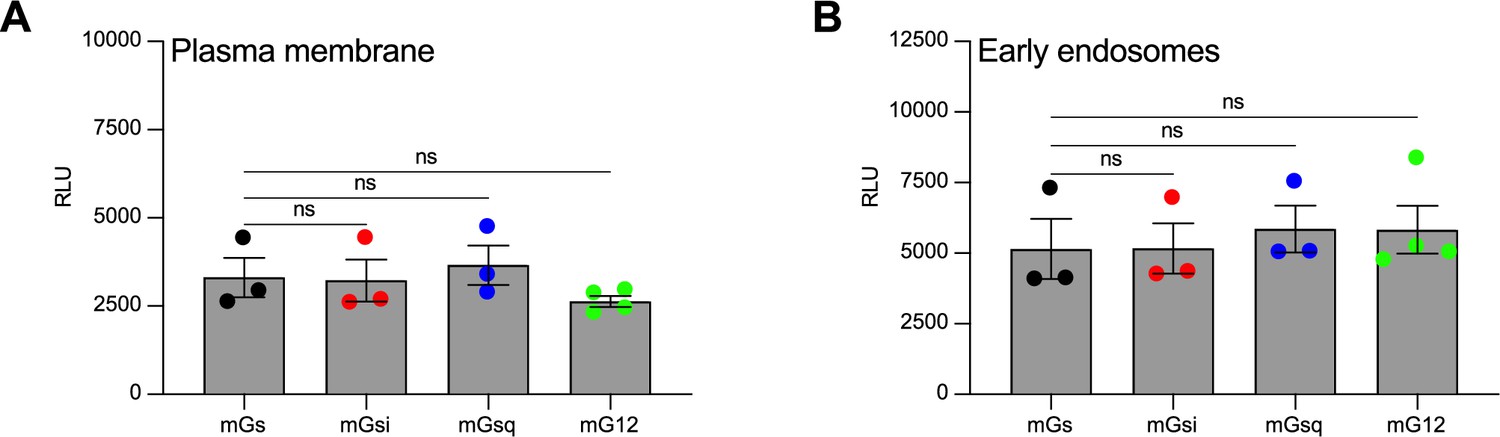
Equivalent expression of mG constructs for the vasopressin type 2 receptor (V2R) kinetics.
(A) Relative luminescence emitted by each of the four Rluc-fused mG constructs expressed by the cells used to monitor the kinetics of the recruitment of mG proteins at the plasma membrane upon V2R stimulation. (B) Relative luminescence emitted by each of the four Rluc-fused mG constructs expressed by the cells used to monitor the kinetics of the recruitment of mG proteins at the early endosomes upon V2R stimulation. n = 3 independent experiments for mGs, mGsi, and mGsq, and n = 4 for mG12. No statistical difference (ns) was detected between the expression of mGs and the other mG proteins using one-way analysis of variance (ANOVA) and Dunnett’s post hoc test for multiple comparisons. Data are shown as mean ± standard error on mean.
Figure 2

Activation of Gαs and Gαq at plasma membrane and early endosomes by vasopressin type 2 receptor (V2R) monitored by confocal microscopy.
(A) Representative confocal microscopy images of cells expressing red fluorescent protein (RFP)-Lck, V2R, and Halo-mGs (left panels), Halo-mGsq (middle panels), or Halo-mGsi (right panels) stimulated for 10 min with vehicle (upper panels) or 1 μM arginine vasopressin (AVP) (bottom panels). (B) Percentages of Lck colocalized with each Halo-mG calculated from five representative images. (C) Representative confocal microscopy images of cells expressing RFP-early endosome antigen 1 (EEA1), V2R, and Halo-mGs (left panels), Halo-mGsq (middle panels), or Halo-mGsi (right panels) stimulated for 45 min with vehicle (upper panels) or 1 μM AVP (bottom panels). (D) Percentages of EEA1 colocalized with each Halo-mG calculated from six representative images. n = 3 independent experiments for Lck and EEA1. Statistical differences between vehicle and AVP treatments were assessed by two-way analysis of variance (ANOVA) and Sidak’s post hoc test for multiple comparisons (****p ≤ 0.0001). Data are shown as mean ± standard error on mean.
-
Figure 2—source data 1
Raw data on Figure 2.
- https://cdn.elifesciences.org/articles/87754/elife-87754-fig2-data1-v1.xlsx
Figure 3 with 2 supplements

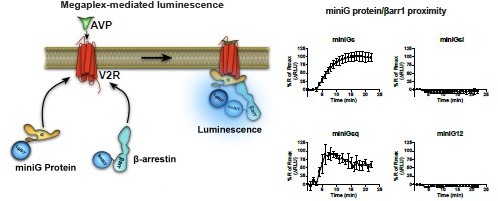
Formation of megaplexes with Gαs or Gαq upon stimulation with arginine vasopressin (AVP).
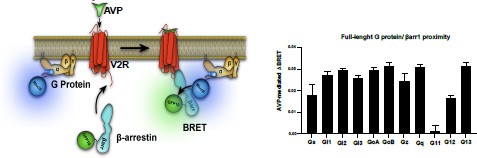
(A) Kinetics of the recruitment of mG proteins at the plasma membrane upon stimulation of V2β2AR with 1 μM AVP. n = 3 for mGs, mGsi, and mGsq, and n = 4 for mG12. (B) Left: Illustration of the enhanced bystander bioluminescence resonance energy transfer (EbBRET) biosensors used to monitor βarr recruitment to the plasma membrane and early endosomes. Right: Kinetics of the recruitment of βarr1 and βarr2 to the plasma membrane (upper panel) and to early endosomes (bottom panel) upon stimulation of vasopressin type 2 receptor (V2R) or V2β2AR with 1 μM AVP. n = 3 for all conditions. (C) Left panel: Illustration of the nanoBiT biosensors used to monitor simultaneous coupling of Gα proteins and βarr1 to G protein-coupled receptors (GPCRs). Right panels: Kinetics of the proximity between SmBiT-βarr1 and LgBiT-mGs (upper panel) or LgBiT-mGsq (bottom panel) upon stimulation of the receptors with 1 μM AVP. n = 3 for all conditions. (D) Representative confocal microscopy images of cells expressing Halo-mGs, strawberry-βarr2, and V2R (left panels), or V2β2AR (right panels) and stimulated for 45 min with vehicle (upper panels) or 1 μM AVP (bottom panels). (E) Representative confocal microscopy images of cells expressing Halo-mGsq, strawberry-βarr2, and V2R (left panels), or V2β2AR (right panels) and stimulated for 45 min with vehicle (upper panels) or 1 μM AVP (bottom panels). (F) Percentage of βarr2 colocalization with mGs or mGsq upon stimulation with 1 μM AVP (six representative images). (G) Percentage of mGs or mGsq puncta observed that were not colocalized with βarr2 upon stimulation with 1 μM AVP (15 representative images). Asterisks mark significant differences between V2R and V2β2AR assessed by two-way analysis of variance (ANOVA) and Sidak’s post hoc test for multiple comparisons (***p ≤ 0.001, ****p ≤ 0.0001). No statistical difference (ns) was detected between mGs and mGsq. Data are shown as mean ± standard error on mean.
-
Figure 3—source data 1
Raw data on Figure 3.
- https://cdn.elifesciences.org/articles/87754/elife-87754-fig3-data1-v1.xlsx
Figure 3—figure supplement 1

Equivalent expression of mG constructs for the V2β2AR kinetics.
Relative luminescence emitted by each of the four Rluc-fused mG constructs expressed by the cells used to monitor the kinetics of the recruitment of mG proteins at the plasma membrane upon V2β2AR stimulation. n = 3 independent experiments for mGs, mGsi, and mGsq, and n = 4 for mG12. No statistical difference (ns) was detected between the expression of mGs and the other mG proteins using one-way analysis of variance (ANOVA) and Dunnett’s post hoc test for multiple comparisons. Data are shown as mean ± standard error on mean.
Figure 3—figure supplement 2
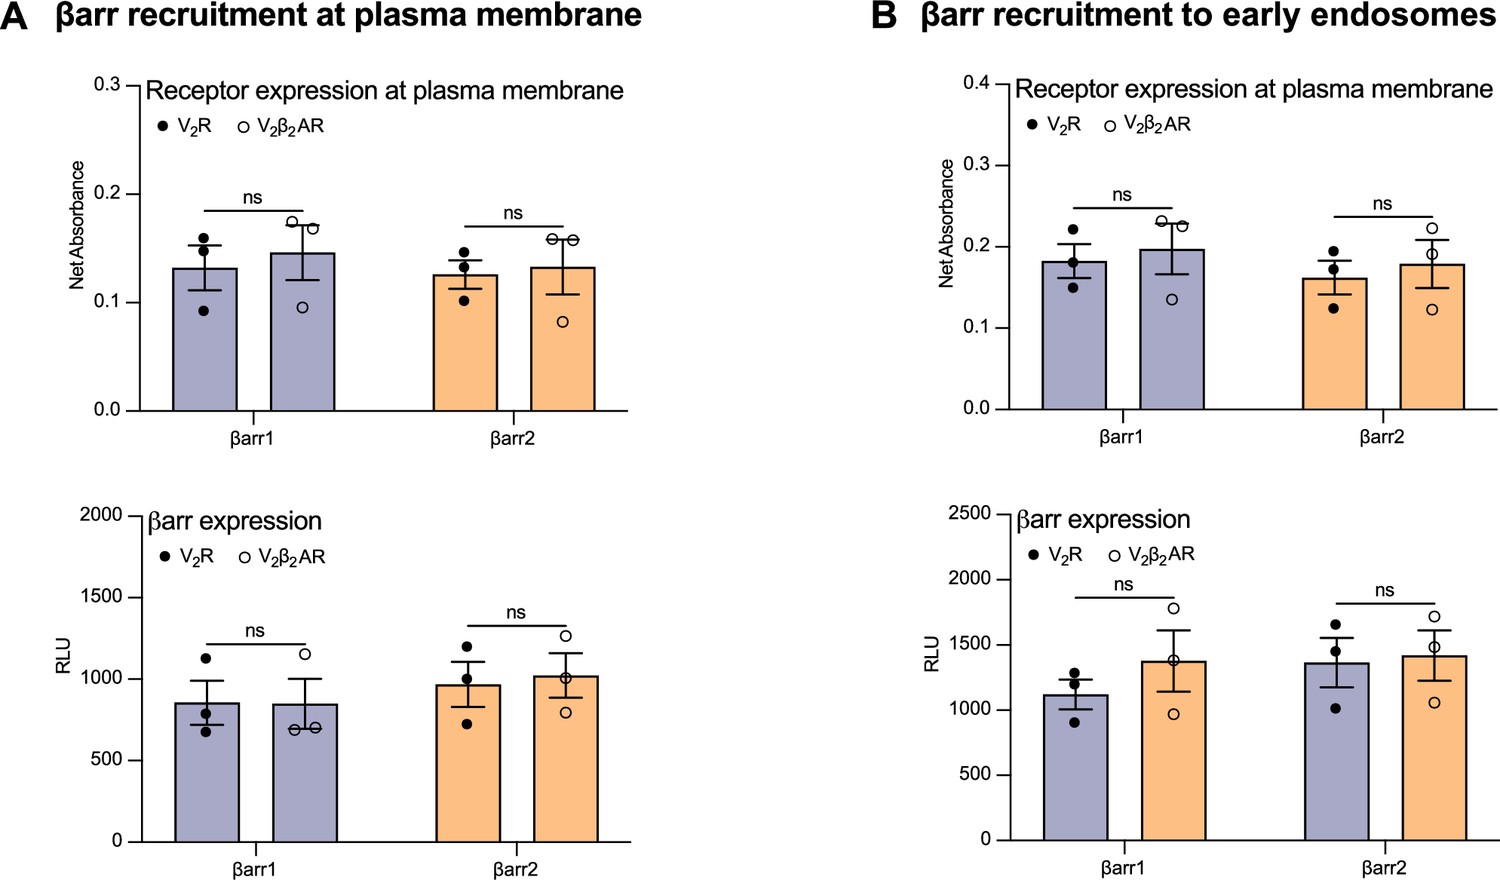
Relative expression of vasopressin type 2 receptor (V2R) and V2β2AR at the plasma membrane and of βarrs.
(A) Relative V2R and V2β2AR expression at the plasma membrane (upper panel) and of βarr1 and βarr2 (bottom panel) in the βarr recruitment at the plasma membrane experiments. (B) Relative V2R and V2β2AR expression at the plasma membrane (upper panel) and of βarr1 and βarr2 (bottom panel) in the βarr recruitment at the early endosomes experiments. n = 3 biological replicates for all conditions. No statistical difference (ns) was detected between V2R and V2β2AR using two-way analysis of variance (ANOVA) and Sidak’s post hoc test for multiple comparisons. Data are shown as mean ± standard error on mean.
Figure 4 with 4 supplements
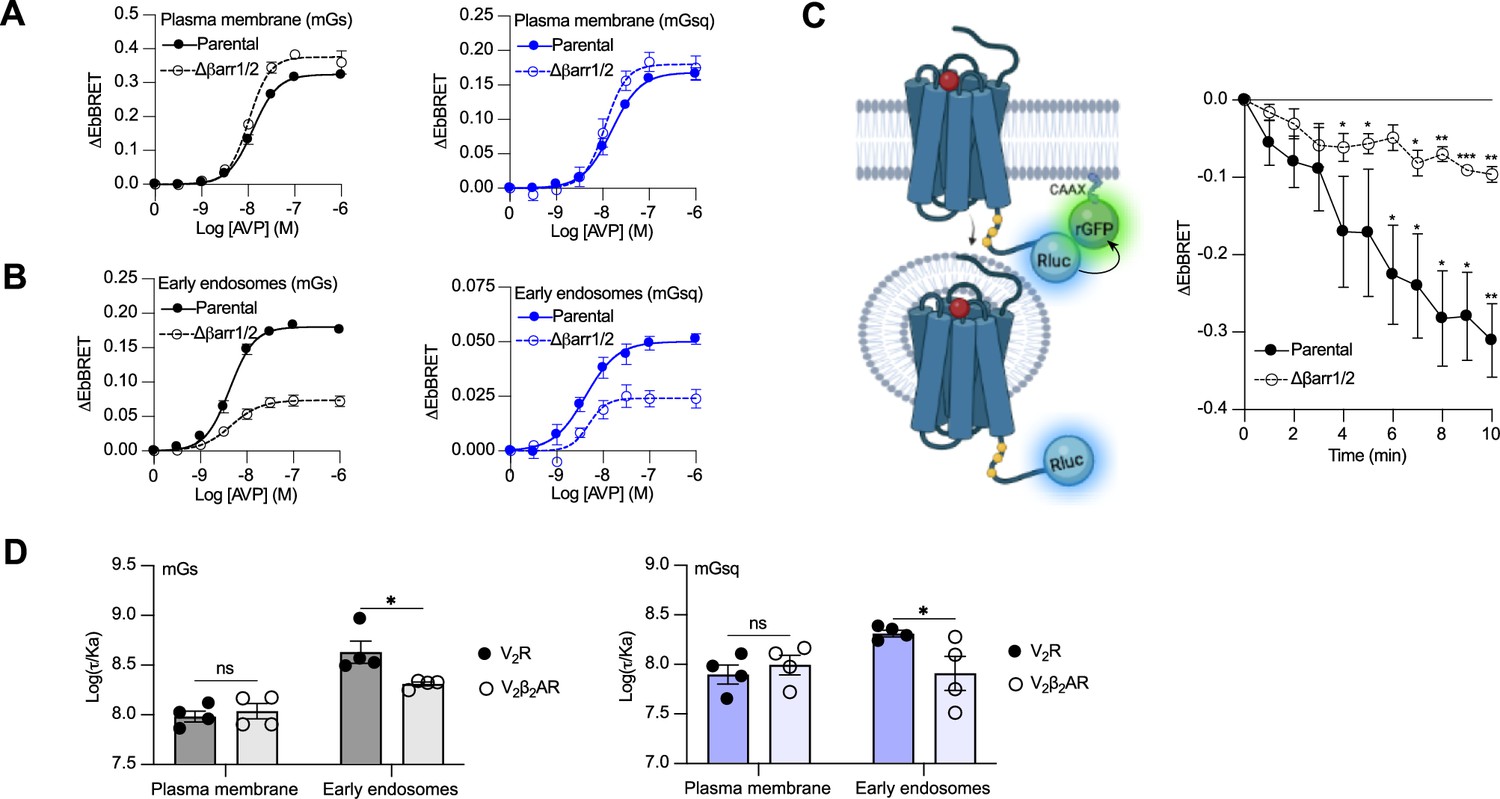
Contribution of megaplex to endosomal Gαs and Gαq signaling.
(A) Arginine vasopressin (AVP) dose–response curves of the recruitment of mGs (left panel) and mGsq (right panel) to the plasma membrane in parental and Δβarr1/2 cells expressing vasopressin type 2 receptor (V2R) upon 10 min of stimulation. (B) AVP dose–response curves of the recruitment of mGs (left panel) and mGsq (right panel) to early endosomes in parental and Δβarr1/2 cells expressing V2R upon 45 min of stimulation. (C) Left: Illustration of enhanced bystander bioluminescence resonance energy transfer (EbBRET) biosensors used to monitor AVP-mediated internalization of the V2R. Right: Kinetics of V2R internalization upon stimulation with AVP 0.1 μM. Asterisks mark significant differences from zero as assessed by one sample t test (*p ≤ 0.05, **p ≤ 0.01, ***p ≤ 0.001). (D) Transduction coefficients of mGs (left panel) or mGsq (right panel) recruitment to the plasma membrane and early endosomes in V2R- or V2β2AR-expressing cells. Asterisks mark significant differences between the V2R and V2β2AR as assessed by two-way analysis of variance (ANOVA) and Sidak’s post hoc test for multiple comparisons (*p ≤ 0.05). No statistical difference (ns) was detected between the V2R and V2β2AR at the plasma membrane. n = 4 biological replicates for all experiments. Data are shown as mean ± standard error on mean.
-
Figure 4—source data 1
Raw data on Figure 4.
- https://cdn.elifesciences.org/articles/87754/elife-87754-fig4-data1-v1.xlsx
Figure 4—figure supplement 1
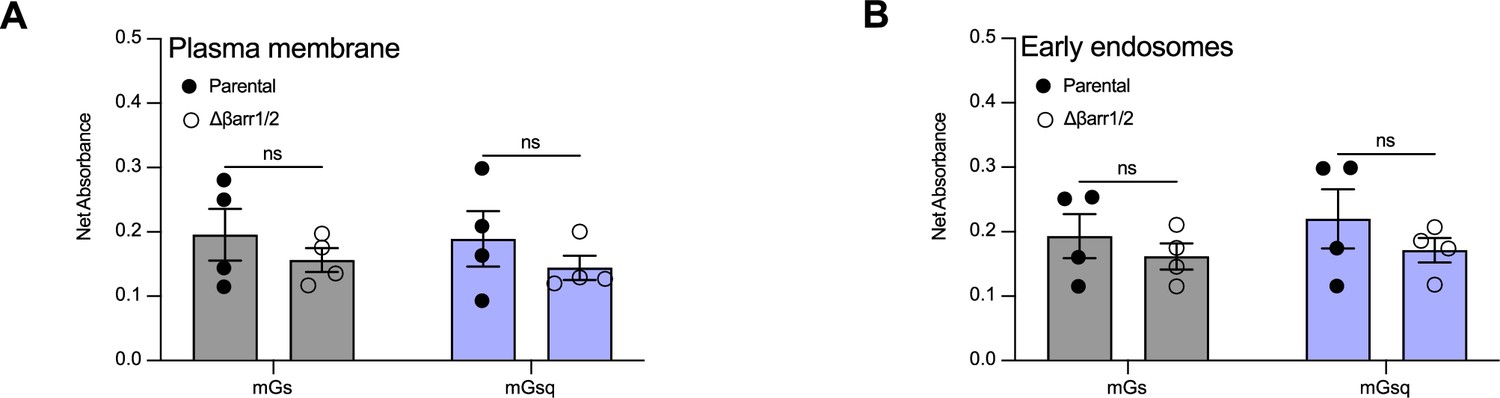
Relative expression of vasopressin type 2 receptor (V2R) at the plasma membrane in parental and Δβarr1/2 cells.
(A) Relative expression of V2R in parental versus Δβarr1/2 cells determined by enzyme-linked immunosorbent assay (ELISA) in the arginine vasopressin (AVP) dose–response curves of mGs and mGsq recruitment to the plasma membrane. (B) Relative expression of V2R in parental versus Δβarr1/2 cells determined by ELISA in the AVP dose–response curves of mGs and mGsq recruitment to the early endosomes. n = 4 biological replicates for all experiments. No statistical differences (ns) were detected between parental and Δβarr1/2 cells as assessed by two-way analysis of variance (ANOVA) and Sidak’s post hoc test for multiple comparisons. Data are shown as mean ± standard error on mean.
Figure 4—figure supplement 2

Relative expression of vasopressin type 2 receptor (V2R)-Rluc in parental and Δβarr1/2 cells.
Relative expression of V2R-Rluc in parental versus Δβarr1/2 cells determined by monitoring the relative luminescence units (RLU) emitted by Rluc in the kinetics of V2R internalization. n = 4 biological replicates. No statistical differences (ns) were detected between parental and Δβarr1/2 cells as assessed by a paired t-test. Data are shown as mean ± standard error on mean.
Figure 4—figure supplement 3
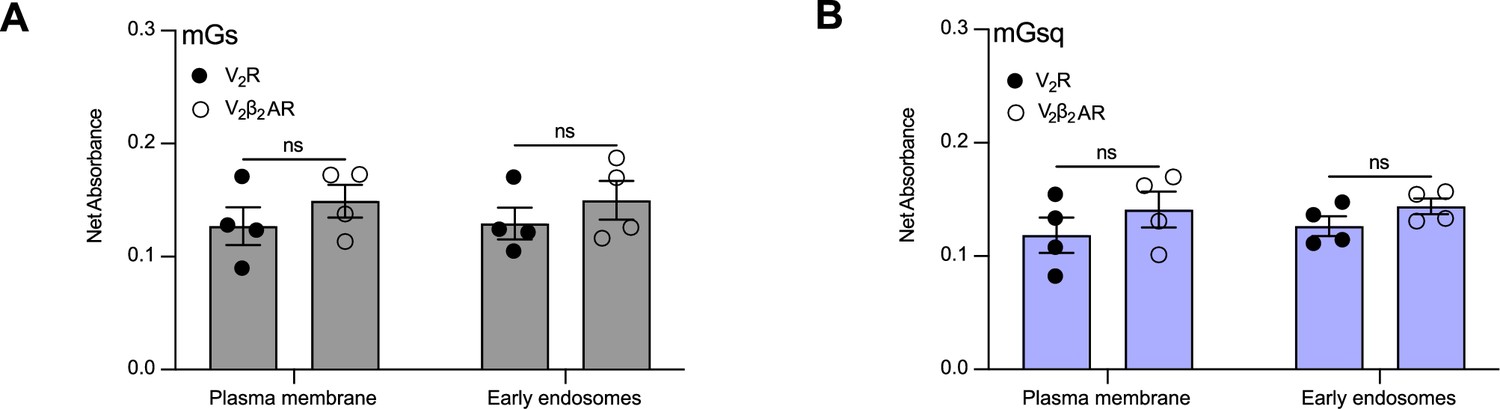
Relative expression of vasopressin type 2 receptor (V2R) and V2β2AR at the plasma membrane.
(A) Expression of the receptors at the plasma membrane in the cells used to determine the transduction coefficients of the recruitment of mGs at the plasma membrane and early endosomes determined by enzyme-linked immunosorbent assay (ELISA). (B) Expression of the receptors at the plasma membrane in the cells used to determine the transduction coefficients of the recruitment of mGsq at the plasma membrane and early endosomes determined by ELISA. n = 4 biological replicates for all conditions. No statistical differences (ns) were detected between the expressions of V2R and V2β2AR as assessed by two-way analysis of variance (ANOVA) and Sidak’s post hoc test for multiple comparisons. Data are shown as mean ± standard error on mean.
Figure 4—figure supplement 4
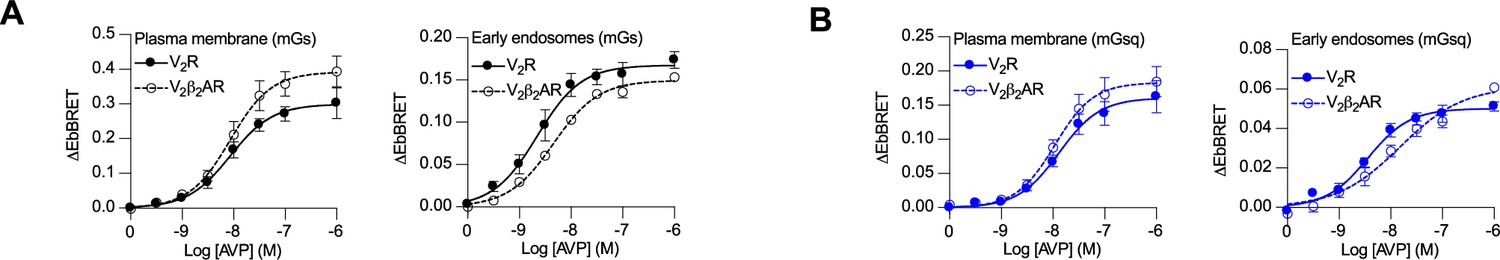
Arginine vasopressin (AVP) dose–response curves of the recruitment of mGs and mGsq to the plasma membrane and early endosomes by the vasopressin type 2 receptor (V2R) and V2β2AR.
(A) Dose-dependent recruitment of mGs at plasma membrane (left panel) or early endosomes (right panel) in cells expressing V2R or V2β2AR upon 10 min (plasma membrane) or 45 min (early endosomes) of AVP treatment. (B) Dose-dependent recruitment of mGsq at plasma membrane (left panel) or early endosomes (right panel) in cells expressing V2R or V2β2AR upon 10 min (plasma membrane) or 45 min (early endosomes) of AVP treatment. n = 4 biological replicates for each condition. Data are shown as mean ± standard error on mean.
Figure 5

Updated model of vasopressin type 2 receptor (V2R) signaling.
At the plasma membrane, arginine vasopressin (AVP) binding to V2R results in receptor-mediated Gαs or Gαq activation. This initial G protein activation at the plasma membrane is followed by V2R internalization into early endosomes. This internalization occurs primarily in a βarr-dependent manner, leading to the formation of a megaplex with Gαs or Gαq/11 and robust activation of these G proteins from endosomes. Additionally, a minor population of V2R internalize in a βarr-independent fashion, which also leads to minor but significant Gαs or Gαq/11 activation from endosomes.
Author response image 1
Author response image 2
Tables
Table 1
Parameters related to AVP dose–response curves of the mGs and mGsq recruitment to the plasma membrane or early endosomes in parental and Δβarr1/2 cells.
| Arginine vasopressin (AVP)-induced maximal efficacy(ΔEbBRET ± SEM) | Potency(LogEC50 ± SEM) | ||
|---|---|---|---|
| Plasma membrane | mGs parental mGs Δβarr1/2 | 0.324 ± 0.006 0.376 ± 0.011** | −7.90 ± 0.03 −7.99 ± 0.04 |
| mGsq parental mGsq Δβarr1/2 | 0.168 ± 0.005 0.180 ± 0.009 | −7.81 ± 0.04 −7.95 ± 0.07 | |
| Early endosomes | mGs parental mGs Δβarr1/2 | 0.180 ± 0.004 0.074 ± 0.004**** | −8.37 ± 0.03 −8.34 ± 0.09 |
| mGsq parental mGsq Δβarr1/2 | 0.050 ± 0.002 0.024 ± 0.002**** | −8.38 ± 0.08 −8.32 ± 0.12 |
-
ΔEbBRET values were fitted using four parameters equation with the bottom fixed at zero. n = 4 biological replicates for each condition. Statistical differences between parental and Δβarr1/2 cells for AVP-induced maximal efficacy and potency were assessed by comparing independent fits with a global fit that shares the selected parameter using extra sum-of-squares F-test (**p ≤ 0.01, ****p ≤ 0.0001).
Table 2
Parameters related to AVP dose–response curves of the recruitment of mGs and mGsq to the plasma membrane and early endosomes by the V2R or V2β2AR.
| Arginine vasopressin (AVP)-mediated maximal efficacy(ΔEbBRET ± SEM) | Potency(logEC50 ± SEM) | Transduction coefficient(log(τ/Ka) ± SEM) | ||
|---|---|---|---|---|
| mGs | PM V2R PM V2β2AR | 0.300 ± 0.018 0.392 ± 0.025*** | −8.07 ± 0.10 −8.07 ± 0.10 | 7.98 ± 0.05 8.04 ± 0.08 |
| EE V2R EE V2β2AR | 0.167 ± 0.008 0.150 ± 0.003 | −8.65 ± 0.09 −8.34 ± 0.04** | 8.63 ± 0.11 8.31 ± 0.02* | |
| mGsq | PM V2R PM V2β2AR | 0.161 ± 0.011 0.183 ± 0.013 | −7.88 ± 0.11 −7.97 ± 0.11 | 7.90 ± 0.10 7.99 ± 0.10 |
| EE V2R EE V2β2AR | 0.050 ± 0.002 0.061 ± 0.005* | −8.44 ± 0.08 −7.82 ± 0.14*** | 8.31 ± 0.03 7.91 ± 0.17* |
-
ΔEbBRET values from the dose–response curves were fitted using four parameters equation with the bottom fixed at zero. n = 4 biological replicates for each condition. Statistical differences between V2R and V2β2AR for AVP-mediated maximal efficacy and potency were assessed by comparing independent fits with a global fit that shares the selected parameter using extra sum-of-squares F-test (*p ≤ 0.05, **p ≤ 0.01, ***p ≤ 0.001). Statistical differences between V2R and V2β2AR for log(τ/Ka) values were assessed by two-way analysis of variance (ANOVA) and Sidak’s post hoc test for multiple comparisons (*p ≤ 0.05). PM, plasma membrane; EE, early endosomes.
Additional files
Download links
A two-part list of links to download the article, or parts of the article, in various formats.
Downloads (link to download the article as PDF)
Open citations (links to open the citations from this article in various online reference manager services)
Cite this article (links to download the citations from this article in formats compatible with various reference manager tools)
β-Arrestin-dependent and -independent endosomal G protein activation by the vasopressin type 2 receptor
eLife 12:RP87754.
https://doi.org/10.7554/eLife.87754.3


