Emerging variants of SARS-CoV-2 NSP10 highlight strong functional conservation of its binding to two non-structural proteins, NSP14 and NSP16
- Department of Pharmaceutical and Biological Chemistry, School of Pharmacy, University College London, United Kingdom
- College of Engineering, Design and Physical Sciences, Brunel University London, United Kingdom
- High-Performance Computing Center, Oklahoma State University, United States
- Department of Physiological Sciences, Oklahoma State University, United States
- UCL Centre for Advanced Research Computing, University College London, United Kingdom
Figures
Figure 1
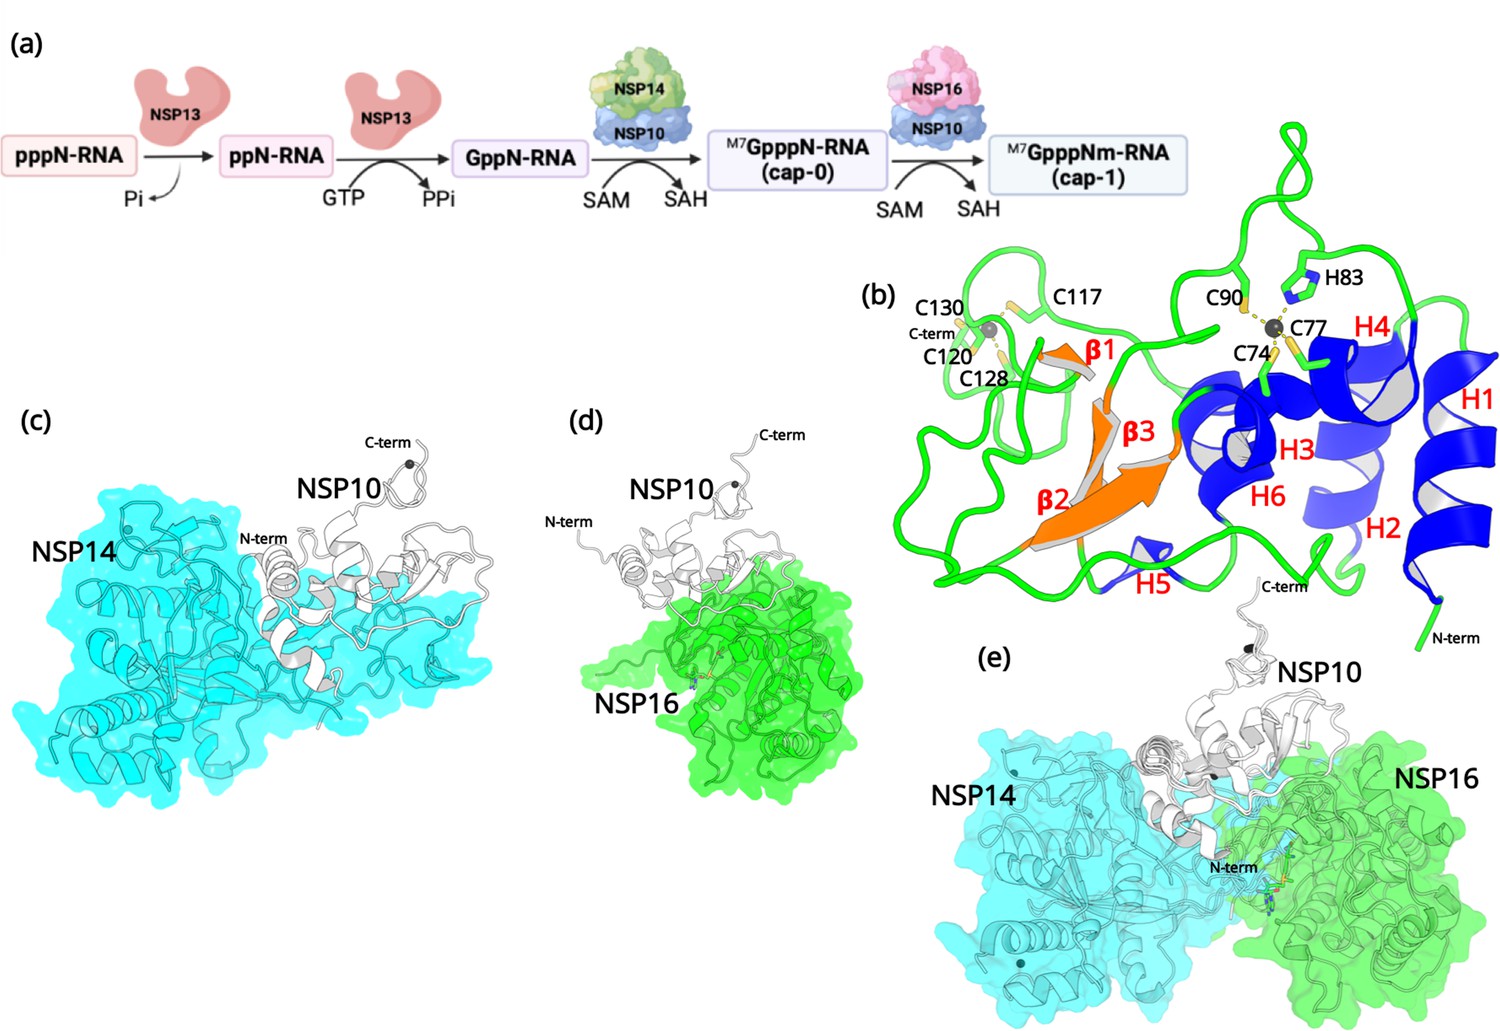
Structural features of NSP10.
(a) The capping mechanism of viral mRNA in SARS-CoV-2 involves four proteins: NSP13 (helicase, orange), NSP14 (green) and NSP16 (pink), and NSP10 (blue). NSP10 acts as a cofactor for both NSP14 and NSP16. (b) The structure of NSP10 (PDB entry 6CZT). NSP10 (white/gray cartoon) in complex with (c) NSP14 (cyan) and (d) NSP16 (green). (e) Overlay of NSP10 interacting with NSP14 and NSP16 displaying the partially overlapping interface of both enzymes with NSP10.
Figure 2 with 3 supplements
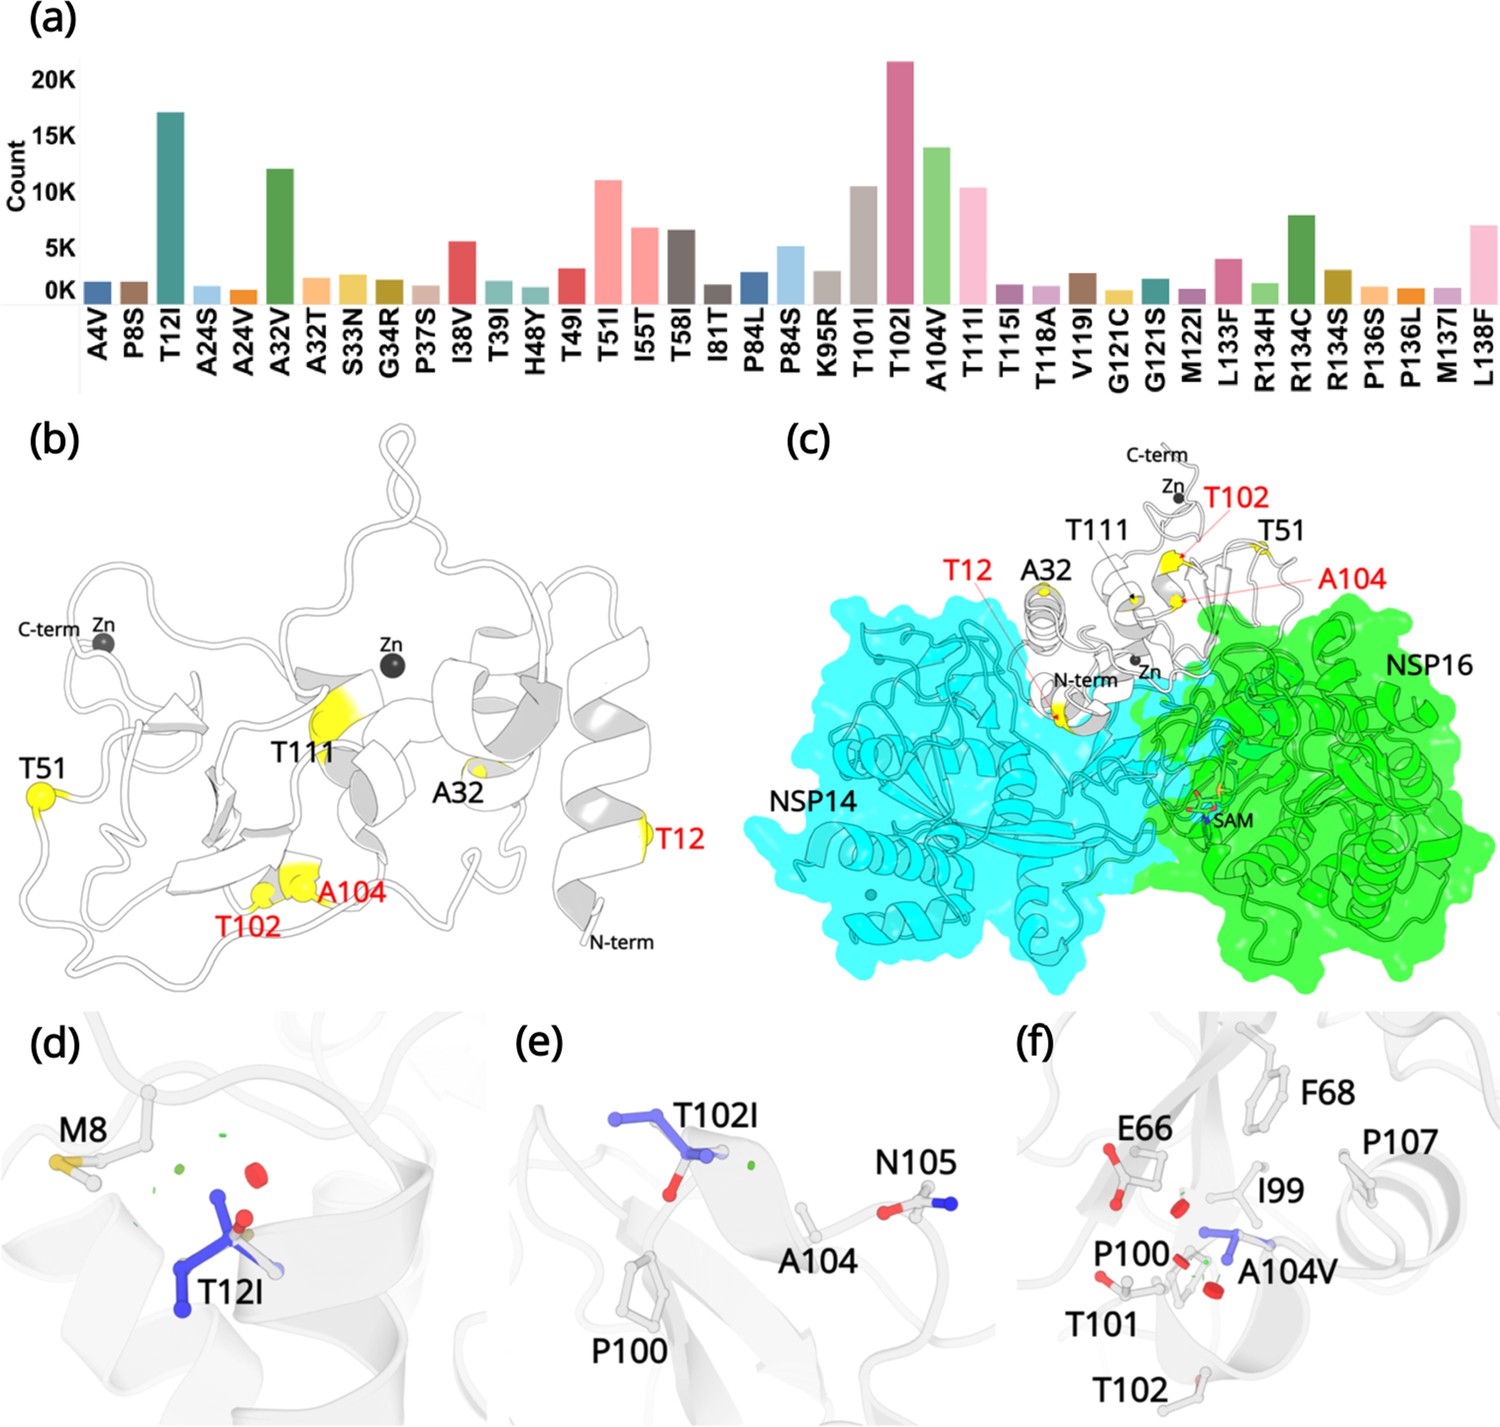
Mutations in NSP10.
(a) Mutation count of the top 39 mutations in NSP10 extracted from >13 million WGS. (b) Locations of top six mutations on the NSP10 structure. Mutation positions labeled in red are the most frequently occurring and were used in crystallographic studies. (c) The spatial position of the mutations relative to NSP14 and NSP16 structures. The local structural environment of (d) T12I, (e) T102I, and (f) A104V mutations (blue sticks) superimposed on the wild-type structure (white). The red discs represent regions where pairwise overlap of van der Waal radii occurs between the side chain atoms of the point mutation and the surrounding structural elements. The green discs represent regions where atoms are almost in contact.
-
Figure 2—source data 1
A detailed table listing all 820 mutations extracted from 7,070,539 sequences.
The table enlists the sequence accession no., SARS-CoV-2 strain, position, mutated residue, frequency, and % frequency.
- https://cdn.elifesciences.org/articles/87884/elife-87884-fig2-data1-v1.xlsx
-
Figure 2—source data 2
A detailed table listing all 878 mutations extracted from 13,032,424 sequences.
The table enlists the sequence accession no., SARS-CoV-2 strain, position, mutated residue, frequency, and % frequency.
- https://cdn.elifesciences.org/articles/87884/elife-87884-fig2-data2-v1.xlsx
-
Figure 2—source data 3
Summary of the most frequent variants occurring in NSP10 calculated using Dynamut2.
The percent frequency and effect on calculated protein stability are shown. Only mutations with a count larger than 1000 and a percent frequency larger than 0.01% have been included. Residues for which no structure was available have been left blank.
- https://cdn.elifesciences.org/articles/87884/elife-87884-fig2-data3-v1.xlsx
Figure 2—figure supplement 1

Mutation count of all 820 mutations in NSP10 extracted from 7,070,539 sequences, arranged from residue 1 to 139.
The sequences have been saved in Figure 2—source data 1. Different colors represent various mutated amino acids.
Figure 2—figure supplement 2

Mutation count of all 878 mutations in NSP10 extracted from 13,032,424 sequences, arranged from residue 1 to 139.
The sequences have been saved in Figure 2—source data 2. Different colors represent various mutated amino acids.
Figure 2—figure supplement 3
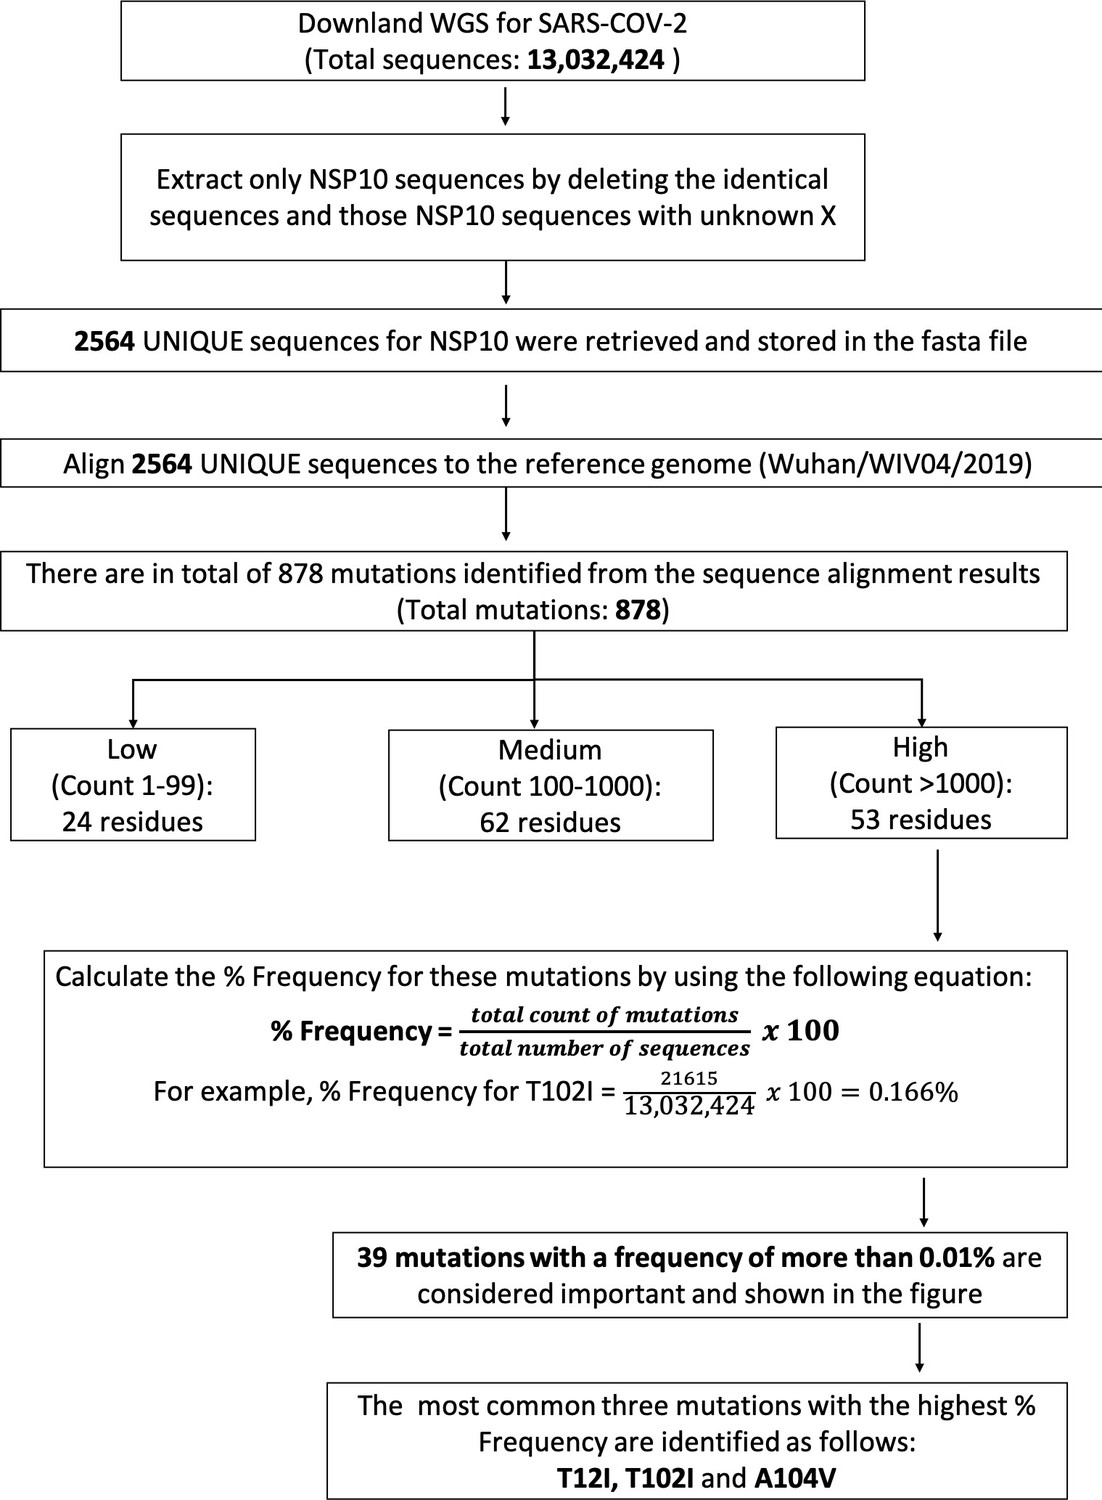
Protocol used for whole genome sequence analysis.
Figure 3
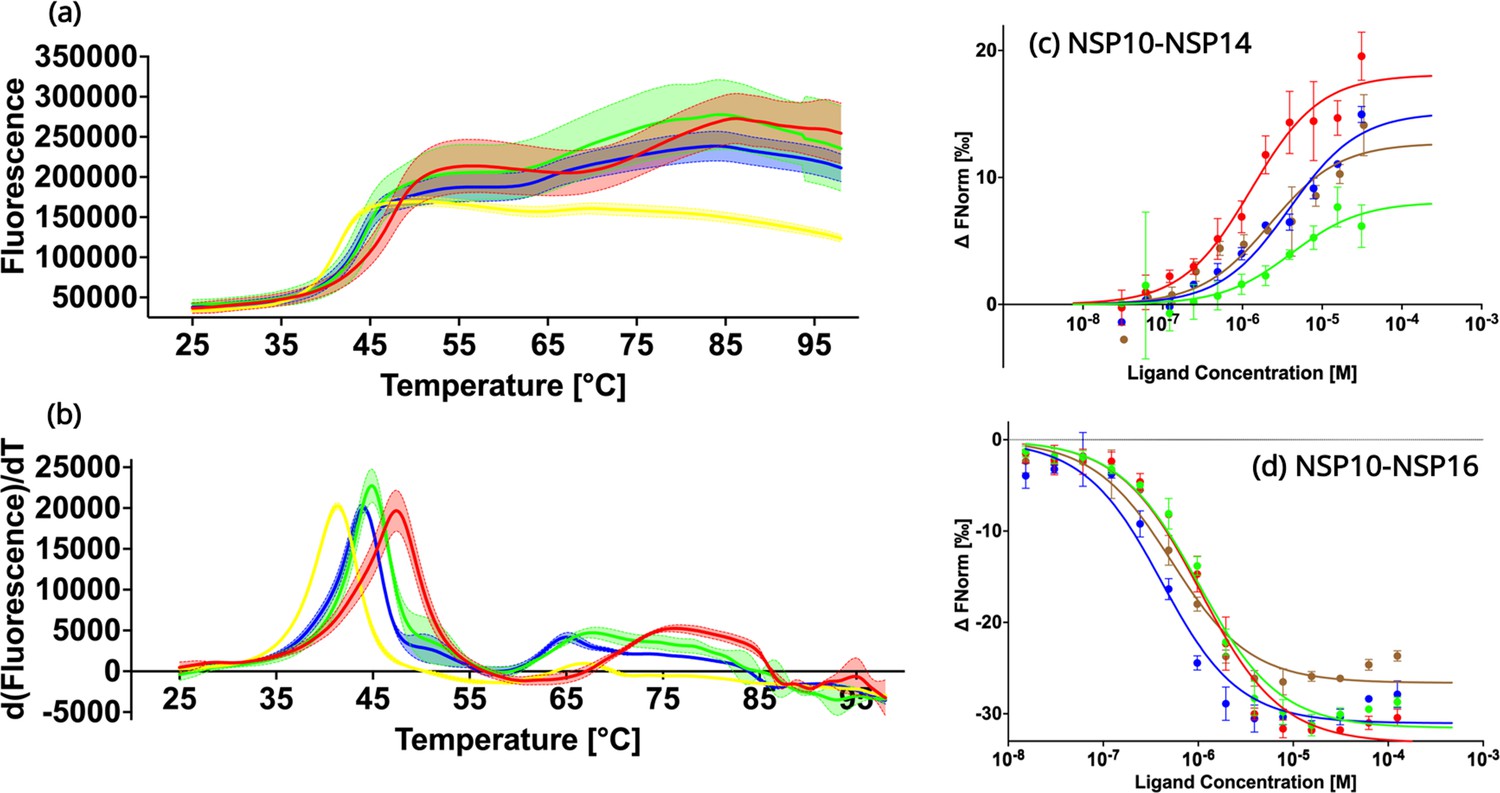
Biochemical characterization of native NSP10 and the three most frequent variants.
(a) Melting curve of native NSP10 and its three variants. The red, yellow, green, and blue curves show the data measured for native NSP10, T12I, T102I, and A104V variants, respectively. (b) Derivative curves of NSP10 and its three variants using the same color code. (c) MST dose response curves for native NSP10 and its variants in the presence of NSP14 ExoN domain. The green, red, blue and brown curves represent native NSP10, T12I, T102I, and A104V, respectively. (d) MST dose response curves for native NSP10 and its variants in the presence of NSP16, with the same color codes as above. All experiments were conducted at least in triplicate.
Figure 4
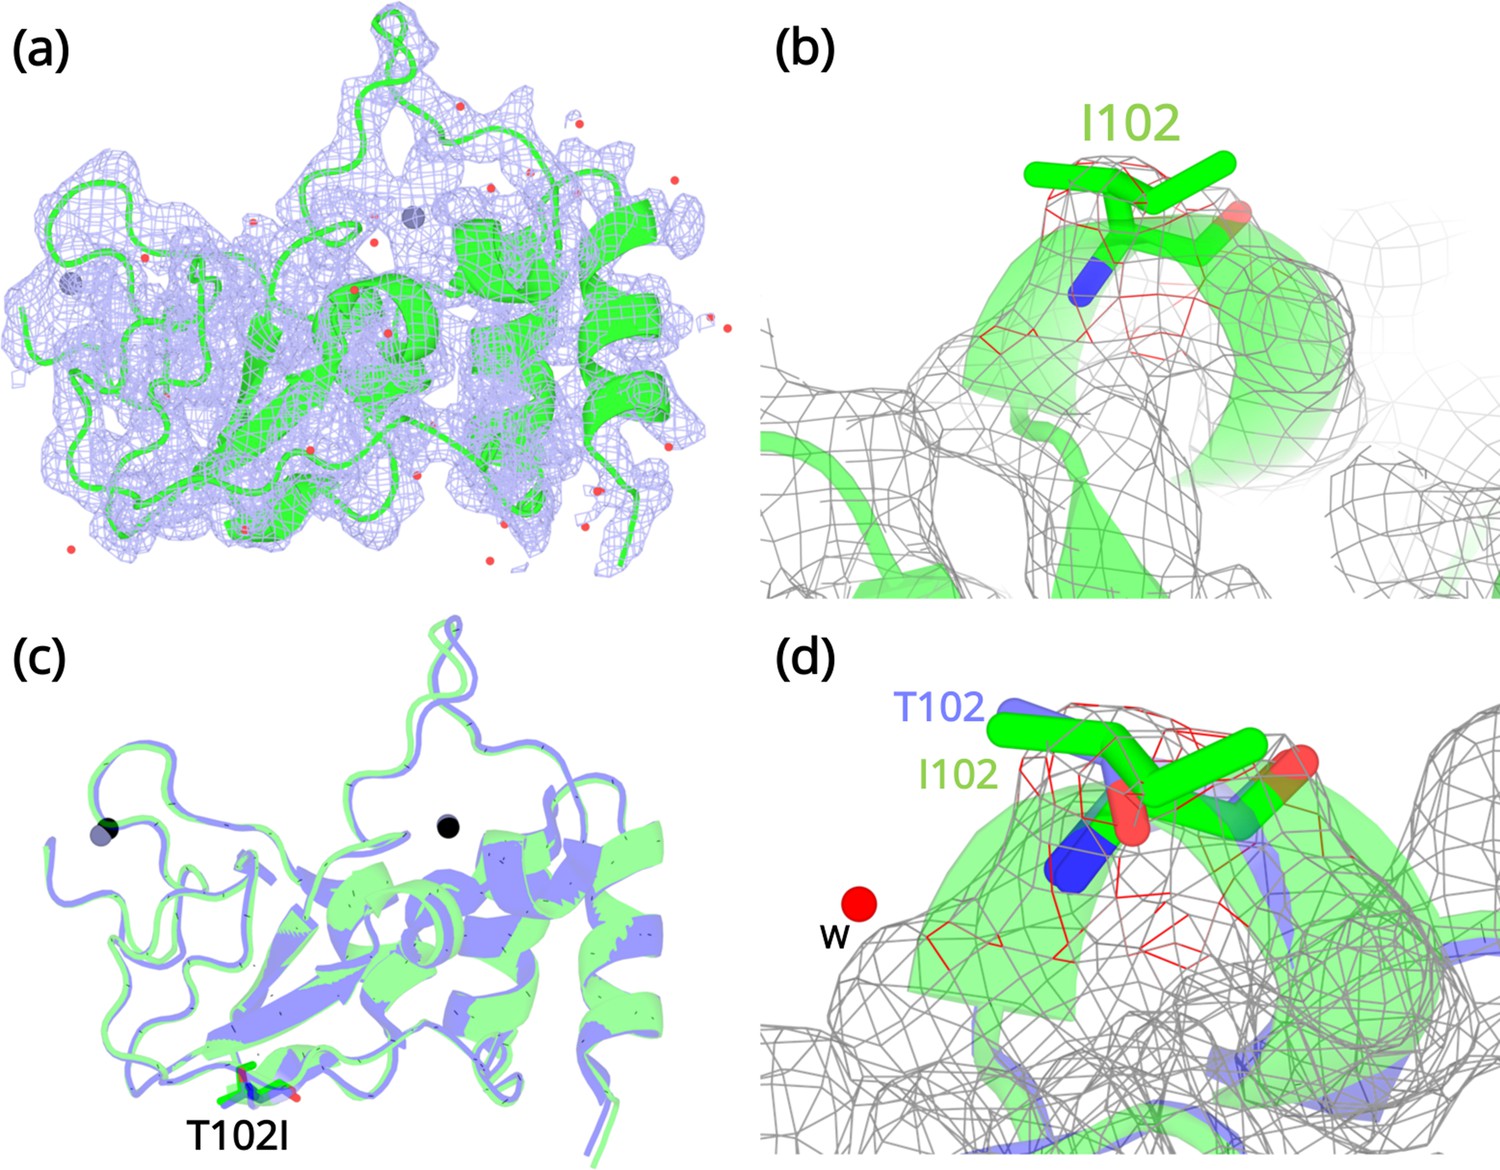
Structural details of the NSP10 T102I variant.
(a) 2Fo-Fc map (1σ) of the NSP10-T102I variant. (b) Magnification of the I102 side chain in the electron density map. (c) Structural overlay of wild-type NSP10 (PDB entry 6ZCT; blue) and variant T102I (green). The position of T102I is illustrated as sticks (d) Overlay of T102 (blue) and I102 (green) side chains. The position of a water molecule present in wild-type NSP10 that makes interactions with the T102 side chain is shown. Zinc atoms are illustrated as grey spheres and water molecules are illustrated as red circles.
Figure 5
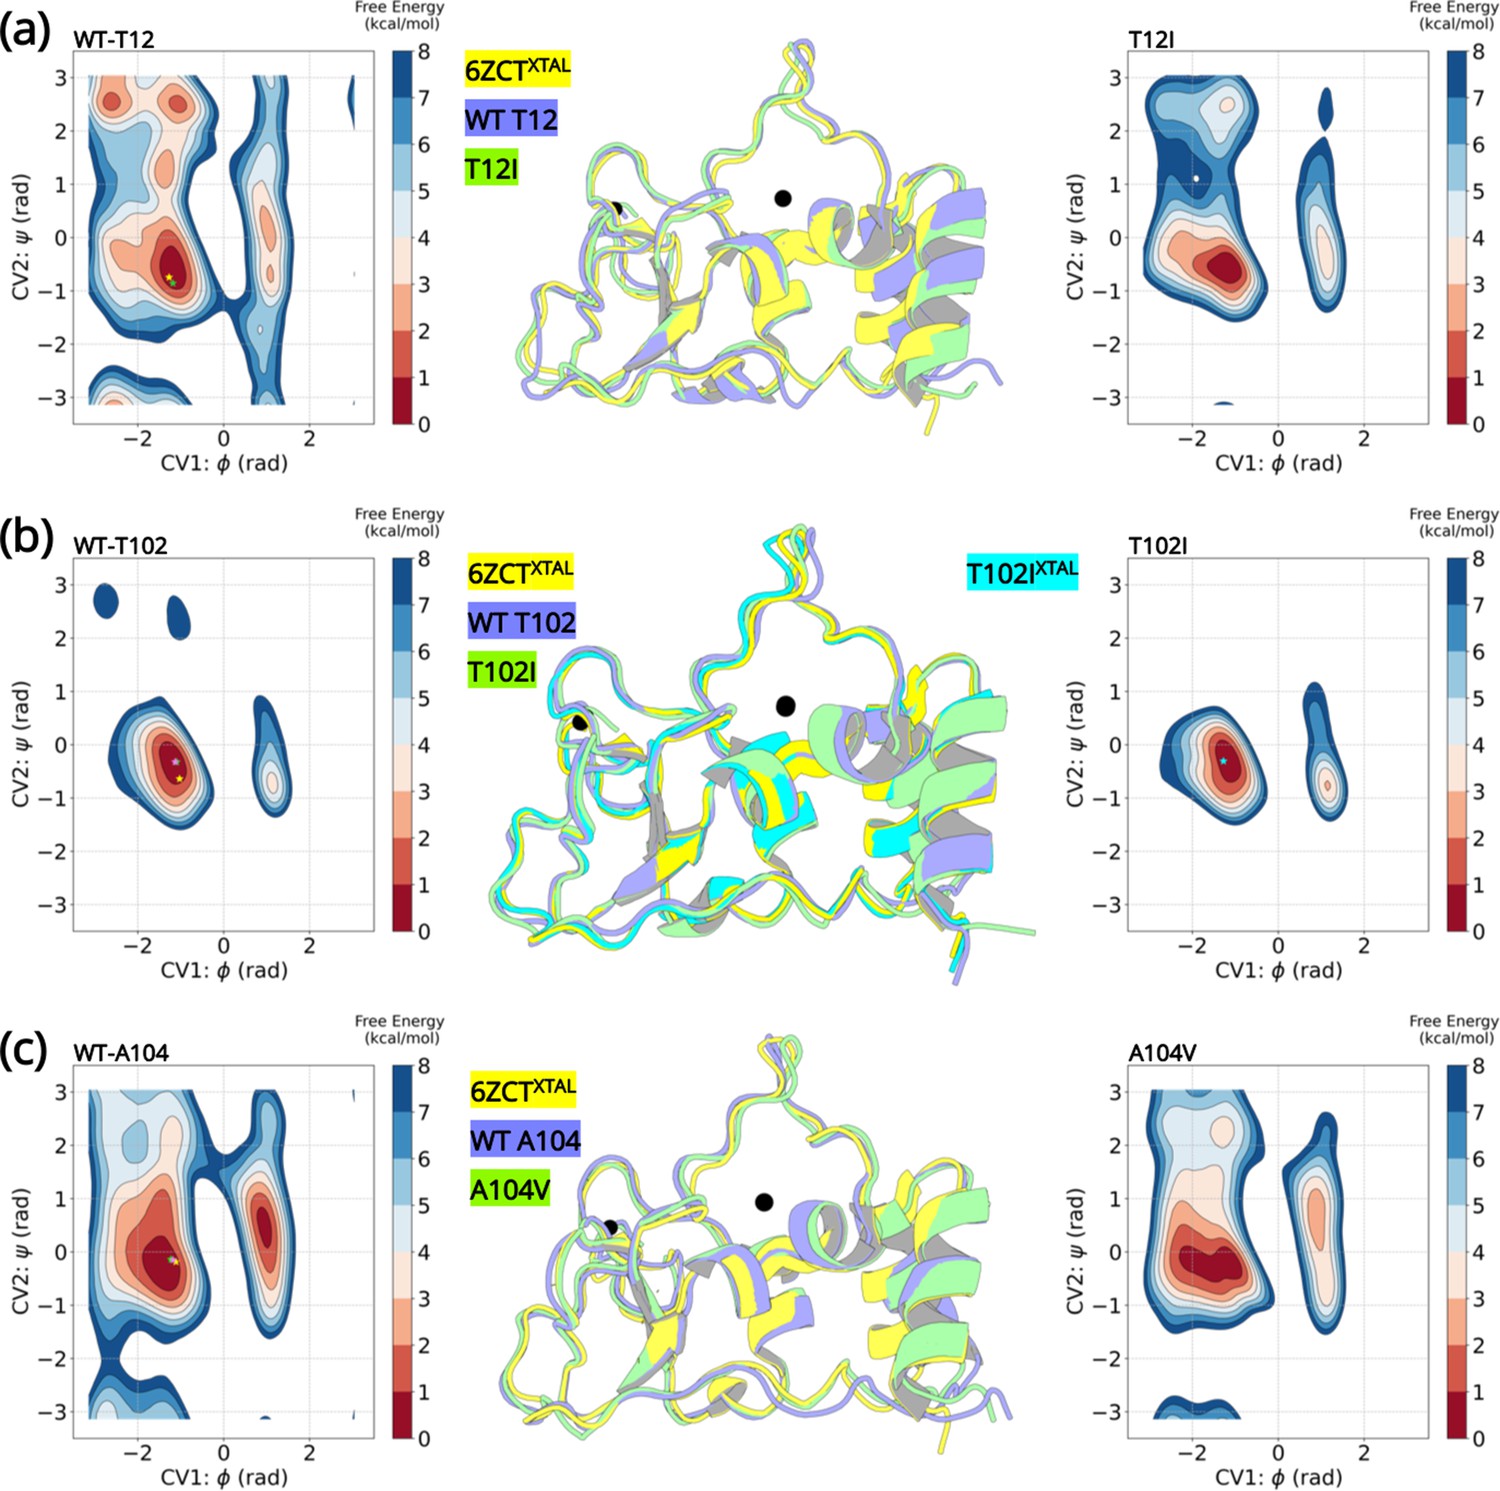
Well-tempered metadynamics reveal similar conformational dynamics for the wild-type and variant NSP10.
Free energy surface plots of the (A) wild-type T12 and T12I variants, (B) wild-type T102 and T102I variants and (C) wild-type and A104V variants. The wild-type and the variants explore similar conformational landscapes. An overlay of the structures extracted from the largest populated minima highlights similar conformations. The crystal structure 6ZCTXTAL (yellow), the representative conformation extracted from the largest minima in the wild-type simulation (slate blue), and the mutant simulation (green) are superimposed. The resolved crystal structure conformations are extrapolated on the minima and illustrated as a star (yellow- 6ZCTNSP10; green - 7MC5NSP14; pink - 6W4HNSP16; cyan - T102IXTAL).
Figure 6
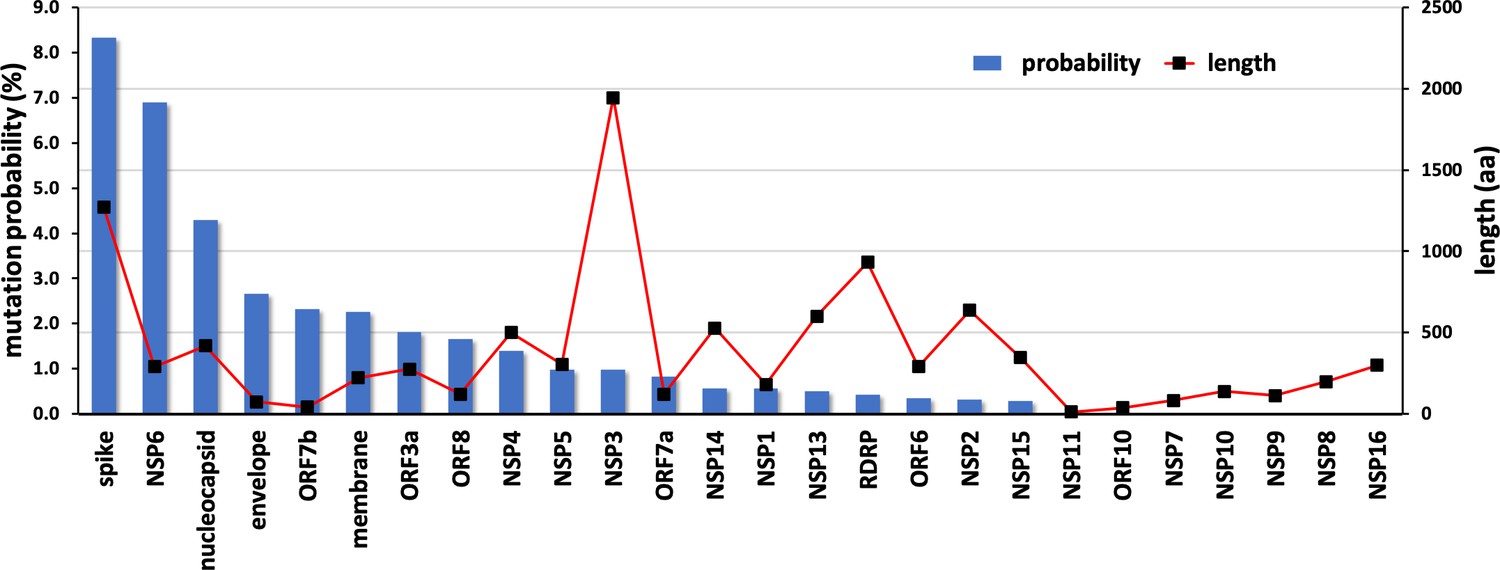
Mutational propensities of various SARS-CoV-2 genes.
The number of mutations observed in each gene at the protein sequence level and normalized by sequence length is depicted (as blue bars). The genes are ranked in order of their mutational propensity.
Tables
Table 1
Summary of the top three variants occurring in NSP10 calculated using Dynamut2.
The percent frequency and effect on calculated protein stability are shown. A summary of the top 39 mutations has been listed in Figure 2—source data 3. Only mutations with a count larger than 1000 and a percent frequency larger than 0.01% have been included.
| Mutation | Count | %Frequency | ΔΔGStability | Predicted effect onNSP10 stability | NSP10-NSP14 | NSP10-NSP16 | ||
|---|---|---|---|---|---|---|---|---|
| Interface | Deletrious | Interface | Deleterious | |||||
| T102I | 21615 | 0.166 | –0.11 | destabilizing | N | N | N | N |
| T12I | 17120 | 0.131 | –0.68 | destabilizing | Y | N | N | N |
| A104V | 13988 | 0.107 | –0.1 | destabilizing | N | N | N | N |
Table 2
Data collection, data processing, and model refinement statistics for SARS-CoV-2 NSP10 variant T102I.
Data in parenthesis correspond to the highest resolution shell.
| Data collection and refinement statistics | SARS-CoV-2 NSP10 variant T102I(PDB entry 8BZN) |
|---|---|
| Wavelength (Å) | 0.9655 |
| Resolution range [Å] | 42.81–2.19 (2.269–2.19) |
| Space group | I213 |
| Unit cell parameters [Å;°] | a=b=c=104.867, α=β=γ=90 |
| Molecules per asymmetric unit | 1 |
| Total reflections | 23664 (1293) |
| Unique reflections | 9432 (963) |
| Multiplicity | 2.5 (2.6) |
| Completeness [%] | 94.0 (97.8) |
| Mean I/sigma(I) | 11.9 (2.2) |
| Wilson B-factor | 40.45 |
| R-meas [%] | 6.6 (56.9) |
| Rpim [%] | 3.8 (33.6) |
| CC1/2 [%] | 99.7 (72.4) |
| Reflections used in refinement | 9432 (963) |
| Rcryst/Rfree [%] | 17.8 (28.0/23.3 (35.6)) |
| Total no. of non-hydrogen atoms (protein) | 1005 |
| No. of protein / ligand / solvent atoms | 925 / 9 / 71 |
| RMSD bond length, bond angles [Å;°] | 0.012 / 1.04 |
| RamachandranFavored / allowed / outliers / rotamer outliers [%] | 95.9 / 4.1 / 0.0 / 1.0 |
| Clashscore | 4.38 |
| Average B-factor / protein / ligands / solvent | 44.8 / 44.7 / 55.3 / 45.6 |
Additional files
Download links
A two-part list of links to download the article, or parts of the article, in various formats.
Downloads (link to download the article as PDF)
Open citations (links to open the citations from this article in various online reference manager services)
Cite this article (links to download the citations from this article in formats compatible with various reference manager tools)
Emerging variants of SARS-CoV-2 NSP10 highlight strong functional conservation of its binding to two non-structural proteins, NSP14 and NSP16
eLife 12:RP87884.
https://doi.org/10.7554/eLife.87884.3


