Mechanistic and evolutionary insights into isoform-specific ‘supercharging’ in DCLK family kinases
- Department of Biochemistry and Molecular Biology, University of Georgia, United States
- Department of Biochemistry, Cell and Systems Biology, Institute of Systems, Molecular and Integrative Biology, University of Liverpool, United Kingdom
- Institute of Bioinformatics, University of Georgia, United States
- Centre for Proteome Research, Department of Biochemistry, Cell and Systems Biology, Institute of Systems, Molecular and Integrative Biology, University of Liverpool, United Kingdom
Figures
Figure 1 with 1 supplement
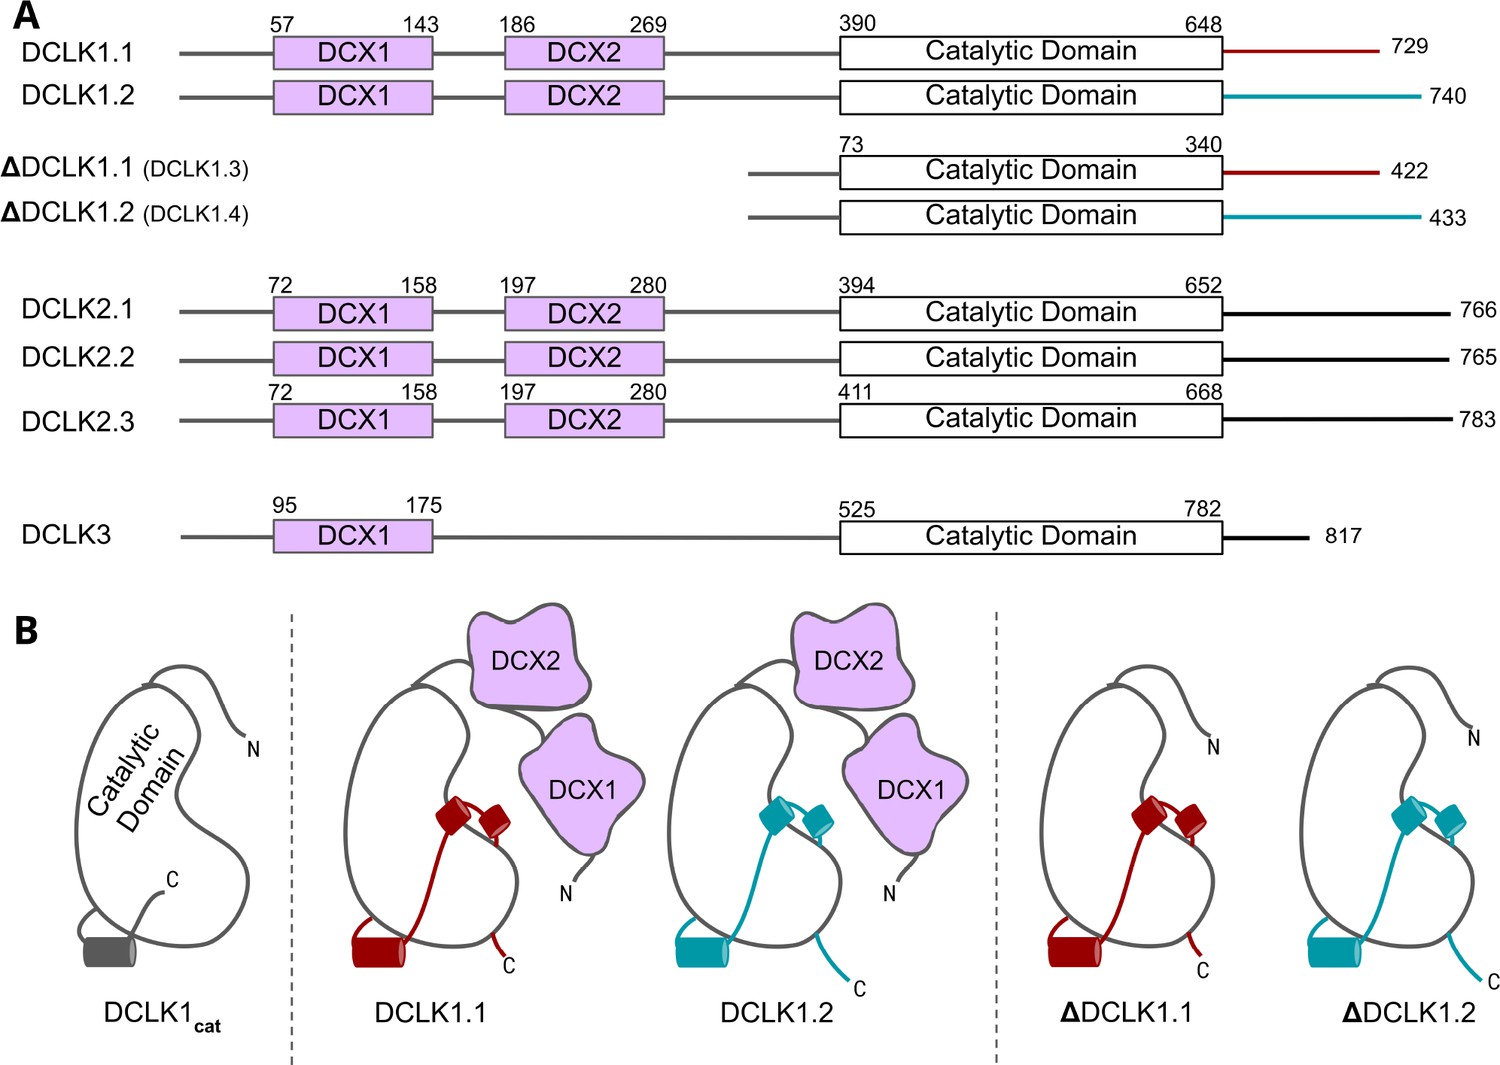
Cartoon schematic of Human DCLK orthologs and respective isoforms.
(A) Schematic representation of domain organization for the known isoforms of the three human doublecortin-like kinase (DCLK) paralogs. Domain boundaries are annotated according to the representative amino acid sequences derived from UniProt. (B) DCLK1 isoforms visualized as cartoons, showing key structural differences between the four human DCLK1 isoforms and a DCLK1 catalytic domain with artificially short linker regions (DCLK1cat).
Figure 1—figure supplement 1
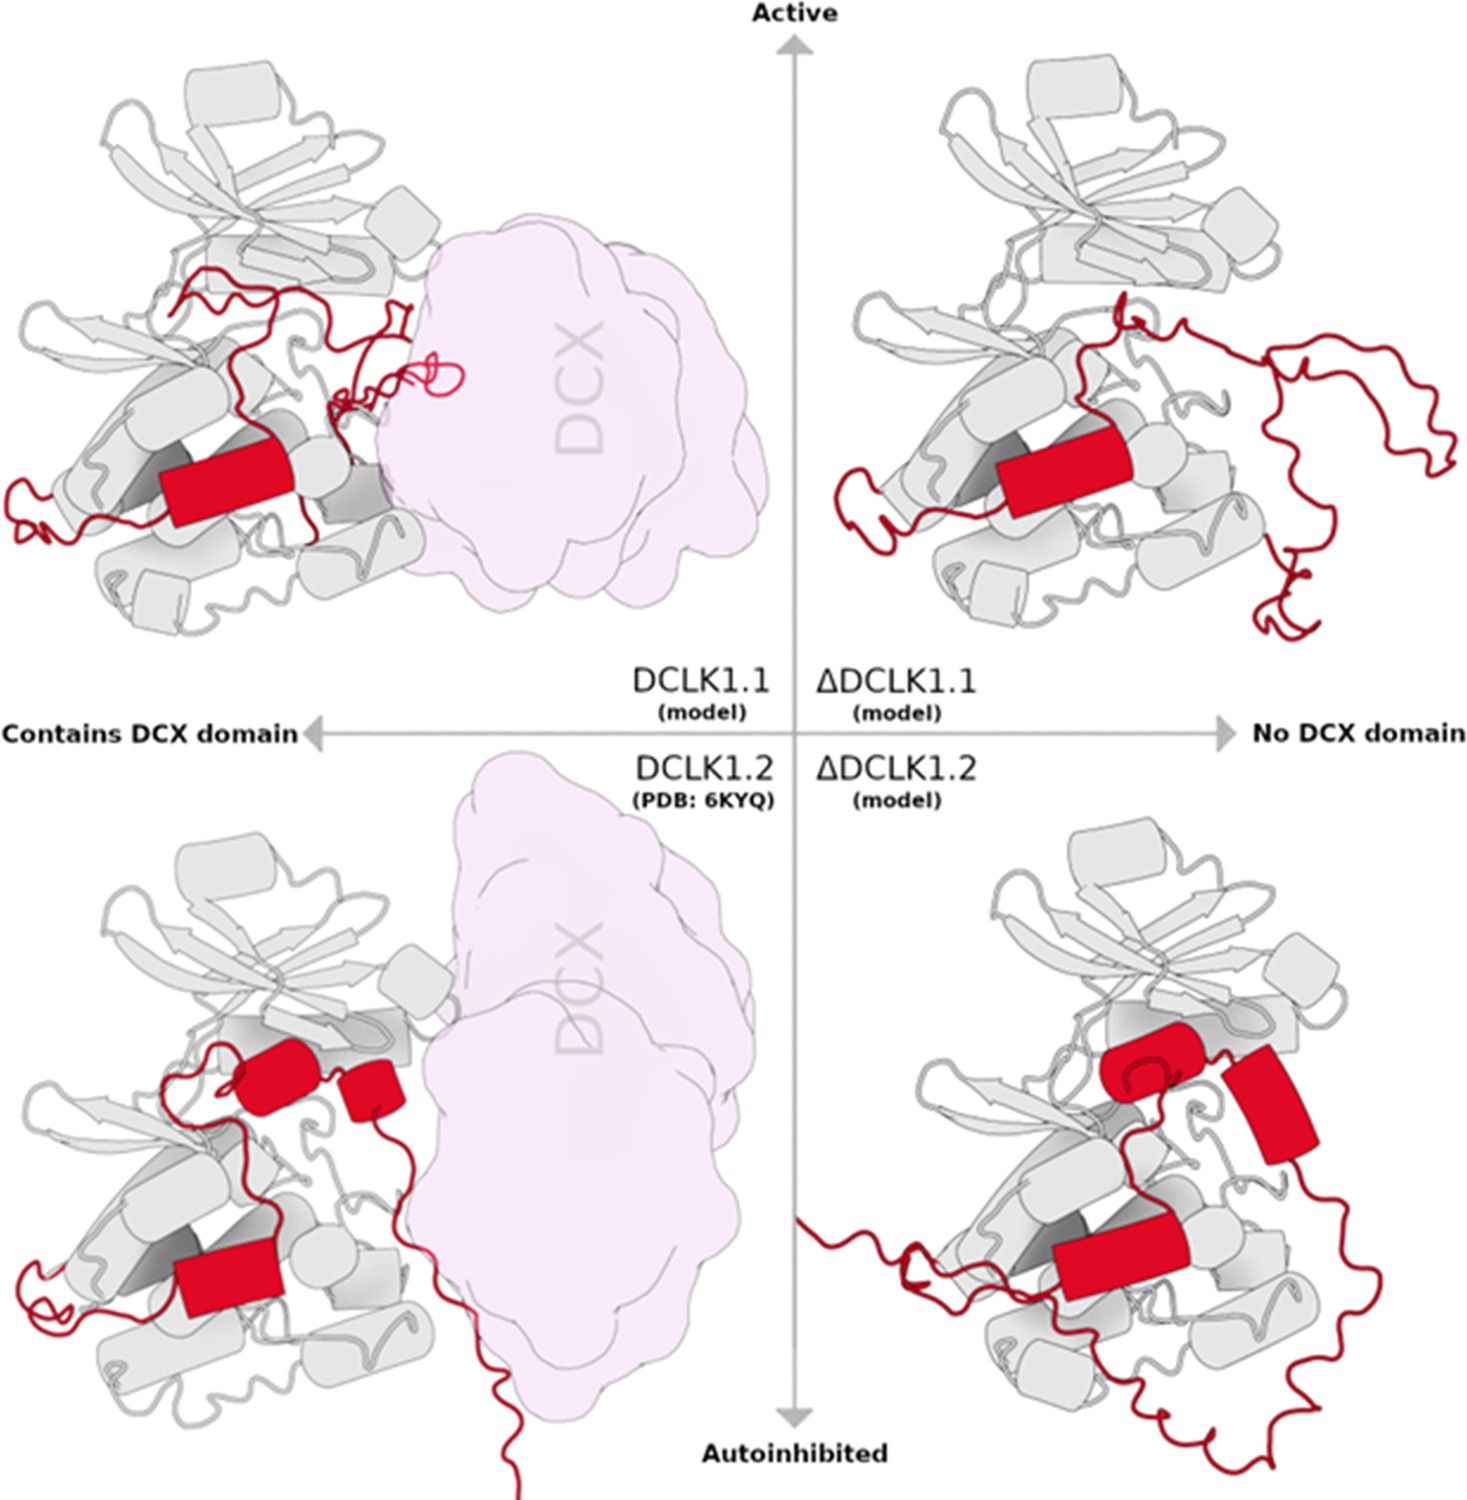
Structural cartoon depicting each DCLK1 isoform, categorized by the presence of doublecortin-like (DCX) domain and related to enzymatic activity.
Figure 2 with 1 supplement
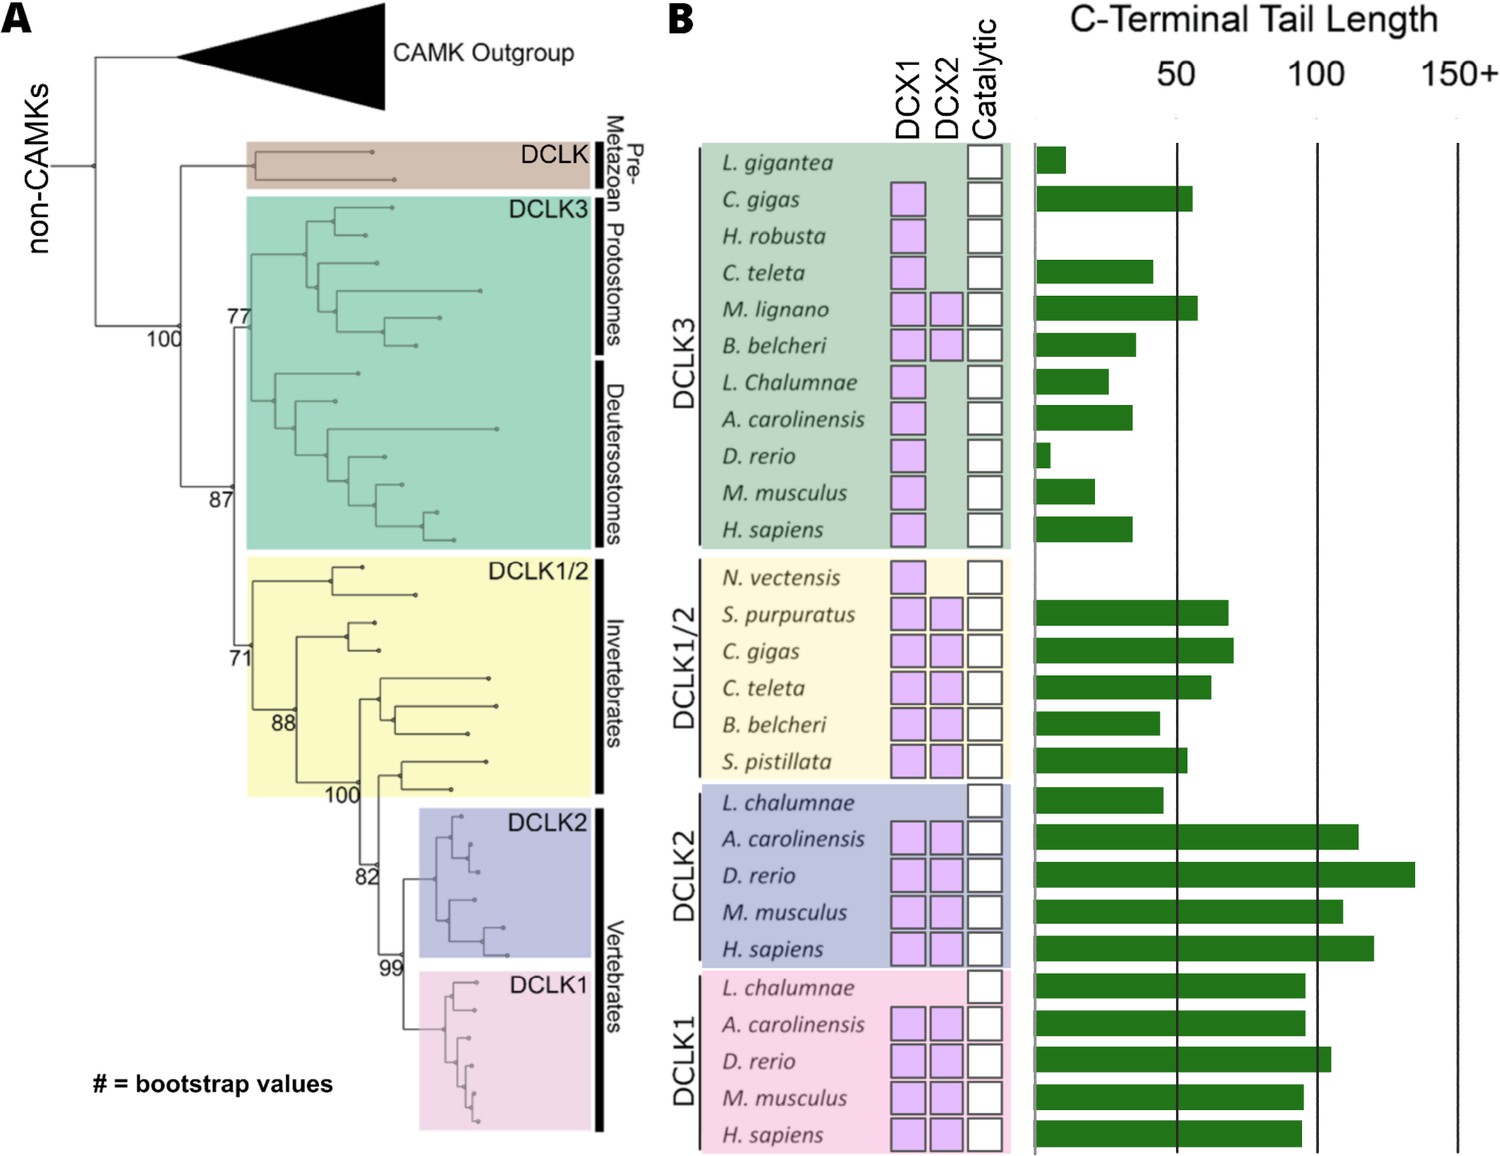
Evolution of the doublecortin-like kinase (DCLK) family.
(A) Phylogenetic tree showing the divergence and grouping of DCLK sub-families in different taxonomic groups. Bootstrap values are provided for each clade. (B) shows domain annotations for sequences included in the phylogenetic tree. The length of C-terminal tail segment for these sequences is shown as a histogram (green). The original tree generated using IQTREE is provided in Figure 2—source data 1.
-
Figure 2—source data 1
Full doublecortin-like kinase (DCLK) phylogenetic tree with bootstrap values.
- https://cdn.elifesciences.org/articles/87958/elife-87958-fig2-data1-v1.pdf
-
Figure 2—source data 2
Species and Uniprot IDs for each sequence represented in the domain plot of Figure 2.
- https://cdn.elifesciences.org/articles/87958/elife-87958-fig2-data2-v1.xlsx
Figure 2—figure supplement 1
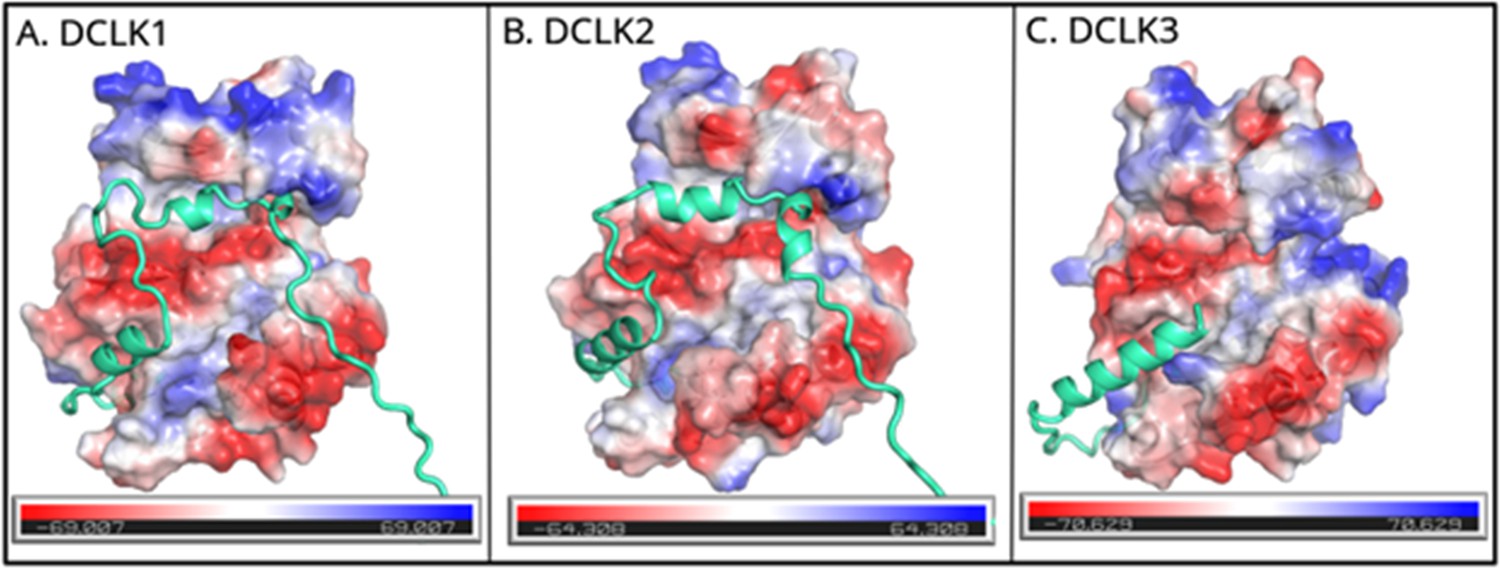
Electrostatic surface views of full-length doublecortin-like kinase (DCLK) paralog (A: DCLK1, B: DCLK2, and C: DCLK3) in the same orientation.
These structures show how the tail packs against the substrate-binding pocket of the kinase domain in each paralog. The electrostatic surface is color-coded with negative (red) and positive (blue) charges. Similarities in the distribution of charges among paralogs can influence substrate-binding affinity and kinase activity.
Figure 3 with 4 supplements

Cartoon cladogram of mammalian DCLK1 isoforms and experimental.
(A) Cartoon cladogram of mammalian species showing the domain organization of each DCLK1 isoform from representative annotated sequences from UniProt. UniProt IDs for each sequence are provided in Figure 3—source data 1. (B) SDS-PAGE of 6His-GST-3C-DCLK1.1 (351–689, top) or a D533A mutant in which the DFG Asp is mutated to Ala (middle). Proteins were separated by size exclusion chromatography, and high-purity fractions were pooled. The affinity tag was removed prior to analysis by incubation with 3C protease, leading to a demonstrable shift in mobility (bottom). (C) Evaluation of catalytic activity toward DCLK1 peptide. DCLK1.1 351–689 possesses a KM[ATP]~20 µM in vitro (left) and real-time substrate phosphorylation was inhibited by prior incubation with the small molecule DCLK1-IN-1 (right). (D) Thermal shift assay demonstrating a 2.1°C increase in the stability of DCLK1 351–689 in the presence of Mg:ATP (left), which was absent in the D533A protein (right). Raw data are provided in Figure 3—source data 2.
-
Figure 3—source data 1
Species and Uniprot IDs for each sequence represented in the mammalian DCLK1 isoform species tree.
- https://cdn.elifesciences.org/articles/87958/elife-87958-fig3-data1-v1.xlsx
-
Figure 3—source data 2
Experimental values for thermal shift and activity assays from Figure 3.
- https://cdn.elifesciences.org/articles/87958/elife-87958-fig3-data2-v1.xlsx
-
Figure 3—source data 3
DCLK1 plasmid sequences generated for Figure 3.
- https://cdn.elifesciences.org/articles/87958/elife-87958-fig3-data3-v1.txt
-
Figure 3—source data 4
Figure 3B (top) uncropped gel.
- https://cdn.elifesciences.org/articles/87958/elife-87958-fig3-data4-v1.zip
-
Figure 3—source data 5
Figure 3B (bottom) uncropped gel.
- https://cdn.elifesciences.org/articles/87958/elife-87958-fig3-data5-v1.zip
-
Figure 3—source data 6
Uncropped gel of incubation of size exclusion chromatography (SEC)-purified DCLK1 with 3C protease.
- https://cdn.elifesciences.org/articles/87958/elife-87958-fig3-data6-v1.zip
-
Figure 3—source data 7
PowerPoint file containing labels for Source Data 4–6.
- https://cdn.elifesciences.org/articles/87958/elife-87958-fig3-data7-v1.pptx
Figure 3—figure supplement 1
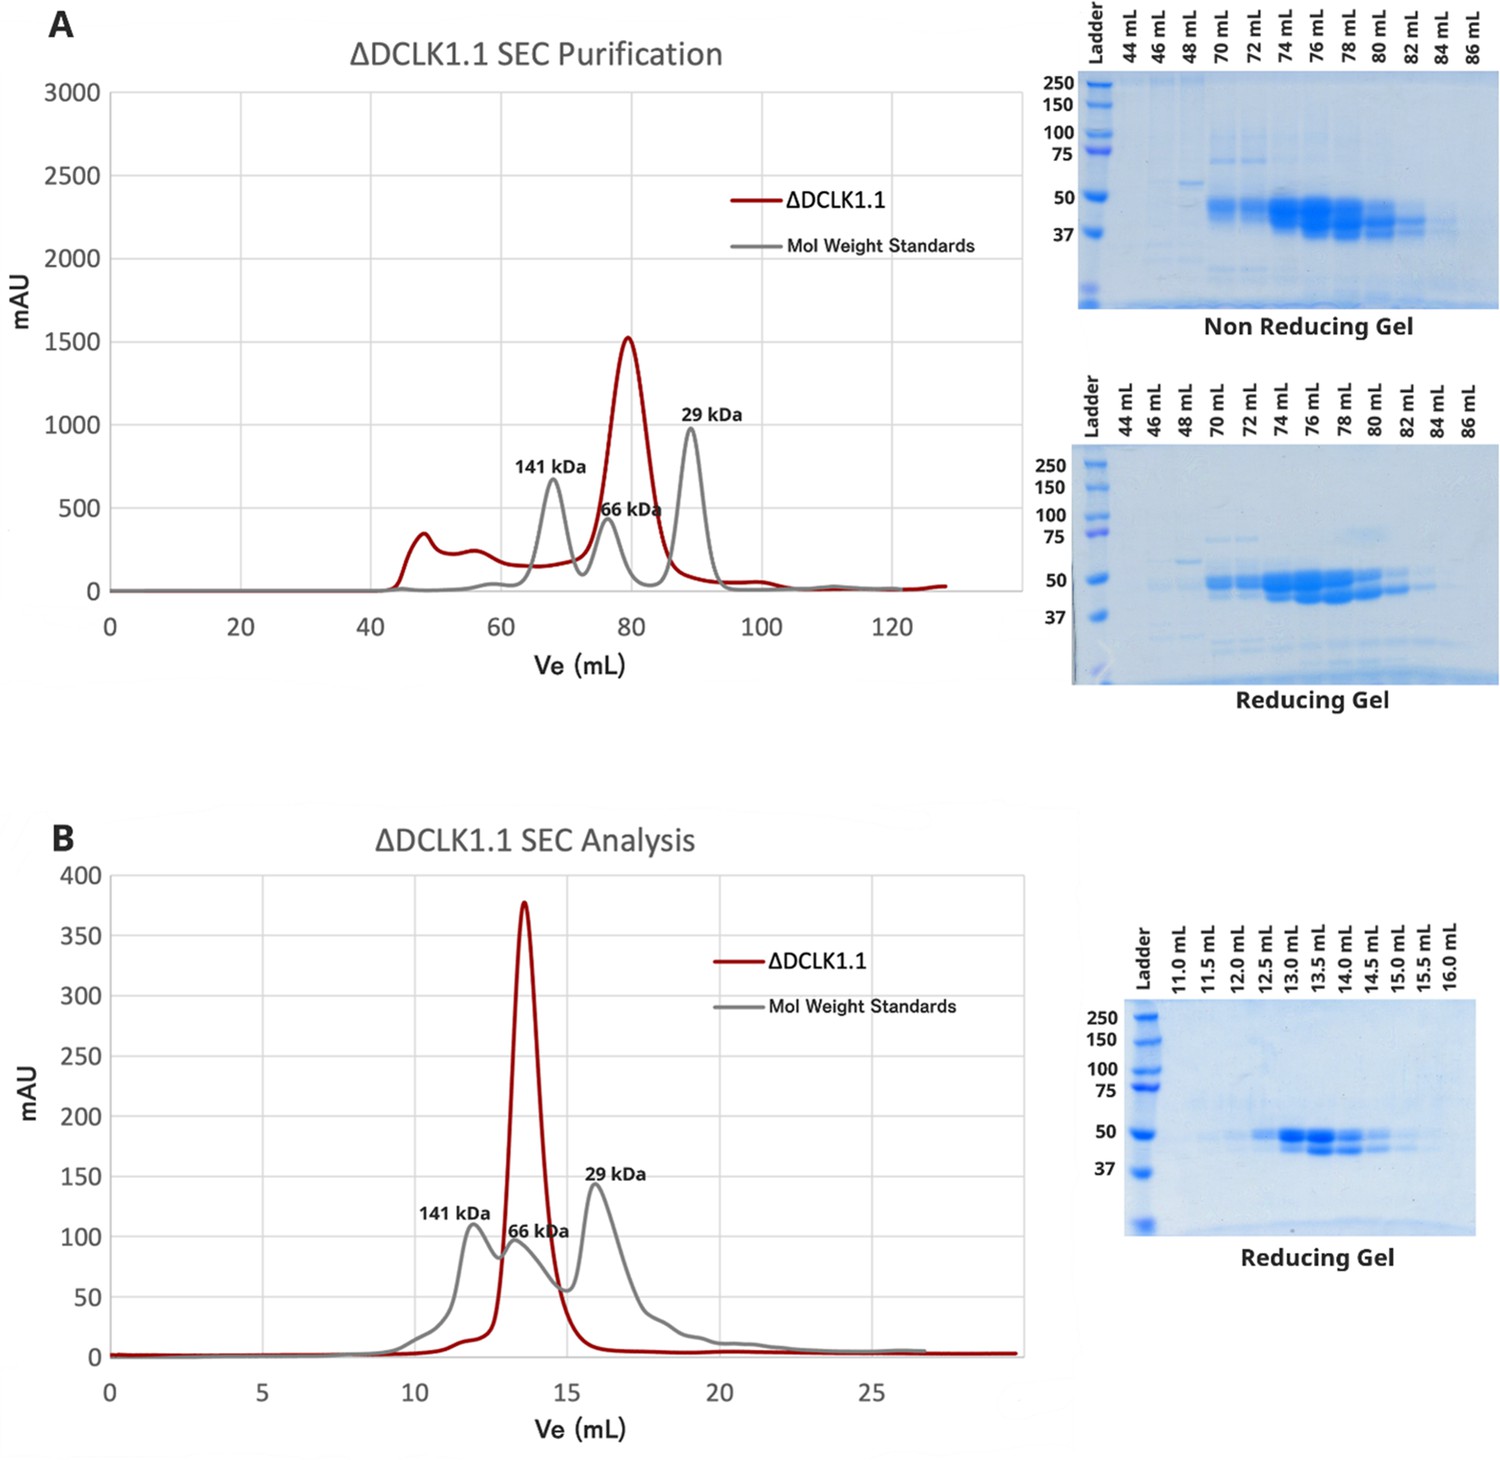
Characterization and Analysis of Human DCLK1 Variants and Their Biophysical Properties.
(A) Purification of DCLK1.1351-729 by size exclusion chromatography (SEC) reveals a single peak, representing monomeric protein in solution. Reducing and non-reducing SDS-PAGE show the elution profiles of the purified species. (B) Analytical SEC of purified DCLK1.1351-729 (1.1 mg) confirms a single monomeric species.
-
Figure 3—figure supplement 1—source data 1
Uncropped and unlabeled gel from DCLK1.1 size exclusion chromatography (SEC).
- https://cdn.elifesciences.org/articles/87958/elife-87958-fig3-figsupp1-data1-v1.zip
Figure 3—figure supplement 2
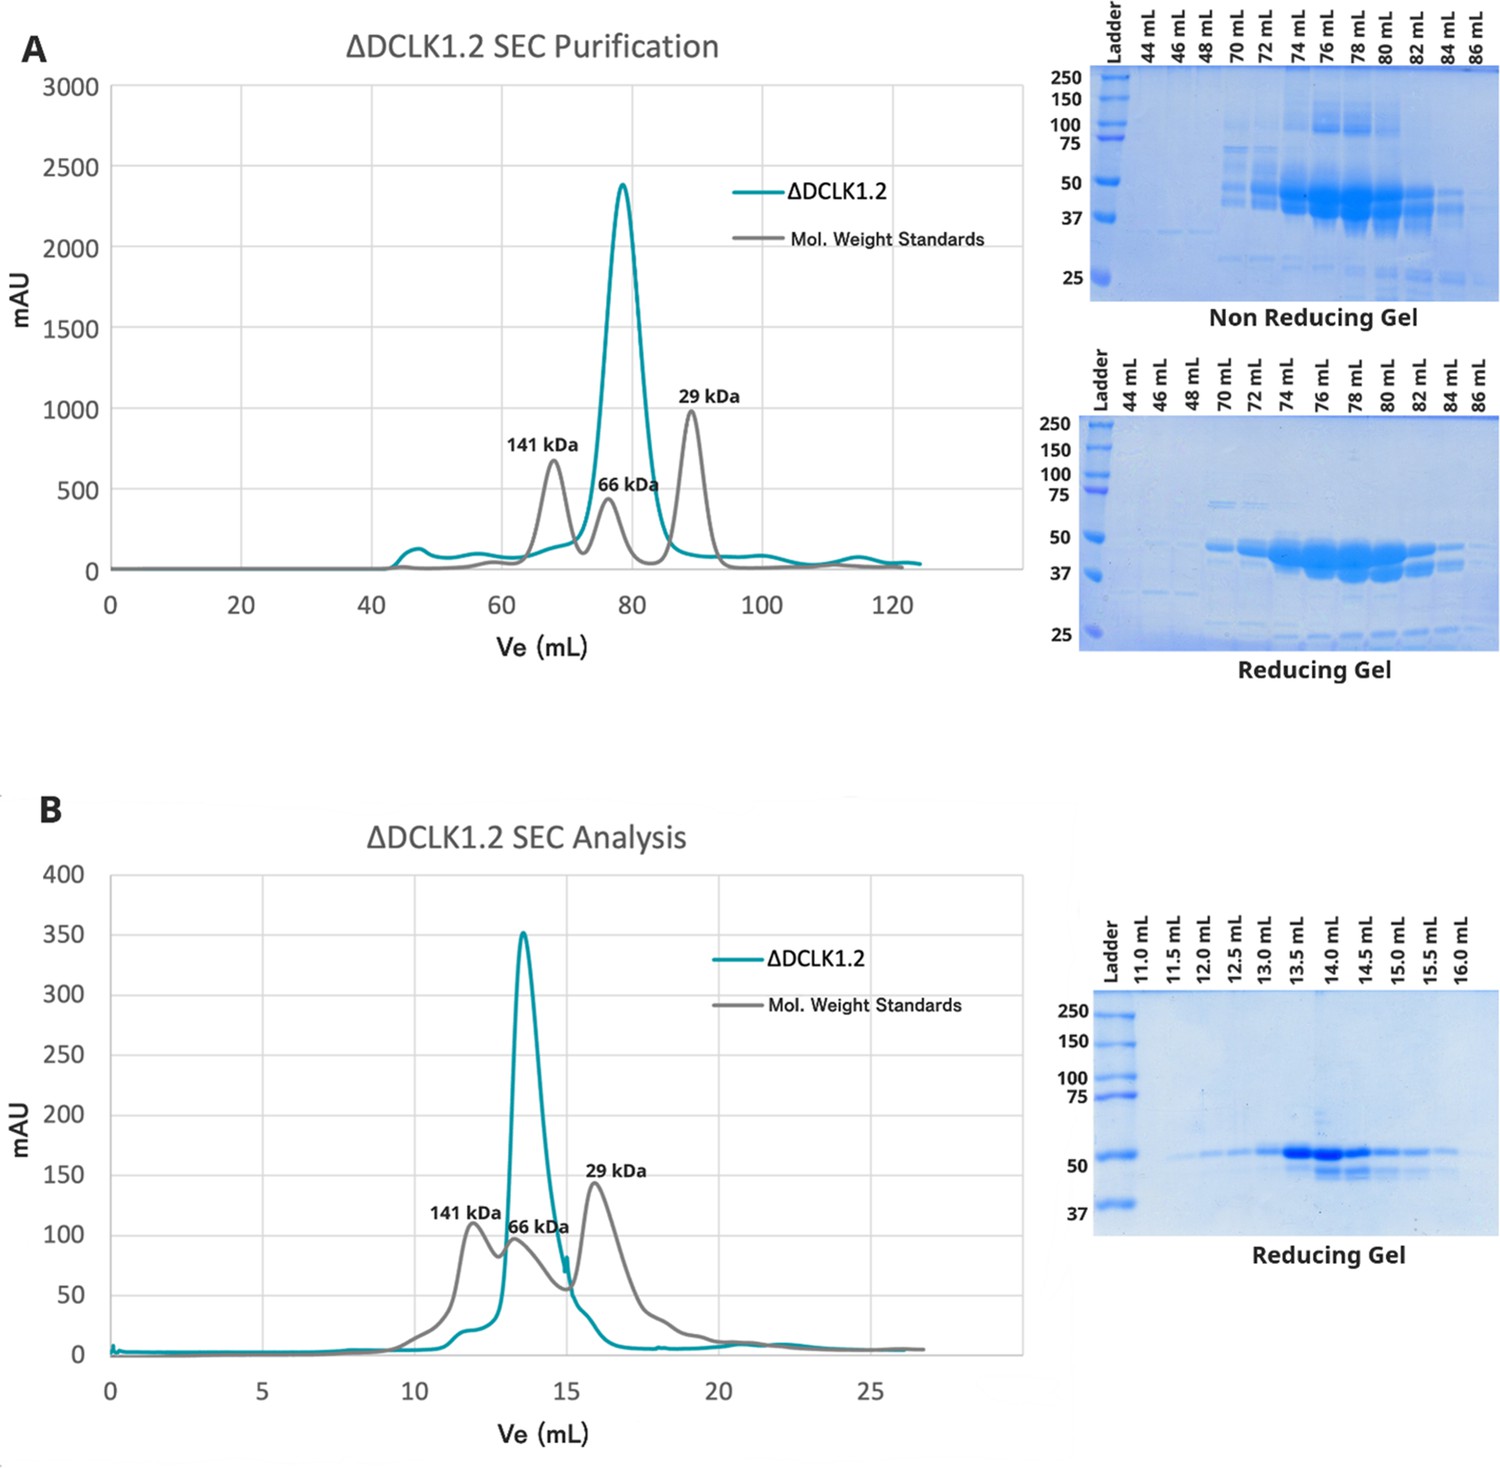
Analysis and Confirmation of Monomeric DCLK1.2351-740 Through Size Exclusion Chromatography and SDS-PAGE.
(A) Purification of DCLK1.2351-740 by size exclusion chromatography (SEC) reveals a single peak, representing monomeric protein in solution. Reducing and non-reducing SDS-PAGE showing the elution profiles of the purified proteins. (B) Analytical SEC of purified DCLK1.2351-740 (1.1 mg) confirms a single monomeric species.
-
Figure 3—figure supplement 2—source data 1
Uncropped and unlabeled gel from DCLK1.2 size exclusion chromatography (SEC).
- https://cdn.elifesciences.org/articles/87958/elife-87958-fig3-figsupp2-data1-v1.zip
Figure 3—figure supplement 3
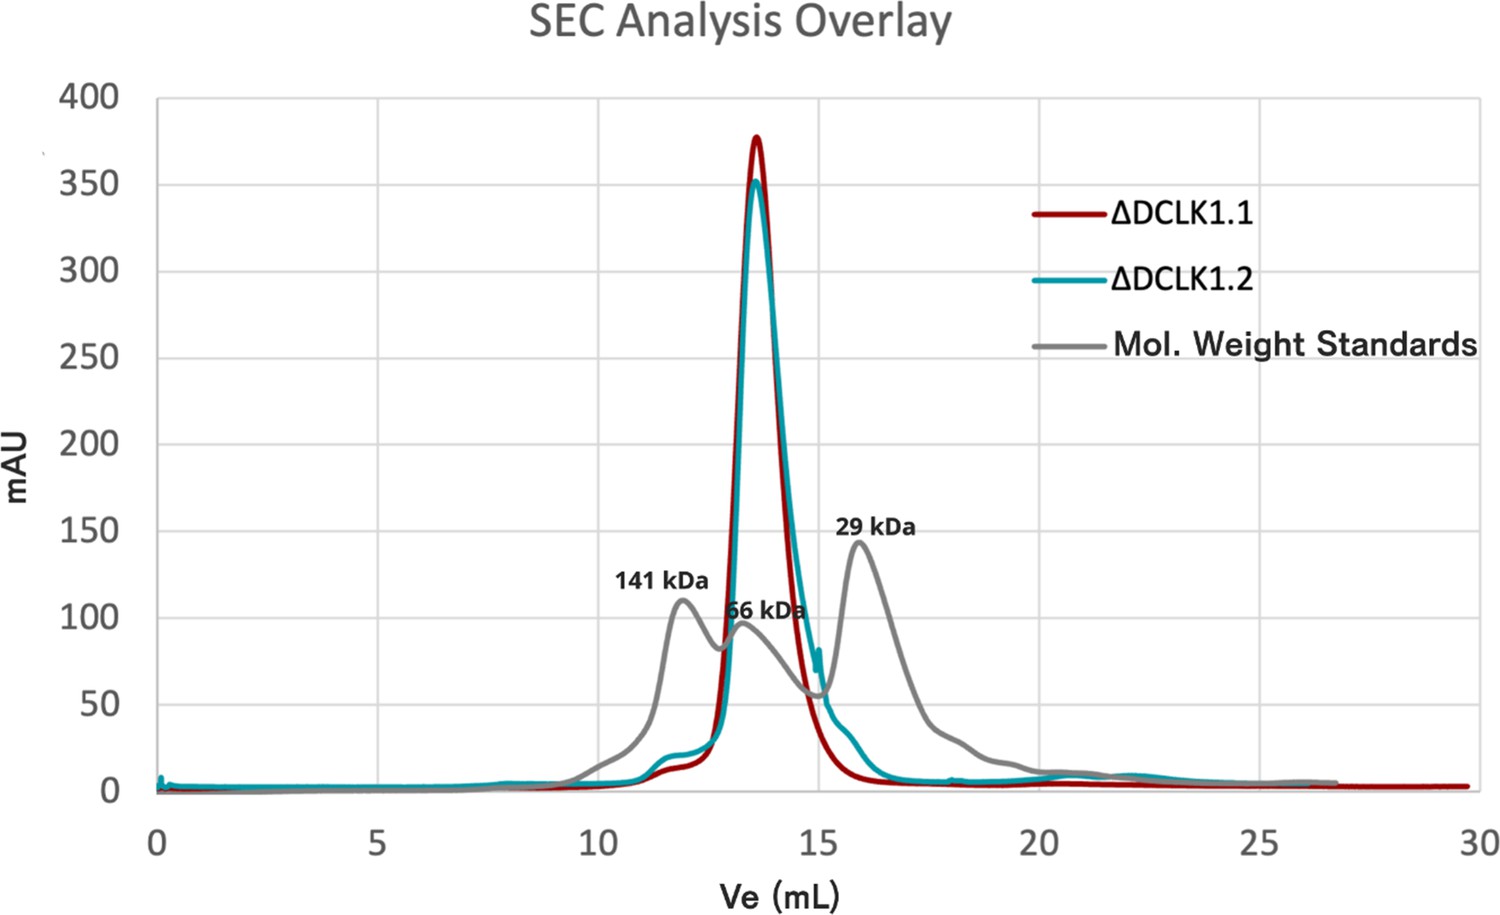
Analytical size exclusion chromatography (SEC) of DCLK1.1351-729 and DCLK1.2351-740.
Overlaid chromatograms showing elution profiles for both proteins and molecular weight standards. Both DCLK1 isoforms elute as single peaks at the predicted molecular weight for the monomeric protein.
Figure 3—figure supplement 4
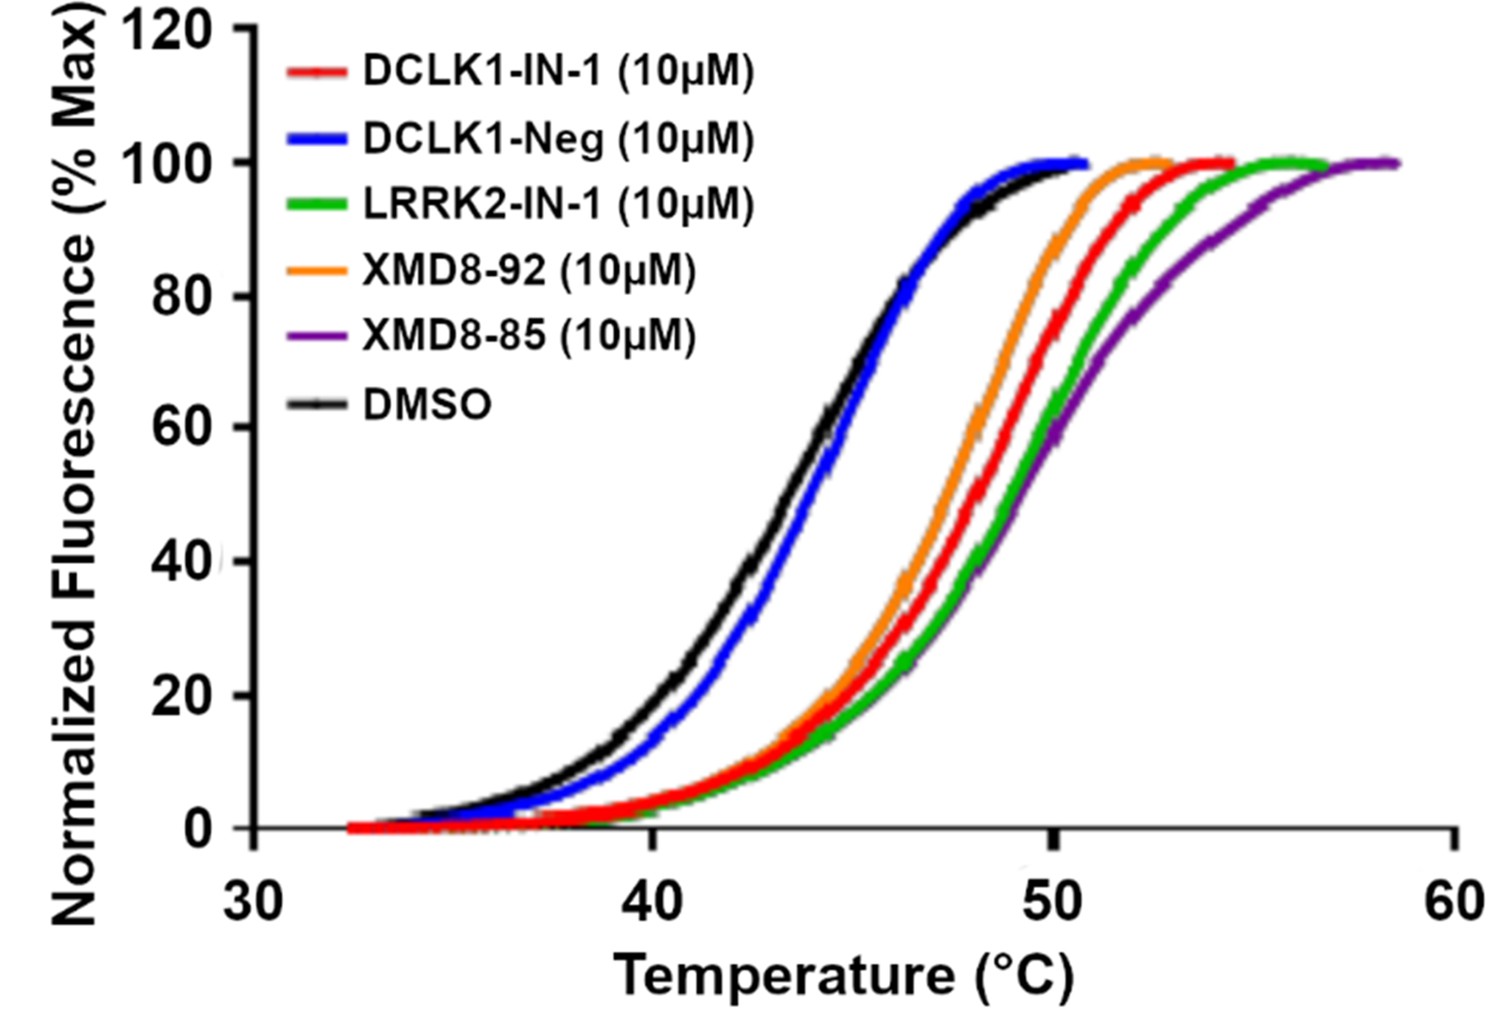
Differential scanning fluorimetry (DSF) profile of DCLK1351-689 in the presence of DMSO or a panel of DCLK1 inhibitor compounds.
DCLK1-Neg is a negative control.
Figure 4
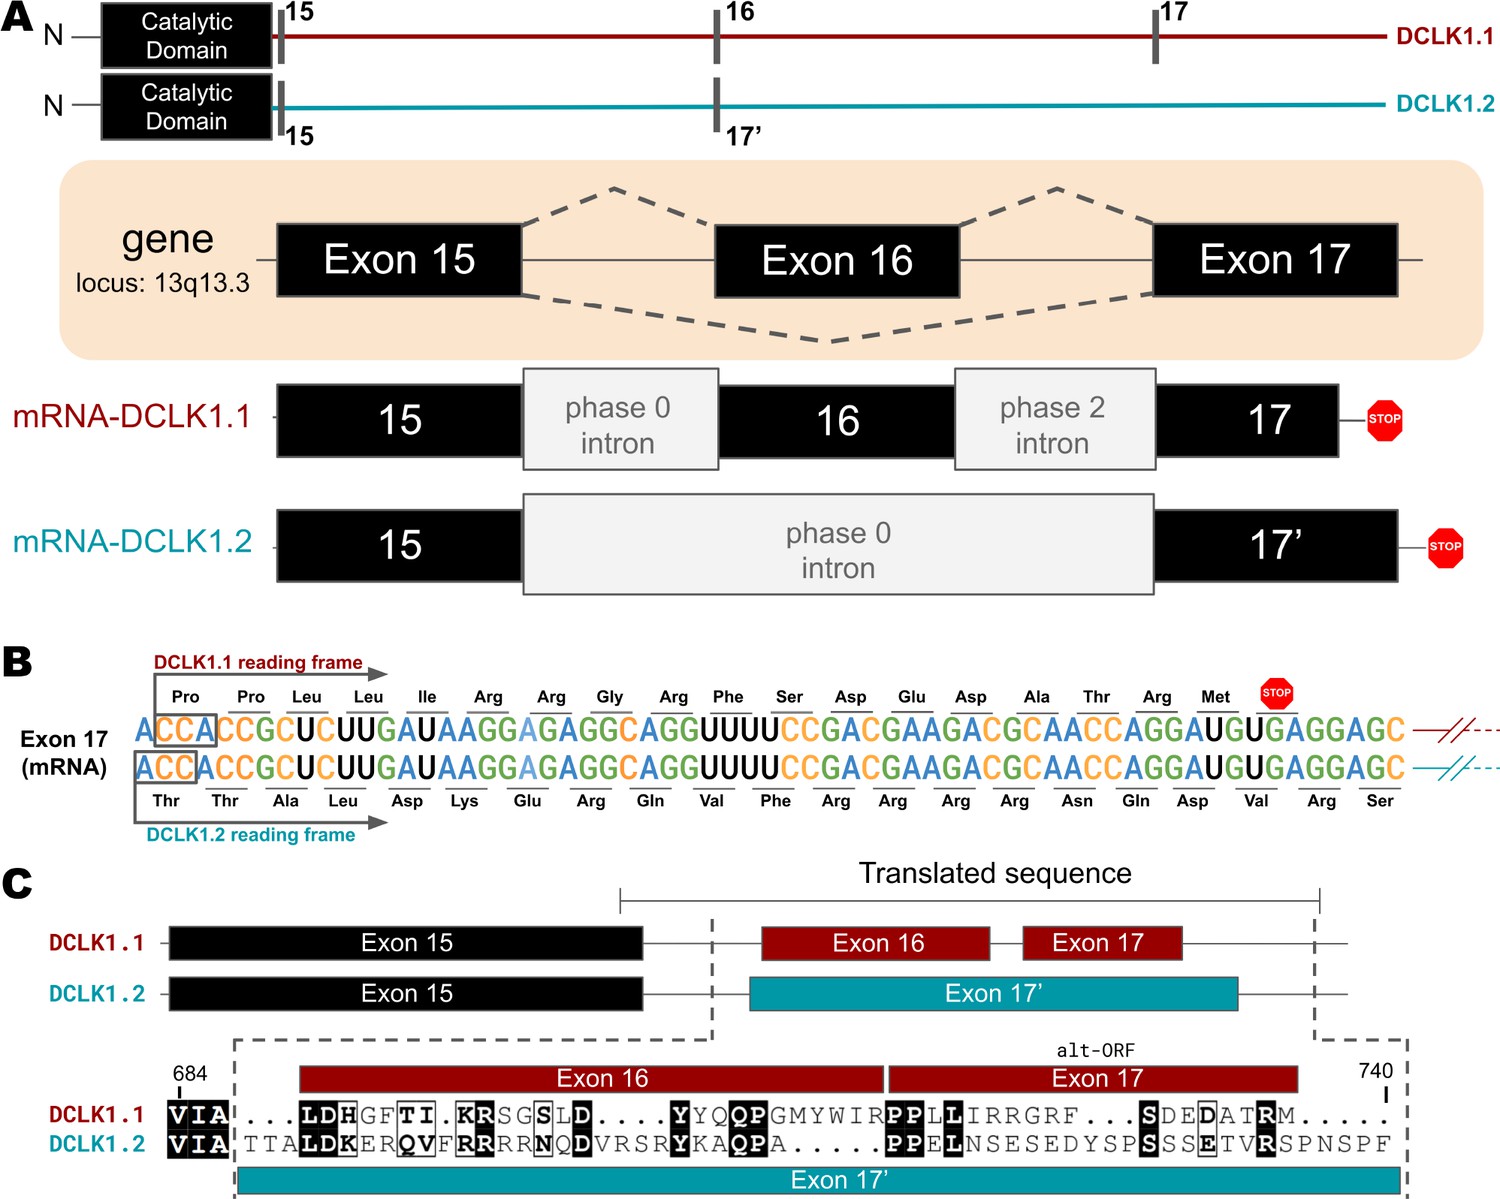
Transcriptional Variations in the C-terminal Tail of Human DCLK1 Isoforms: Gene Organization, Exon Alternation, and Protein Sequence Alignment.
(A) Gene and intron-exon organization of DCLK1 human isoforms in the C-terminal tail. The DCLK1 gene is present on locus 13q13.3, and isoforms 1 and 3 contain an additional exon (exon 16) in the C-terminal tail that is absent in DCLK1.2. (B) A phase 2 intron results in the alternative transcript of exon 17 in isoform 1, translating a different open-reading frame and early stop codon, resulting in the shorter sequence. (C) Cartoon organization of the C-tail exons (exon 15, 16, and 17) of the DCLK1 isoforms, comparing the translated protein sequence alignment.
-
Figure 4—source data 1
Scipio output for intron-exon analysis of DCLK1.1.
- https://cdn.elifesciences.org/articles/87958/elife-87958-fig4-data1-v1.zip
-
Figure 4—source data 2
Scipio output for intron-exon analysis of DCLK1.2.
- https://cdn.elifesciences.org/articles/87958/elife-87958-fig4-data2-v1.zip
-
Figure 4—source data 3
Scipio output for intron-exon analysis of DCLK1.3.
- https://cdn.elifesciences.org/articles/87958/elife-87958-fig4-data3-v1.zip
-
Figure 4—source data 4
Scipio output for intron-exon analysis of DCLK1.4.
- https://cdn.elifesciences.org/articles/87958/elife-87958-fig4-data4-v1.zip
Figure 5 with 3 supplements
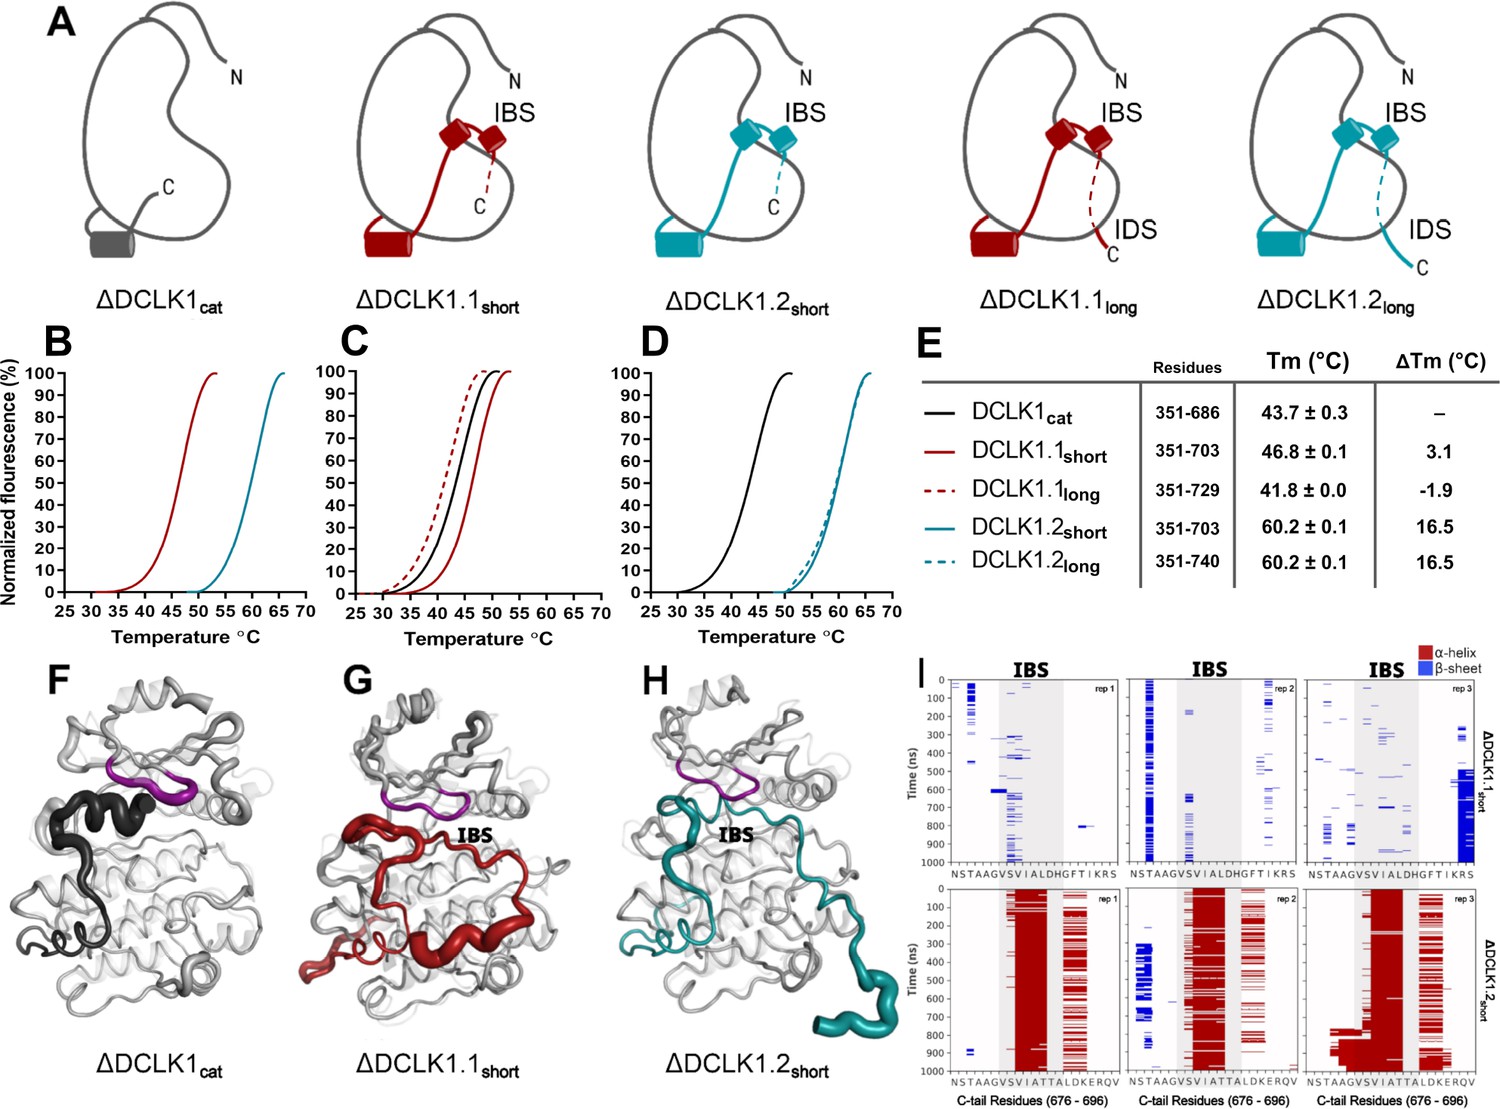
Structural Analysis, Thermal Stability, and Molecular Dynamics of DCLK1 Variants: Insights into the IBS and IDS Domains.
(A) Cartoons of DCLK1 construct used in our assays, portraying the locations of the inhibitory-binding segment (IBS) and the intrinsically disordered segment (IDS). (B–E) Differential scanning fluorimetry (DSF) thermal denaturation profiling of the purified DCLK1 core catalytic domain, or tail-matched DCLK1.1 and DCLK1.2 proteins. Unfolding curves and changes in Tm values (ΔTm) for each protein relative to WT DCLK1cat are indicated. (F–H) B-factor structural representations of DCLK1short proteins shown in (A). The width of the region indicates the extent of flexibility based on averaged root mean square fluctuation (RMSF) data from three 1 µs molecular dynamics (MD) replicates. (I) DSSP analysis of three replicates of 1 µs MD simulations showing the residues surrounding the IBS in the C-tail of DCLK1.1short and DCLK1.2short. Blue indicates the presence of a beta-sheet or beta-bridge secondary structures and red indicates the presence of alpha-helical structures.
-
Figure 5—source data 1
Root mean square fluctuation (RMSF) values for each mutant from all replicates of molecular dynamics (MD) simulations.
- https://cdn.elifesciences.org/articles/87958/elife-87958-fig5-data1-v1.xlsx
Figure 5—figure supplement 1
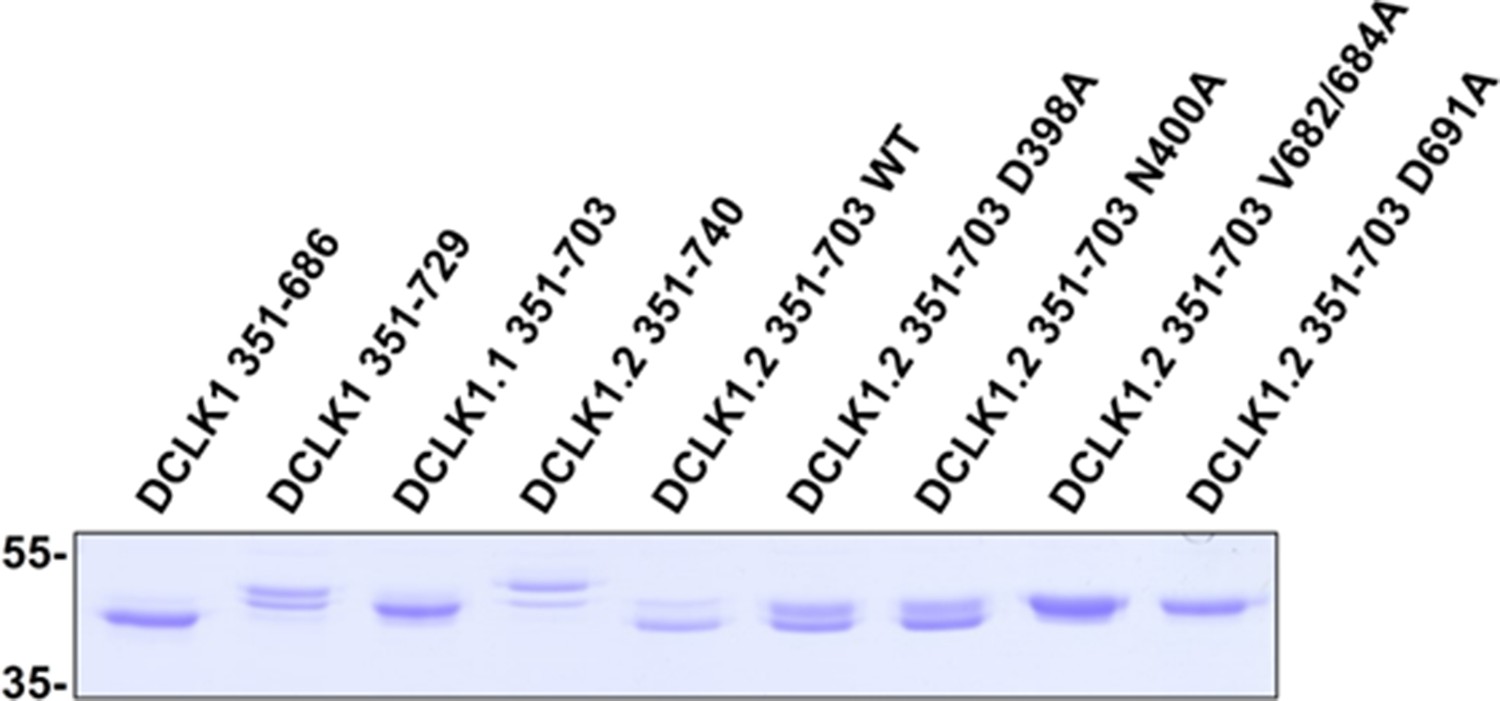
SDS-PAGE and Coomassie blue staining of each DCLK1 protein.
-
Figure 5—figure supplement 1—source data 1
Uncropped gel from SDS-PAGE of DCLK1 proteins.
- https://cdn.elifesciences.org/articles/87958/elife-87958-fig5-figsupp1-data1-v1.zip
-
Figure 5—figure supplement 1—source data 2
PowerPoint file containing labels for Source Data 1.
- https://cdn.elifesciences.org/articles/87958/elife-87958-fig5-figsupp1-data2-v1.pptx
Figure 5—figure supplement 2
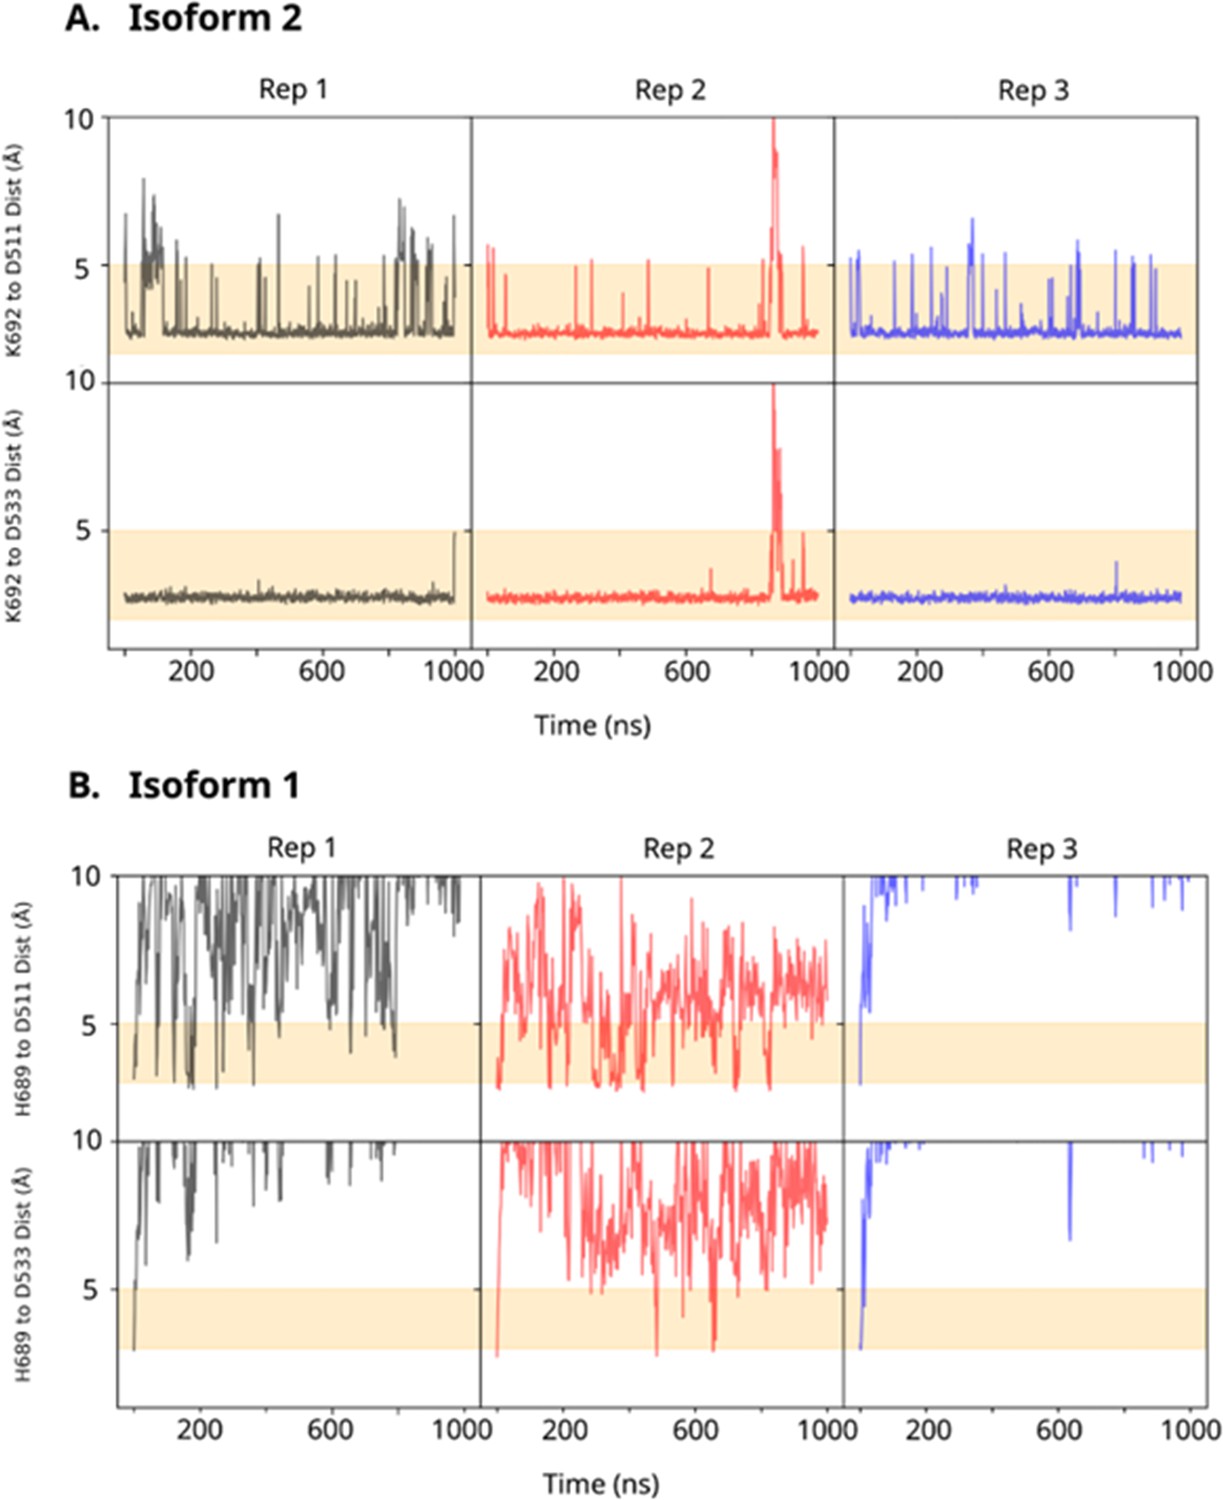
Comparative Interaction Analysis of K692 and H689 in DCLK1 C-tail Variants with DFG and HRD Aspartates.
(A) Minimum distance of K692 in the DCLK1.2 C-tail forms significant stable interactions over microsecond replicates to the DFG and HRD aspartates. (B) H689 in the DCLK1.1 C-tail comparatively fails to interact with the DFG and HRD aspartates.
Figure 5—figure supplement 3
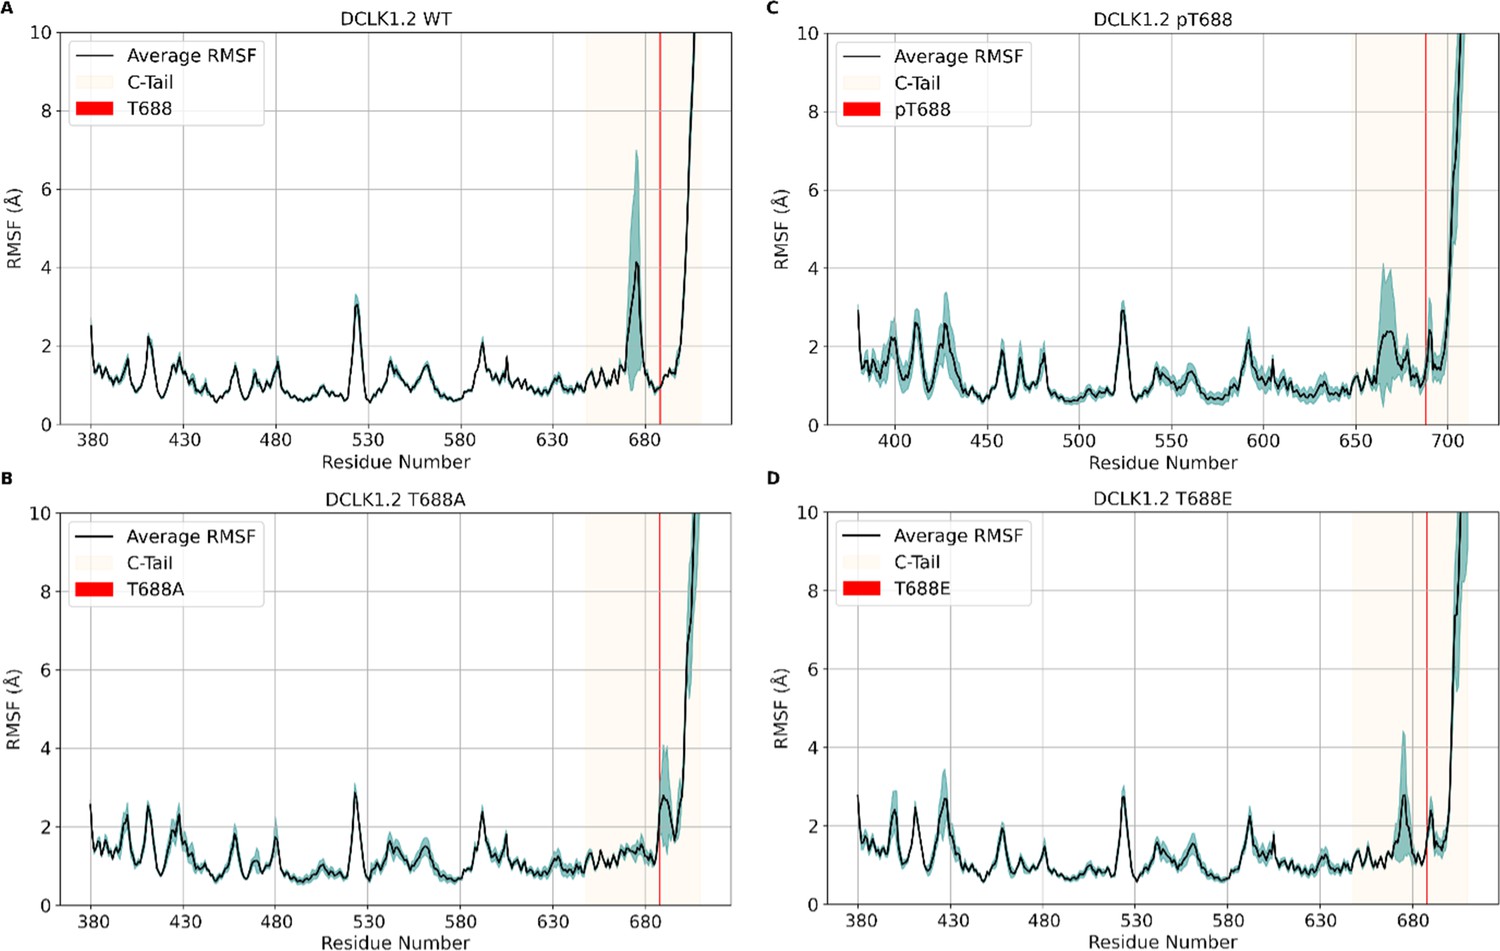
Root mean square fluctuation (RMSF) plots of molecular dynamics (MD) simulations of (A) ΔDCLK1.2 WT, (B) T688A, (C) pT688, and (D) T688E, where T688 is demarcated by a red line and the entire ΔDCLK1.2 C-tail is highlighted in light yellow.
The black line represents the average RMSF between three 500 ns replicates and the blue shading represents standard deviation of the replicates, where less shading indicates convergence between replicates and increased shading indicates deviation.
Figure 6 with 2 supplements
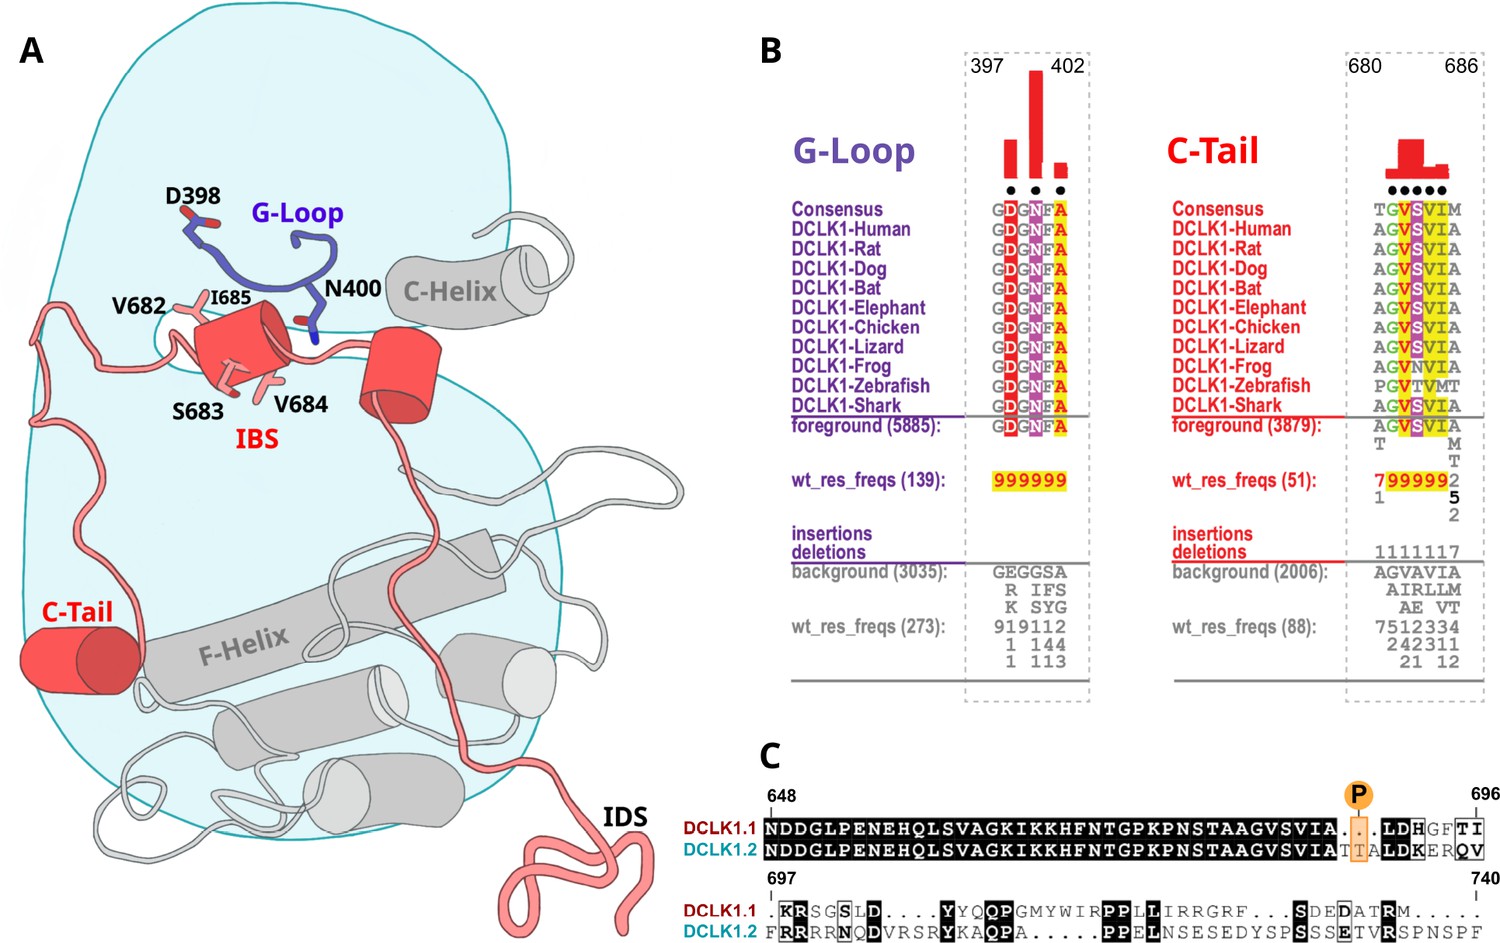
Identification of doublecortin-like kinase (DCLK)-specific constraints.
(A) Cartoon of DCLK1.2 and the intrinsically disordered segment (IDS) with evolutionary constraints mapped to the kinase domain and C-tail. (B) Sequence constraints that distinguish DCLK1/2/3 sequences from closely related calcium calmodulin kinase (CAMK) sequences are shown in a contrast hierarchical alignment (CHA). The CHA shows DCLK1/2/3 sequences from diverse organisms as the display alignment. The foreground consists of DCLK sequences while the background alignment contains related CAMK sequences. The foreground and background alignments are shown as residue frequencies below the display alignment in integer tenths (Manning et al., 2002; Agulto et al., 2021; Bayer and Schulman, 2019; Gógl et al., 2019; Berginski et al., 2021; Sossey-Alaoui and Srivastava, 1999; Ohmae et al., 2006; Couillard-Despres et al., 2005; Horesh et al., 1999). The histogram (red) indicates the extent to which distinguishing residues in the foreground diverge from the corresponding position in the background alignment. Black dots indicate the alignment positions used by the Bayesian partitioning with pattern selection (BPPS) (Neuwald, 2014) procedure when classifying DCLK sequences from related CAMK sequences. Alignment number is based on the human DCLK1.2 sequence (UniProt ID: O15075-2). (C) Sequence alignment of human DCLK1 isoforms.
Figure 6—figure supplement 1
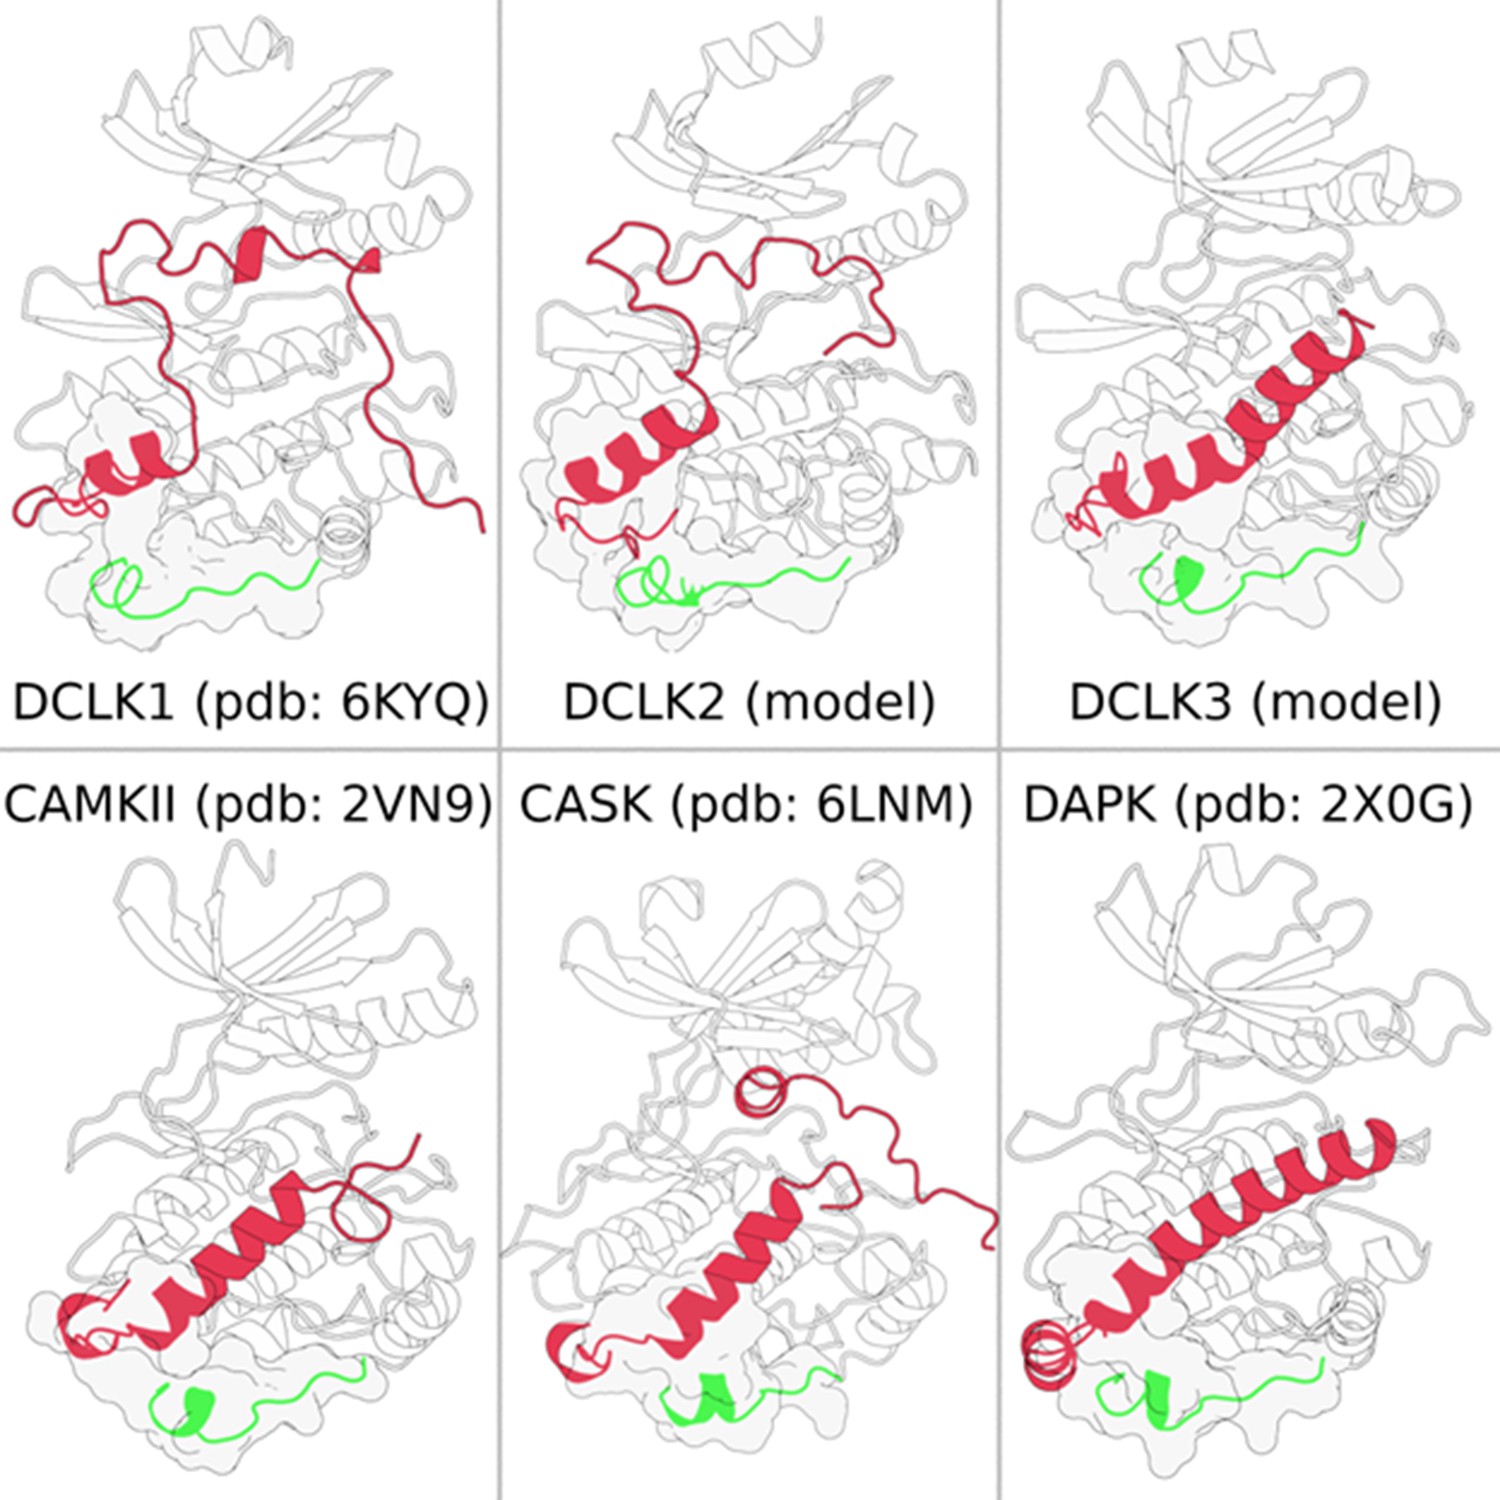
Calcium calmodulin kinase (CAMK)-specific insert (green) consistently making structural contacts (shown in surface representation) with the C-tail (red) across multiple CAMK families.
Figure 6—figure supplement 2

Identification of doublecortin-like kinase (DCLK) family-specific constraints.
(A) Sequence alignment of human DCLK paralogs including long and short isoforms of DCLK1. (B) Sequence constraints that distinguish DCLK1/2/3 sequences from closely related calcium calmodulin kinase (CAMK) sequences are shown in a contrast hierarchical alignment (CHA). The CHA shows DCLK1/2/3 sequences from diverse organisms as the display alignment. The foreground consists of 3564 DCLK sequences while the background alignment contains 27,299 related CAMK sequences. The foreground and background alignments are shown as residue frequencies below the display alignment in integer tenths (Manning et al., 2002; Agulto et al., 2021; Bayer and Schulman, 2019; Gógl et al., 2019; Berginski et al., 2021; Sossey-Alaoui and Srivastava, 1999; Ohmae et al., 2006; Couillard-Despres et al., 2005; Horesh et al., 1999). The histogram (red) indicates the extent to which distinguishing residues in the foreground diverge from the corresponding position in the background alignment. Black dots indicate the alignment positions used by the Bayesian partitioning with pattern selection (BPPS) (Neuwald, 2014) procedure when classifying DCLK sequences from related CAMK sequences. Alignment number is based on the human DCLK1 sequence (Uniprot ID: O15075-1).
Figure 7 with 1 supplement
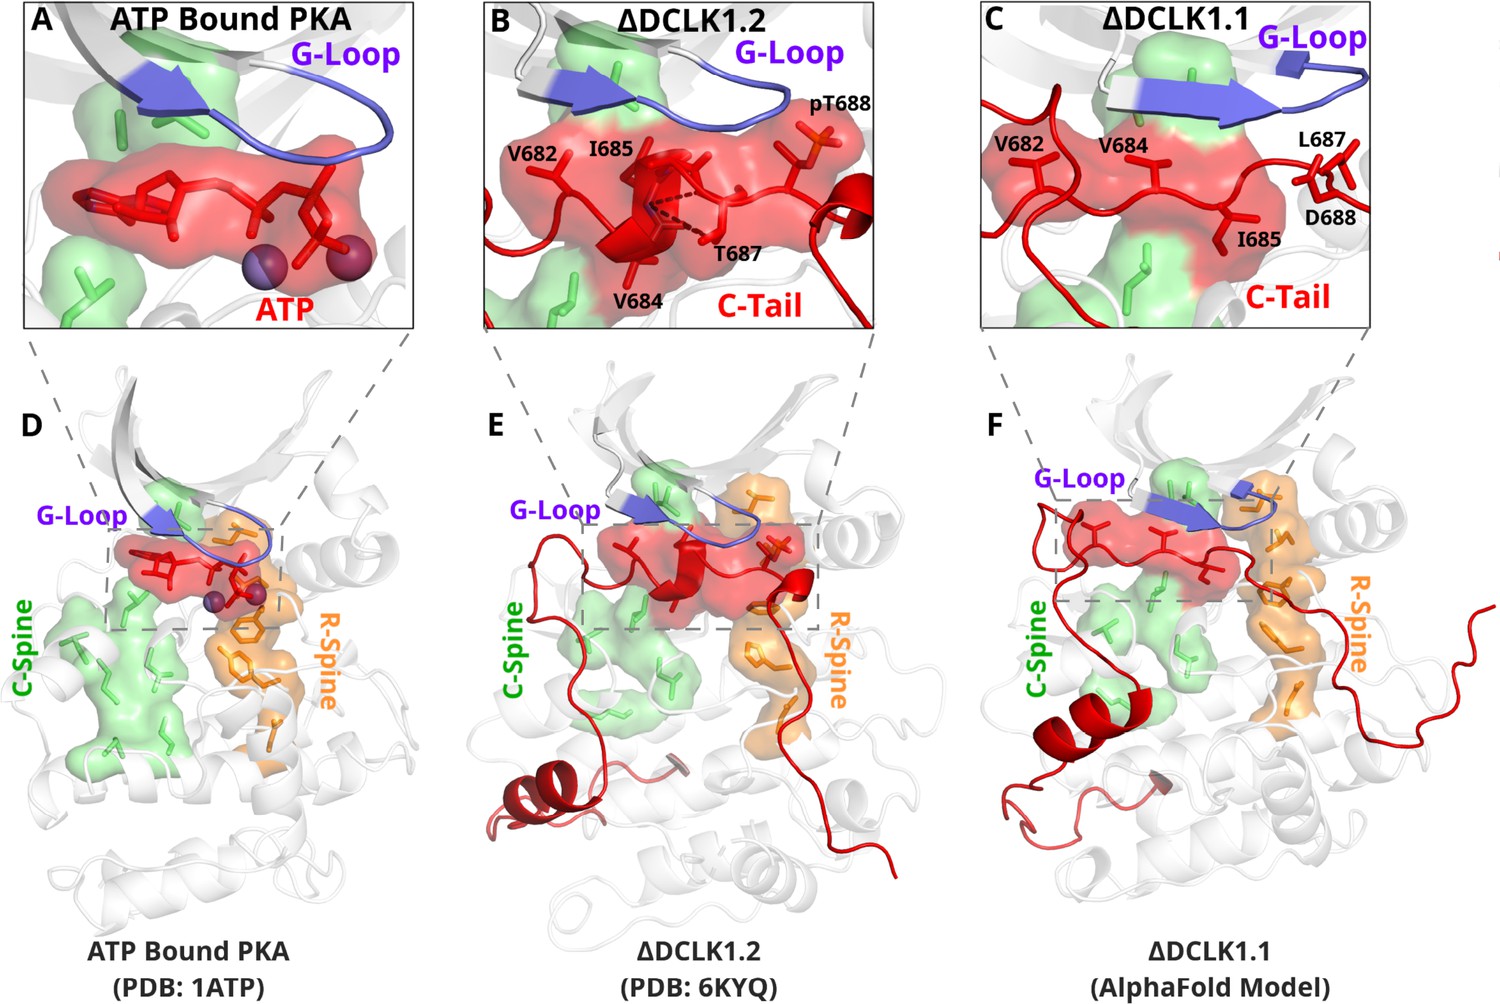
The DCLK1 C-tail 'completes’ the regulatory C-spine (green).
(A) PKA crystal structure (PDB: 1ATP) with bound ATP in red and Mg2+ in purple. The C-spine is completed by the adenine ring of ATP. The gamma phosphate of ATP hydrogen bonds with the second glycine of the G-loop. (B) DCLK1.2 crystal structure (PDB: 6KYQ) showing how the C-tail (red) docks underneath the pocket and mimics the ATP structure. The C-spine is completed by V682 and V684 in the C-tail and helical segments defined using DSSP are shown. T687 is also depicted making multiple hydrogen bonds with the backbone of V684 and I685 (dashed lines). (C) DCLK1.1 AlphaFold2 model showing an unstructured loop in the C-tail docking into the ATP-binding pocket, where V684 and I685 are predicted to complete the C-spine. The average per-residue confidence of the C-tail is 49%. (D–F) Zoomed-out versions of A–C, demonstrating how the DCLK1 C-tail docks into the ATP-binding cleft, akin to ATP in PKA.
Figure 7—figure supplement 1

Molecular dynamics of DCLK1 isoforms.
(A–B) Microsecond molecular dynamics (MD) replicates from DCLK1.1 and DCLK1.2, showing the DSSP output plotted for the C-tail, where red lines represent alpha helices and blue lines represent beta-sheets. (C) Distance plots from MD replicates of the phosphorylated threonine highlighting the contact distance between pT688 phosphate and G399 of the G-loop.
Figure 8 with 2 supplements

Structural and Functional Analysis of DCLK1.2 Variants: Insights into Amino Acid Modifications, Thermal Stability, and Kinase Activity.
(A) Structural depiction of DCLK1.2 (PDB: 6KYQ) showing the location of modified DCLK1 amino acids on the G-loop (purple) or C-tail (red). (B–C) Differential scanning fluorimetry assays depicting thermal denaturation profiles of each protein along with the calculated Tm value. (D) Kinase assays. DCLK1-dependent phosphate incorporation (pmol/min) into the DCLK1 peptide substrate was calculated for DCLK1cat, long and short DCLK1.1, and the indicated DCLK1.2 variants. (E) Thermal stability analysis in the presence of ATP or DCLK1-IN-1 for DCLK1 proteins. For DCLK1.2, all proteins were generated in the DCLK1.2 short background.
Figure 8—figure supplement 1
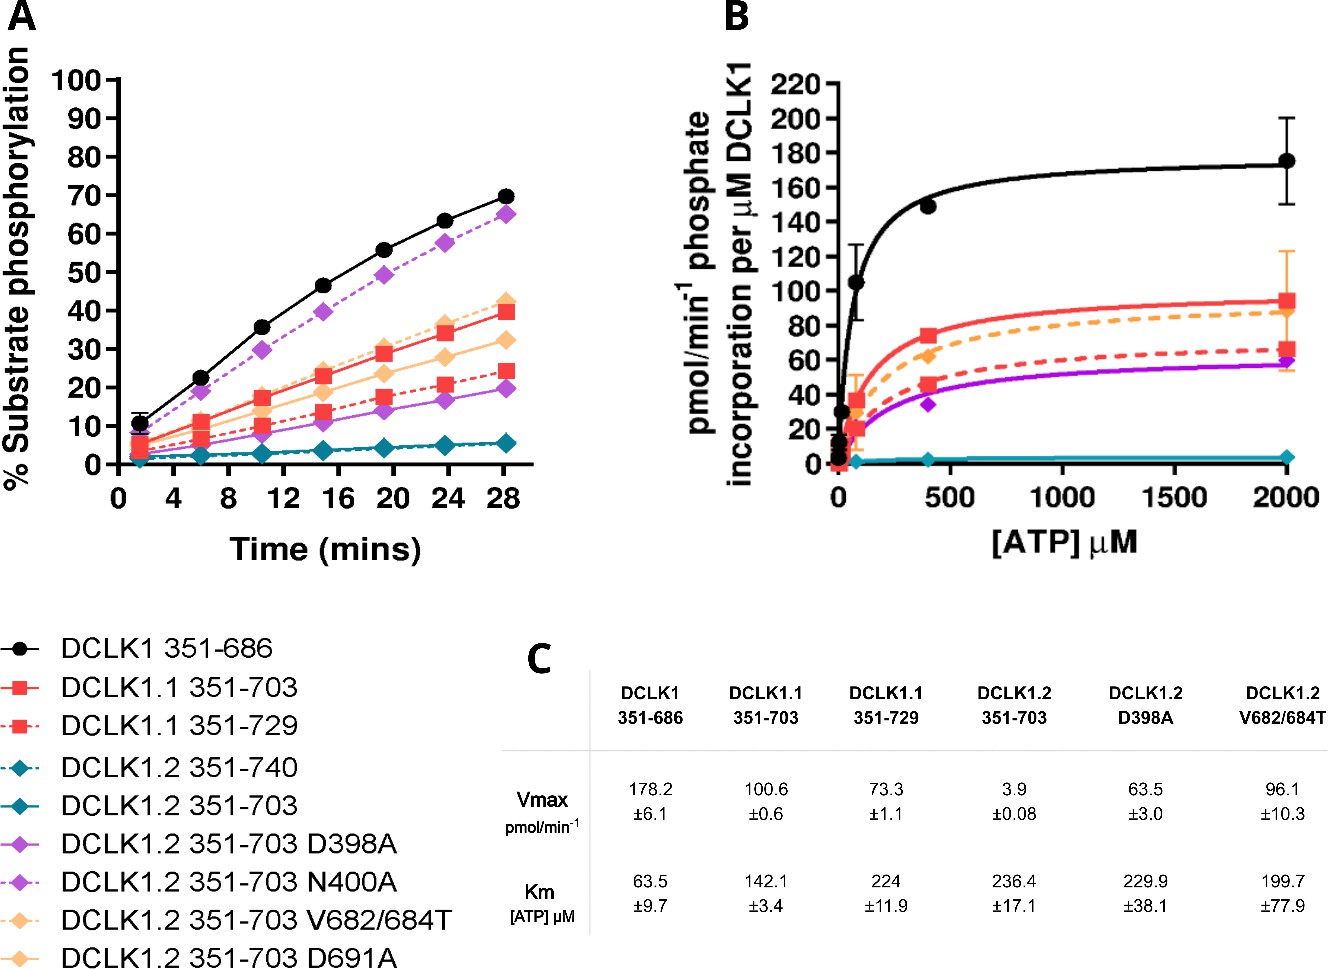
Kinetic Analysis of DCLK1 Proteins: Phosphorylation Dynamics, ATP Affinity, and Derived Kinetic Parameters.
(A) DCLK1 substrate phosphorylation (calculated as % total phosphopeptide) was quantified as a function of time for each of the indicated purified DCLK proteins in the presence of 1 mM ATP. Assays were performed side-by-side. Data is mean and SD from (N=4) independent experiments. (B) Michaelis-Menten plots showing normalized DCLK1 activity in the presence of increasing concentrations of ATP, to tease apart effects of C-tail on ATP affinity. Data shown is mean and SD from (N=3) independent experiments. (C) Table of calculated Vmax and Km [ATP] values obtained from (B).
Figure 8—figure supplement 2
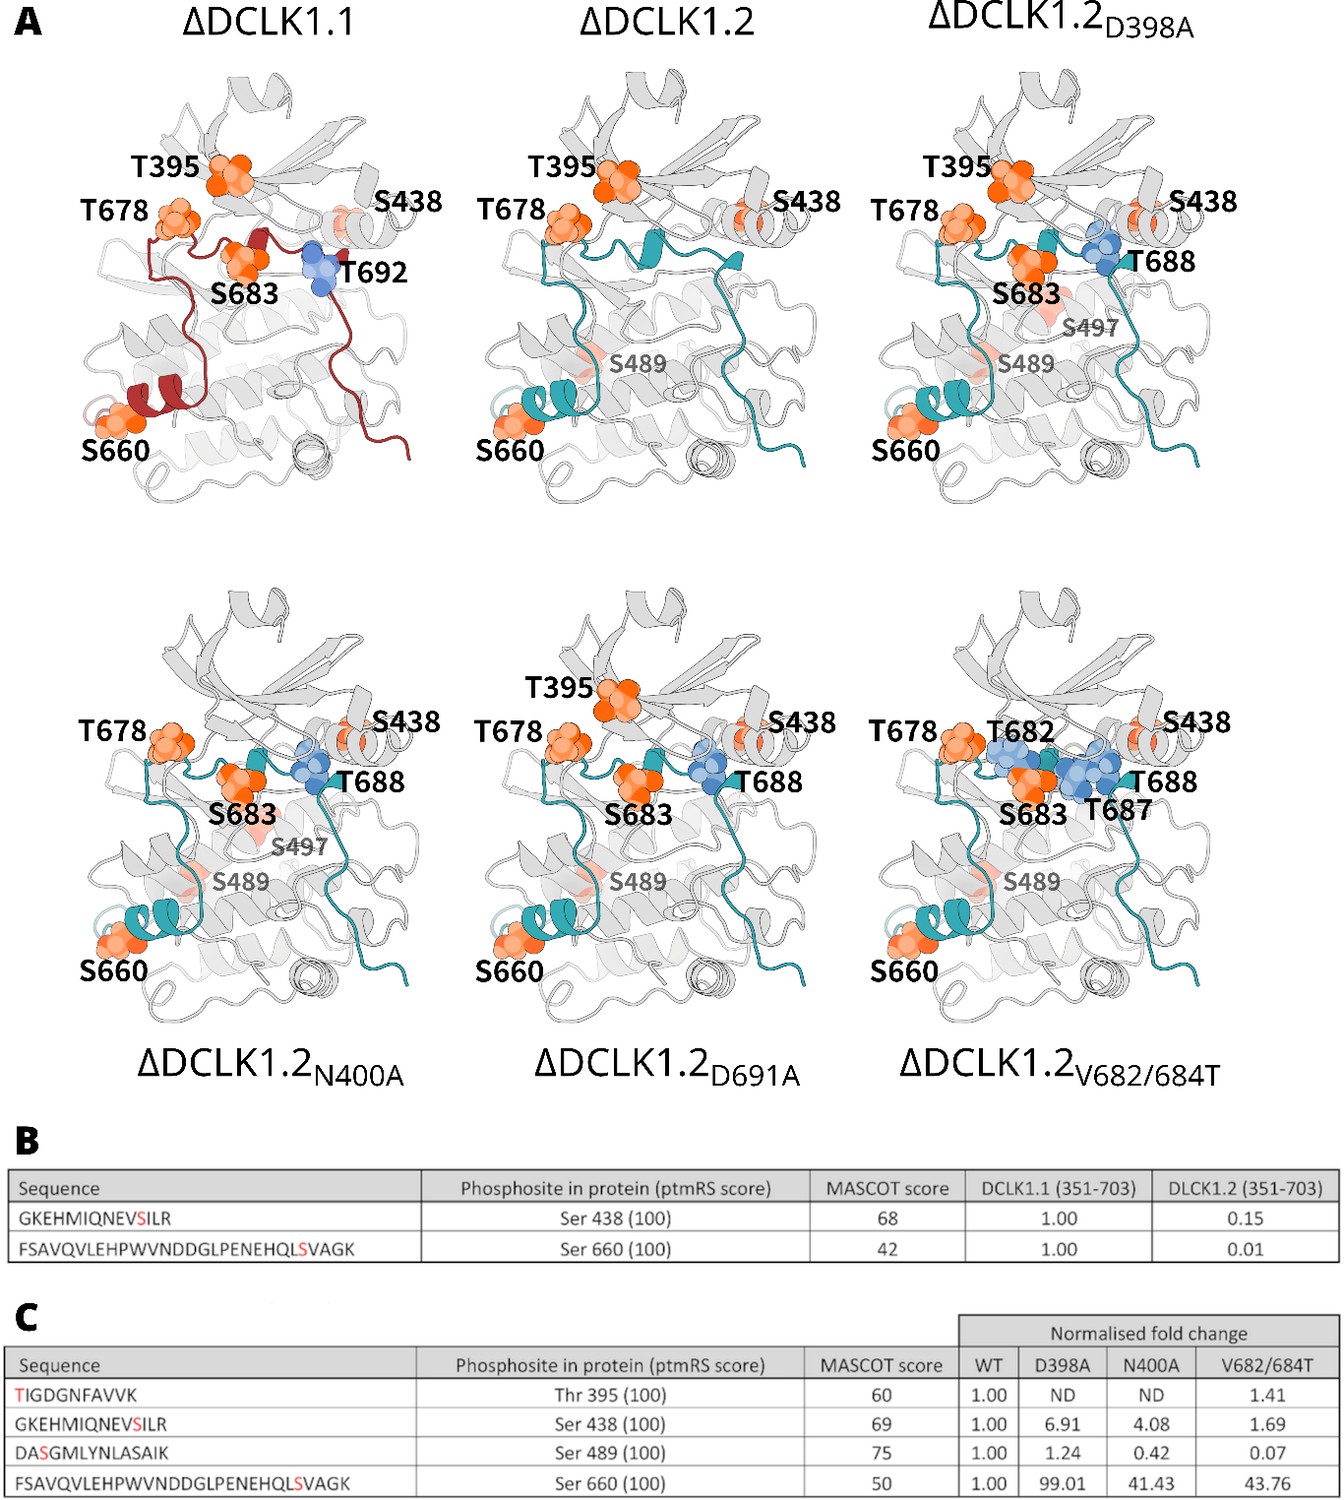
Comprehensive Phosphorylation Site Mapping and Quantitative Analysis of DCLK Isoforms Using LC-MS/MS.
(A) All mapped doublecortin-like kinase (DCLK) phosphorylation sites derived from LC-MS/MS analysis of DCLK1.1 and DCLK 1.2 proteins. Identified sites of phosphorylation at the kinase domain are colored in orange with isoform or mutant-specific phosphorylation sites colored in blue and mapped onto the structure of each protein. (B) Quantitative LC-MS/MS data showing tryptic phosphopeptides identified from DCLK1.1 and -1.2 that were directly comparable between isoforms. Detailed are peptide sequences, identified sites of phosphorylation (red), the site of phosphorylation within the protein polypeptide, and the ptmRS score relevant to confidence of phosphosite localization, as well as the Mascot score for peptide identification. Fold-changes in the relative abundance of the two phosphopeptides in DCLK1.2 are computed with reference to these same two phosphopeptides in DCLK1.1, normalizing against three non-modified peptides to account for potential difference in the amount analyzed. (C) As described in B, quantitative LC-MS/MS data for sites directly comparable between DCLK1.2 and its variants. Fold-change in abundance could not be calculated for the peptide containing pThr 395 given the presence of the inserted amino acid mutations and the differences in relative ionization efficiency for the resulting tryptic peptide.
Figure 9 with 1 supplement

A DCLK1 C-tail can act as a multi-functional Swiss Army Knife, using six distinct segments for a variety of regulatory functions including mimicking ATP binding/association, stabilizing the G-loop, occluding the substrate-binding pocket, and packing against the kinase activation loop.
Figure 9—figure supplement 1

Intrinsic disorder prediction of DCLK1.2 C-tail using IUPRED3.
Tables
Table 1
Names of doublecortin-like kinase (DCLK) isoforms discussed in this paper, along with their respective isoform number, UniProt identification, and alternate names that have been used.
| Name (this Study) | Isoform number | UniProt ID | Alternate names |
|---|---|---|---|
| DCLK1.1 | 1 | O15075-2 | DCAMKL1 alpha |
| DCLK1.2 | 2 | O15075-1 | DCAMKL1 beta |
| ΔDCLK1.1 | 3 | O15075-3 | |
| ΔDCLK1.2 | 4 | O15075-4 |
Additional files
Download links
A two-part list of links to download the article, or parts of the article, in various formats.
Downloads (link to download the article as PDF)
Open citations (links to open the citations from this article in various online reference manager services)
Cite this article (links to download the citations from this article in formats compatible with various reference manager tools)
Mechanistic and evolutionary insights into isoform-specific ‘supercharging’ in DCLK family kinases
eLife 12:RP87958.
https://doi.org/10.7554/eLife.87958.3


