Exploring the K+ binding site and its coupling to transport in the neurotransmitter:sodium symporter LeuT
- Laboratory for Membrane Protein Dynamics, Department of Neuroscience, Faculty of Health and Medical Sciences, University of Copenhagen, Denmark
- Membrane Transport Biophysics Section, National Institute of Neurological Disorders and Stroke, National Institutes of Health, United States
Figures
Figure 1 with 1 supplement
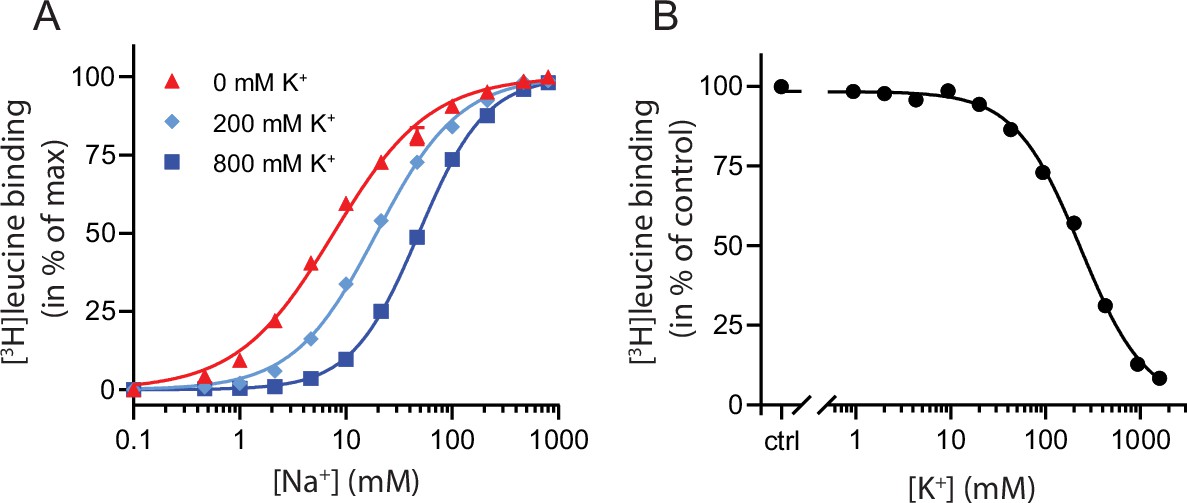
K+ competitively inhibits Na+-mediated [3H]leucine binding in LeuT.
(A) Na+-mediated [3H]leucine (10× Kd) binding to purified LeuT in the absence (red triangles) or presence of 200 mM (light blue diamond) or 800 mM (blue squares) K+. Data are normalized to Bmax and fitted to a Hill equation, yielding EC50 values in 0, 200, and 800 mM K+ of 7.7 [7.3; 8.1], 19.4 [19.1; 19.8], and 48.5 [47.5; 49.5] mM, respectively. (B) K+-dependent displacement of Na+-mediated [3H]leucine binding in the presence of 7.7 mM Na+, which corresponds to the EC50 determined in (A). Data are normalized to a control with 0 mM K+ and fitted to a Hill equation with an IC50 value of 234.8 [224.8; 243.1] mM. All data points are shown as mean ± standard error of the mean (s.e.m.), n=3–6 conducted in triplicates. Error bars often smaller than data points. EC50 and IC50 values are reported as mean [s.e.m. interval]. The ionic strength was maintained by substituting Na+ and K+ with Ch+. All data is provided in the source data file.
-
Figure 1—source data 1
Excel file containing data for (A) Na+-mediated [3H]leucine binding to purified LeuT in the absence of K+, and (B) K+-dependent displacement of Na+-mediated [3H]leucine binding.
- https://cdn.elifesciences.org/articles/87985/elife-87985-fig1-data1-v1.zip
Figure 1—figure supplement 1
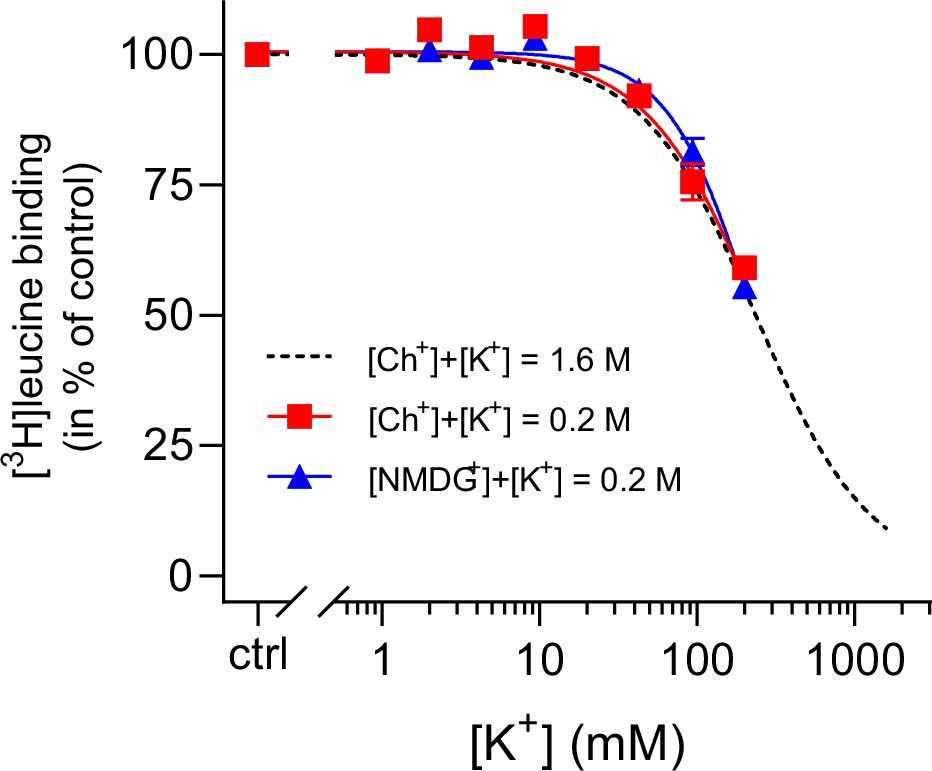
K+ inhibition is preserved for LeuT in low ionic strength.
(A) Displacement of Na+-mediated [3H]leucine (10× Kd) binding to LeuT by 0–200 mM K+, using Ch+ (red squares) or N-methyl-D-glucamine (NMDG+) (blue triangles) as the counter ion. Displacement with 0–1600 mM K+, using Ch+ as counter ion, is shown for reference (black dashed line, from Figure 1B). The assay is performed in the presence of 7.7 mM Na+. Data are normalized to a control with 0 mM K+ and modeled by the Hill equation. Data are shown as mean ± s.e.m. (error bars often smaller than data points), n=3–6 conducted in triplicates. The IC50 values obtained using up to 0.2 M Ch+ or NMDG+ as the counter ions were not significantly different from that obtained in a total ionic strength of 1.6 M (Dunnett’s multiple comparison test (one-way analysis of variance [ANOVA]), p=0.84 and p=0.99, respectively). All data is provided in the source data file.
-
Figure 1—figure supplement 1—source data 1
Excel file containing data for displacement of Na+-mediated [3H]leucine binding to LeuT by K+, using Ch+ or N-methyl-D-glucamine (NMDG+) as the counter ion.
- https://cdn.elifesciences.org/articles/87985/elife-87985-fig1-figsupp1-data1-v1.zip
Figure 2 with 1 supplement
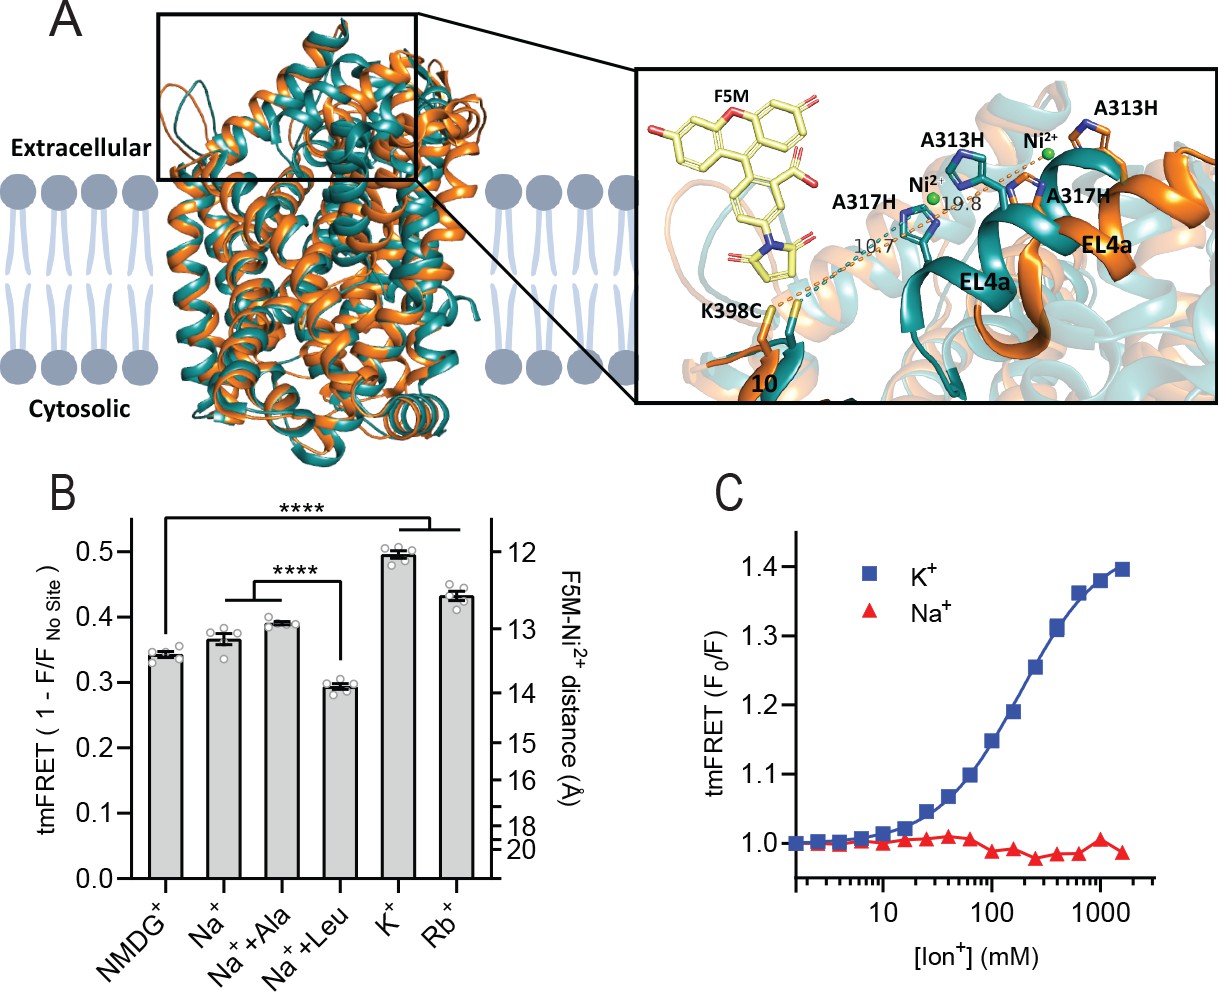
K+ shifts the conformational equilibrium toward an outward-closed state.
(A) Left: cartoon representation of the superimposed structures of LeuT in the outward-open Na+-bound state (orange; PDB-ID 3TT1) and inward-open state (turquoise; PDB-ID 3TT3), viewed parallel to the plane of the membrane. Right: enlarged view of the top of transmembrane (TM)10 and extracellular loop (EL)4a, carrying the fluorescein-5-maleimide (F5M) (yellow, shown adjacent to K398C) and the Ni2+-chelating His-X3-His site (A313H-A317H). Dashed lines indicate for both structures the distance between the coordinated Ni2+ ion (green) and the side chain sulfur of K398C (10.7 Å in 3TT3 and 19.8 Å in 3TT1). (B) Transition metal ion FRET (tmFRET) efficiencies (1 – F/Fno site) obtained for LeuT in 800 mM of the ions specified (±50 µM leucine or 200 µM alanine when indicated) upon saturation of the His-X3-His site with 10 mM Ni2+. Right vertical axis shows FRET efficiencies converted to distances by the FRET equation. ****p<0.0001 represents the significance levels from a Tukey multiple comparison-corrected one-way analysis of variance (ANOVA). (C) tmFRET (F0/F) as a function of Na+ (red triangles) or K+ (blue squares) performed on LeuTtmFRET in the presence of 750 µM Ni2+. The K+ response fitted to a Hill equation yields a Hill slope of 1.15±0.03 (mean ± s.e.m.) and an EC50 of 182.6 [176.4; 189.1] mM, mean [s.e.m. interval]. All data points represent mean ± s.e.m. (error bars often smaller than data points), n=3–5 conducted in triplicates. All data is provided in the source data file.
-
Figure 2—source data 1
Excel file containing data for Figure 2B and C providing transition metal ion FRET (tmFRET) efficiencies obtained for by the added ions in 10 mM Ni2+.
- https://cdn.elifesciences.org/articles/87985/elife-87985-fig2-data1-v1.zip
Figure 2—figure supplement 1

Transition metal ion FRET (tmFRET) principle and characterization of LeuTtmFRET.
(A) Theoretical FRET efficiencies (1 – F/Fno site) (left axis), converted to distances by the FRET equation (right axis), as a function of the relative population of the outward-closed (OC) state. This is according to Robs = (pOCROC–6+pOOROO–6)–6, where p and R refer to the fractions and distances, respectively, for the OC and outward-open (OO) states of LeuT (Alston et al., 2021). The plot is based on the distances determined in Figure 2A between the sulfur atom of K398C (transmembrane [TM]10) and the coordinated Ni2+ ion (extracellular loop [EL]4a) and relies on the assumption of a static distance distribution. (B) tmFRET efficiency (1 – F/Fno site) as a function increasing Ni2+ for LeuTtmFRET incubated in 800 mM of K+ (blue squares, EC50=25.6 [24.8; 26.5] µM), K++50 µM leucine (purple diamonds, EC50=24.6 [24.1; 25.1] µM), Na+ (red triangles, EC50=30.9 [29.1; 32.8] µM), Na++50 µM leucine (green triangles, EC50=26.8 [23.1; 30.4] µM) and N-methyl-D-glucamine (NMDG+) (black circles, EC50=85.1 [81.4; 88.8] µM). Data points are fitted to a Hill equation and EC50 values are given as mean [s.e.m. interval]. (C) tmFRET (F0/F) as a function of increasing Rb+ (purple) with Na+ (dotted line) and K+ (dashed line) for reference. Data points are fitted to a Hill equation. Data (A–C) are shown as means ± s.e.m., n=3–4 in triplicates. (D) tmFRET (F0/F) as a function of increasing K+, performed on LeuTK398C (lacking the His-X3-His site) in the presence of 750 µM Ni2+. Data points are shown as mean ± standard deviation (s.d.), n=1 in triplicates. Error bars often smaller than data points. All data is provided in the source data file.
-
Figure 2—figure supplement 1—source data 1
Excel file containing data for transition metal ion FRET (tmFRET) efficiencies as (B) a function of increasing Ni2+ in ions, (C) for Rb+, and (D) background FRET signal.
- https://cdn.elifesciences.org/articles/87985/elife-87985-fig2-figsupp1-data1-v1.zip
Figure 3 with 1 supplement
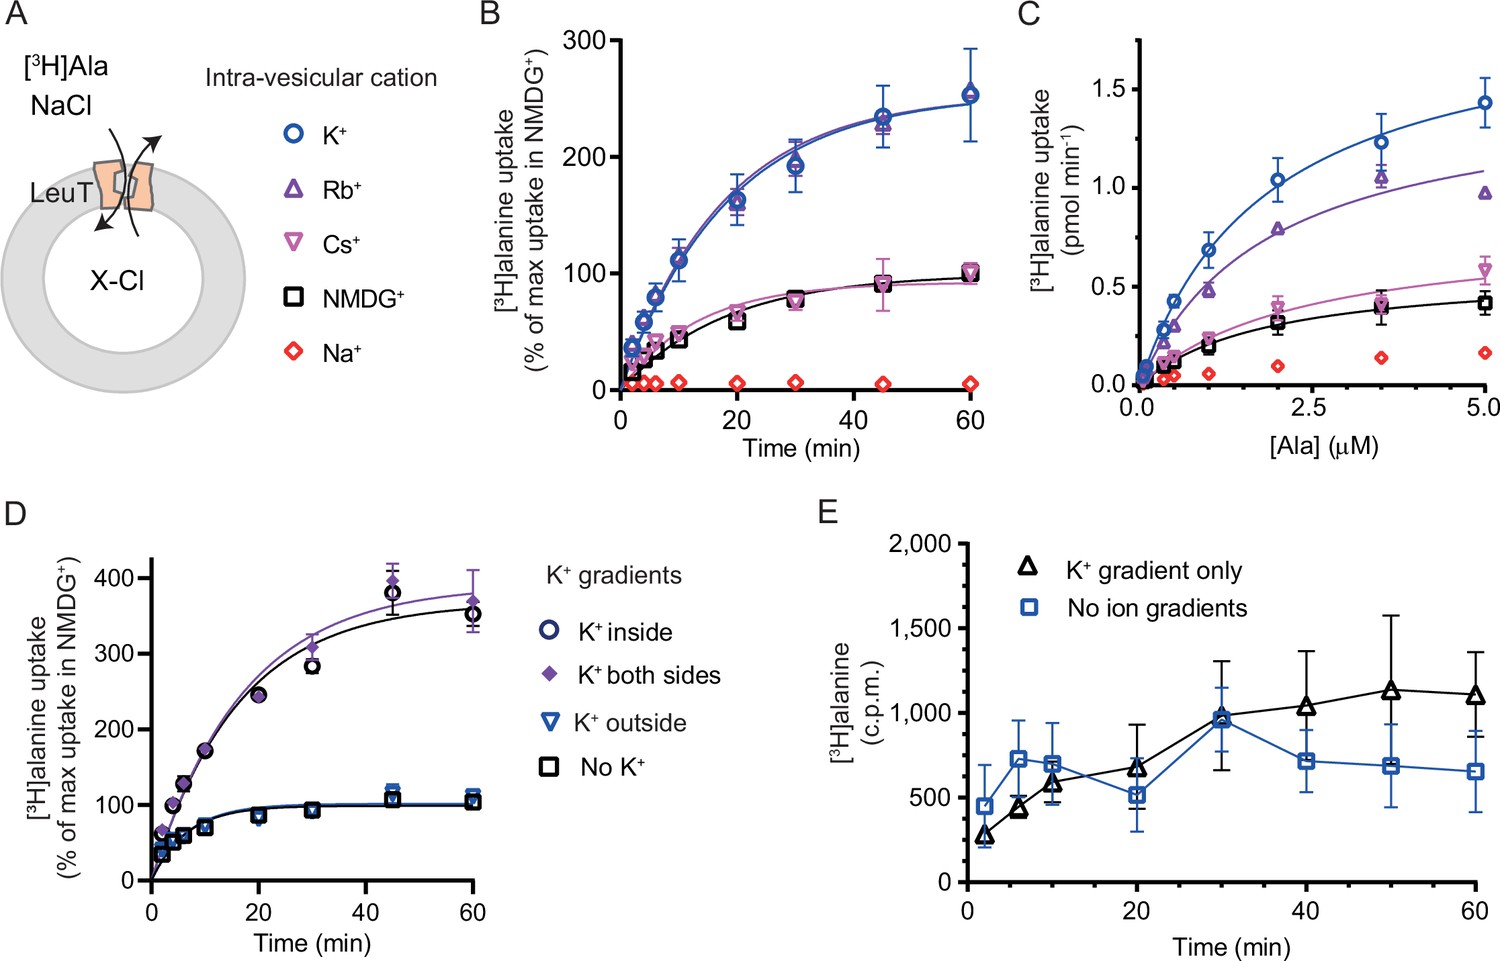
K+ modulates LeuT-mediated [3H]alanine transport.
(A) Schematic of LeuT reconstituted into liposome containing buffer with various cations (X) and Cl- as corresponding anion. (B) Time-dependent [3H]alanine (2 µM) uptake in the presence of 200 mM Na+ into liposomes containing 200 mM of the various cations (colored as in (A)). Data are fitted to a non-linear regression fit. The maximum uptake predicted with N-methyl-D-glucamine (NMDG+) is defined as 100% (Figure 3—source data 1). (C) Concentration-dependent [3H]alanine uptake for 5 min (colored as in (A)). Lines are fit to Michaelis-Menten kinetics (Figure 3—source data 2). None of the Km values were significantly different (Tukey multiple comparison-corrected one-way analysis of variance [ANOVA], p>0.05). The Vmax value in Cs+ was not significantly different from NMDG+ (Tukey multiple comparison-corrected repeated-measures one-way ANOVA, p=0.5780), but K+ and Rb+ were significantly different from NMDG+ (p=0.0011 and 0.0132, respectively). (D) Time-dependent [3H]alanine uptake in the presence of 50 mM Na+ and absence of K+ (black squares) was defined as 100%. Addition of 150 mM K+ (blue triangles) did not significantly change the maximal uptake (unpaired t-test, p=0.92). With 150 mM intra-vesicular K+ (blue circles) the maximum uptake increased to 368±15% (mean ± s.e.m). This increase was not significantly (unpaired t-test, p=0.43) affected further when 150 mM K+ was also added to the extra-vesicular side (purple diamonds). The ionic strength was kept constant by substitution with NMDG+. (E) Time-dependent [3H]alanine uptake into liposomes containing 25 mM Na+ and 200 mM K+ in the presence of either 25 mM Na+ and 200 mM K+ (black line, no ion gradients) or 25 mM Na+ and 200 mM NMDG+ (blue line, outward-directed K+ gradient). The data points from the two conditions are not significantly different (unpaired Mann-Whitney test, p=0.645). All data points are shown as mean ± s.e.m (error bars), n=3 performed in duplicates (B) or triplicates (C–E). All data is provided in the source data file.
-
Figure 3—source data 1
Word file containing data table for rate constants for time-dependent [3H]alanine transport by LeuT into PLs.
- https://cdn.elifesciences.org/articles/87985/elife-87985-fig3-data1-v1.docx
-
Figure 3—source data 2
Word file containing data table for Vmax and Km of [3H]alanine transport by LeuT into PLs.
- https://cdn.elifesciences.org/articles/87985/elife-87985-fig3-data2-v1.docx
-
Figure 3—source data 3
Word file containing data table for Vmax and Km of [3H]alanine transport as an effect by various K+ concentrations.
- https://cdn.elifesciences.org/articles/87985/elife-87985-fig3-data3-v1.docx
-
Figure 3—source data 4
Excel file containing data for [3H]alanine uptake by LeuT reconstituted into PLs.
- https://cdn.elifesciences.org/articles/87985/elife-87985-fig3-data4-v1.xlsx
Figure 3—figure supplement 1
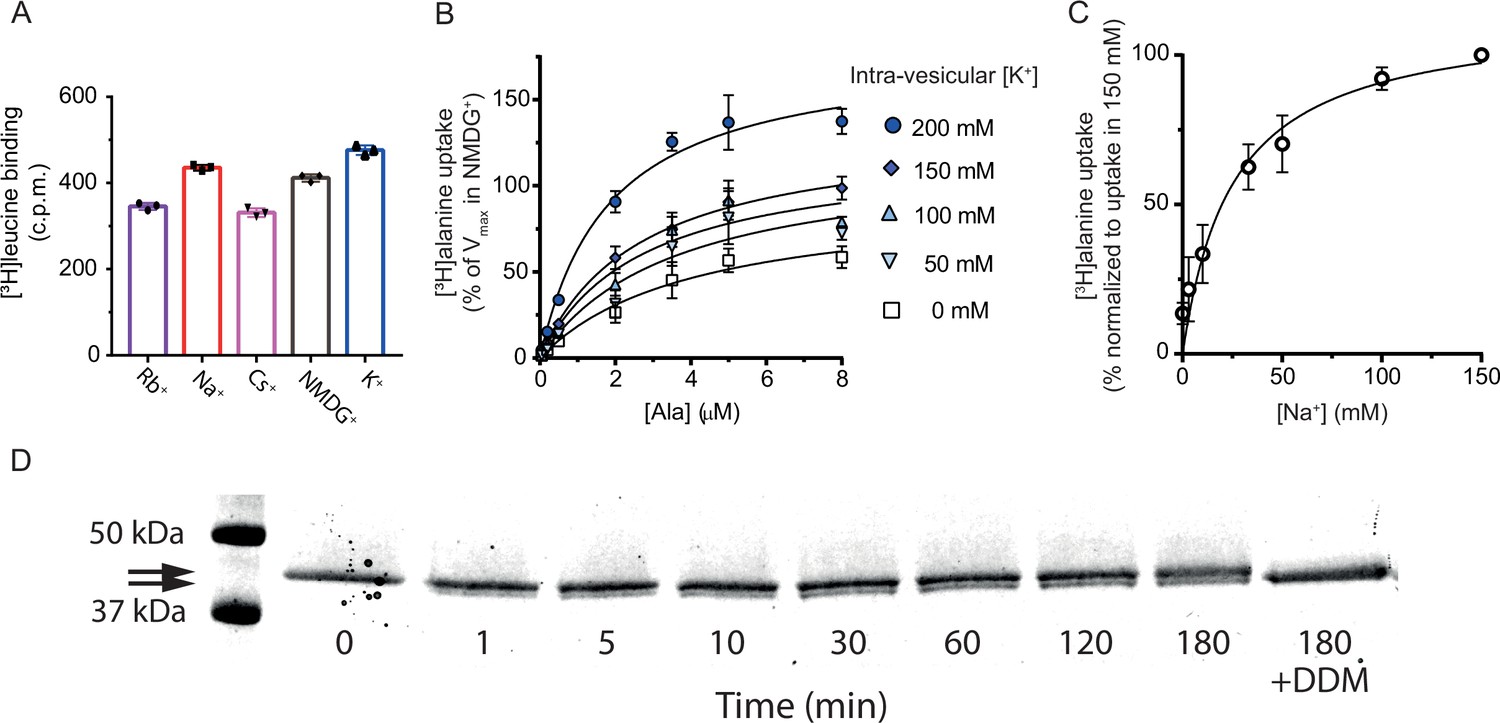
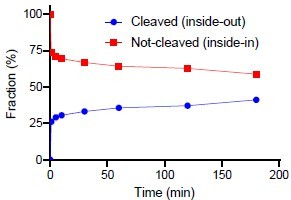
[3H]alanine uptake into proteoliposomes.
(A) Binding of a saturating concentration (20× Kd) of [3H]leucine to LeuT solubilized from the proteoliposomes. The amount of binding in counts per minute (c.p.m.) was taken as a measure of the relative number of active transporters in each reconstitution condition and used to adjust the uptake data in Figure 3B and C for relative reconstitution efficiency. Bar plots show the mean ± s.d. from a representative reconstitution performed in triplicates. (B) Concentration-dependent [3H]alanine uptake for 5 min in the presence of 200 mM Na+ into proteoliposomes containing increasing concentrations of K+. Lines are fits to Michaelis-Menten kinetics. The Vmax in 0 mM K+ was defined as 100% (Figure 3—source data 3). Vmax increased with increasing intra-vesicular K+ (one-way analysis of variance [ANOVA] followed by a test for a linear trend, p=0.0001). None of the estimated Km values were significantly different (Tukey multiple comparison-corrected one-way ANOVA). (C) [3H]alanine uptake for 5 min in the presences of varying Na+ concentration. Data are fitted to Michaelis-Menten kinetics. The Na+ concentration required to reach half-maximum uptake was 25±8 mM (mean ± s.e.m.). Data in (B) and (C) are shown as mean ± s.e.m., n=3 in triplicates. (D) Sodium-dodecyl-sulfate polyacrylamide gel electrophoresis (SDS-PAGE) analysis of LeuT proteoliposomes following time-dependent thrombin digestion of accessible C-terminals (reducing the mass of LeuT by ~1.3 kDa). The reaction was terminated by the addition of PMSF at the specified time points. The lanes corresponding to the time-dependent proteolysis are flanked by lanes containing proteoliposomes without thrombin (left, 0 min) or digested in the presence of n-dodecyl-β-D-maltoside (DDM) (right, 180 min+DDM). Arrows indicate bands of full-length (top) and cleaved (bottom) LeuT. All data is provided in the source data file.
-
Figure 3—figure supplement 1—source data 1
Excel file containing data for [3H]alanine uptake into PLs with varying K+ or Na+ concentrations.
- https://cdn.elifesciences.org/articles/87985/elife-87985-fig3-figsupp1-data1-v1.zip
-
Figure 3—figure supplement 1—source data 2
Files of original uncropped sodium-dodecyl-sulfate polyacrylamide gel electrophoresis (SDS-PAGE) gel shown in Figure 3—figure supplement 1D.
- https://cdn.elifesciences.org/articles/87985/elife-87985-fig3-figsupp1-data2-v1.zip
Figure 4
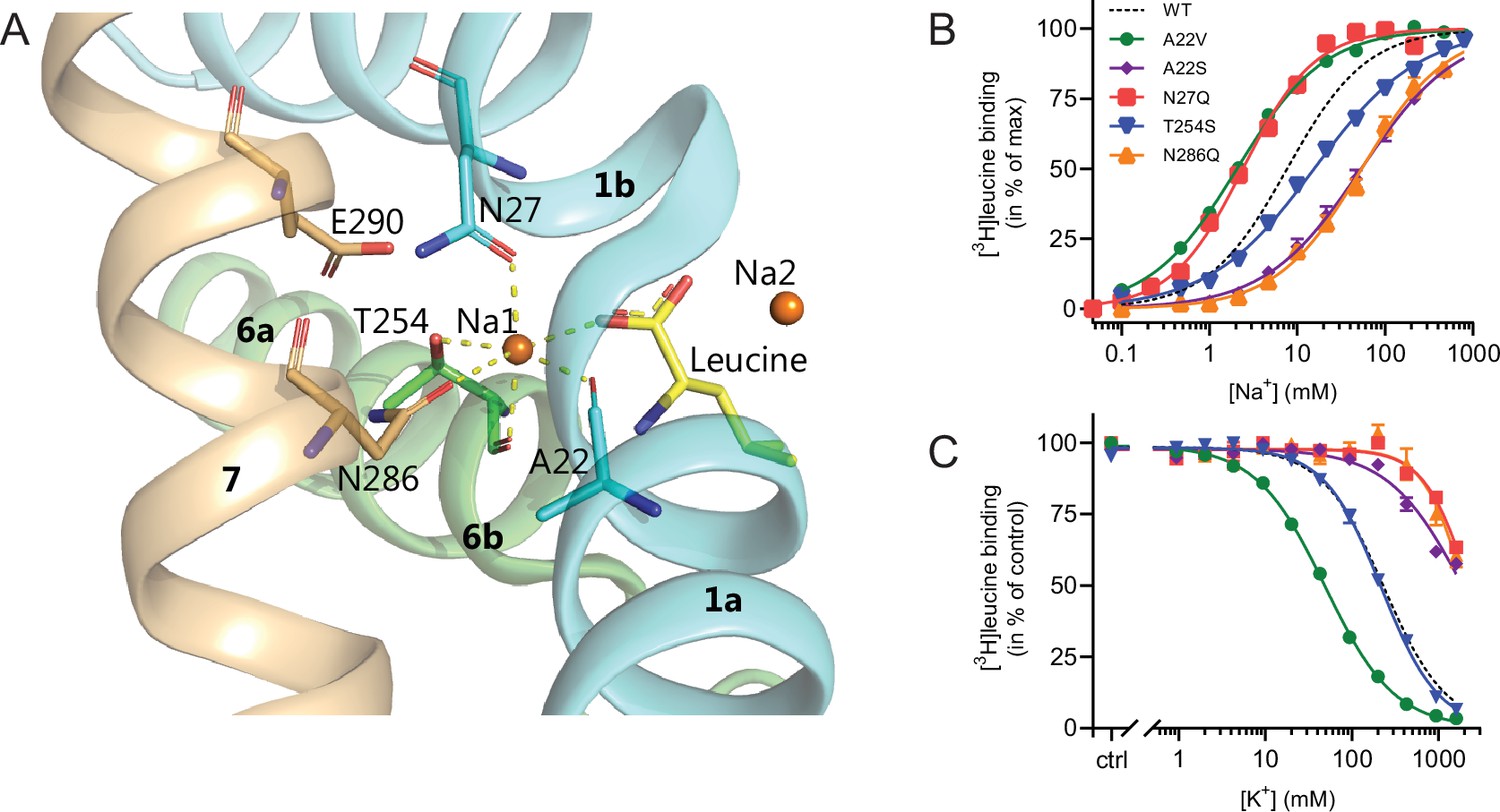
Na1 site mutants of LeuT display altered ion selectivity.
(A) Cartoon representation of the Na1 site from the outward-occluded LeuT structure (PDB ID: 2A65) with the endogenous Na1 site coordinating residues along with the substrate leucine (yellow) and Glu290 labeled and shown as sticks. The coordination of Na+ is depicted with dashed lines. Structural elements not involved in Na1 site are omitted for clarity. (B) Na+-mediated [3H]leucine (10× Kd) binding for Na1 site mutations, A22V (green circles), A22S (purple rhombi), N27Q (red squares), T254S (blue triangles), and N286Q (orange triangles), with WT shown for reference (black dashed line). Data are normalized to Bmax and fitted to a Hill equation. (C) K+-dependent displacement of Na+-mediated [3H]leucine binding for the Na1 site mutants (colored as in (B)). Na+ concentrations equivalent to the EC50 values (determined in (B)) and 10× Kd of [3H]leucine for each mutant were used. Data points are normalized to a control without K+ and modeled by the Hill equation. All data points are mean ± s.e.m., n=3–6. The ionic strength was maintained upon substitution with Ch+. EC50 and IC50 values for (B) and (C) are summarized in Table 2. All data is provided in the source data file.
-
Figure 4—source data 1
Excel file containing data for Na+-mediated [3H]leucine binding for Na1 site mutations and how that is inhibited by K+.
- https://cdn.elifesciences.org/articles/87985/elife-87985-fig4-data1-v1.zip
Figure 5
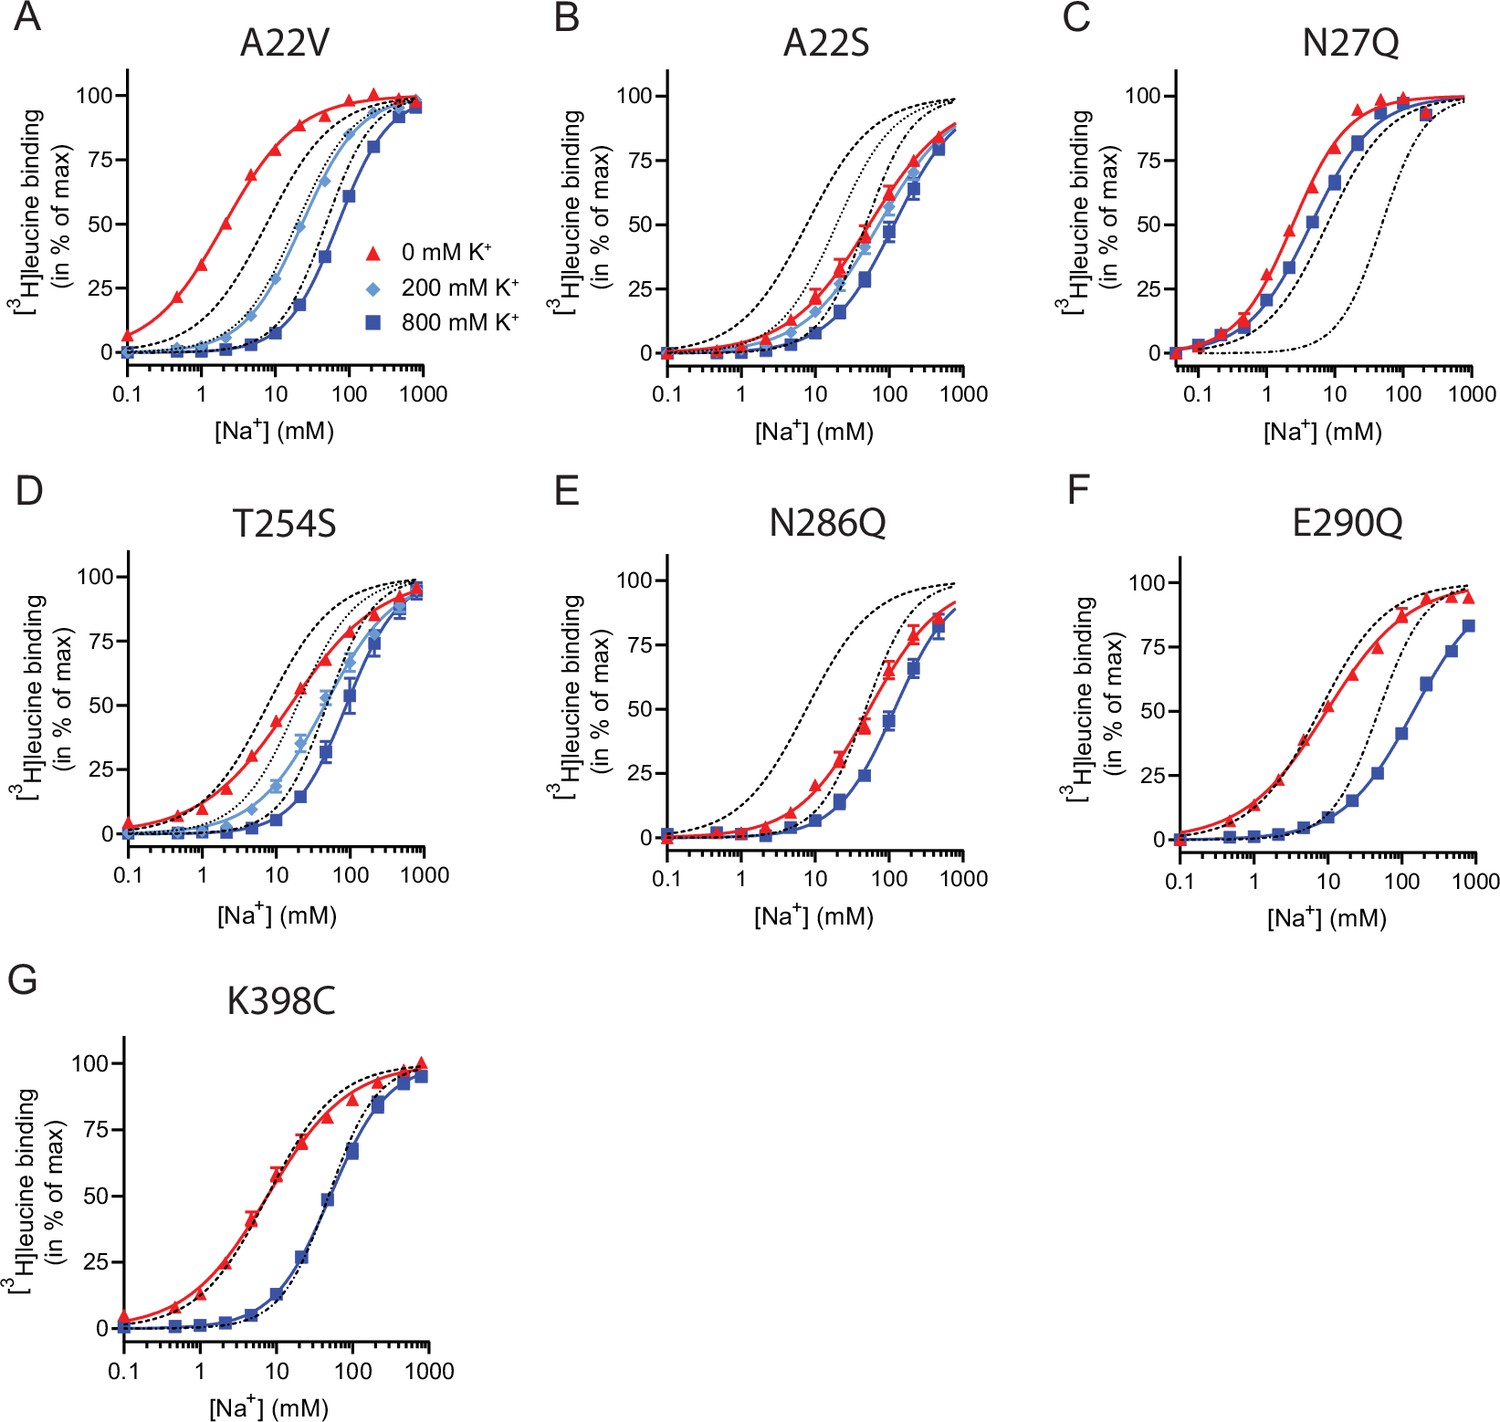
Na+-mediated [3H]leucine binding and inhibition by K+ by the LeuT mutants.
(A–F) Na+-mediated [3H]leucine (10× Kd) binding for the Na1 site mutants performed in the absence (red triangles) and presence of 200 mM (light blue diamond) and 800 (blue squares) mM K+. (A) A22V, (B) A22S, (C) N27Q, (D) T254S, (E) N286Q, (F) E290Q, and (G) K398C. LeuT K398C was included as negative control. WT is shown for reference for 0 mM (dashed line), 200 mM (dotted line), and 800 mM (dash-dotted line) of K+. Ionic strengths were maintained using Ch+. All data points are shown as mean ± s.e.m. normalized to Bmax and fitted to a Hill model. EC50 values are summarized in Table 2, n=3–4. All data is provided in the source data file.
-
Figure 5—source data 1
Excel file containing data for Na+-mediated [3H]leucine binding for the Na1 site mutants and in the presence of K+.
- https://cdn.elifesciences.org/articles/87985/elife-87985-fig5-data1-v1.zip
Figure 6 with 1 supplement
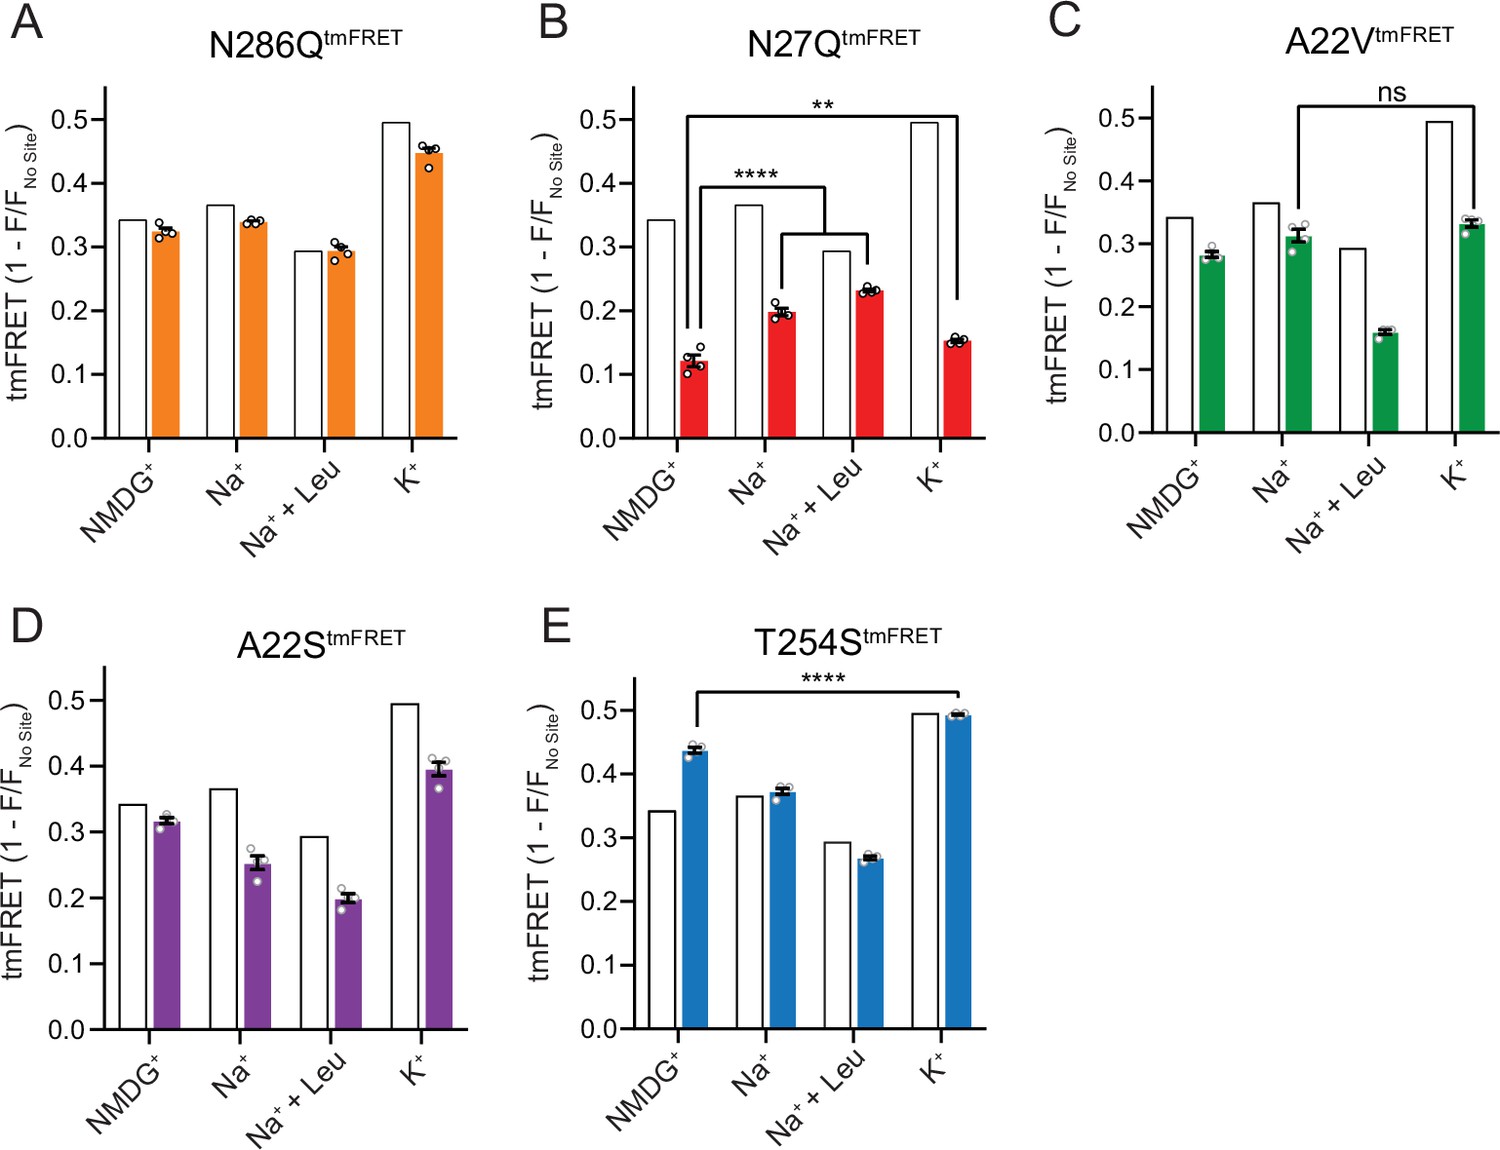
The Na1 site LeuT mutants exhibit different conformational equilibria.
(A–E) Transition metal ion FRET (tmFRET) efficiencies (1 – F/Fno site) for N286QtmFRET (orange, A), N27QtmFRET (red, B), A22VtmFRET (green, C), A22StmFRET (purple, D), and T254StmFRET (blue, E) incubated in 800 mM of the indicated ions and 50 µM for leucine. The His-X3-His site was saturated with 10 mM Ni2+. The corresponding tmFRET efficiencies for LeuTtmFRET (white bars) are shown for reference. All data points are mean ± s.e.m., n=4, performed in triplicates. In (B), **p<0.001; ****p<0.0001 represent the significance levels from a Tukey multiple comparison-corrected one-way analysis of variance (ANOVA), comparing the mean obtained in K+ with that in N-methyl-D-glucamine (NMDG+), and the mean in Na+ and Na+±leucine with that in NMDG+. In (C) and (E), ns, not significant and ****p<0.0001 using a one-way ANOVA with Bonferroni multiple comparison correction. All data is provided in the source data file.
-
Figure 6—source data 1
Excel file containing data for transition metal ion FRET (tmFRET) efficiencies for all mutants in N-methyl-D-glucamine (NMDG+), Na+, leucine, or K+.
- https://cdn.elifesciences.org/articles/87985/elife-87985-fig6-data1-v1.zip
Figure 6—figure supplement 1
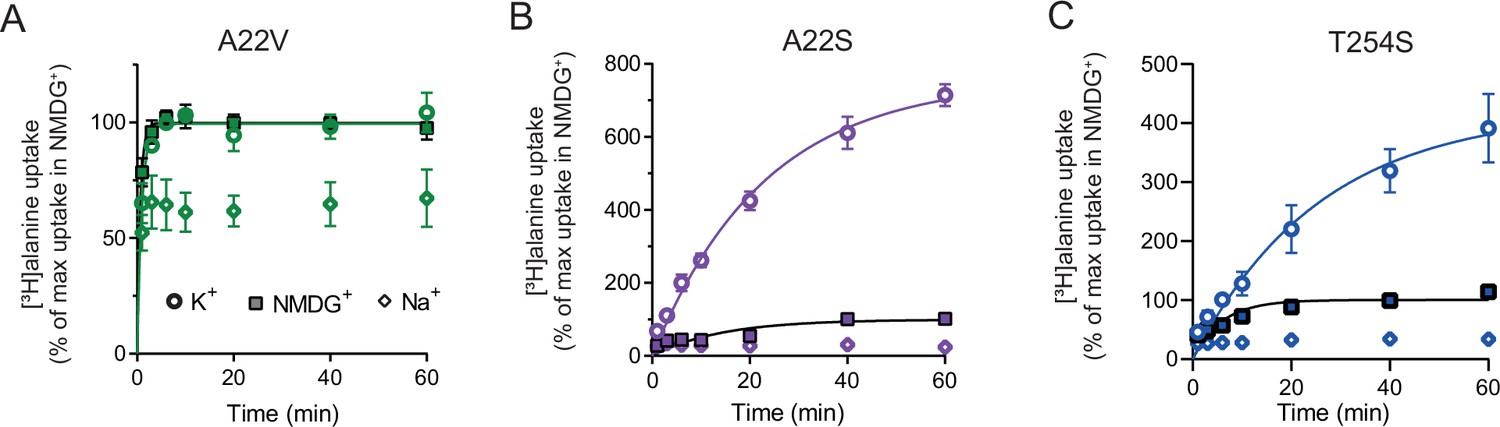
[3H]alanine uptake by selected Na1 mutants.
(A) [3H]alanine activity over time by LeuT A22V in the presence of 200 mM Na+. LeuT A22V is reconstituted into proteoliposomes with either 200 mM Na+ (open diamond), N-methyl-D-glucamine (NMDG+) (square), or K+ (open circle). Maximal transport obtained in NMDG+ was defined as 100%. Maximal [3H]alanine transport in K+ was 99 ± 2%. The rate constant (k) was 1.55±0.20 and 1.01±0.15 min–1 in NMDG+ and K+, respectively, which correspond to a half-time to reach the concentrative capacity of 0.45 and 0.67 min. (B) [3H]alanine uptake by LeuT A22S. The [3H]alanine transport with K+ increased to 756 ± 37%. The rate constant (k) was 0.071±0.02 and 0.044±0.005 min–1 in NMDG+ and K+, respectively, corresponding to an half-time to reach the concentrative capacity of 9.8 and 15.8 min. (C) [3H]alanine uptake by LeuT T254S. Maximal uptake in K+ was 422 ± 51%. The rate constant was 0.17±0.04 and 0.04±0.01 min–1 in NMDG+ and K+, respectively, corresponding to a half-time of 4.1 and 17.3 min. All data are shown as mean ± s.e.m. n=3, performed in triplicates. All data is provided in the source data file.
-
Figure 6—figure supplement 1—source data 1
Excel file containing data for [3H]alanine transport activity over time by selected Na1 mutants.
- https://cdn.elifesciences.org/articles/87985/elife-87985-fig6-figsupp1-data1-v1.zip
Figure 7
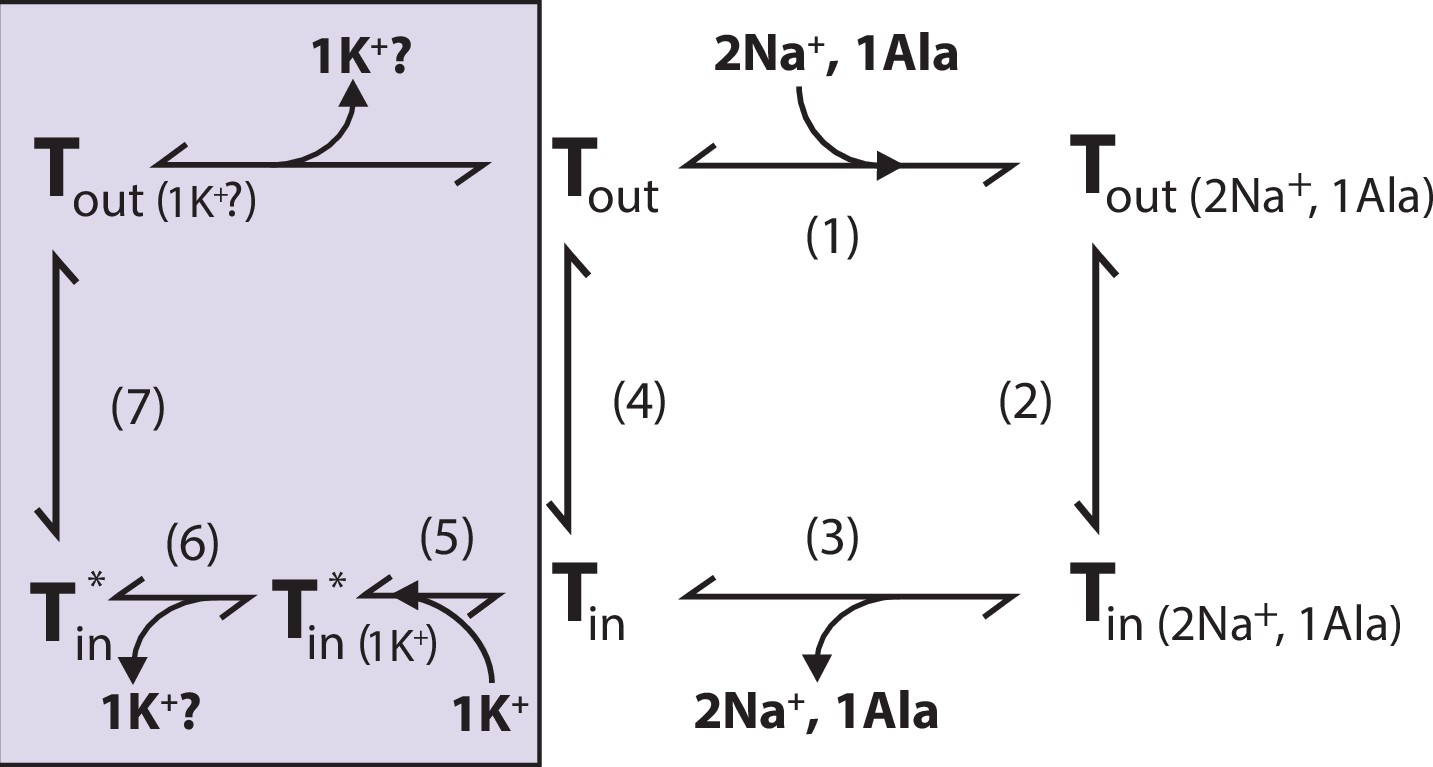
Proposed role of K+ in the translocation cycle.
Here, exemplified for alanine (Ala) as substrate. LeuT apo-form will likely reside in an equilibrium between its outward- (Tout) and inward-facing (Tin) conformation. After Na+ and Ala are bound (1) and released (3), LeuT can either (i) rebind Na+ and Ala, which will promote efflux (2); (ii) transition to the outward-open conformation in its apo-form (4), or (iii) bind K+ (5). K+ binding will promote an inward-facing LeuT state (T*) which is unable to bind Na+, either by competitive inhibition or by promoting a state that does not allow Na+ binding. From here, K+ could either be released again to the intracellular environment (6) or be counter-transported (7).
Author response image 1
Tables
Table 1
LeuT mutant affinities for leucine and alanine.
| Leucine affinityKd (nM) | n | Alanine affinityKi (µM) | n | |
|---|---|---|---|---|
| WT | 6.9 [6.7; 7.2]A | 4 | 1.61 [1.58; 1.65] | 4 |
| A22V | 5.4 [4.9; 5.9]A | 3 | 1.02 [0.97; 1.08] | 4 |
| A22S | 8.4 [7.7; 9.1]A | 3 | 2.11 [2.05; 2.17] | 4 |
| N27Q | 1590 [1530; 1650] | 3 | 255 [248; 263] | 3 |
| T254S | 5.6 [5.4; 5.8]A | 3 | 1.17 [1.12; 1.21] | 3 |
| N286Q | 1460 [1390; 1540] | 3 | 287 [277; 297] | 3 |
| E290Q | 193 [169; 221] | 4 | 30.0 [28.9; 31.2] | 3 |
-
Table 1—source data 1
Pdf file with affinity curves for leucine and alanine binding to LeuT and mutants.
- https://cdn.elifesciences.org/articles/87985/elife-87985-table1-data1-v1.docx
-
Table 1—source data 2
Excel file containing data for leucine and alanine affinities for LeuT WT and all investigated mutants.
- https://cdn.elifesciences.org/articles/87985/elife-87985-table1-data2-v1.xlsx
Table 2
Na+-mediated [3H]leucine binding and the effect of K+ addition, and K+-dependent Na+/[3H]leucine displacement in Na1 site mutants.
For LeuT Na1 site mutants (and K398C), Na+-mediated [3H]leucine binding was assayed using 10× Kd of [3H]leucine in the presence of 0, 200, and 800 mM K+. For K+-dependent displacement of Na+-mediated [3H]leucine binding, 10× Kd of [3H]leucine and Na+ equivalent to the EC50 value for each of the mutants were used. Na+ and K+ were substituted for Ch+ to preserve the ionic strength. Data were fitted to a Hill equation, yielding EC50 and IC50 values reported here as mean [s.e.m. interval], n=3–6 determined in triplicates. Comparing the Na+ EC50 obtained for the mutants with that of WT showed significant difference for all (p<0.0001) except for E290Q (p>0.05), and for the K+ IC50 all showed significant differences from WT (p<0.0001) expect for T254S (p>0.05) (Dunnett’s multiple comparison-corrected one-way analysis of variance [ANOVA]). N.d. indicates that the value is not determined. WT data are also reported in Figure 1.
| EC50 Na+ (mM) | IC50 K+ (mM) | EC50 Na++200 mM K+ (mM) | EC50 Na++800 mM K+ (mM) | EC50800/EC50 | |
|---|---|---|---|---|---|
| WT | 7.7 [7.3; 8.1] | 235 [228; 241] | 19.4 [19.1; 19.8] | 48.5 [47.5; 49.5] | ~6 |
| A22V | 2.0 [2.0; 2.1] | 49.0 [47.7; 50.4] | 23.0 [21.7; 24.5] | 70.7 [69.2; 72.2] | ~35 |
| A22S | 53.3 [45.5; 62.5] | >1900 | 72.4 [62.3; 84.2] | 117 [100; 137] | ~2 |
| N27Q | 2.4 [2.3; 2.5] | >2,300 | n.d. | 4.4 [4.0; 4.8] | ~2 |
| T254S | 15.1 [14.2; 16.0] | 219 [209; 229] | 43.5 [37.4; 50.5] | 90.2 [73.8; 110] | ~6 |
| N286Q | 54.6 [47.5; 62.6] | >2000 | n.d. | 121 [111; 133] | ~2 |
| E290Q | 9.6 [8.8; 10.4] | n.d. | n.d. | 144 [132; 157] | ~15 |
| K398C | 7.7 [6.8; 8.8] | n.d | n.d. | 51.5 [48.1; 55.1] | ~7 |
Key resources table
| Reagent type (species) or resource | Designation | Source or reference | Identifiers | Additional information |
|---|---|---|---|---|
| Gene (Aquifex aeolicus) | LeuT gene | https://doi.org/10.1038/ncomms12755 | ||
| Strain, strain background (Escherichia coli) | BL21(DE3) | Sigma-Aldrich | CMC0016 | Electrocompetent cells |
| Strain, strain protein expression (Escherichia coli) | C41(DE3) | Sigma-Aldrich | CMC0017 | Cells for protein expression |
| Recombinant DNA reagent | LeuT; LeuT WT (plasmid) | https://doi.org/10.1038/ncomms12755 | pET16b backbone | |
| Recombinant DNA reagent | LeuTtmFRET; LeuT A313H-A317H-K398C (plasmid) | https://doi.org/10.1038/ncomms12755 | pET16b backbone | |
| Recombinant DNA reagent | LeuTK398C; LeuT K398C (plasmid) | https://doi.org/10.1038/ncomms12755 | pET16b backbone | |
| Sequence-based reagent | Primers for generation of LeuT mutants | This paper | See list of primers in Appendix. Primers were synthesized by Eurofins Genomics | |
| Chemical compound, drug | fluorescein-5-maleimide; F5M | Thermo Fischer Scientific | F150 | |
| Chemical compound, drug | [3H]leucine | PerkinElmer | NET1166001 | |
| Chemical compound, drug | E. coli polar lipid extract | Avanti Polar Lipids | 100600 C | |
| Chemical compound, drug | [3H]alanine | Moravek Biochemicals | Made on request | |
| Chemical compound, drug | Gel stain InstantBlue | abcam | Ab119211 | |
| Software, algorithm | GraphPad Prism 9.0 | GraphPad Software, Boston, Massachusetts USA | ||
| Other | Yttrium Silicate Copper (YSi-Cu) His-tag SPA beads; YSi-Cu His-tag SPA beads | PerkinElmer | RPNQ0096 | SPA beads used for scintillation proximity assays - See: Pharmacological characterization of LeuT mutants. In Materials & Methods Section |
| Other | thrombin | Cytiva | 27084601 | Protease used to cleave the His-tag from LeuT |
| Other | Filtermat B – GF/B | PerkinElmer | 1450–521 | Filters used to trap proteoliposomes for scintillation counting of [3 H]ligand |
| Other | MeltiLex B/HS | PerkinElmer | 1450–442 | Scintillation plates to add on Filtermats for [3 H] counting |
| Other | Nuclepore Track-Etch Membrane polycarbonate filter of pore size 400 nm | Sigma-Aldrich | WHA10417104 | For extrusion of PLs. |
| Other | SM-2 Bio-Beads | Bio-Rad Laboratories | 1523920 | For detergent extraction from the specimen to promote reconstitution of LeuT into PLs |
Additional files
Download links
A two-part list of links to download the article, or parts of the article, in various formats.
Downloads (link to download the article as PDF)
Open citations (links to open the citations from this article in various online reference manager services)
Cite this article (links to download the citations from this article in formats compatible with various reference manager tools)
Exploring the K+ binding site and its coupling to transport in the neurotransmitter:sodium symporter LeuT
eLife 12:RP87985.
https://doi.org/10.7554/eLife.87985.3


