ARID1A governs the silencing of sex-linked transcription during male meiosis in the mouse
- Department of Genetics, and Lineberger Comprehensive Cancer Center, The University of North Carolina at Chapel Hill, United States
Figures
Figure 1 with 1 supplement
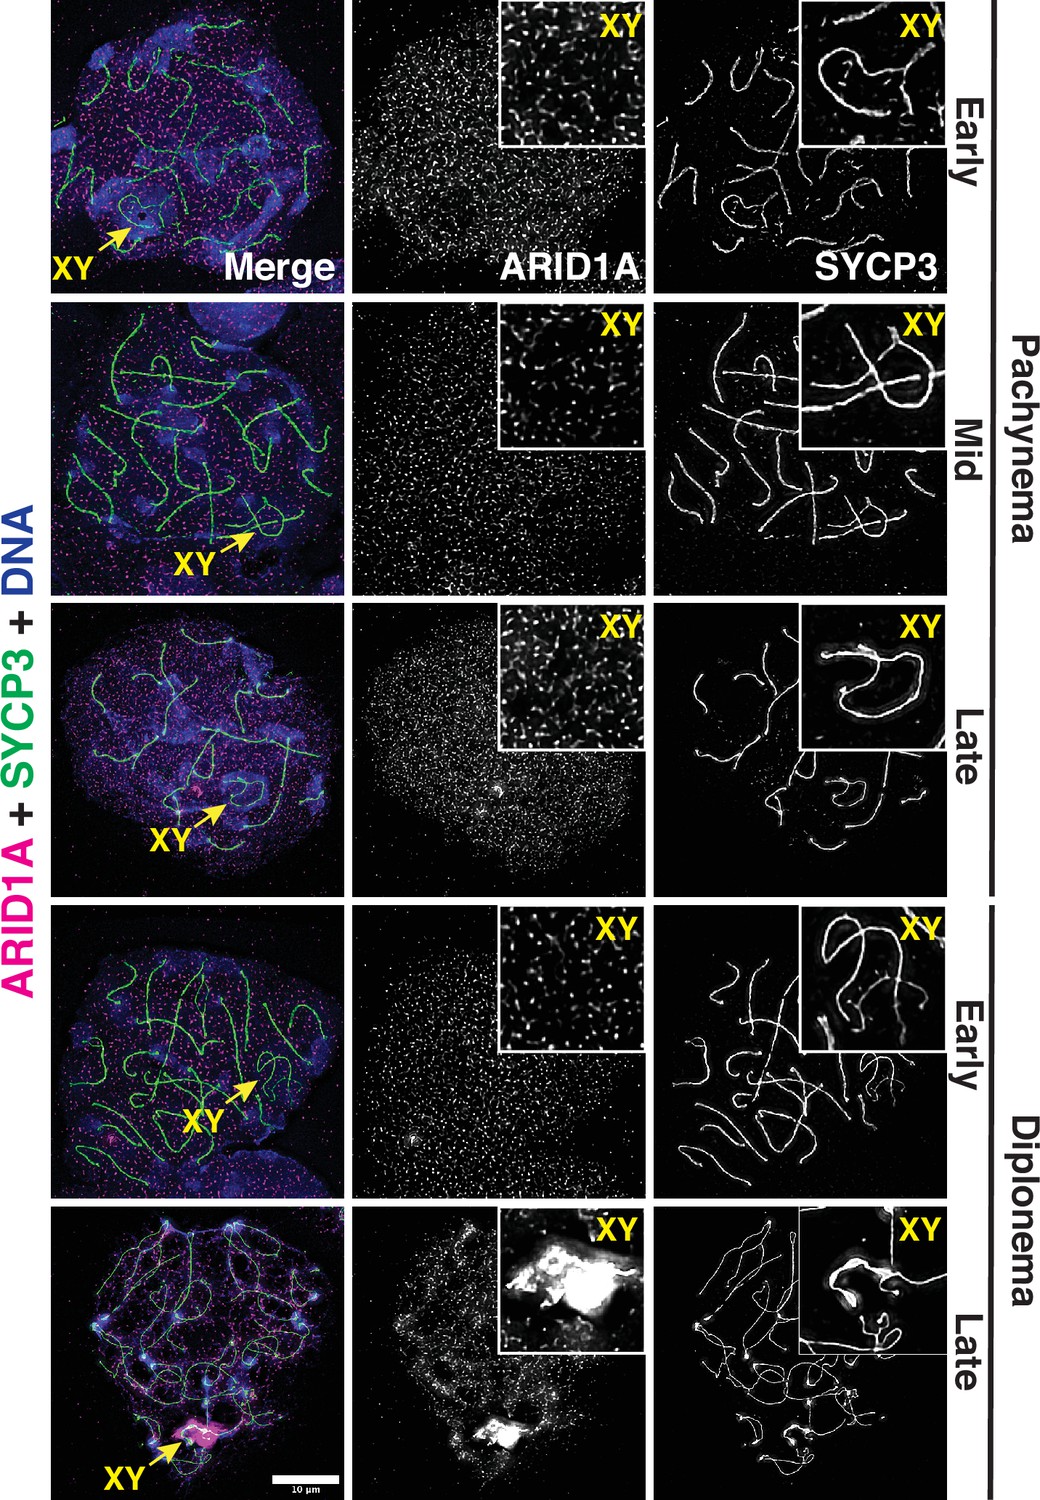
ARID1A associates with the sex body late in meiotic prophase-I.
Representative wild-type pachytene and diplotene spermatocyte spreads immunolabelled for ARID1A (magenta) and SYCP3 (green) and then counterstained for DNA (blue). Panel insets denote a magnified view of the nuclear area surrounding the sex chromosomes. Scale bar:10 μm, magnification: ×100.
Figure 1—figure supplement 1
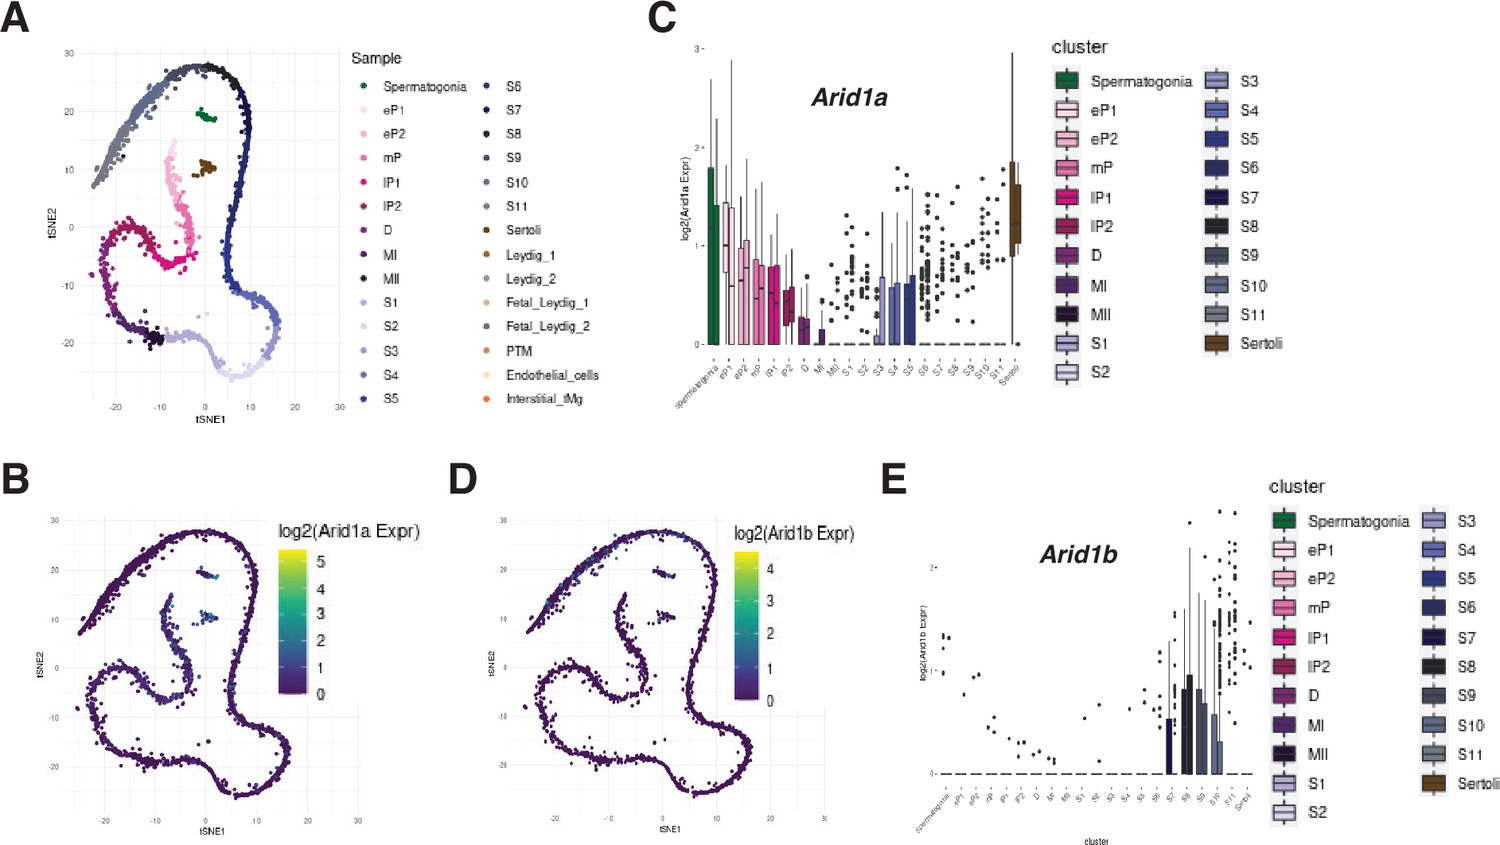
ARID1A transcripts detected in pachytene spermatocytes.
scRNA-seq profiles of Arid1a and Arid1b in adult testes from B6 mice (Ernst et al., 2019). (A) tSNE plot describing the clustering of various spermatogenic stages. LOG2 normalized expression counts of (B,C) Arid1a and (D,E) Arid1b represented by tSNE plots and bar plots. (B,D) tSNE plots illustrating the first (tSNE1, x-axis) and second dimensions (tSNE2, y-axis). (C,E) Bar plots describe the gene’s mRNA abundance (y-axis) across identified germ cell clusters (x-axis). (A) eP: early pachynema, mP: mid pachynema, lP: late pachynema, MI: Metaphase-I, MII: Metaphase-II, S1-S11: Spermatid stages. Plots generated with shiny app. (https://marionilab.cruk.cam.ac.uk/SpermatoShiny).
Figure 2 with 6 supplements
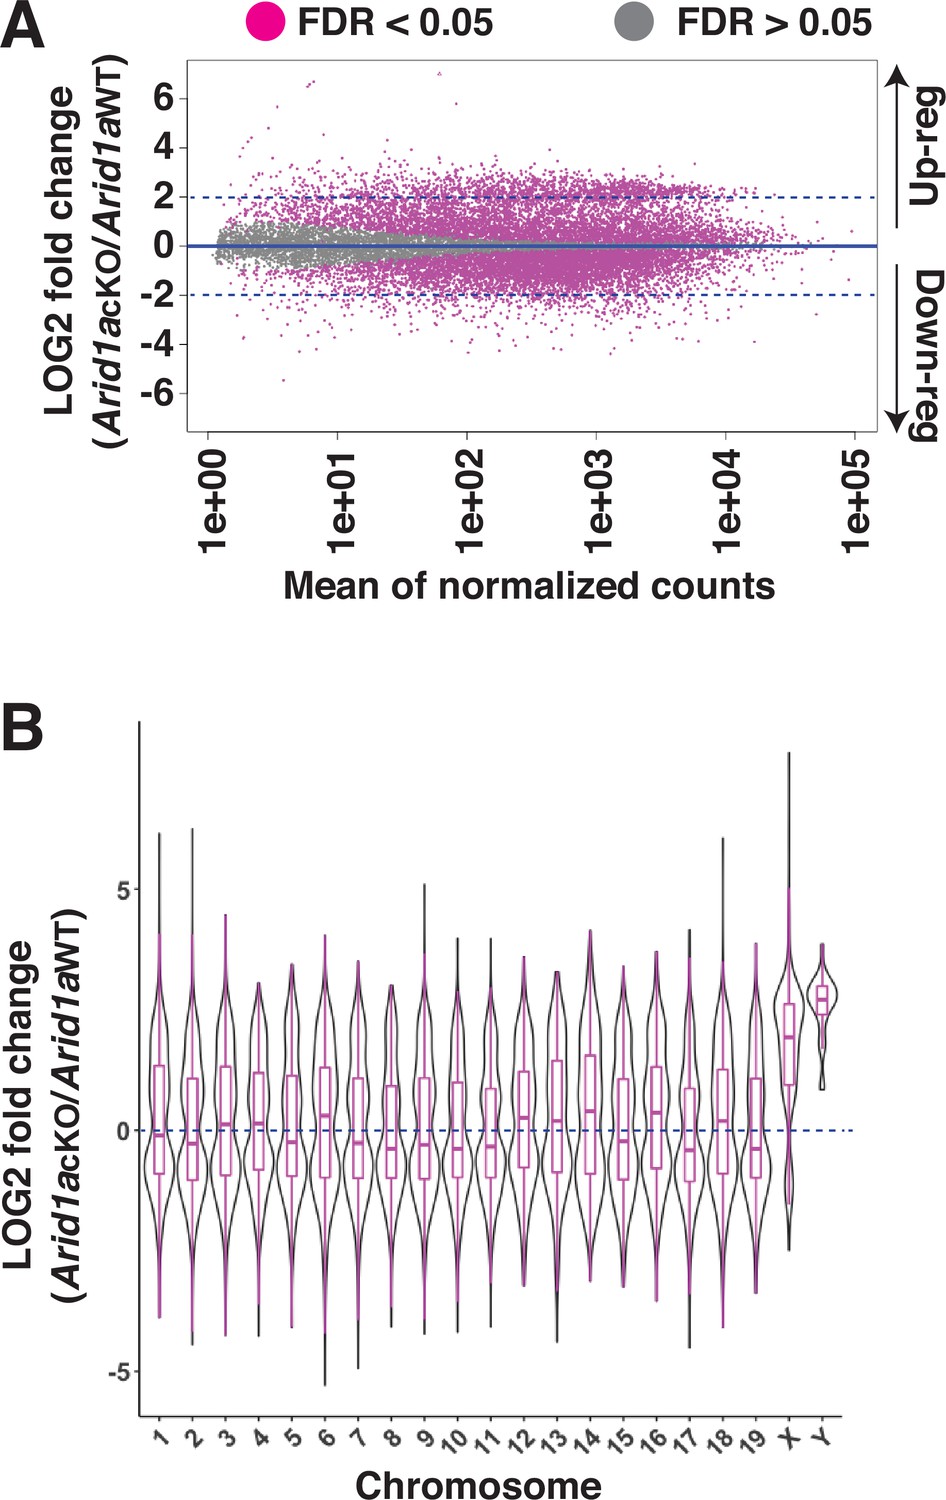
Requirement of ARID1A for the repression of sex-linked genes.
(A) MA plot describing the LOG2-fold-change (LFC, y-axis) in mean expression (x-axis) of genes displaying significant (FDR ≤0.05, magenta dots) changes in Arid1a cKO relative to Arid1a WT pachytene spermatocytes. Dashed blue lines denote 2 LFC. Gray dots (FDR ≥0.05) depict non-significant changes in gene expression. (B) Violin plot describing the LOG2-fold-change (LFC, y-axis) in the median chromosome-wide gene expression (x-axis) in Arid1a cKO relative to Arid1a WT pachytene spermatocytes. The dashed blue line denotes no change in gene expression.
-
Figure 2—source data 1
Wild-type and mutant PLZF positive spermatogonia.
There is no significant difference in the numbers of undifferentiated spermatogonia expressing PLZF in 1-month-old Arid1a cKO relative to Arid1afl/fl males.
- https://cdn.elifesciences.org/articles/88024/elife-88024-fig2-data1-v1.docx
-
Figure 2—source data 2
ARID1A DESeq2 differentially expressed genes.
Differential analysis of gene expression using DeSeq2 (Love et al., 2014) revealed an equal proportion of significantly (FDR <0.05) misexpressed genes displaying either elevated (up-regulated, n=5824) or reduced (down-regulated, n=5821) transcript abundance in Arid1a cKO relative to Arid1a WT pachytene spermatocytes.
- https://cdn.elifesciences.org/articles/88024/elife-88024-fig2-data2-v1.xlsx
Figure 2—figure supplement 1
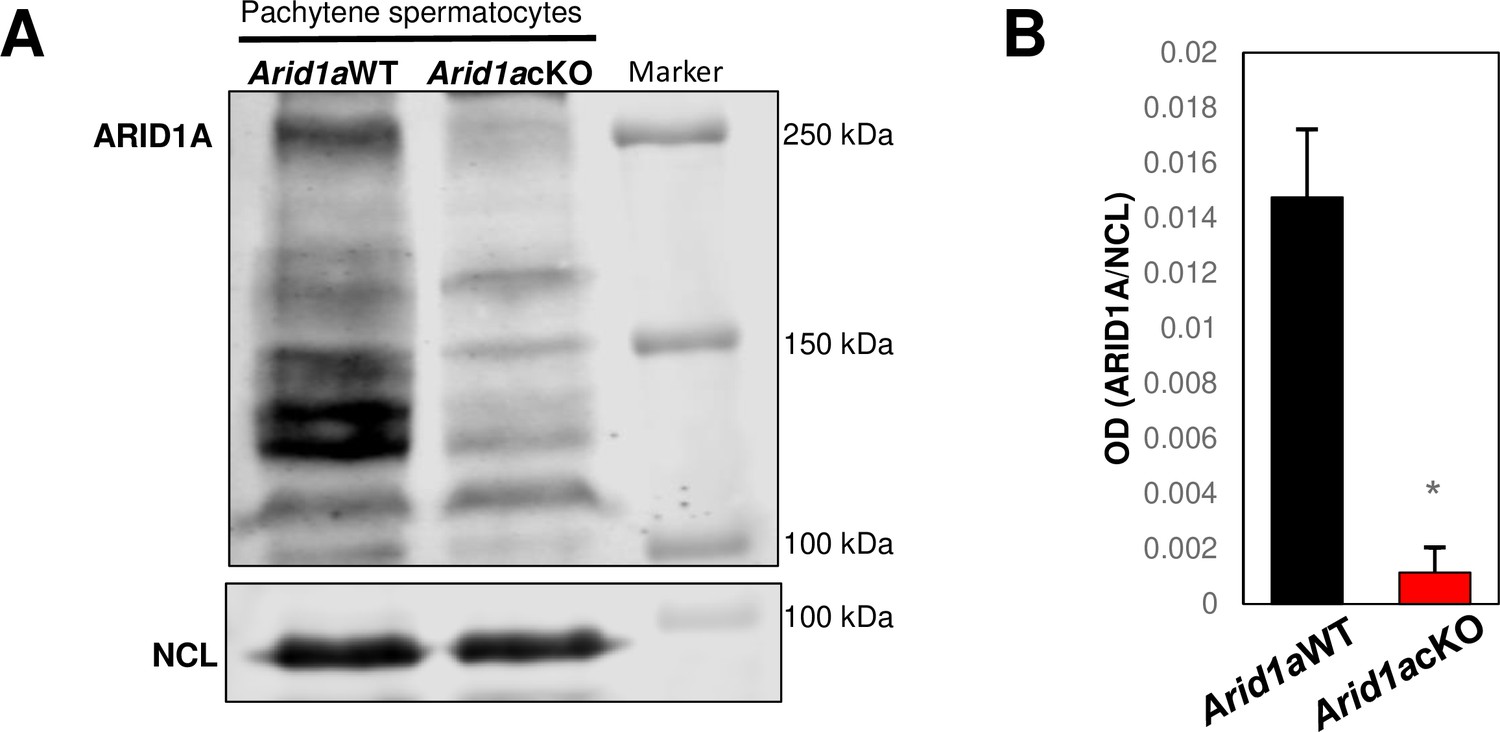
Western blot for ARID1A in wild-type and mutant pachytene spermatocytes (left) and with quantitation (right).
The Uniprot entry for Mouse ARID1A only indicates a large mol.wt sequence of ~242 kDa. There is no evidence to suggest that lower molecular weight isoforms may be translated. Although speculative, it is possible that the lower molecular weight bands represent proteolytic/proteasomal degradation products or products of antibody non-specificity. Nucleolin (NCL) is the loading control. Bars in B represent mean ± S.E.M. *; p<0.01 (n=3) (Unpaired Student’s t-test). The antibody used for the Western blot is a rabbit anti-ARID1A (D2A8U from Cell Signaling Technology 12354).
-
Figure 2—figure supplement 1—source data 1
Raw western blot images for ARID1A and nucleolin.
- https://cdn.elifesciences.org/articles/88024/elife-88024-fig2-figsupp1-data1-v1.tif
-
Figure 2—figure supplement 1—source data 2
Complete and marked western blot images for ARID1A and nucleolin.
- https://cdn.elifesciences.org/articles/88024/elife-88024-fig2-figsupp1-data2-v1.zip
Figure 2—figure supplement 2
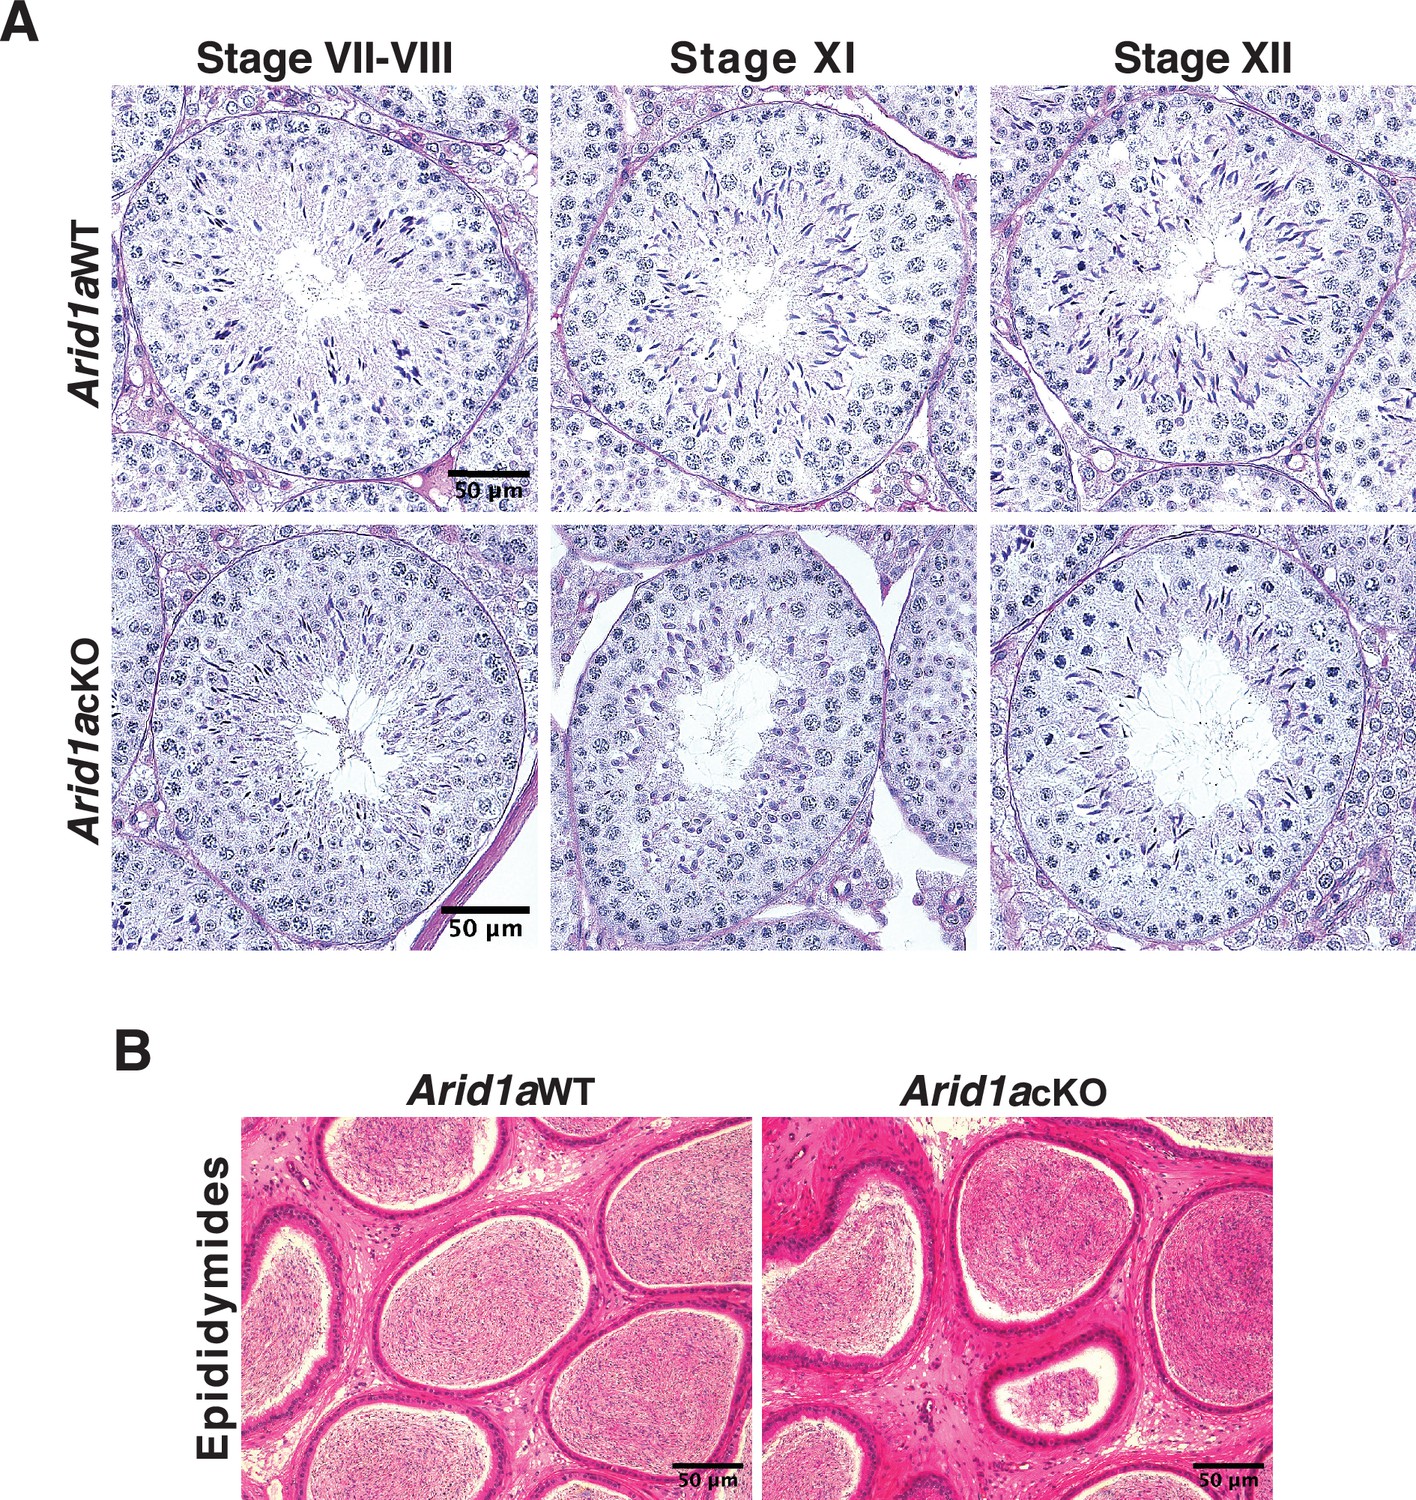
Spermatogenesis appears unperturbed in Arid1a cKO males.
Histological examination of (A) PAS-stained seminiferous tubule sections and (B) H&E-stained cauda epididymal sections obtained from adult Arid1a WT and Arid1a cKO mice. The micrograph depicts seminiferous tubule staging and scale bars (50 μm). Magnification: ×40.
-
Figure 2—figure supplement 2—source data 1
ARID1A tubule staging: Staining and morphology determined seminiferous tubule staging (Ahmed and Rooij, 2009; Meistrich and Hess, 2013).
- https://cdn.elifesciences.org/articles/88024/elife-88024-fig2-figsupp2-data1-v1.xlsx
Figure 2—figure supplement 3
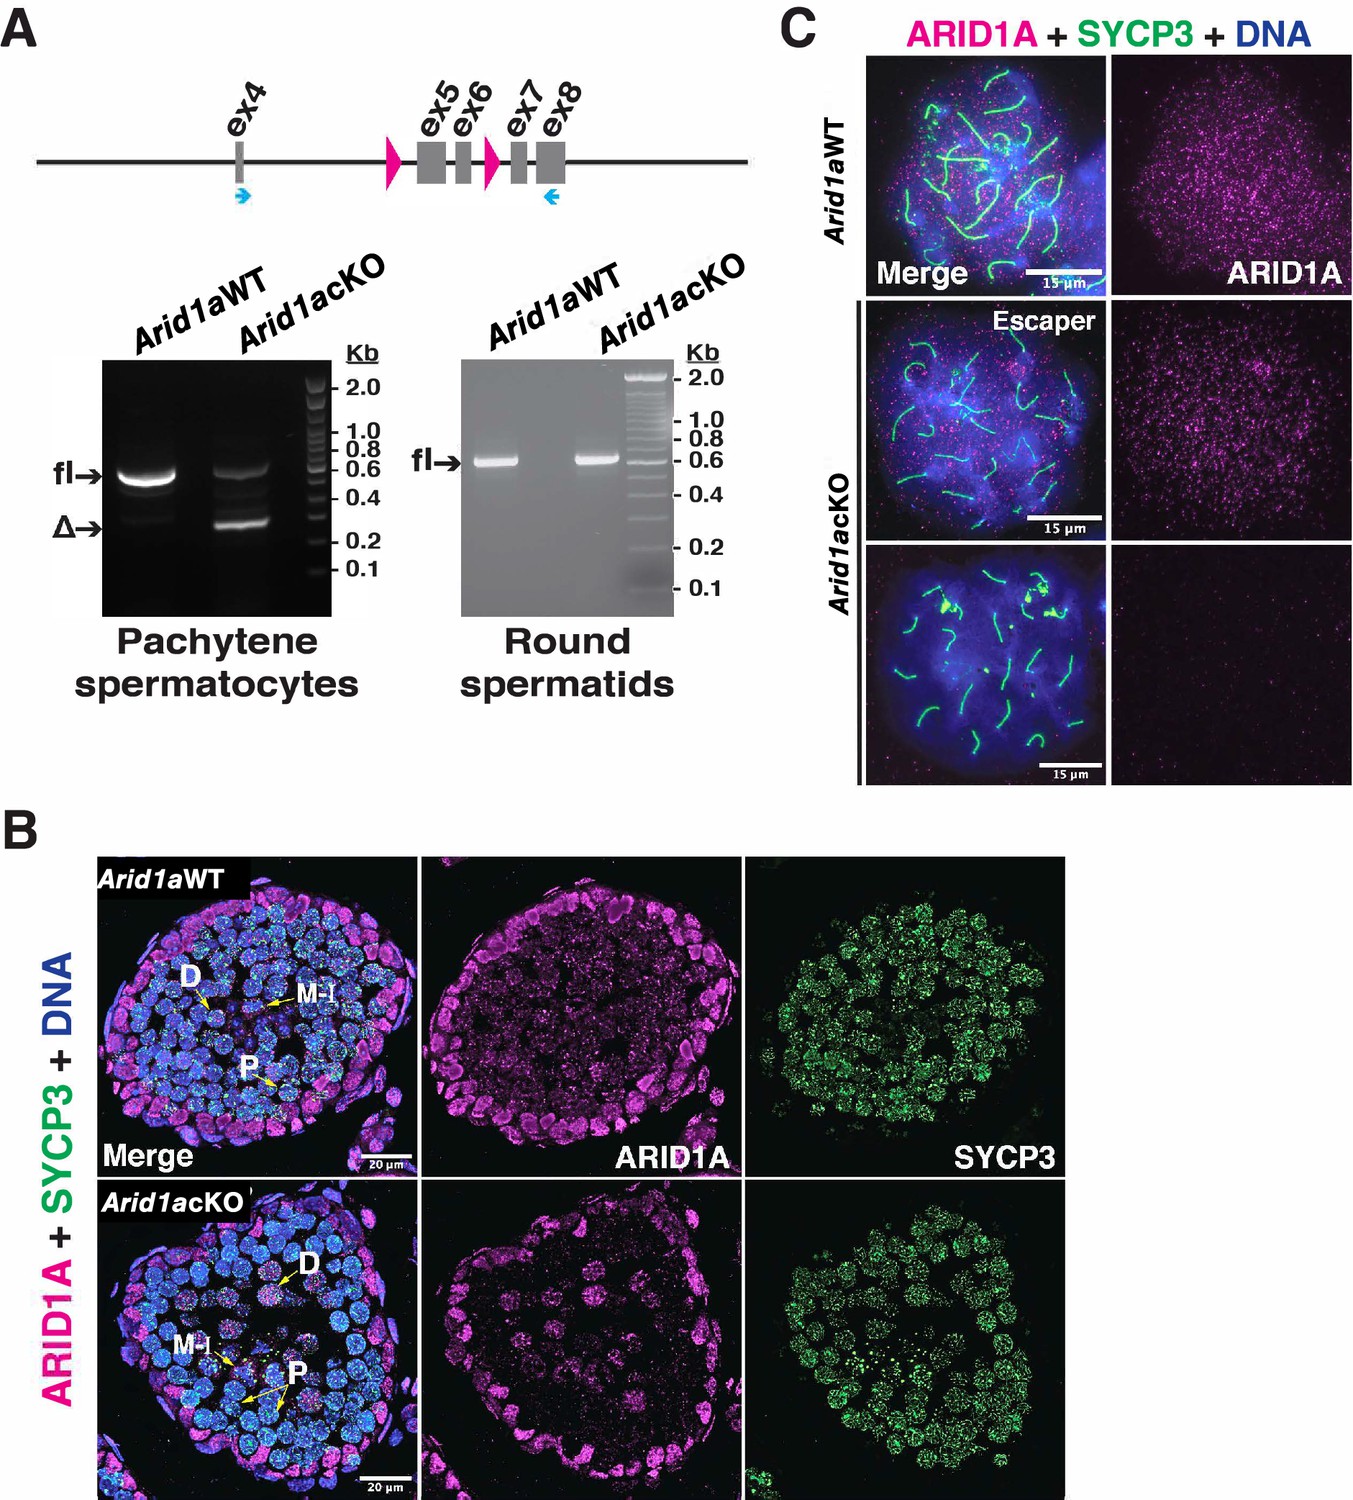
Arid1a cKO testes display inefficient Stra8-Cre activity.
(A) Schematic (top) illustrating the region of Arid1afl allele spanning exons (ex) 4–8 (grey boxes) along with the location of loxP sites (solid magenta arrowheads) and primer annealing sites (blue arrows). (A bottom): analysis of the RT-PCR of Arid1a transcripts from STA-PUT purified populations of Arid1a WT and Arid1a cKO pachytene spermatocytes (left) and round spermatids (right). DNA electrophoresis gels indicate bands corresponding to the fl: floxed and Δ: excised PCR products. Arid1a WT and Arid1a cKO (B) testes cryosections and (C) spermatocyte spreads, immunolabelled for ARID1A (magenta), SYCP3 (green), and counterstained for DNA (blue). (B) Scale bar: 20 μm, magnification: ×63, P: Pachytene, D: Diplotene, and M-I: Metaphase-I spermatocytes. (C) Scale bar:15 μm, magnification: ×100. Brightness of the whole panels (B,C) were increased by compressing the dynamic range of the image panels using Adobe photoshop (0-1-255 to 0-1-150).
-
Figure 2—figure supplement 3—source data 1
Raw images of DNA electrophoresis gels for the analysis of the RT-PCR of Arid1a transcripts from STA-PUT purified populations of Arid1a WT and Arid1a cKO pachytene spermatocytes and round spermatids (Figure 2—figure supplement 3a).
- https://cdn.elifesciences.org/articles/88024/elife-88024-fig2-figsupp3-data1-v1.zip
-
Figure 2—figure supplement 3—source data 2
Complete and marked images of DNA electrophoresis gels presented in Figure 2—figure supplement 3a.
- https://cdn.elifesciences.org/articles/88024/elife-88024-fig2-figsupp3-data2-v1.zip
Figure 2—figure supplement 4
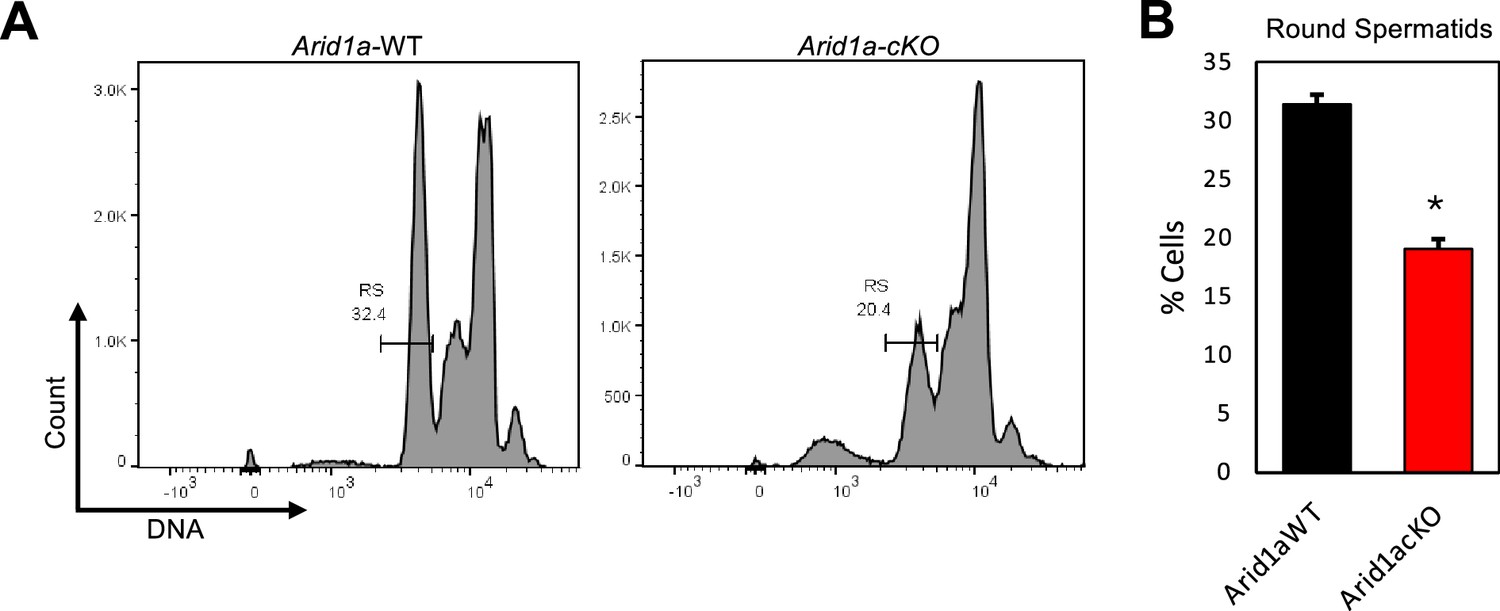
Arid1a mutant testes exhibit aberrant meiotic prophase I, reducing the abundance of round spermatids during the first wave of spermatogenesis.
(A) The abundance of round spermatids on P26 was determined by measuring the 1 C DNA content through DNA staining and flow cytometry. (B) Bars represent the quantification of round spermatids (mean ± S.E.M.). *; p<0.01 (n=3) (Unpaired Student’s t-test).
Figure 2—figure supplement 5
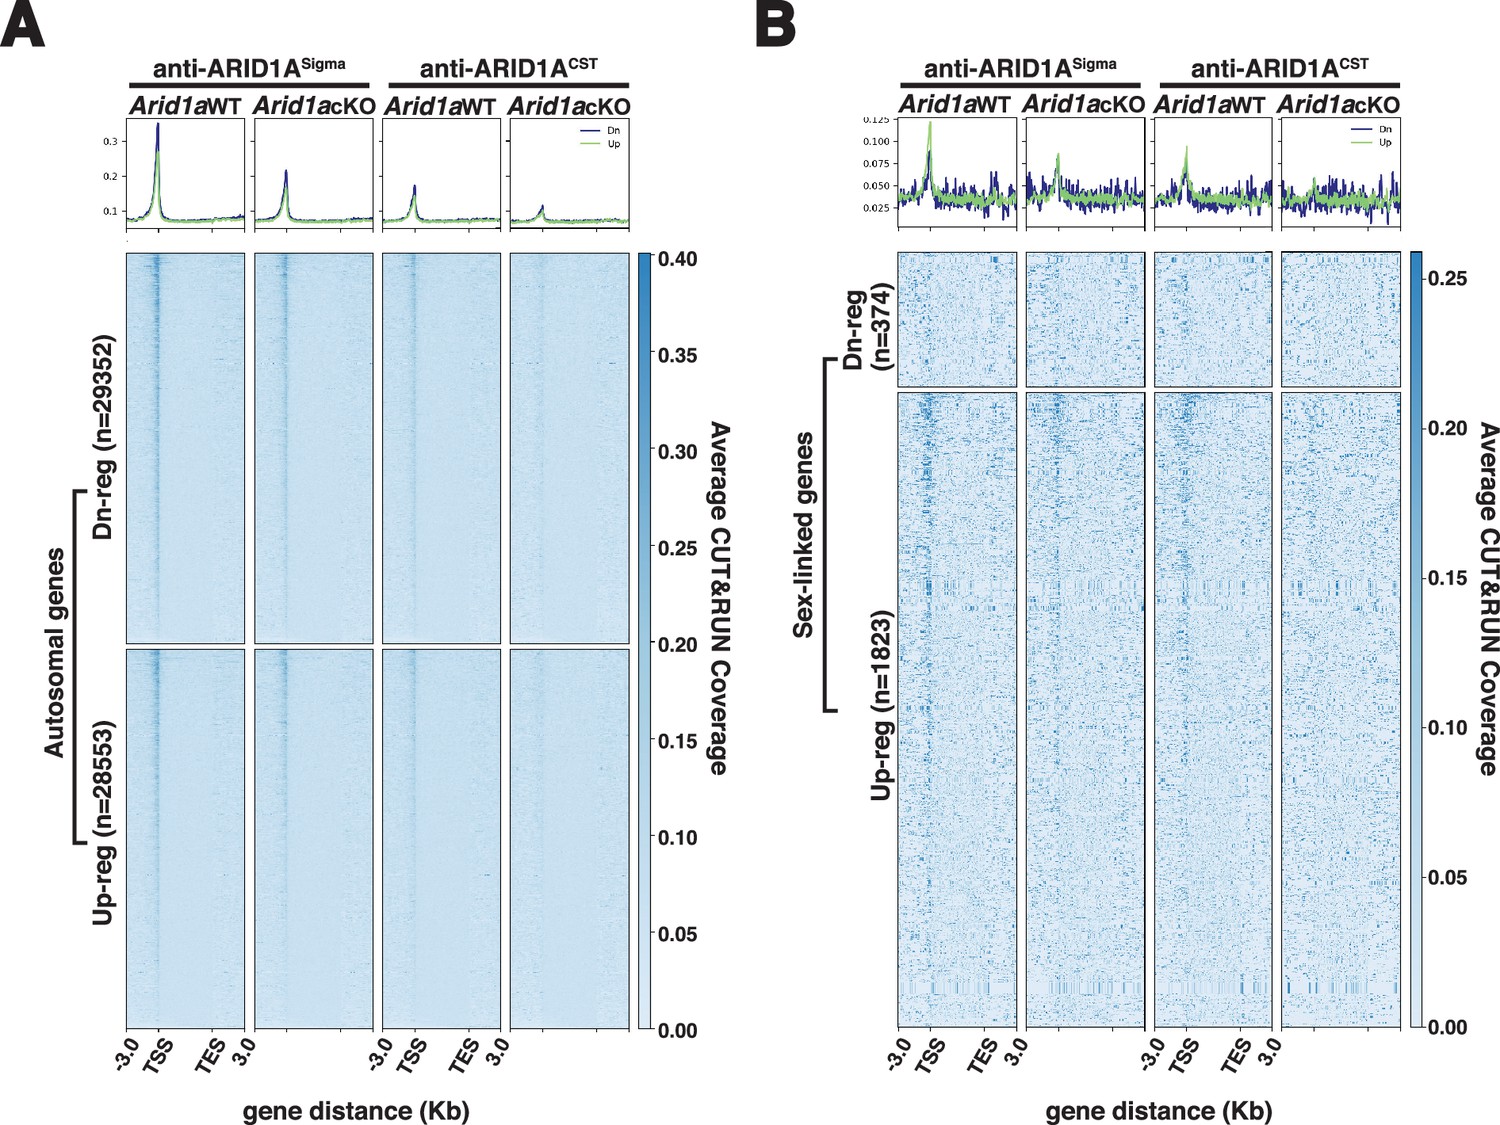
Transcription start sites of differentially expressed autosomal and sex-linked genes display ARID1A occupancy.
(A–B) Heatmap (bottom) and metaplot (top) displaying the average gene-wide enrichment of ARID1A associated with differentially expressed (A) autosomal and (B) sex-linked genes in Arid1a WT and Arid1a cKO pachytene spermatocytes. (A–B) The number of RefSeq annotations (n) associated with differentially regulated autosomal and sex-linked genes (rows) is indicated. Up-reg: misexpressed and Dn-reg: misrepressed genes in response to the loss of ARID1A. Average ARID1A CUT&RUN coverage was determined using two antibodies (anti-ARID1ASigma; anti-ARID1ACST) plotted across RefSeq genes ± 3 Kb.
Figure 2—figure supplement 6
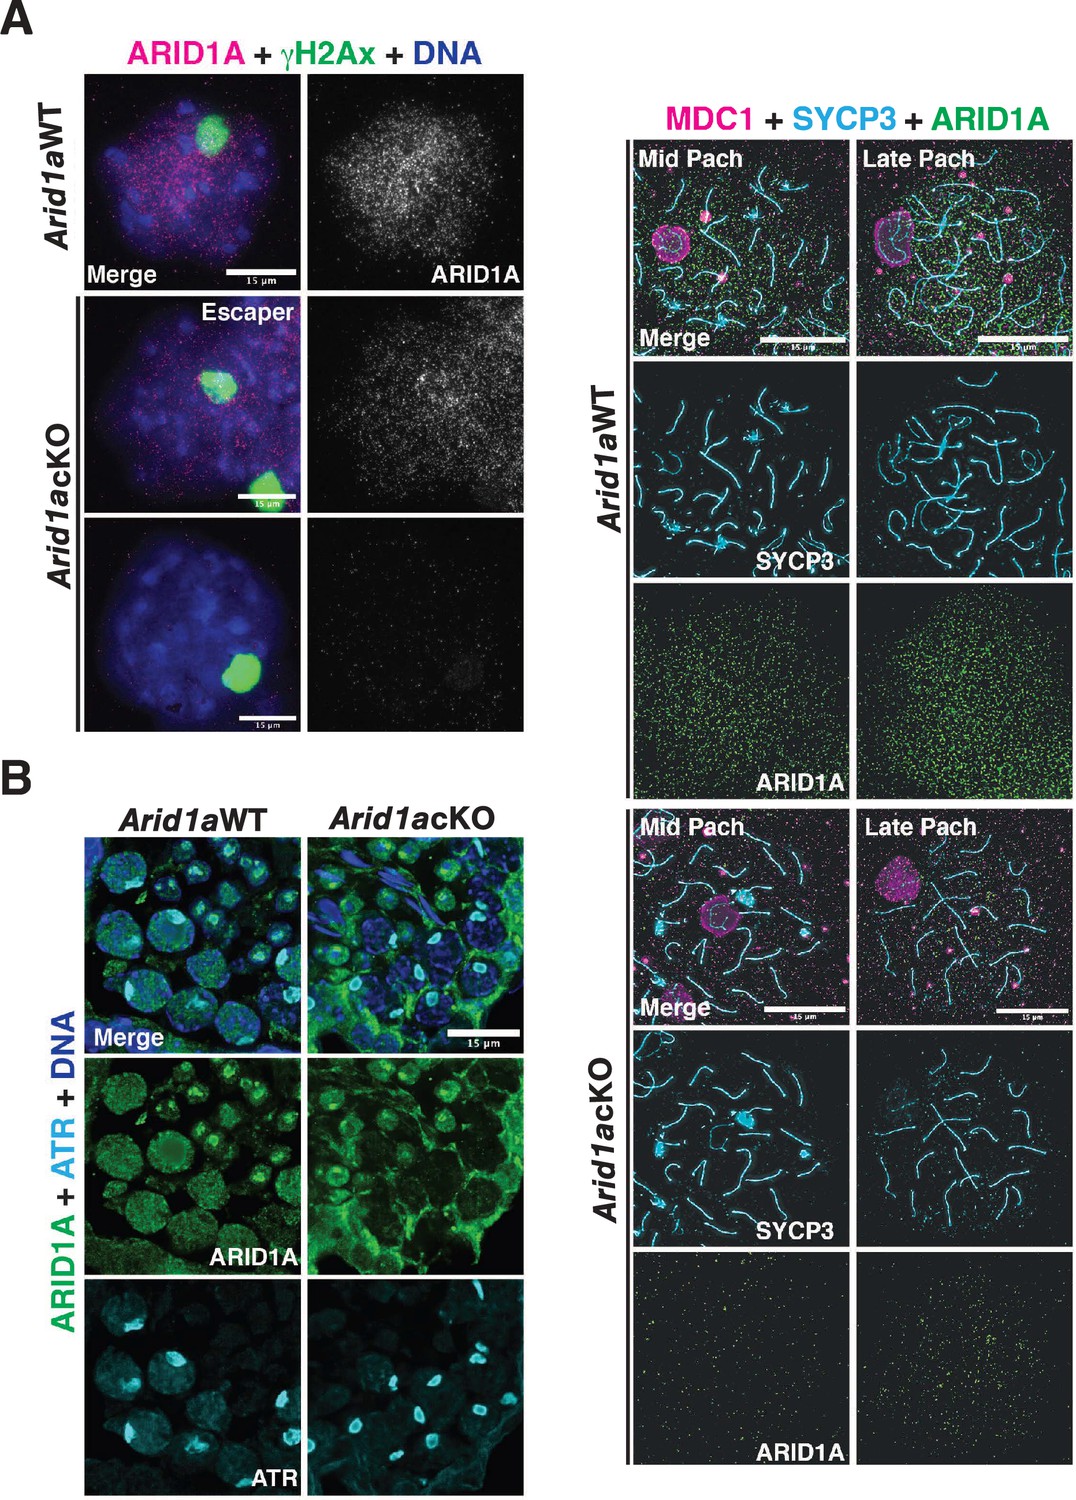
ARID1A does not influence sex body formation.
(A) Arid1a WT and Arid1a cKO spermatocyte spreads immunolabelled for ARID1A (magenta) and γH2Ax (green). Scale bar:15 μm, magnification: ×100. (B) Cross-section of adult (3-month-old) Arid1anWT and Arid1a cKO seminiferous tubules immunolabelled for ARID1A (green) and ATR (cyan). Scale bar:15 μm, magnification: ×63. (C) Arid1a WT and Arid1a cKO pachytene spermatocytes immunolabelled for MDC1 (magenta), SYCP3 (cyan), and ARID1A (green). Scale bar:15 μm, magnification: ×100. (A–B) DNA counterstained with DAPI (blue). Brightness of the whole image panel (C) was increased by compressing the dynamic range of the image panel using Adobe photoshop (0-1-255 to 0-1-150).
Figure 3
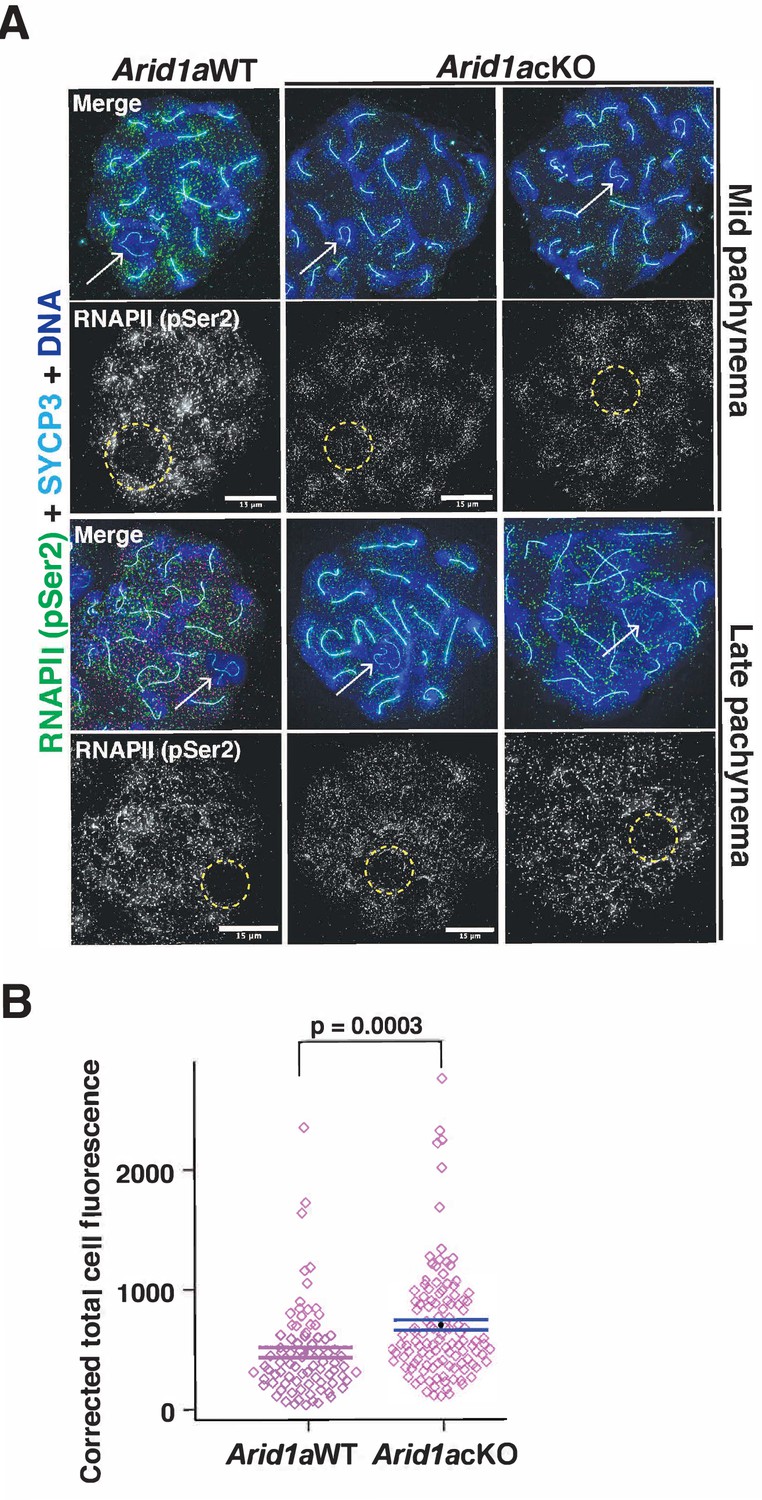
ARID1A limits RNA polymerase II (RNAPII) localization to the sex body.
(A) Arid1a WT and Arid1a cKO pachytene spermatocytes immunolabelled for pSer2-RNAPII (green), SYCP3 (cyan), and counterstained with DAPI (blue). Scale bar:15 μm, magnification: ×100. The sex chromosomes (white arrow) and sex body (yellow dashed circle) are labeled. Brightness of the whole image panel (A) was increased by compressing the dynamic range of the image panel using Adobe photoshop (0-1-255 to 0-1-150). (B) Dot plot describing the corrected total pSer2-RNAPII fluorescence (y-axis) measured from Arid1a WT (n=82) and Arid1a cKO (n=119) pachytene spermatocytes (3 replicates per genotype). Empty diamonds (magenta) represent independent data points. Significance determined by a two-tailed unpaired Student’s t-test p values. Data expressed as mean (black dot) ± SEM.
-
Figure 3—source data 1
Quantitation of pSer2RNAPII.
Quantitation of increased levels of RNAPII (pSer2) association with the sex chromosomes in Arid1a cKO relative to Arid1a WT mid and late pachytene spermatocyte.
- https://cdn.elifesciences.org/articles/88024/elife-88024-fig3-data1-v1.xlsx
Figure 4
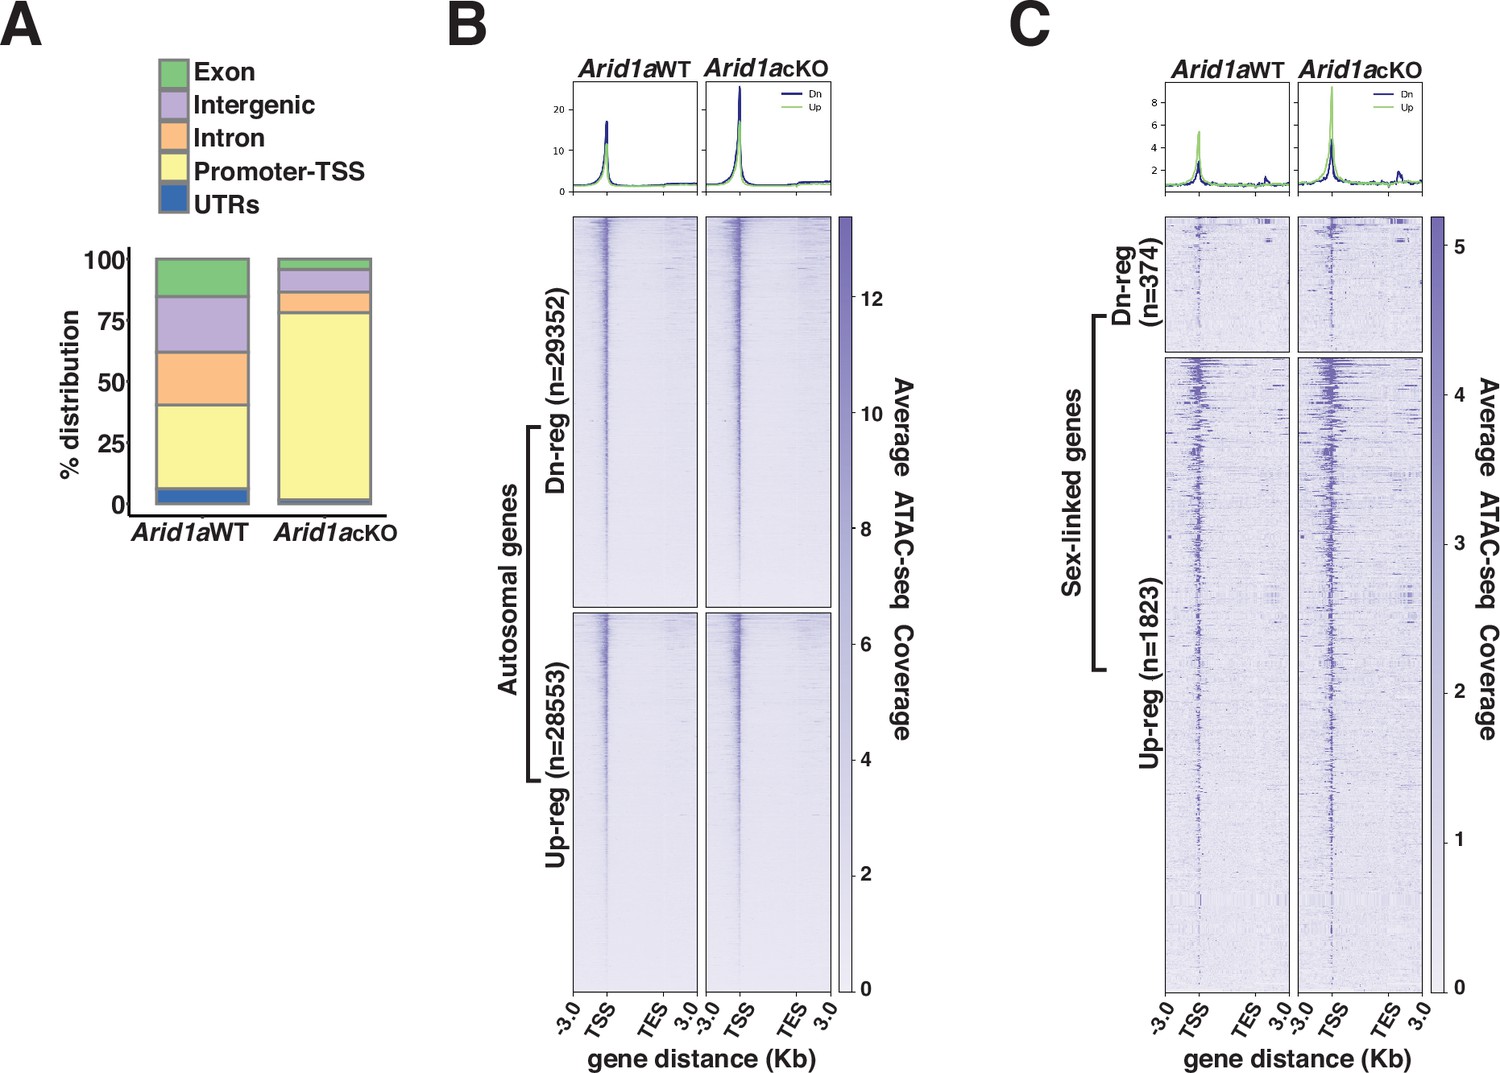
ARID1A limits promoter accessibility.
(A) Genomic associations of MACS2 derived ATAC-seq peak calls from Arid1a WT and Arid1a cKO pachytene spermatocytes. Percent (%) distribution of genomic annotations is indicated. (B–C) Heatmap (bottom) and metaplot (top) displaying the average ATAC-seq signal associated with differentially expressed (B) autosomal and (C) sex-linked genes in Arid1a WT and Arid1a cKO pachytene spermatocytes. (B–C) The number of RefSeq annotations (n) associated with differentially regulated genes (rows) is indicated. Up-reg: misexpressed, and Dn-reg: misrepressed genes in response to the loss of ARID1A. Average ATAC-seq coverage was plotted across RefSeq genes ± 3 Kb.
-
Figure 4—source data 1
ATACseq peaks changes in chromatin accessibility in response to the loss of ARID1A using ATAC-seq.
- https://cdn.elifesciences.org/articles/88024/elife-88024-fig4-data1-v1.xlsx
Figure 5 with 3 supplements
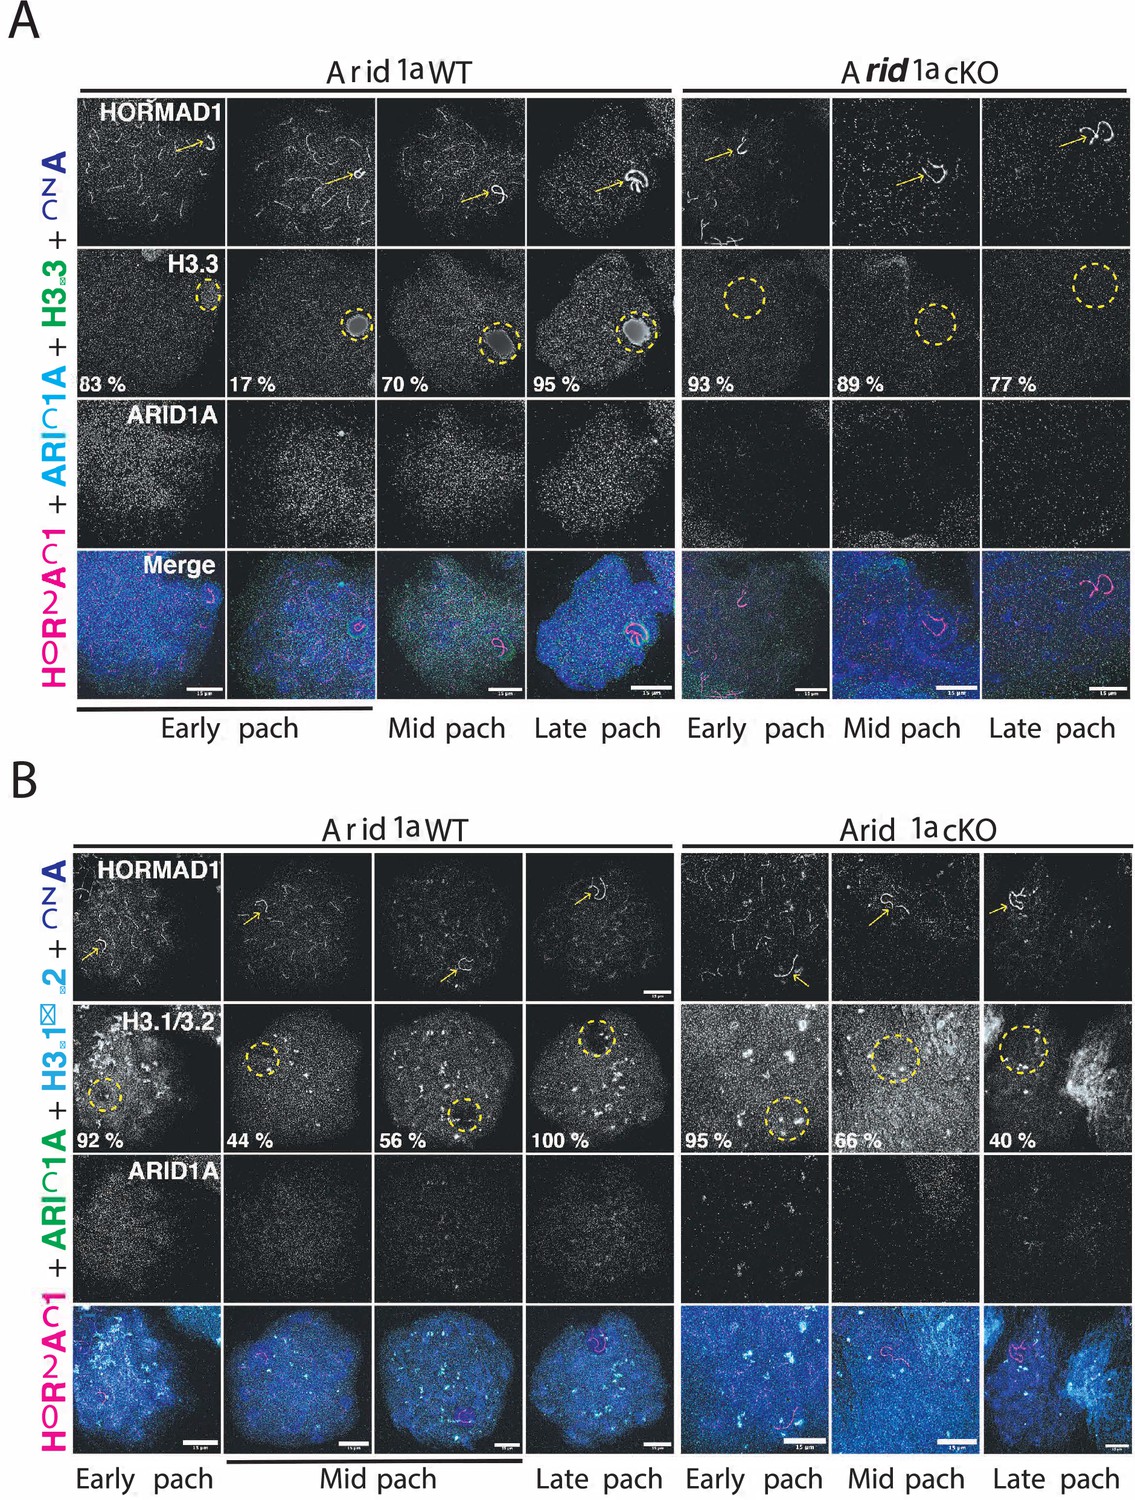
ARID1A influences the chromatin composition of the sex body.
(A–B) Arid1a WT and Arid1a cKO pachytene spermatocytes immunolabelled for HORMAD1 (magenta), (A) ARID1A (cyan) and H3.3 (green), (B) ARID1A (green) and H3.1/3.2 (cyan). (A–B) Proportion (%) of Arid1a WT and Arid1a cKO early, mid, and late pachytene spermatocytes displaying distinct (A) H3.3, (B) H3.1/3.2 localization patterns with the sex body. For H3.3 immunostaining, the total number of Arid1a WT pachytene spermatocytes: early = 144, mid = 274, late = 95; Arid1a cKO pachytene spermatocytes: early = 43, mid = 86, late = 55, were scored, from three replicates each. For H3.1/3.2 immunostaining, the total number of Arid1a WT pachytene spermatocytes: early = 91, mid = 124, late = 45; Arid1a cKO pachytene spermatocytes: early = 22, mid = 116, late = 58, were scored, from three replicates each. DNA counterstained with DAPI (blue). The sex chromosomes (yellow arrow) and sex body (yellow dashed circle) are labeled. Scale bar:15 μm, magnification: ×100. Brightness of the whole image panel (Figure 5) was increased by compressing the dynamic range of the image panels using Adobe photoshop (0-1-255 to 0-1-150).
Figure 5—figure supplement 1
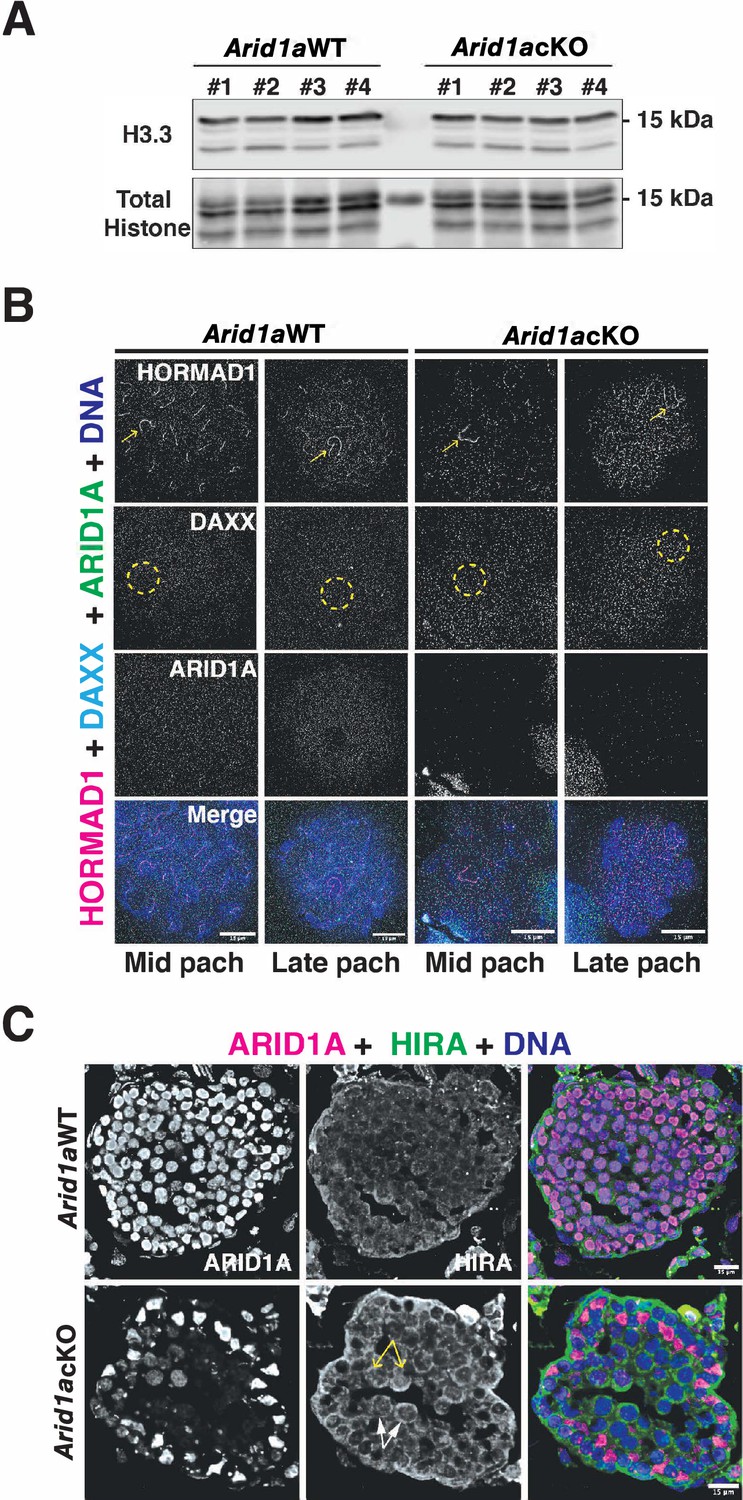
ARID1A does not influence the expression or incorporation of H3.3.
(A) Western blots on acid-extracted histones obtained from four independent replicates of P19 Arid1a WT and Arid1a cKO spermatogenic cells, displaying H3.3 abundance. Total histone levels from each sample are displayed. (B) Arid1a WT and Arid1a cKO pachytene spermatocytes immunolabelled for HORMAD1 (magenta), DAXX (cyan), and ARID1A (green). DNA counterstained with DAPI (blue). The sex chromosomes (yellow arrow) and sex body (yellow dashed circle) are labeled. Scale bar:15 μm, magnification: ×100. (C) Arid1a WT and Arid1a cKO testis cryosections immunolabelled for ARID1A (magenta) and HIRA (green). DNA counterstained with DAPI (blue). Representative mutant (white arrows) and escaper (yellow arrows) pachytene spermatocytes labeled in Arid1a cKO testis cryosection. Scale bar: 15 μm, magnification: 63 x. Brightness of the whole panels (B, C) were increased by compressing the dynamic range of the image panels using Adobe photoshop (0-1-255 to 0-1-150).
-
Figure 5—figure supplement 1—source data 1
Raw images of western blot for H3.3 and total histone (Figure 5—figure supplement 1a).
- https://cdn.elifesciences.org/articles/88024/elife-88024-fig5-figsupp1-data1-v1.zip
-
Figure 5—figure supplement 1—source data 2
Complete and marked images of western blot for H3.3 and total histone (Figure 5—figure supplement 1a).
- https://cdn.elifesciences.org/articles/88024/elife-88024-fig5-figsupp1-data2-v1.zip
Figure 5—figure supplement 2
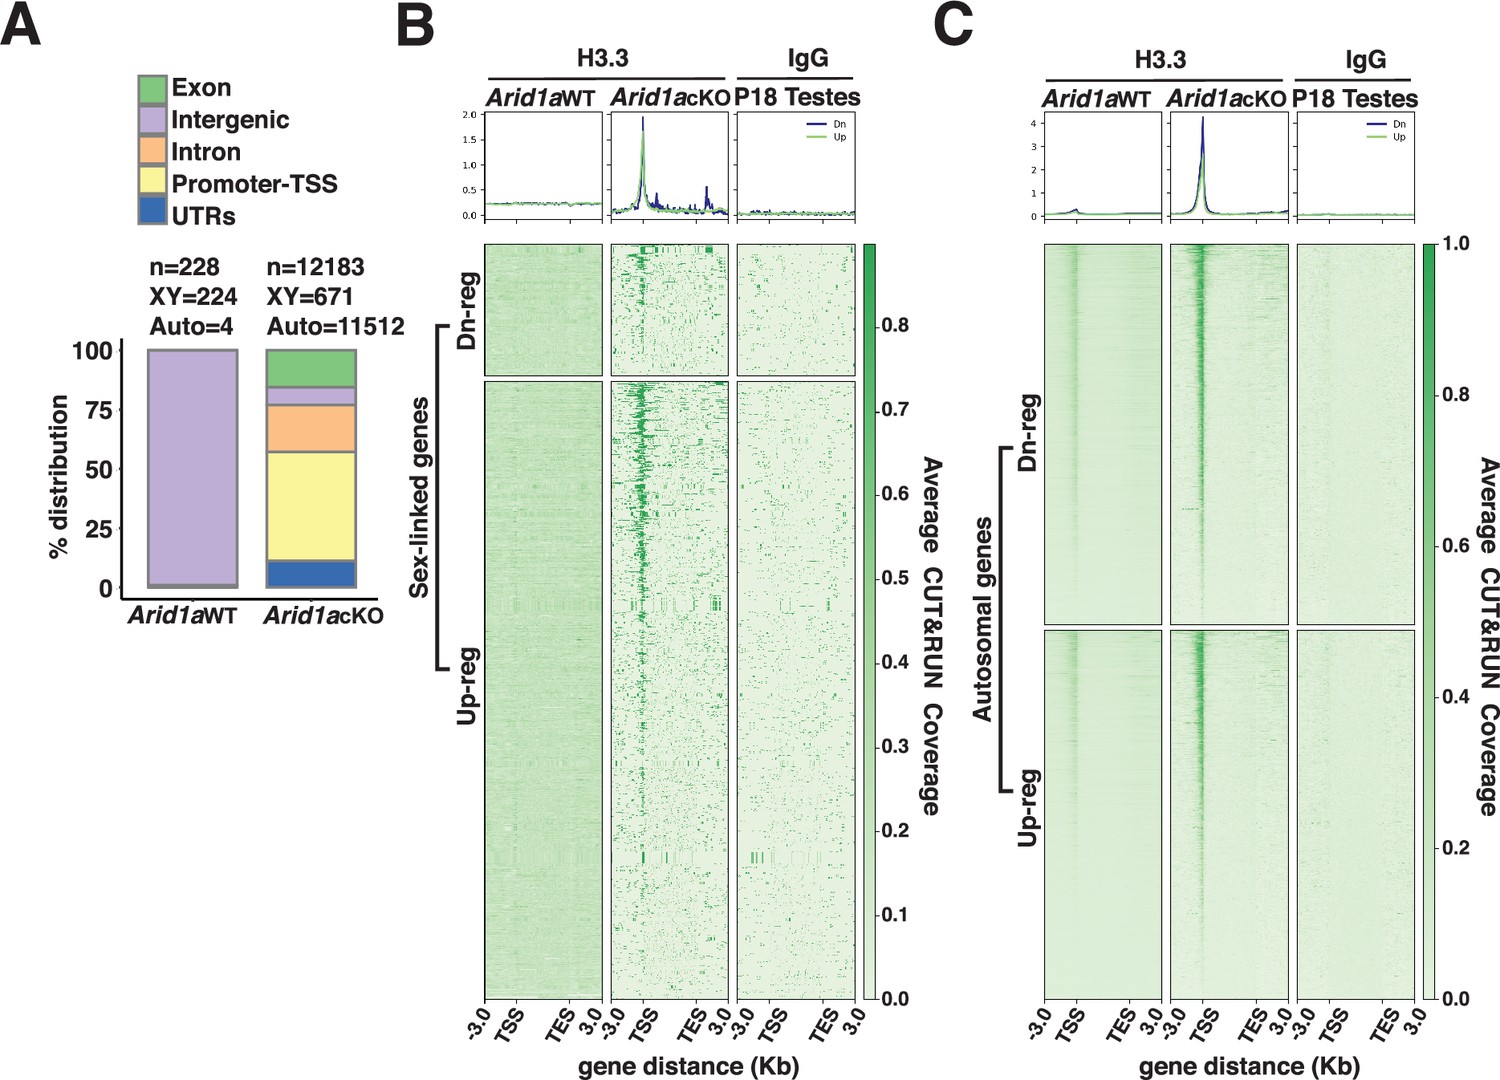
ARID1A limits H3.3 occupancy at promoters.
(A) Genomic associations of MACS2 H3.3 peak calls from Arid1a WT and Arid1a cKO pachytene spermatocytes. Percent (%) distribution of genomic annotations is indicated. (B–C) Heatmap (bottom) and metaplot (top) displaying the average H3.3 signal associated with differentially expressed (B) autosomal and (C) sex-linked genes in Arid1a WT and Arid1a cKO pachytene spermatocytes. (B–C) The number of RefSeq annotations (n) associated with differentially regulated genes (rows) is indicated. Up-reg: misexpressed, and Dn-reg: misrepressed genes in response to the loss of ARID1A. Average H3.3 coverage plotted across RefSeq genes ± 3 Kb.
-
Figure 5—figure supplement 2—source data 1
MACS2 H3.3 peak calls from Arid1a WT and Arid1a cKO pachytene spermatocytes.
H3.3 association with TSSs of genes differentially regulated by ARID1A.
- https://cdn.elifesciences.org/articles/88024/elife-88024-fig5-figsupp2-data1-v1.xlsx
Figure 5—figure supplement 3
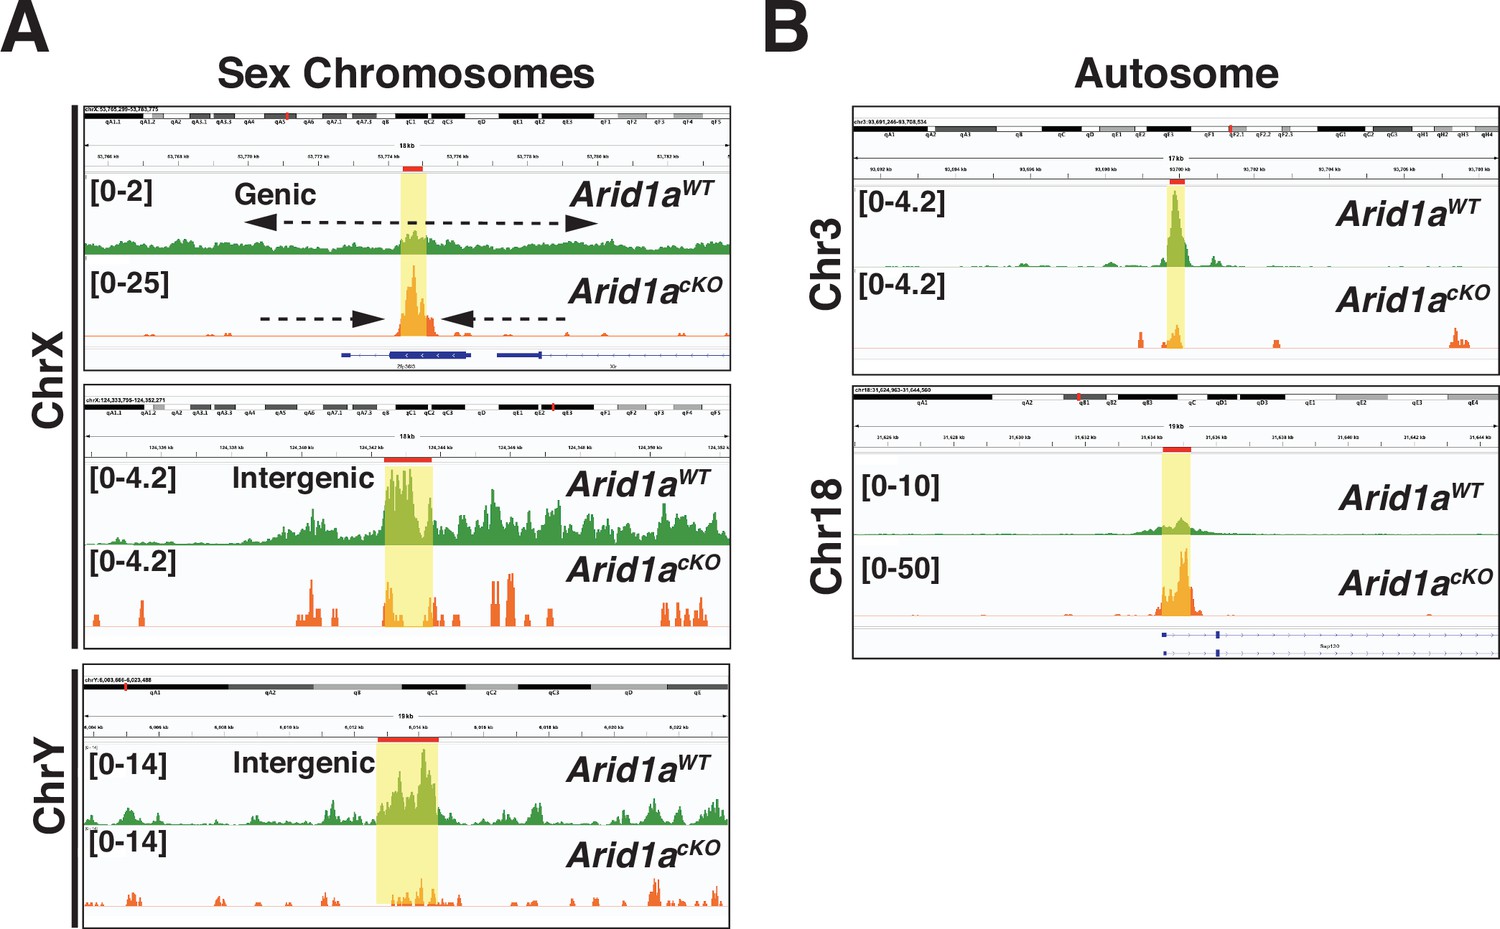
Genome browser views of ARID1A governed H3.3 genomic associations.
H33 CUT&RUN coverage from Arid1a WT (green tracks) and Arid1a cKO (Orange tracks) pachytene spermatocytes. Solid red bars and yellow highlights denote H3.3 peak calls (MACS2) from Arid1a WT and Arid1a cKO pachytene spermatocytes. Vertical viewing limits within parentheses.
Figure 6 with 1 supplement
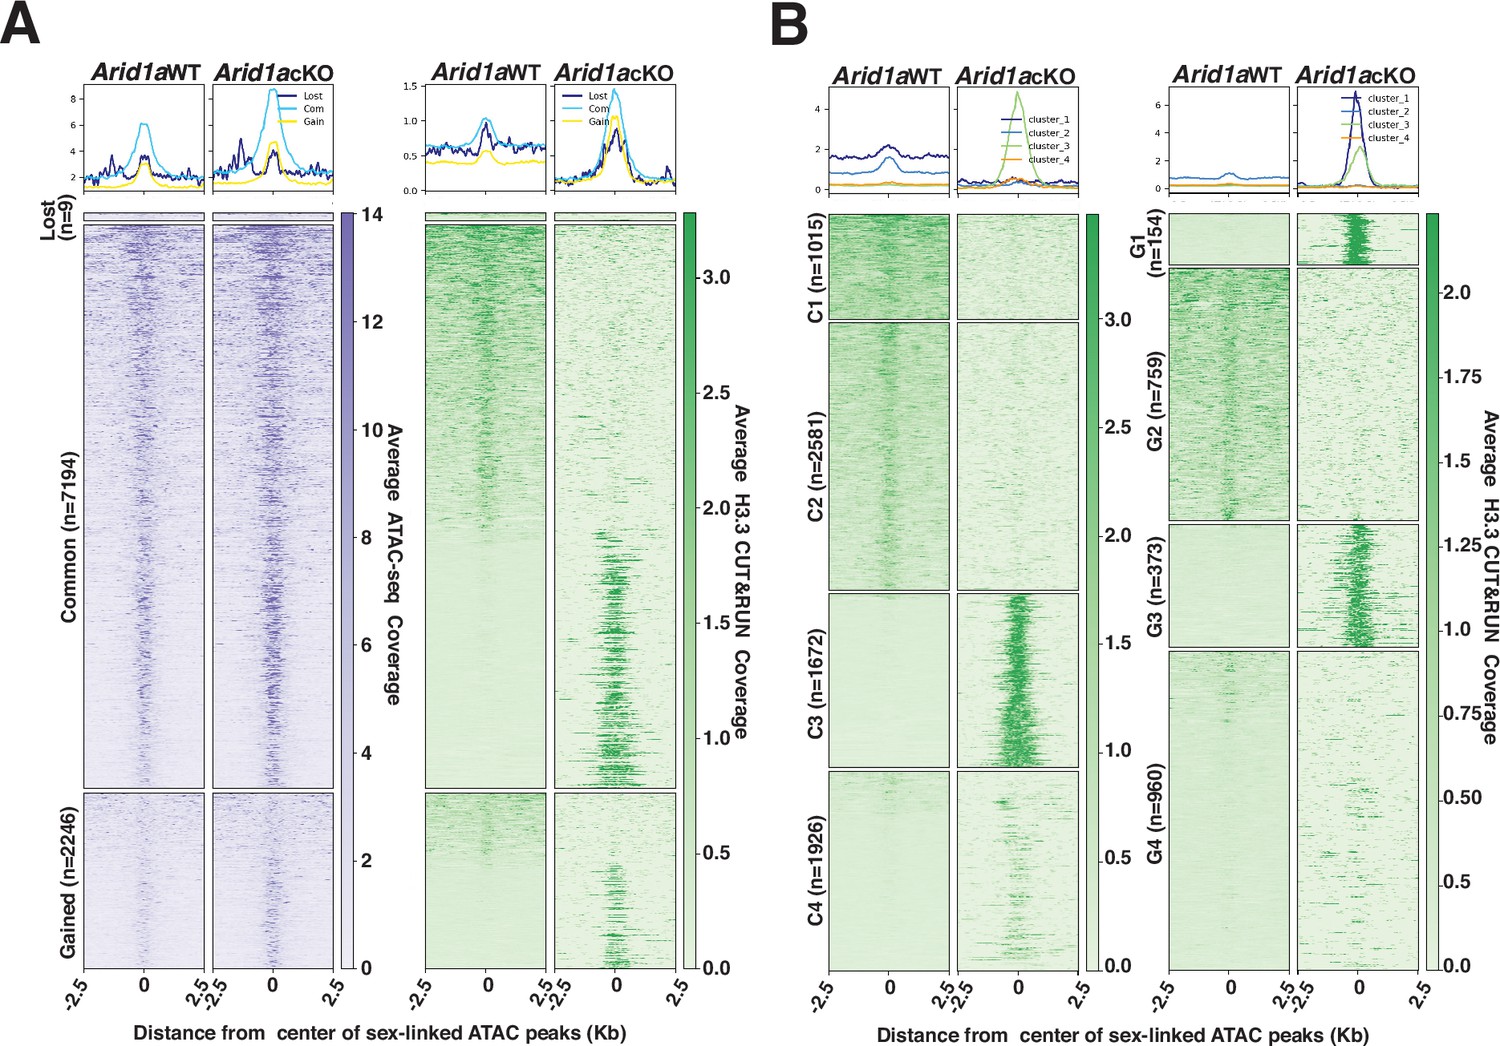
H3.3 displays differential occupancy across ARID1A-governed sex-linked open chromatin.
(A–B) Heatmaps (bottom) and metaplots (top) displaying average (A) chromatin accessibility (purple heatmap) and H3.3 enrichment (green heatmap) associated with lost, common, and gained ATAC-seq peak calls (MACS2), (B) enrichment of H3.3 at k-means clusters associated with common (C1-C4, left) and gained (G1-G4, right) ATAC-seq peaks, in Arid1a WT and Arid1a cKO pachytene spermatocytes. (A–B) ATAC-seq and H3.3 coverage plotted over a 5 Kb window centered at ATAC-seq peaks (MACS2). Number of ATAC-seq peak calls (n) associated with each category is indicated.
Figure 6—figure supplement 1
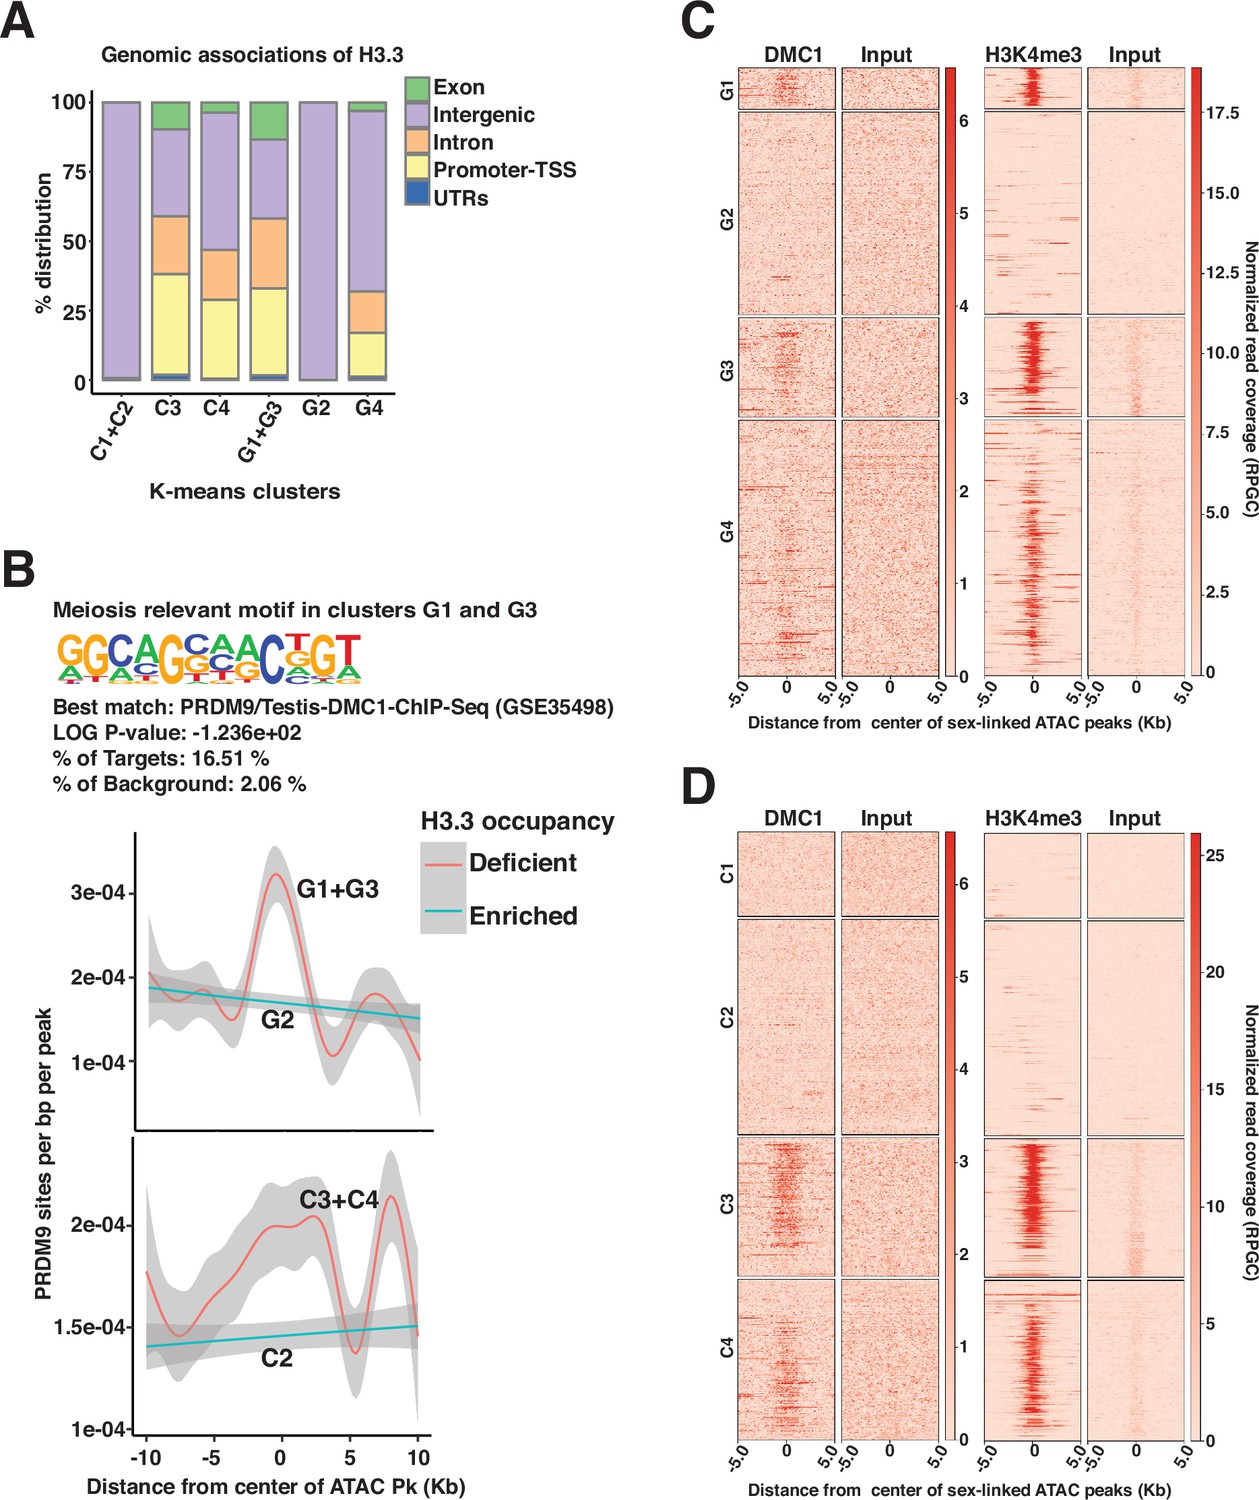
H3.3 occupancy is antagonistic to DMC1 associations in non-homologous sex-linked regions.
(A) Genomic associations of common (C1–C4) and gained (G1–G4) k-means clusters in pachytene spermatocytes. Percent (%) distribution of genomic annotations is indicated. (B) Results of PRDM9 motif enrichment analyses at gained (G1 and G3), k-means clusters (top), and plots describing the frequency of PRDM9 motifs (y-axis) spanning a 5 Kb window centered at ATAC-seq peaks (x-axis) associated with gained (middle) and common (bottom) k-means clusters that are either deficient (orange trend line) or enriched (cyan trend line) for H3.3 occupancy. Trend lines were generated using generalized additive mode smoothing (gam). 95% confidence interval (gray shading) is indicated. (C–D) Heatmaps displaying testes DMC1 (left) and pachytene spermatocyte associated H3K4me3 (right) enrichment relative to input at k-means clusters associated with (C) gained (G1–G4), and (D) common (C1–C4) ATAC-seq peaks. (C–D) DMC1 and H3K4me3 coverage plotted over a 10 Kb window centered at ATAC-seq peaks (MACS2).
Figure 7 with 1 supplement
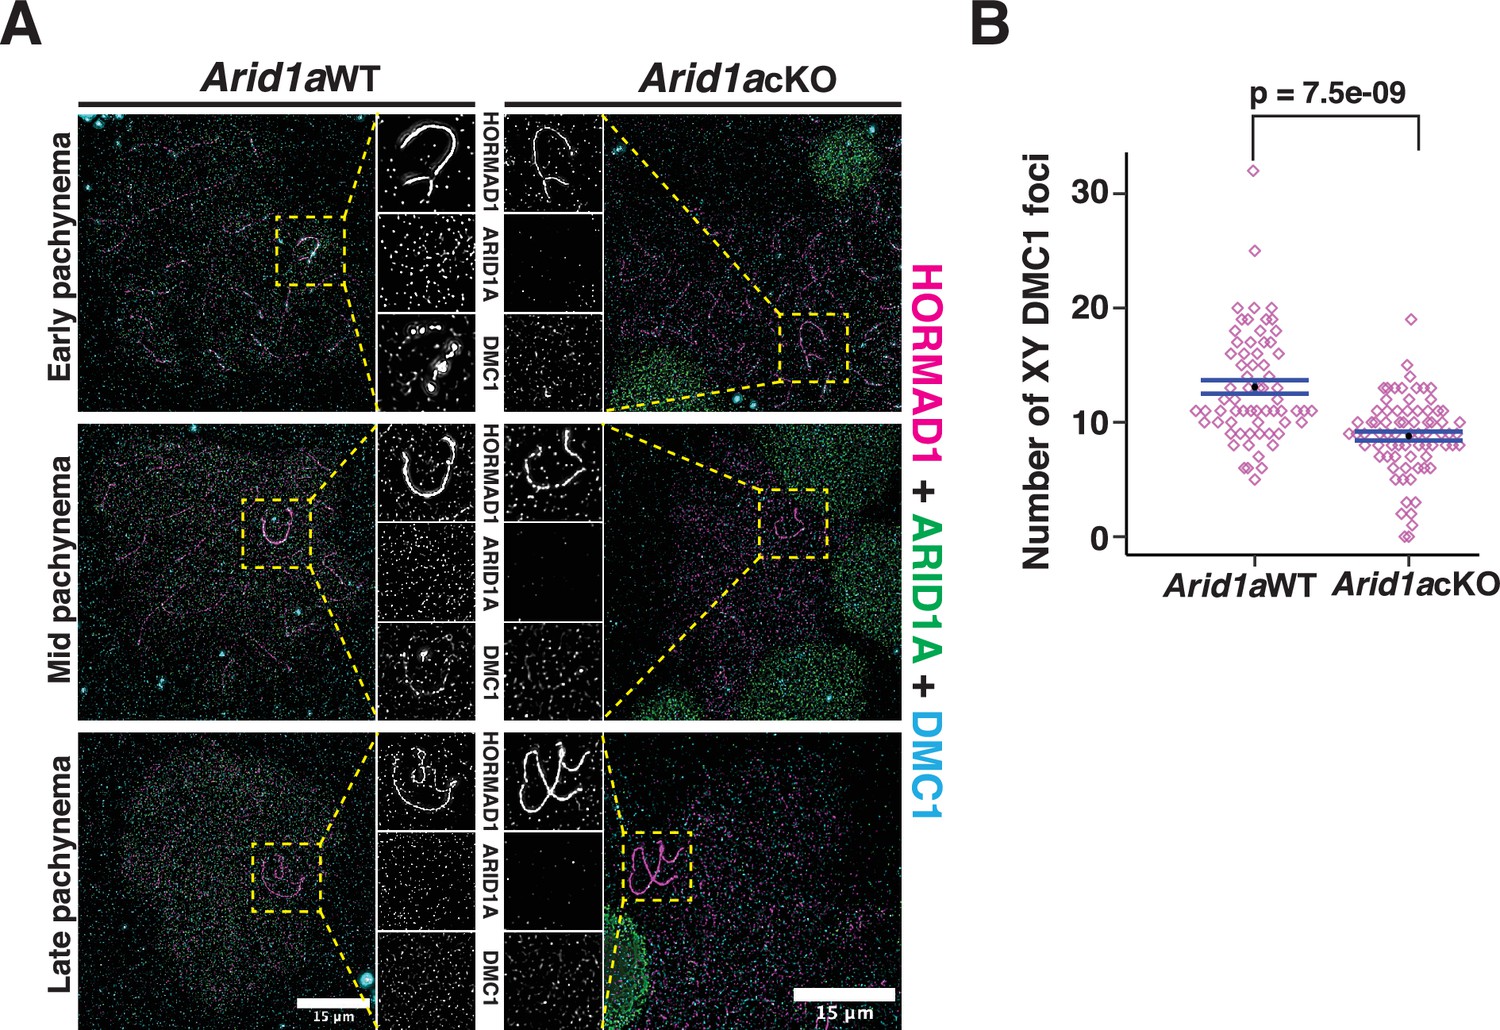
ARID1A influences the axial association of DMC1 with the XY during pachynema.
(A) Arid1a WT and Arid1a cKO pachytene spermatocytes immunolabelled for HORMAD1 (magenta), ARID1A (green), DMC1 (cyan), and counterstained with DAPI (blue). Scale bar:15 μm, magnification: ×100. A magnified view of the sex chromosomes is indicated (yellow dashed square). (B) Dot plot displaying the number of sex-linked DMC1 foci (y-axis) quantified from Arid1a WT (n=66) and Arid1a cKO (ARID1A-, n=75) pachytene spermatocytes, obtained from three replicates each. Empty diamonds (magenta) represent independent data points. Significance determined using a two-tailed unpaired Student’s t-test p values. Data expressed as mean (black dot) ± SEM.
-
Figure 7—source data 1
Quantitation of DMCI Foci on the sex chromosomes.
Quantification of DMC1 foci in Arid1a cKO relative to Arid1a WT pachytene spermatocytes revealed a significant decrease in the sex-linked association of DMC1 in the absence of ARID1A.
- https://cdn.elifesciences.org/articles/88024/elife-88024-fig7-data1-v1.xlsx
Figure 7—figure supplement 1
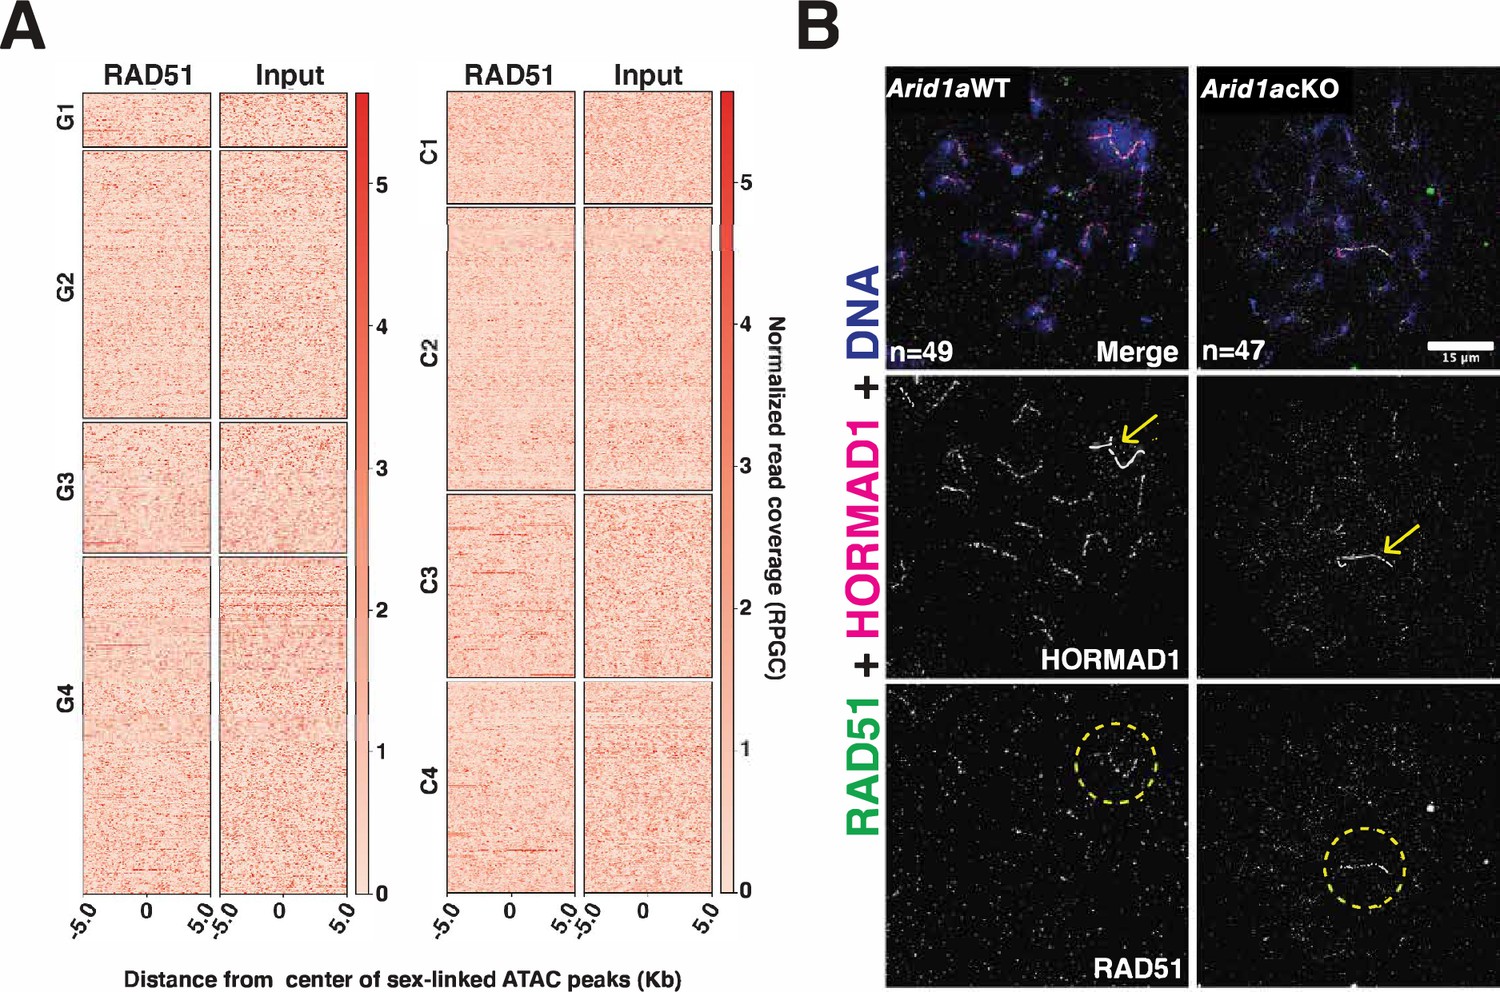
ARID1A does not affect the axial association of RAD51 with the XY during pachynema.
(A) Heatmaps displaying testes RAD51 enrichment relative to input at k-means clusters associated with gained (G1-G4, left) and common (C1-C4, right) ATAC-seq peaks. RAD51 coverage plotted over a 10 Kb window centered at ATAC-seq peaks (MACS2). (B) Arid1a WT and Arid1a cKO pachytene spermatocytes immunolabelled for HORMAD1 (magenta), RAD51 (green) and counterstained with DAPI (blue). Scale bar:15 μm, magnification: ×100. Yellow arrows and dashed circles label the sex chromosomes.
Figure 8

A model describing the role of ARID1A sex-linked chromatin regulation.
During meiosis, the sex chromosomes undergo transcriptional repression at the onset of pachynema. A dramatic change in the composition of sex-linked chromatin accompanies this chromosome-wide repression. From mid to late pachynema, spermatocytes display a hyper-accumulation of the variant histone H3.3 (Ochre shading and gradient) on the sex chromosomes (magenta) relative to autosomes (green). Concomitantly, the canonical histones H3.1/3.2 levels and elongating pSer2-RNAPII complex (grey gradients) appear depleted from the sex body by late pachynema. The loss of ARID1A dramatically alters the chromatin composition of the sex body, which features low H3.3 (yellow bar) association at levels indistinguishable from autosomes throughout pachynema. Concomitantly, canonical H3.1/3.2 and pSer2-RNAPII levels (grey bar) on the sex body remain abnormally stable throughout pachynema. These sex-linked chromatin aberrations, along with persistent transcription owing to the association of pSer2-RNAPII with mutant sex body, fail meiotic sex chromosome inactivation (MSCI) and, consequently, pachytene arrest. This defect also coincides with an abnormal loss of DMC1 (blue foci) localization to the unpaired sex chromatids in response to the loss of ARID1A. Therefore, along with transcriptional repression, ARID1A-governed chromatin dynamics appear to influence DNA repair on the sex chromosomes.
Tables
Table 1
Meiotic profile of P23 the wild type floxed and the conditional mutant allele.
The loss of ARID1A results in a pachytene arrest. Table outlining the distribution of P23 Arid1a WT and Arid1a cKO meiotic prophase-I profiles. SYCP3 staining determined meiotic staging. Co-staining of ARID1A identified mutant spermatocytes from escapers. The total number of spermatocytes scored included 166 for Aridafl/fl and 124 for Arid1a cKO. *denotes Arid1a cKO diplotene spermatocytes with partially reduced but not complete loss of ARID1A signal relative to controls.
| Meiotic profile (P23) | Arid1afl/fl (n=166) | Arid1a cKO (n=124) |
|---|---|---|
| Pre-Lep/Leptonema | 3.6% | 13.7% |
| Zygonema | - | 15.3% |
| Early Pachynema | 13.8% | 12.9% |
| Mid Pachynema | 22.8% | 40.3% |
| Late Pachynema | 7.2% | 7.2% |
| Early Diplonema | 28.5% | 4.8%* |
| Late Diplonema | 14.5% | 5.6%* |
Key resources table
| Reagent type (species) or resource | Designation | Source or reference | Identifiers | Additional information |
|---|---|---|---|---|
| Strain (mouse) | Arid1atm1Mag/Mmnc RRID:MMRRC_041418-UNC | Nat Commun. 2015 Jan 27;6:6118. (PMID:25625625) | MMRRC Stock number: 041418-UNC | Genotyping primers: Arid1afl/+ alleles - (F)- 5' - CTAGGTGGAAGGTAGCTGACTGA –3'; (R) 5' - TACACGGAGTCAGGCTGAGC –3' (PCR product sizes- fl: 300 bp; +: 200 bp) |
| Strain (mouse) | Stra8-Cre RRID;IMSR_JAX:008208 | Genesis. 2008 Dec;46(12):738–42 PMID:18850594 | JAX Stock # 008208 | Stra8-Cre - (F) 5' -GTGCAAGCTGAACAACAGGA-3', (R) 5' -AGGGACACAGCATTGGAGTC-3' (PCR product size- Cre: 150 bp) |
| Gene (mouse) | Arid1a cDNA | This Report | primers: (F)- 5' - TCCAGTAAGGGAGGGCAAGAAGAT –3'; (R) 5' - GTAGTTGGCGTTGGGCAAGGCATTA –3' (PCR product sizes- fl: 612 bp; Δ: 281 bp) | |
| Antibody | anti- ARID1A RRID:AB_1078205 (Rabbit polyclonal) | Millipore Sigma | Cat # HPA005456 | IF (1:500) CUT&RUN (1:25) |
| Antibody | anti- ARID1A (clone D2A8U) RRID:AB_2637010 (Rabbit monoclonal) | Cell signaling technology | Cat # 12354 | IF (1:500) CUT&RUN (1:25) WB (1:1000) |
| Antibody | anti- SYCP3 (Cor10G1f1/7) RRID:AB_10678841 (Mouse monoclonal) | Abcam | Cat # ab97672 | IF (1:500) |
| Antibody | anti-phospho-Histone H2A.X, (Ser139) (clone JBW301) RRID:AB_309864 (Mouse monoclonal) | Millipore Sigma | Cat # 05–636 | IF (1:1000) |
| Antibody | anti-ATR (N-19) RRID:AB_630893 (Goat polyclonal) | Santa Cruz Biotech | Cat # sc-1887 | IF (1:50) |
| Antibody | anti-MDC1 RRID:AB_323725 (Sheep polyclonal) | AbD Serotec | AHP799 | IF (1:500) |
| Antibody | anti-RNA pol II CTD phospho Ser-2 (clone 3E10) RRID:AB_2687450 (Rat monoclonal) | Active Motif | Cat # 61084 | IF (1:500) |
| Antibody | anti- HORMAD1 (Guinea Pig polyclonal) | Gift from Dr. Atilla Töth, TU Dresden; Wojtasz et al., 2009 | PMID:19851446 | IF (1:600) |
| Antibody | anti- H3F3B (Clone 2D7-H1) RRID:AB_425473 (Mouse monoclonal) | Abnova | Cat # H00003021-M01 | IF (1:200) CUT&RUN (1:25) |
| Antibody | anti- Histone H3.3 (Clone RM190) RRID:AB_2716425 (Rabbit monoclonal) | RevMAb Biosciences | Cat # 31-1058-00 | WB (1:1000) |
| Antibody | anti- Histone H3.1/3.2 (clone 1DA4F2) RRID:AB_2793710 (Mouse monoclonal) | Active Motif | Cat # 61630 | IF (1:500) |
| Antibody | anti-DAXX RRID:AB_2618529 (mouse monoclonal) | Developmental studies hybridoma bank | Cat # PCRP-DAXX-2B3 | IF (1:10) |
| Antibody | anti-HIRA (clone WC119.2H11) RRID:AB_2793256 (Mouse monoclonal) | Active Motif | Cat # 39558 | IF (1:100) |
| Antibody | anti- DMC1 (clone 2D5C9) RRID:AB_2882472 (Mouse monoclonal) | Proteintech | Cat # 67176–1-Ig | IF (1:200) |
| Antibody | anti- RAD51 RRID:AB_2665405 (Rabbit polyclonal) | Abcam | Cat # ab176458 | IF (1:500) |
| Antibody | anti-Nucleolin RRID:AB_533463 (Rabbit polyclonal) | Bethyl | Cat # A300-711A | WB (1:2000) |
| Antibody | anti-mouse IgG, Alexa fluor 488 RRID:AB_2534088 (Goat polyclonal) | Thermo Fisher | Cat # A-11029 | IF (1:500) |
| Antibody | anti-rabbit IgG, Alexa fluor 568 RRID:AB_10563566 (Goat polyclonal) | Thermo Fisher | Cat # A-11036 | IF (1:500) |
| Antibody | anti-goat IgG, Alexa fluor 633 RRID:AB_2535739 (Donkey polyclonal) | Thermo Fisher | Cat # A-21082 | IF (1:500) |
| Antibody | anti-sheep IgG, Alexa fluor 594 RRID:AB_2534083 (Donkey polyclonal) | Thermo Fisher | Cat # A-11016 | IF (1:500) |
| Antibody | anti-guinea pig IgG, Alexa fluor 568 RRID:AB_2534119 (Goat polyclonal) | Thermo Fisher | Cat # A-11075 | IF (1:500) |
| Antibody | anti- rat IgG, Alexa fluor 488 RRID:AB_2534074 (Goat polyclonal) | Thermo Fisher | Cat # A-11006 | IF (1:500) |
| Antibody | anti-mouse IgG1, Alexa fluor 647 RRID:AB_2535809 (Goat polyclonal) | Thermo Fisher | Cat # A-21240 | IF (1:500) |
| Antibody | anti- rabbit IgG, Alexa fluor 488 RRID:AB_143165 (Goat polyclonal) | Thermo Fisher | Cat # A-11008 | IF (1:500) |
| Antibody | anti-mouse IgG2b, Alexa fluor 647 RRID:AB_2535811 (Goat polyclonal) | Thermo Fisher | Cat # A-21242 | IF (1:500) |
| Antibody | anti- rabbit IgG, Alexa fluor 647 RRID:AB_2535813 (Goat polyclonal) | Thermo Fisher | Cat # A-21245 | IF (1:500) |
| Antibody | anti-mouse IgG2a, Alexa fluor 647 RRID:AB_2535810 (Goat polyclonal) | Thermo Fisher | Cat # A-21241 | IF (1:500) |
| Antibody | IRdye 800CW anti-rabbit RRID:AB_2651127 (Goat polyclonal) | LI-COR | Cat # 925–32211 | WB (1:10,000) |
| Antibody | AffiniPure anti-Mouse IgG (H+L) RRID:AB_2340033 (Rabbit polclonal) | JacksonImmunoResearch | Cat # 315-005-003 | CUT&RUN (1:100) |
| Antibody | anti-Rabbit IgG (H+L) RRID:AB_11024108 (Guinea pig polyclonal) | Novus biologicals | Cat # NBP1-72763 | CUT&RUN (1:100) |
Additional files
Download links
A two-part list of links to download the article, or parts of the article, in various formats.
Downloads (link to download the article as PDF)
Open citations (links to open the citations from this article in various online reference manager services)
Cite this article (links to download the citations from this article in formats compatible with various reference manager tools)
ARID1A governs the silencing of sex-linked transcription during male meiosis in the mouse
eLife 12:RP88024.
https://doi.org/10.7554/eLife.88024.5


