Chromosomal instability induced in cancer can enhance macrophage-initiated immune responses that include anti-tumor IgG
- Physical Sciences Oncology Center at Penn, University of Pennsylvania, United States
- Molecular and Cell Biophysics Lab, University of Pennsylvania, United States
- Bioengineering Graduate Group, University of Pennsylvania, United States
Figures
Figure 1 with 1 supplement
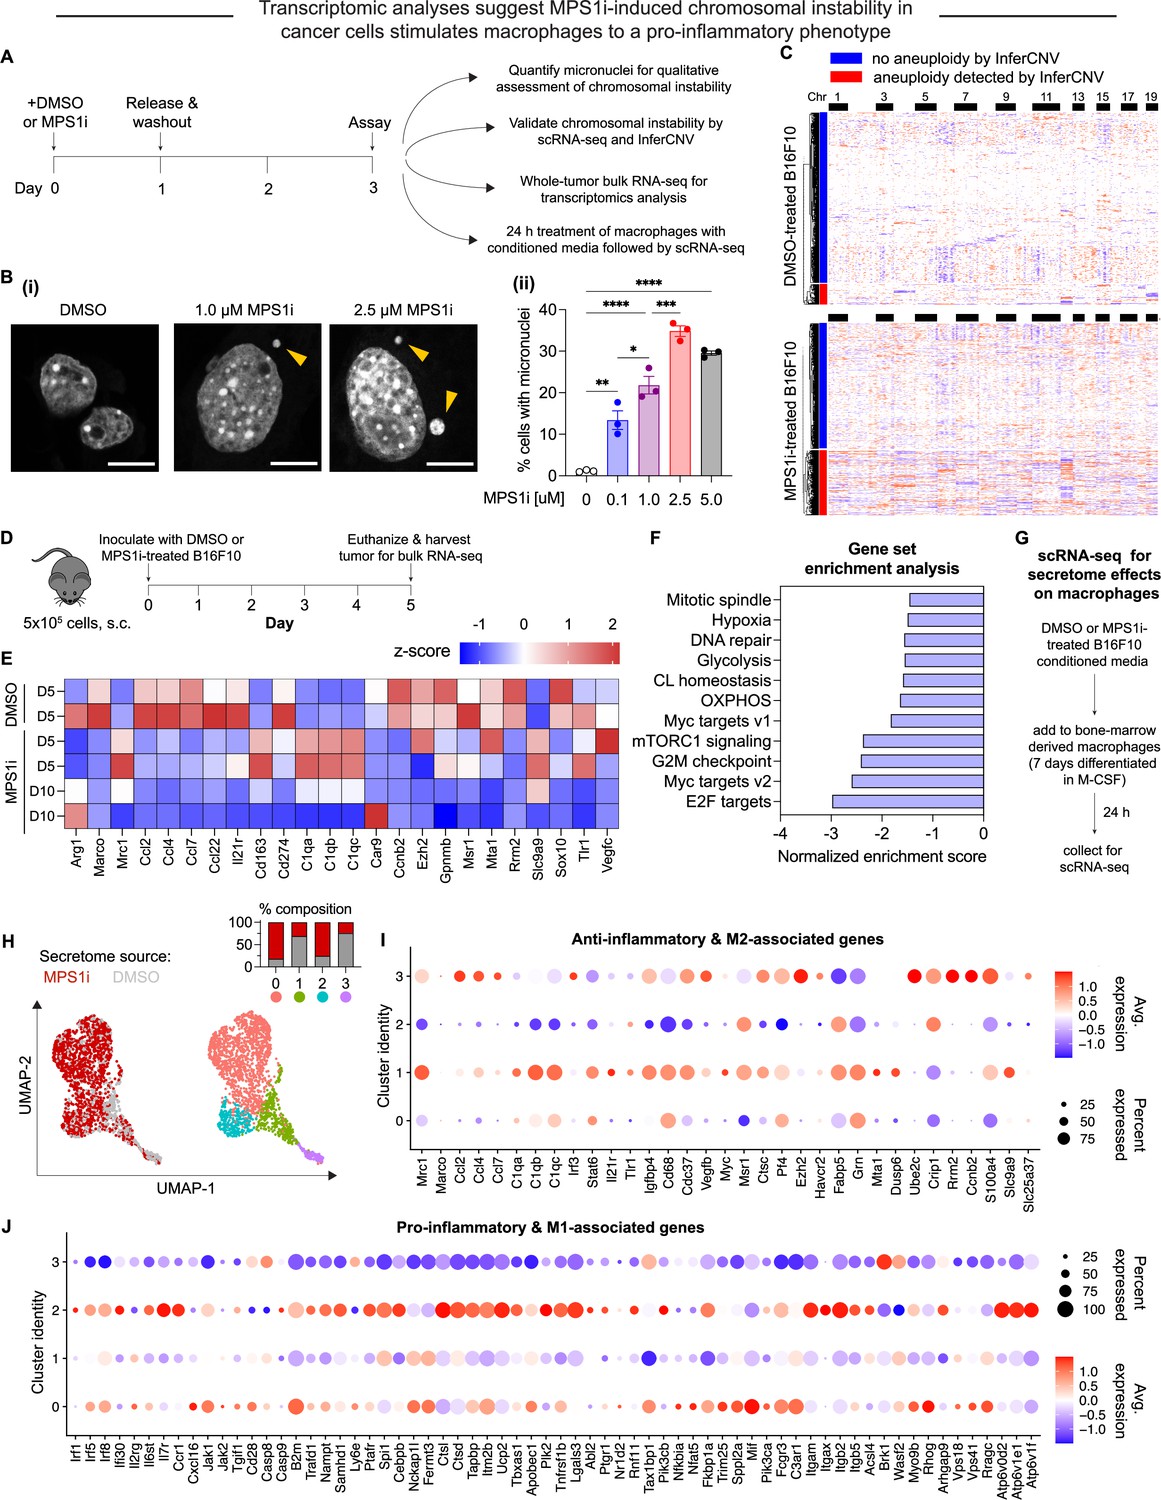
MPS1 kinase inhibition (MPS1i)-induced chromosomal instability generates microenvironment conditions that skew toward anti-cancer M1-like macrophages relative to a pro-cancer M2-like phenotype.
(A) Schematic for treatment of B16F10 mouse melanoma cells with MPS1 inhibitors (MPS1i), such as reversine, or the equivalent volume of DMSO vehicle control. After 24 hr, cells were washed twice with phosphate-buffered saline (PBS) and allowed to recover for an additional 48 hr. Follow-up experiments assessed chromosomal instability, aneuploidy, and effects on bone marrow-derived macrophages (BMDMs). (B) (i) Representative DNA images of B16F10 cells after treatment. Scale bars = 10 μm. Yellow arrowheads point at micronuclei, which signify chromosomal instability. (ii) Quantification of the percentage of cells with micronuclei across a range of different MPS1i concentrations (mean ± SEM shown, n = 3 replicates per condition). Statistical significance was calculated by ordinary one-way ANOVA and Tukey’s multiple comparison test (*p<0.05; **p<0.01; ***p<0.001; ****p<0.0001). (C) Inferred copy number in DMSO and MPS1i-treated B16F10 cells from single-cell RNA-sequencing and the InferCNV pipeline. Cells that are considered aneuploid (labeled as outliers in the InferCNV algorithm) show full-level chromosome gains and/or losses compared to the consensus copy number profile for most DMSO-treated cells. 34% of MPS1i-treated cells show aneuploidy, as determined by InferCNV, compared to 10% of DMSO-treated cells. (D) Schematic for whole-tumor bulk RNA-sequencing. Prior to tumor inoculation, CD47 knockout (KO) B16F10 cells were treated with 2.5 μM MPS1i (reversine) or the equivalent volume of DMSO vehicle control. Cells were treated for 24 hr, after which they were washed twice with PBS and allowed to recover for 48 hr. C57BL/6 mice were then subcutaneously injected with 5×10⁵ cells and euthanized 5 or 10 days later, with tumors excised and disaggregated for sequencing. (E) Heatmap of selected RNA transcripts related to M2 macrophage polarization and pro-tumor function that were differentially expressed in tumors of MPS1i-treated B16F10 compared to DMSO pre-treated cells. Heatmap shows log2-transformed transcript reads as z-score normalized. Overall, M2 markers are downregulated at day 5 and even further at day 10 compared to DMSO controls. Tumors analyzed: two comprised of DMSO-treated cells 5 days post-inoculation, two comprised of MPS1i-treated cells 5 days post-inoculation, and two comprised of MPS1i-treated cells 10 days post-inoculation. (F) Top downregulated hallmark gene sets in tumors comprised of MPS1i-treated B16F10 cells, show downregulated DNA repair, cell cycle, and growth pathways, consistent with observations of slowed growth in culture and in vivo – as subsequently quantified. Gene set enrichment analysis pathways were obtained from MSigDB. Abbreviations: CL homeostasis = cholesterol homeostasis; OXPHOS = oxidative phosphorylation. (G) Scheme for conditioned media (secretome) treatment of BMDMs and subsequent characterization by single-cell RNA-sequencing. Media from DMSO and MPS1i-treated B16F10 cells was collected and added 1:1 with fresh media to 7 day differentiated BMDMs (with 20 ng/mL macrophage colony-stimulating factor [M-CSF]). After 24 hr, BMDMs were processed for single-cell RNA-sequencing. (H) (Left) Uniform manifold approximation and projection (UMAP) plots of expression profiles for all analyzed BMDMs, treated with the secretome from DMSO-treated (gray) or MPS1i-treated (red) B16F10 cells. Each circle represents an individual cell. (Right) Same UMAP plots but colors now represent cells clustered together based on similarity of global gene expression. (Inset) Composition of each cluster. (I) Dot plot showing proportion of cells in each cluster expressing M2-like and anti-inflammatory genes (pro-cancer gene set). Right: Heatmap scale for average gene expression and dot size reference for proportion of cells in the cluster that express a gene. Clusters 1 and 3, both of which consist of ~75% of BMDMs treated with conditioned media from DMSO-treated B16F10, generally show downregulated transcript levels for genes associated with skewing macrophages to an M1-like and pro-inflammatory phenotype (anti-cancer). Cluster 3, in particular, shows significant downregulation, whereas clusters 0 and 2 that consist of 75% of BMDMs treated with conditioned media from MPS1i-treated B16F10 show upregulated expression of many anti-cancer genes, especially cluster 2. (J) Dot plot showing proportion of cells in each cluster expressing M1-like and pro-inflammatory polarization-associated genes (anti-cancer gene set overall). Right: Heatmap scale for average gene expression with dot size reference for the proportion of cells in a cluster expressing a gene. Clusters 1 and 3, both of which consist of ~75% of BMDMs treated with conditioned media from DMSO-treated B16F10, generally show upregulated transcript levels for genes associated with skewing macrophages to an M2-like, anti-inflammatory, pro-cancer phenotype. Clusters 0 and 2 consist of 75% of BMDMs treated with conditioned media from MPS1i-treated B16F10 and show little-to-no expression or else downregulation of many of these genes.
Figure 1—figure supplement 1
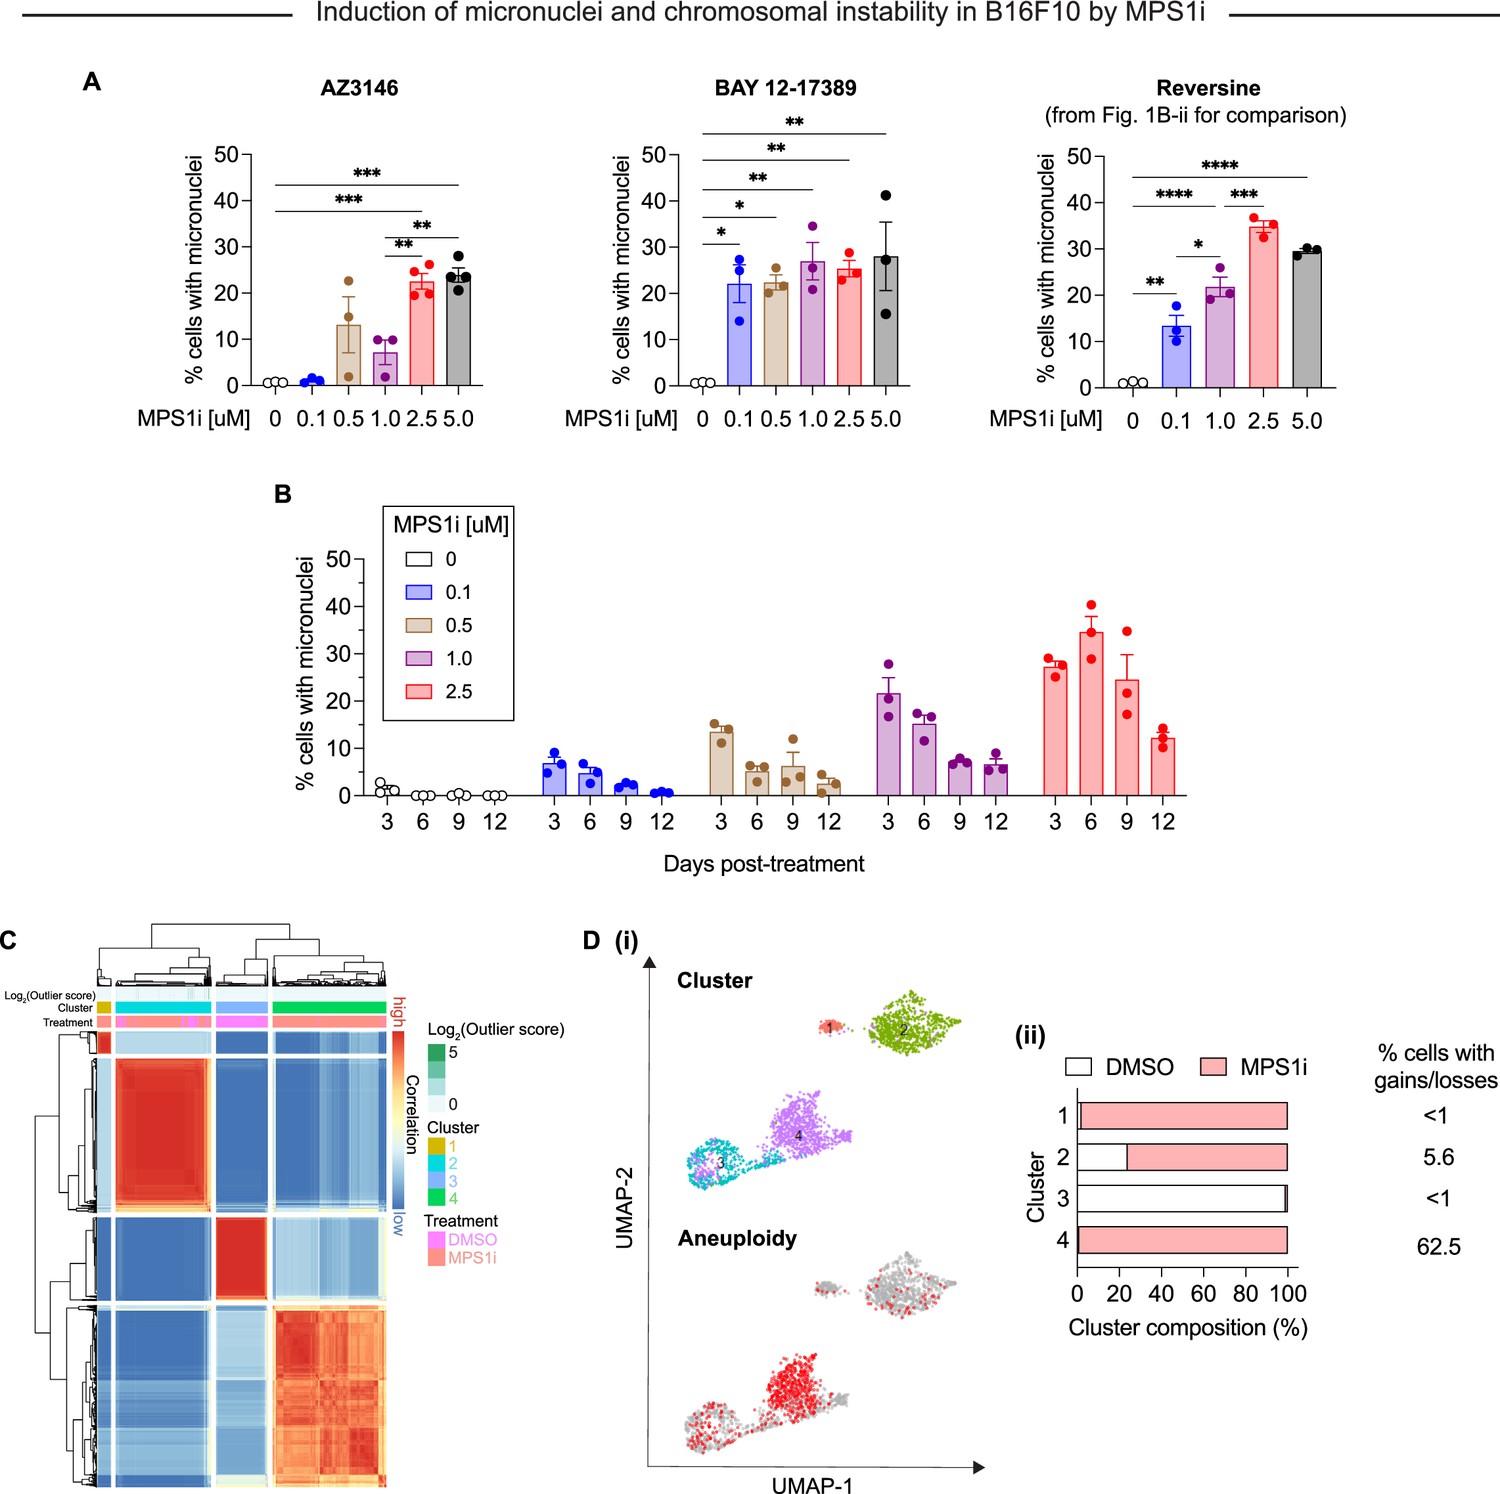
Characterization of MPS1 kinase inhibition (MPS1i)-induced genome and chromosomal instability in B16F10 mouse melanoma.
(A) Quantification of micronuclei induced by different MPS1 inhibitors (AZ3146, BAY 1217389, and reversine) at different concentrations. Statistical significance was calculated by ordinary one-way ANOVA and Tukey’s multiple comparison test (*p<0.05; **p<0.01; ***p<0.001; ****p<0.0001). (B) Quantification of micronuclei induced by MPS1i up to 12 days after initial exposure, showing MPS1i yields micronuclei-positive persistent populations while untreated cells lack micronuclei. (C) Consensus clustering of B16F10 analyzed in single-cell RNA-sequencing. B16F10 cells were treated with 2.5 μM MPS1i (reversine) or the equivalent volume of DMSO vehicle control. Cells were treated for 24 hr, after which they were washed twice with phosphate-buffered saline (PBS) and allowed to recover for an additional 48 hr. Cells were then collected and processed using 10x Genomics Chromium Single Cell Gene Expression kit for RNA isolation and library preparation. (D) (i) Uniform manifold approximation and projection (UMAP) plots of expression profiles for all B16F10 analyzed in single-cell RNA-sequencing. Top: UMAP plots depict clusters in which B16F10 fall, as determined by consensus clustering. Bottom: UMAP plots highlight cells with detectable copy number variations (CNVs), as determined by InferCNV. Red circles indicate individual cells with at least one CNV. Gray circles represent individual cells with no detectable CNV, suggesting these are chromosomally stable. (ii) Quantification of the composition (MPS1i-treated or DMSO-treated B16F10) of each cluster.
Figure 2 with 4 supplements
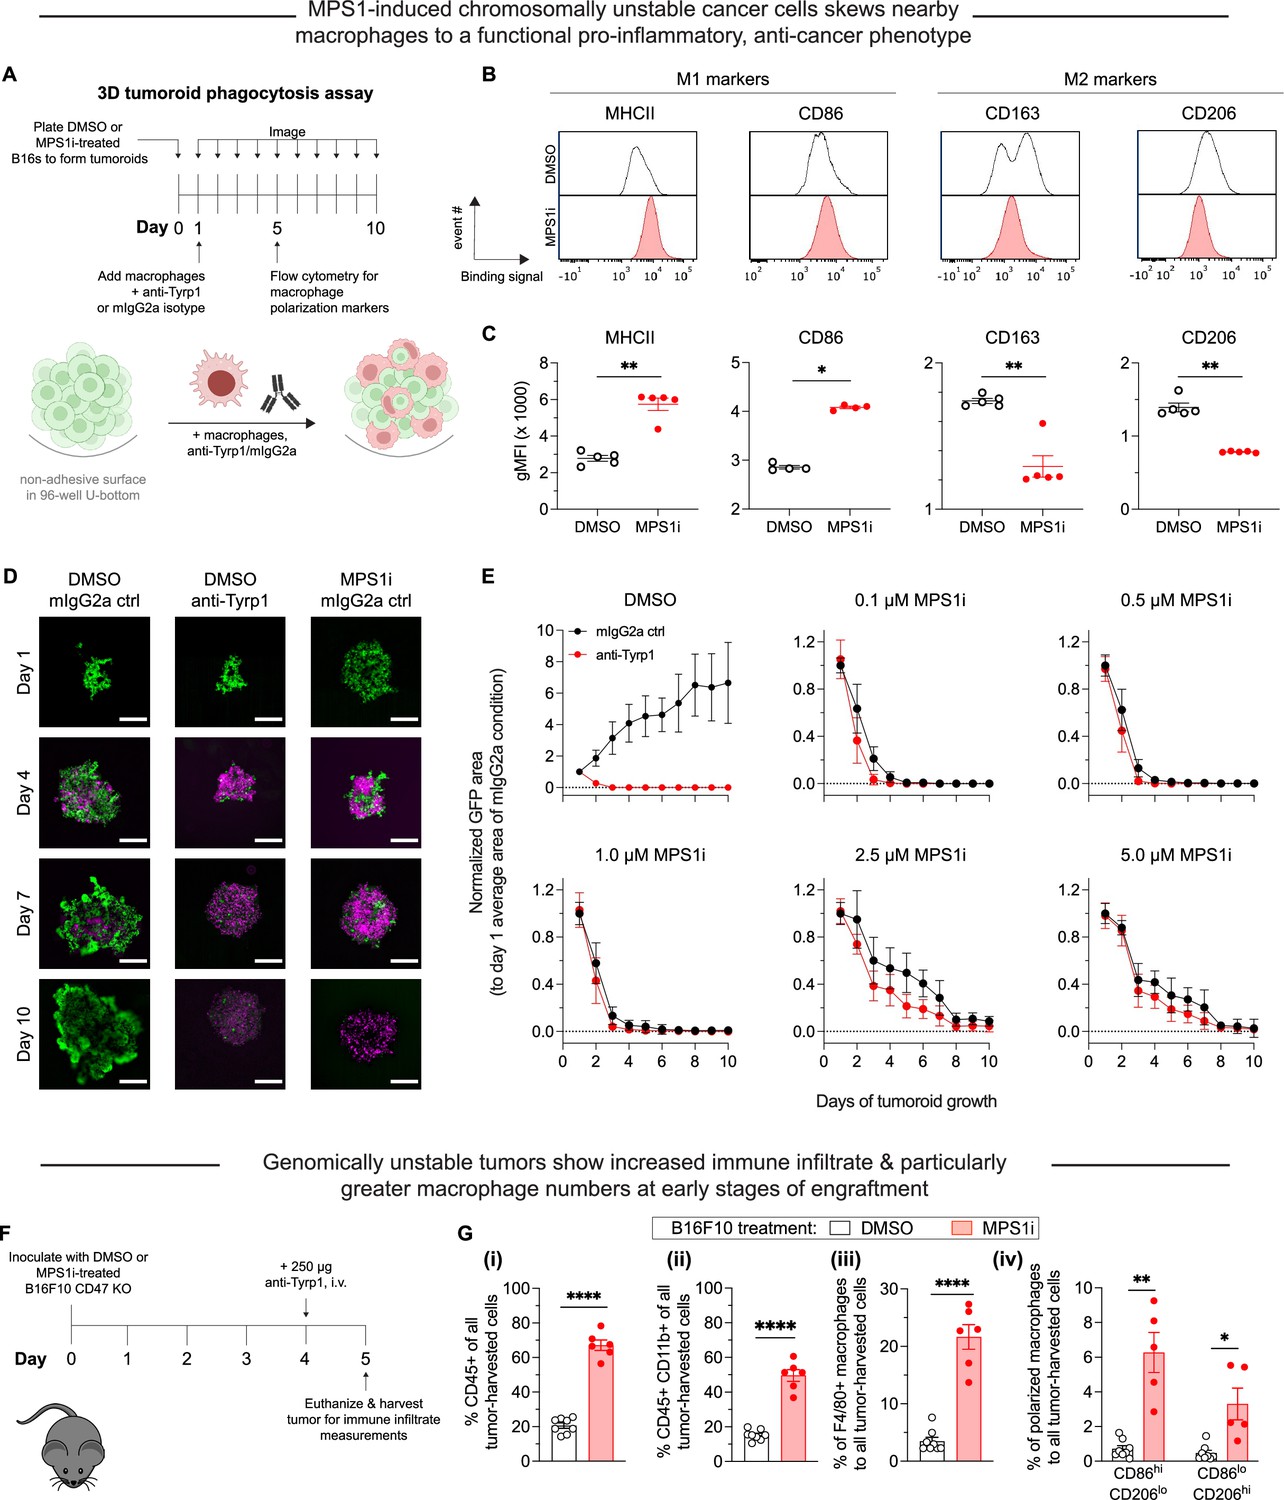
Chromosomally unstable tumoroids and tumors in early stages show increased anti-cancer macrophage polarization and activity.
(A) Schematic for ‘immuno-tumoroids’. Tumoroids are formed with B16F10 cells on non-adhesive, U-bottom-shaped wells and after pre-treating with either MPS1 kinase inhibition (MPS1i) (reversine) or DMSO. After ~24 hr, bone marrow-derived macrophages (BMDMs) with or without opsonizing anti-Tyrp1 are added to the tumoroids and imaged at the indicated timepoints. At day 5, immuno-tumoroids were collected, dissociated, and stained for macrophage polarization markers. (B) Representative flow cytometry measurements of macrophage polarization: MHCII and CD86 for M1-like (anti-tumor) markers, and CD163 and CD206 for M2-like (pro-tumor) markers. (C) Geometric mean fluorescence intensity of anti-tumor markers (MHCII and CD86) and pro-tumor markers (CD163 and CD206) on macrophages from immuno-tumoroid cultures of CD47 knockout (KO) B16F10 cells. Immuno-tumoroids of MPS1i-treated B16F10 CD47 KO cells show macrophages with M1-like, anti-tumor markers and reduced expression of M2-like, pro-tumoral markers. This suggests that chromosomal instability induced in cancer cells can in early stages prime a microenvironment conducive to anti-tumor macrophages, although it also reduces cancer cell proliferation. All data were collected from five independent immuno-tumoroid culture experiments (one 96-well per replicate). Statistical significance was calculated by an unpaired two-tailed t-test with Welch’s correction (**p<0.01). (D) Representative fluorescence images of growth or repression of B16F10 CD47 KO cells (green) in immuno-tumoroids from days 1 to 10. BMDMs, shown in magenta, were added at a 3:1 ratio to initial B16F10 numbers after the day 1 images were acquired. Scale bar = 0.5 mm. (E) Tumoroid growth was measured by calculating the GFP+ area at the indicated timepoints (mean ± SD, n=16 total tumoroids from two independent experiments for each condition). All data were then normalized to average GFP+ area on day 1 of each drug treatment’s respective mouse IgG2a isotype control condition. Overall, macrophages can clear MPS1i-treated B16F10 cells regardless of either MPS1i treatment concentration or IgG opsonization. (F) Timeline for immune cell infiltration analyses in tumors comprised of either MPS1i-treated or DMSO control CD47 KO B16F10 cells. Prior to tumor inoculation, cells were treated with 2.5 μM MPS1i (reversine) or the equivalent volume of DMSO vehicle control. After 24 hr, cells were washed twice with phosphate-buffered saline (PBS) and allowed to recover for an additional 48 hr. C57BL/6 mice were then subcutaneously injected with 2×10⁵ cells, and 96 hr later, mice were treated with 250 μg of anti-Tyrp1 or mouse IgG2a isotype. Mice were euthanized 24 hr later, and their tumors were excised and disaggregated for immune infiltrate analysis by flow cytometry. (G) Immune cell infiltrate measurements of B16F10 CD47 KO tumors comprised of MPS1i- or DMSO-treated cells. (i) Percentage of CD45+ (immune) cells in excised tumors shows tumors of MPS1i pre-treated cells with ~3-fold more immune cell infiltrate compared to DMSO controls. (ii) Percentage of tumor infiltrating myeloid cells in the excised tumors. CD47 KO B16F10 tumors of MPS1i pre-treated cells show ~2.5-fold more myeloid cells compared to DMSO controls. (iii) Tumor infiltrating F4/80+ macrophages (relative to total tumor cells) are ~6-fold higher for MPS1i pre-treated tumors compared to DMSO controls. (iv) M1-like macrophages (CD86hiCD206lo) and M2-like macrophages (CD86loCD206hi) relative to the total number of macrophages, showing that MPS1i pre-treated tumors have ~6-fold more CD86hiCD206lo compared to DMSO controls. MPS1i pre-treated tumors also show an increase in CD86loCD206hi macrophages, although CD86hiCD206lo macrophages were twice as high. Mean ± SEM shown (n=8 mice challenged with DMSO-treated B16F10 cells, n=5 mice challenged with MPS1i-treated B16F10 cells). Statistical significance was calculated by an unpaired two-tailed t-test with Welch’s correction (ns, not significant; **p<0.01; ****p<0.0001).
Figure 2—figure supplement 1
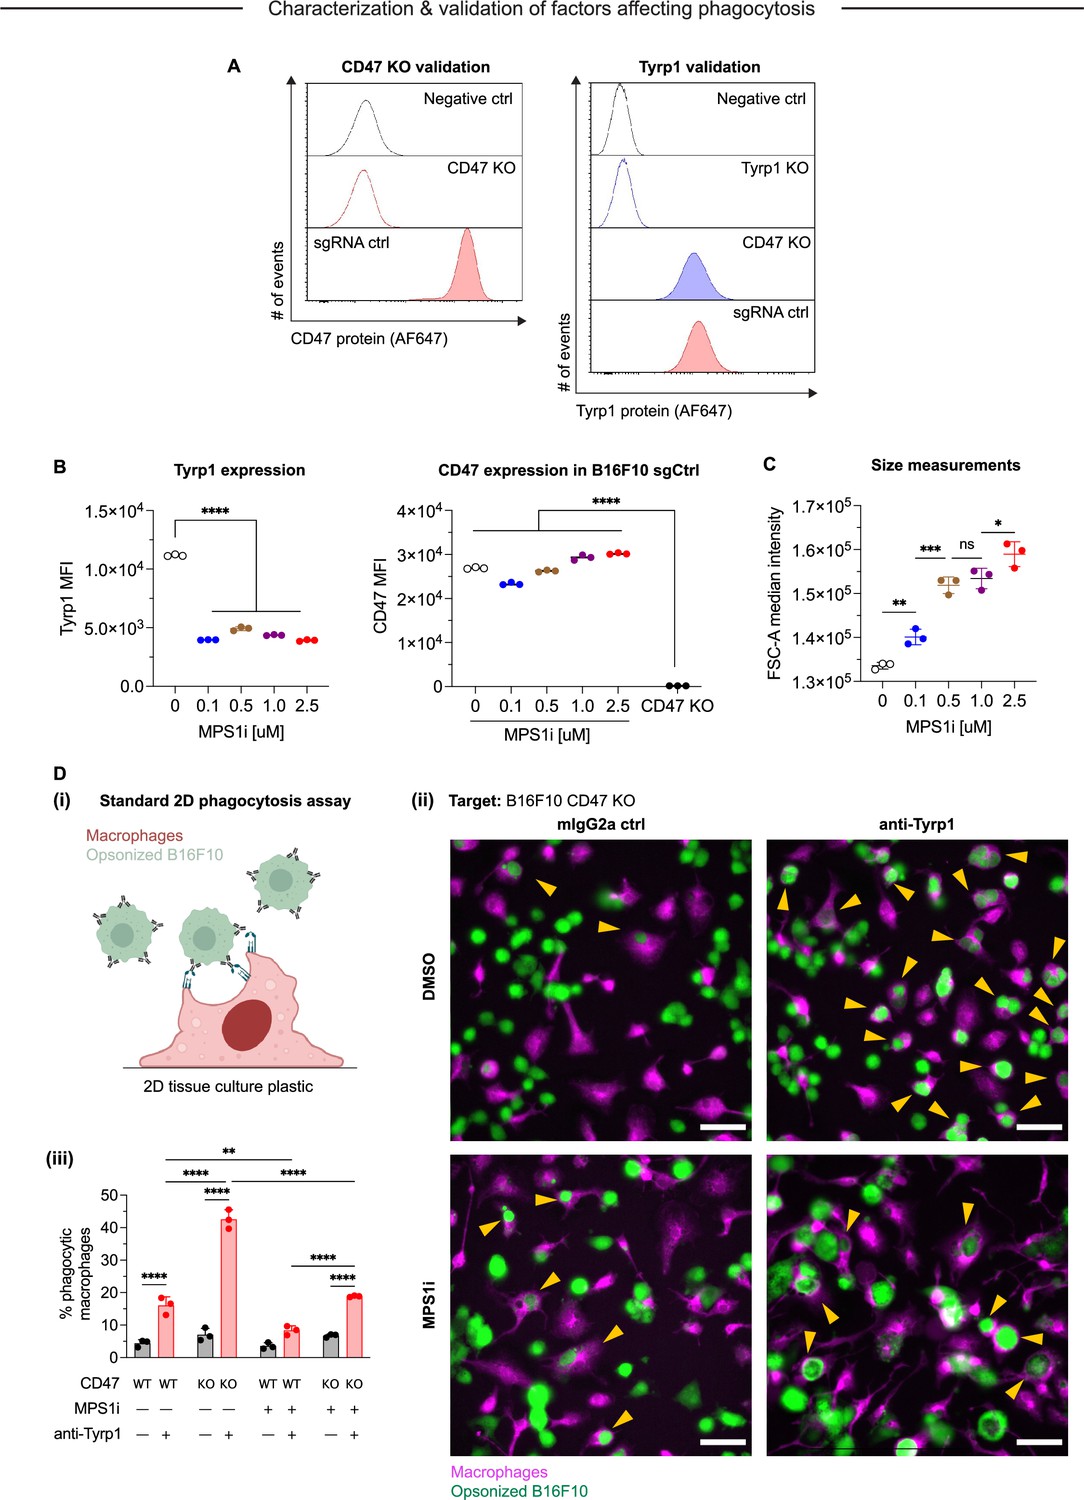
Characterization of MPS1 kinase inhibition (MPS1i)-induced genome and chromosomal instability in B16F10 mouse melanoma.
(A) Flow cytometry analysis of CD47 and Tyrp1 expression on B16F10 mouse melanoma cells. Representative histograms for anti-CD47 (left) and anti-Tyrp1 (right) binding to B16F10 CD47 knockout (KO) and sgRNA ctrl (wild-type CD47 expression). Binding was detected by using secondary antibodies conjugated with Alexa Fluor 647. (B) Quantification of Tyrp1 expression by flow cytometry in both MPS1i- and DMSO-treated cells. Statistical significance was calculated by three-way ANOVA and Tukey’s multiple comparison test. Mean ± SD shown, n = 3 replicates per condition (****p<0.0001). Quantification of CD47 expression by flow cytometry in both MPS1i- and DMSO-treated B16F10 sgCtrl cells. Statistical significance was calculated by three-way ANOVA and Tukey’s multiple comparison test. Mean ± SD shown, n = 3 replicates per condition (****p<0.0001). (C) Quantification of cell size measurements by flow cytometry in both MPS1i- and DMSO-treated cells. Statistical significance was calculated by three-way ANOVA and Tukey’s multiple comparison test. Mean ± SD shown, n = 3 replicates per condition (*p<0.05; **p<0.01; ***p<0.001). (D) Phagocytosis of B16F10 cells in a standard phagocytosis assay on two-dimensional tissue culture plastic, with or without the following: IgG opsonization by anti-Tyrp1, CD47 KO, and MPS1i-treatment of B16F10. B16F10 cells were treated with MPS1i or DMSO prior to this assay, following the same protocol described in Figure 1A. (i) Schematic of the 2D phagocytosis assay. (ii) Representative images of phagocytosis. B16F10 cells (green) were incubated with opsonizing anti-Tyrp1 or mouse IgG2a control and added to adherent bone marrow-derived macrophages (magenta). Random fields were imaged and then quantified to determine the percentage of phagocytic macrophages. Yellow arrowheads denote phagocytic events (complete engulfment of a target B16F10 cells). (iii) Quantification of phagocytic macrophages. Statistical significance was calculated by three-way ANOVA and Tukey’s multiple comparison test. Mean ± SD shown, n = 3 replicates per condition (**p<0.01; ****p<0.0001).
Figure 2—figure supplement 2
Macrophages readily clear chromosomal instability (CIN)-afflicted tumoroids but only if CIN is accompanied by proliferation deficits.
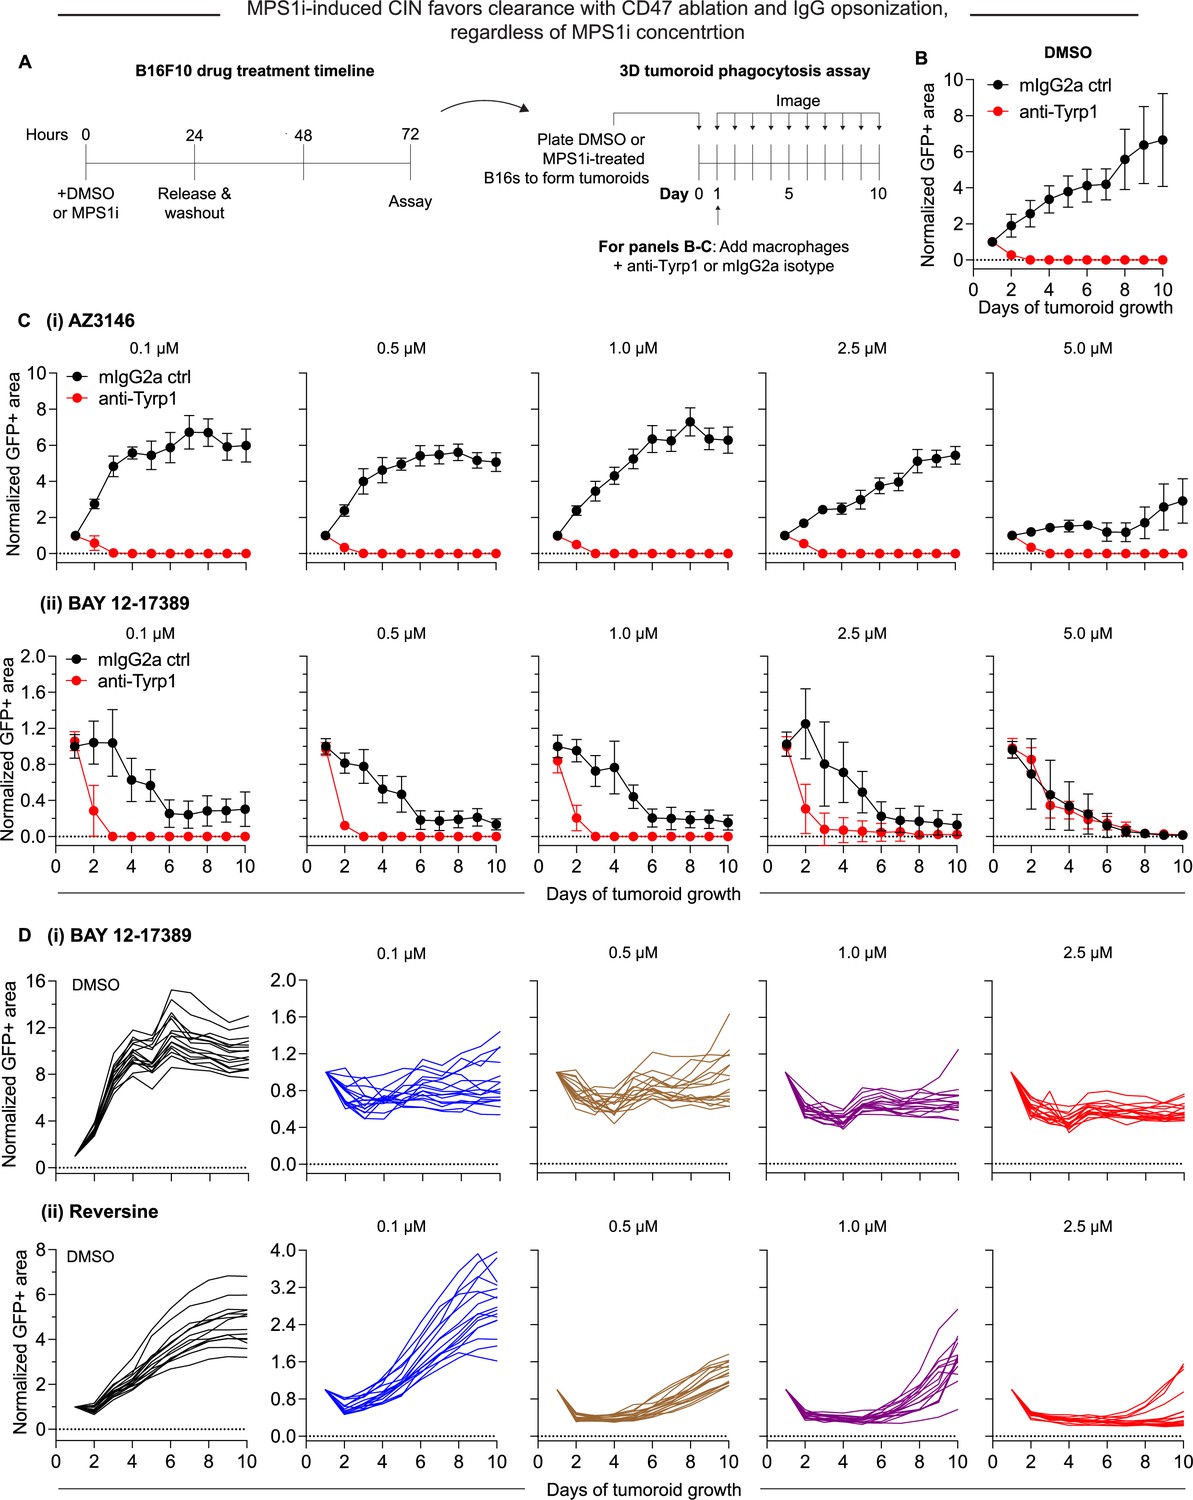
(A) Timeline and schematic for generating engineered ‘immuno-tumoroids’ for time-lapsed studies of macrophage-mediated phagocytosis of cancer cells. Tumoroids are formed by plating and culturing B16F10 cells on non-adhesive surfaces in U-bottom-shaped wells. Prior to plating for tumoroid formation, B16F10 were treated with either MPS1i or DMSO (AZ3146, BAY 12-17389, or reversine). Tumoroid growth was measured by calculating the GFP+ area at the indicated timepoints (mean ± SD, n = 16 total tumoroids from two independent experiments for each condition). All data were then normalized to average GFP+ area on day 1 of each drug treatment’s respective mouse IgG2a isotype control condition. Immuno-tumoroids are imaged at the listed timepoints. (B) To assess macrophage-mediated clearance, ~24 hr after plating, bone marrow-derived macrophages (BMDMs) with or without opsonizing anti-Tyrp1 are added to the cohesive B16F10 tumoroids. Tumoroid growth curves for DMSO-treated B16F10 CD47 knockout (KO) cells. (C) Tumoroid growth curves (with BMDMs) for MPS1i-treated B16F10 CD47 KO cells (treated with varying concentrations of MPS1i): (i) AZ3146, (ii) BAY 12-17389. (D) Tumoroid growth curves (without BMDMs) for MPS1i-treated B16F10 CD47 KO cells (treated with varying concentrations of MPS1i): (i) BAY 1217389, (ii) reversine. Both BAY 12-17389 and reversine induce proliferation deficits, which may play an essential role in mediating clearance by macrophages that could not be observed in AZ3146-treated cells.
Figure 2—figure supplement 3
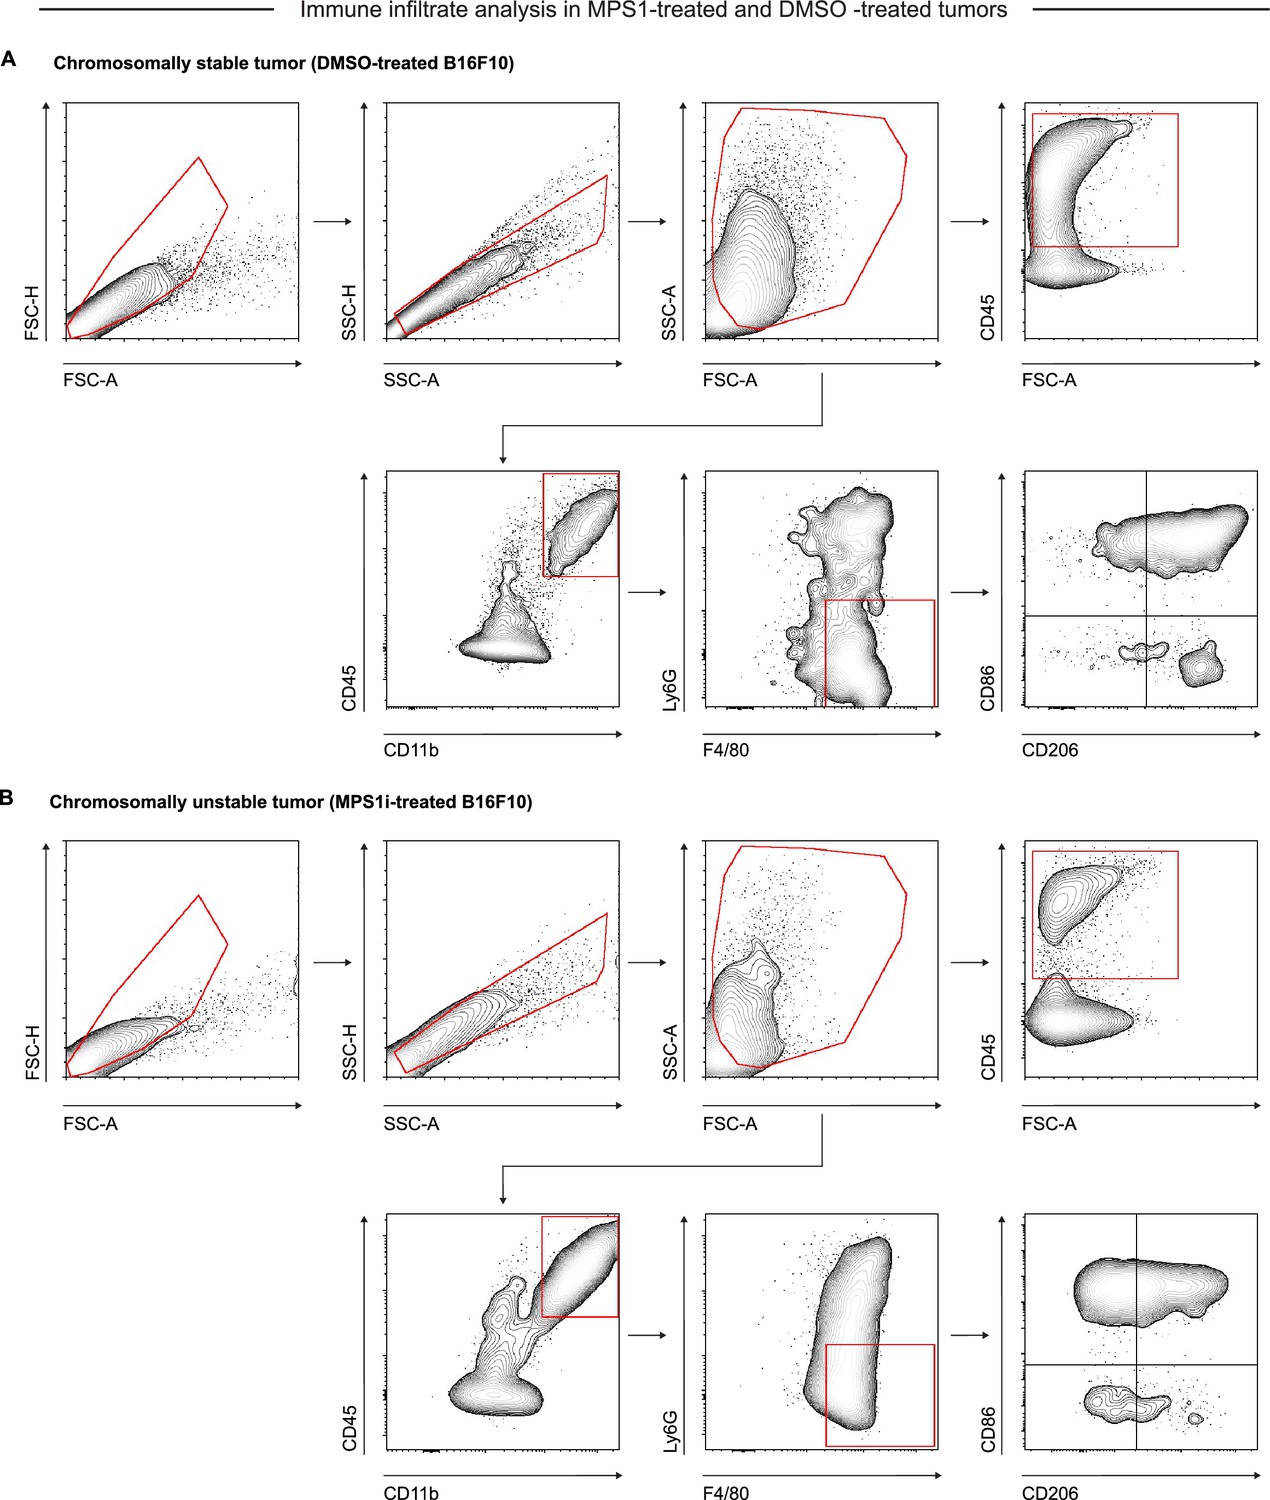
Flow cytometry gating strategy for identification and quantification of macrophage infiltrate and characterization in chromosomal instability (CIN)-afflicted and chromosomally stable B16F10 tumors.
Representative flow cytometry gating strategy for in vivo B16F10 CD47 knockout (KO) tumor immune infiltrate five days after initial challenge. Tumors were comprised of cells treated with either (A) DMSO or (B) MPS1 kinase inhibition (MPS1i) (2.5 μM), following the timeline schema in Figure 2F. Singlets were separated from debris, doublets, and aggregates by FSC-A vs FSC-H and SSC-A vs SSC-H gates. Debris and dead cells were further removed by FSC-A vs SSC-A gating. Overall immune cell infiltrate was determined by CD45+ expression. Macrophages were then further identified based on Ly6G- and F4/80+ expression. Upon identification of macrophages, cells were further characterized for polarization based on CD86 (M1-like marker) and CD206 (M2-like marker) expression.
Figure 2—figure supplement 4
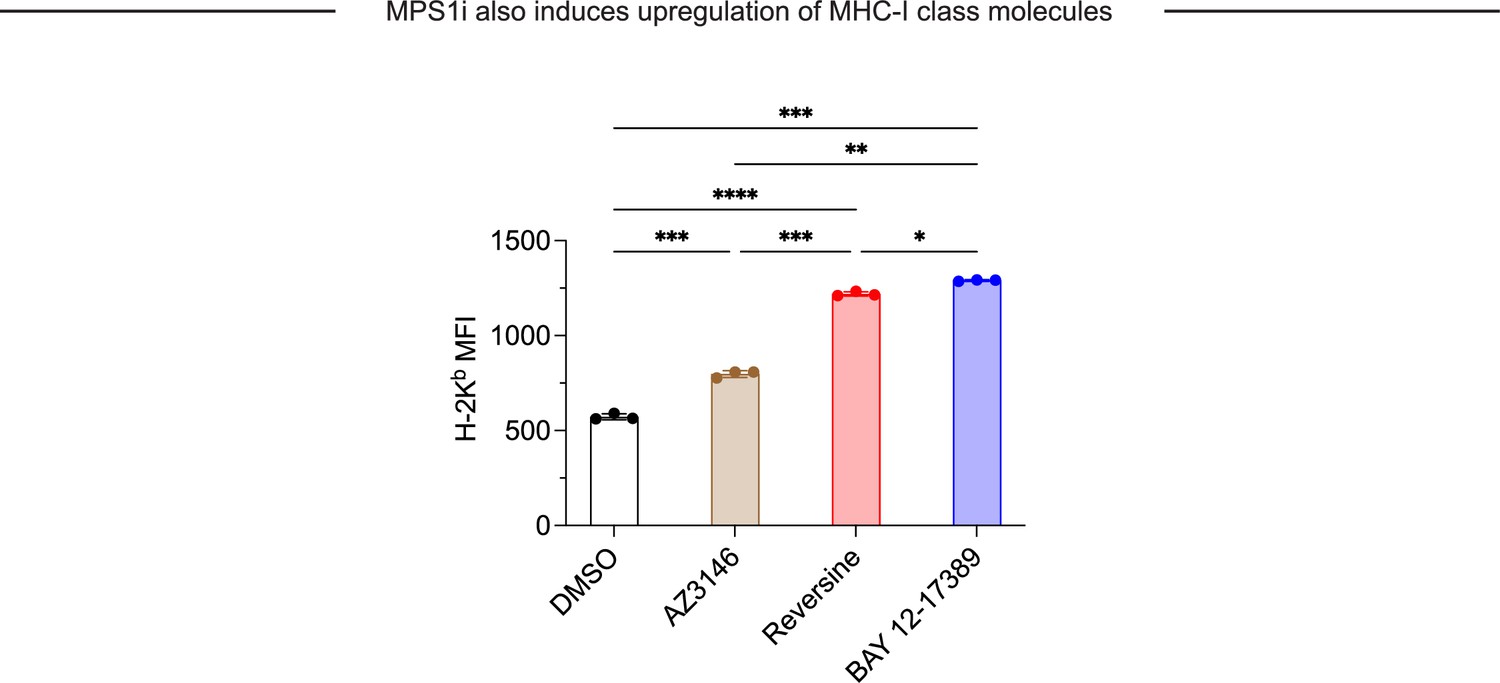
MPS1 kinase inhibition (MPS1i)-induced chromosomal instability upregulates MHC-1 class molecules on B16F10, suggesting increased antigen presentation.
Flow cytometry analysis and quantification of H-2Kb expression on B16F10 mouse melanoma cells. B16F10 cells were treated with MPS1i or the equivalent volume of DMSO vehicle control. Concentrations used: 2.5 μM AZ3146, 1.0 μM BAY 12-17380, and 2.5 μM reversine. Cells were treated for 24 hr, after which they were washed twice with phosphate-buffered saline (PBS) and allowed to recover for an additional 48 hr. Binding was detected by using primary antibodies conjugated with Alexa Fluor 647. Statistical significance was calculated by Brown-Forsythe and Welch ANOVA and Dunnett’s T3 multiple comparison test. Mean ± SEM shown, n = 3 independent replicates (*p<0.05; **p<0.01; ***p<0.001; ****p<0.0001).
Figure 3 with 1 supplement
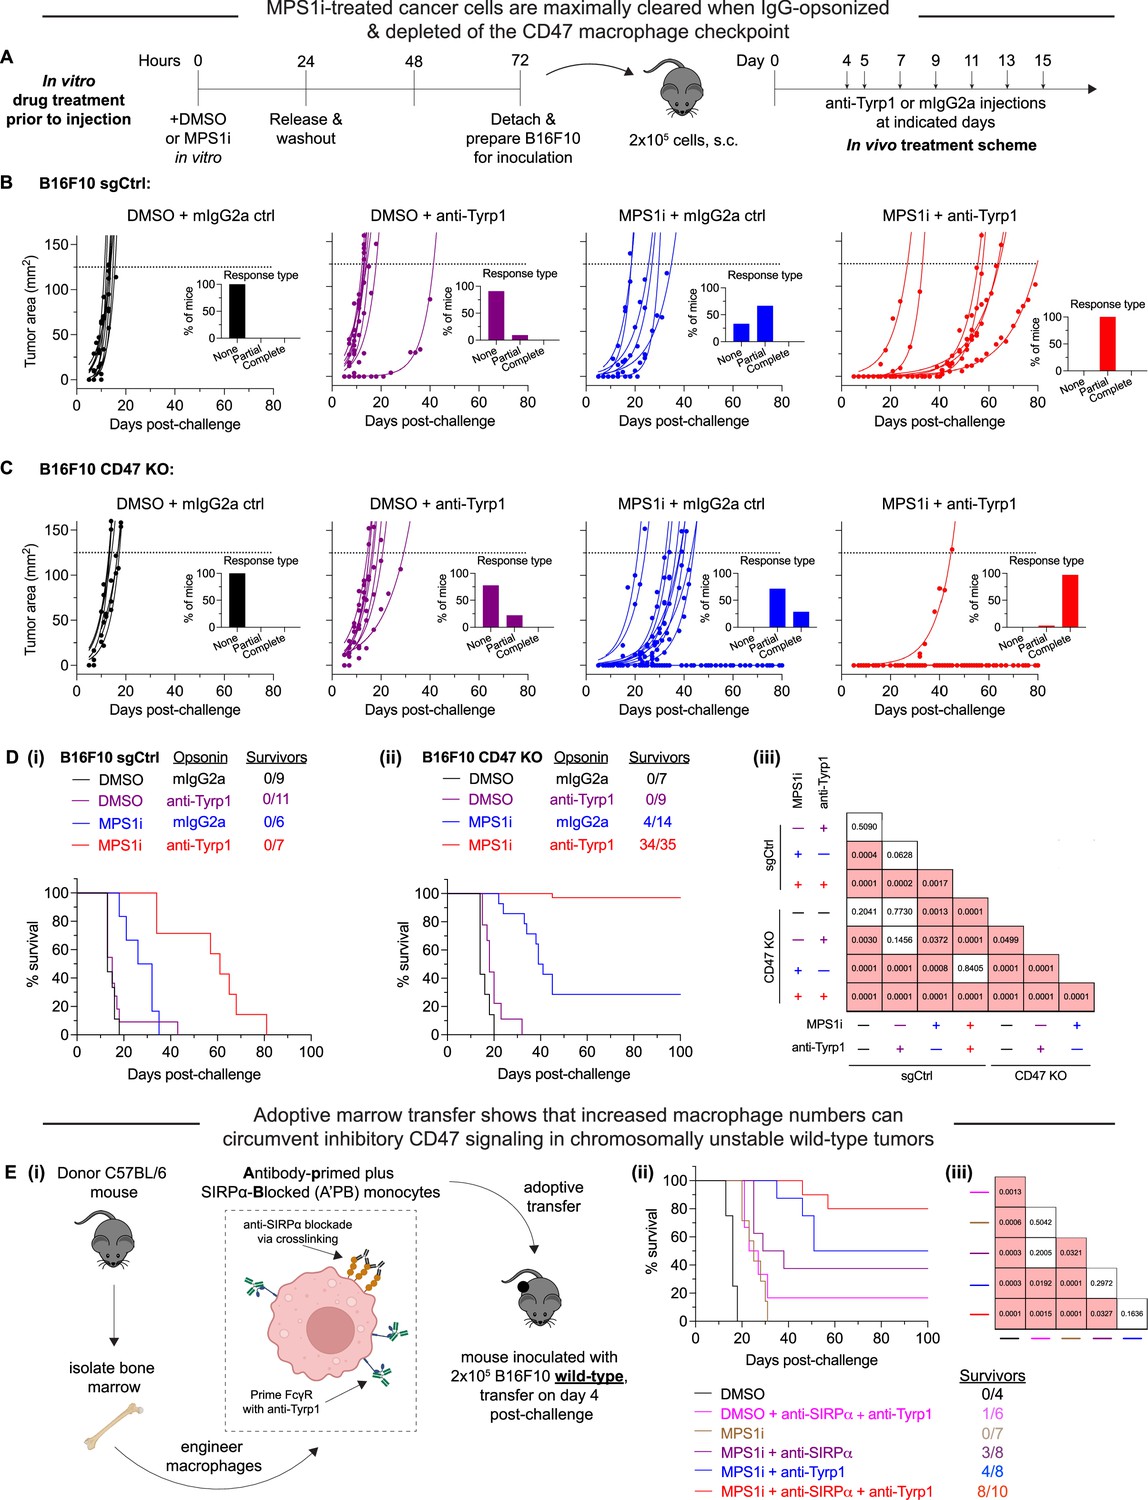
MPS1 kinase inhibition (MPS1i)-induced chromosomally unstable cancer cells are maximally cleared when IgG-opsonized and depleted of the CD47 macrophage checkpoint.
(A) Timeline for in vitro treatment of B16F10 cells prior to injection in mice and then subsequent therapeutic treatment for tumor-challenged mice. Prior to tumor inoculation, B16F10 CD47 knockout (KO) cells were treated with 2.5 μM MPS1i (reversine) or the equivalent volume of DMSO vehicle control. Cells were treated for 24 hr, after which they were washed twice with phosphate-buffered saline (PBS) and allowed to recover for an additional 48 hr. After the recovery period elapsed, all mice were subcutaneously injected with 2×10⁵ B16F10 cells. For anti-Tyrp1 and mouse IgG2a isotype control treatments, mice were treated intravenously or intraperitoneally with 250 μg with antibody on days 4, 5, 7, 9, 11, 13, and 15 after tumor challenge. (B) Tumor growth curve of projected tumor area versus days after tumor challenge, with B16F10 sgCtrl cells (expressing wild-type [WT] levels of CD47). Each line represents a separate tumor and is fit with an exponential growth equation: A = A0ekt. Experimental conditions are as follows: n = 9 mice that were challenged with DMSO-treated B16F10 sgCtrl and subsequently treated with mouse IgG2a control, n = 11 mice that were challenged with DMSO-treated B16F10 sgCtrl and subsequently treated with anti-Tyrp1, n = 6 mice that were challenged with MPS1i-treated B16F10 sgCtrl and subsequently treated with mouse IgG2a control, and n = 7 mice that were challenged with MPS1i-treated B16F10 sgCtrl and subsequently treated with anti-Tyrp1. All data were collected across three independent experiments. Inset bar graphs depict response type for each indicated tumor challenge. A partial response was defined as a mouse that survived at least 1 week (20+ days) beyond the median survival of the B16F10 sgCtrl cohort treated with mouse IgG2a isotype control (13 days). (C) Tumor growth curve of projected tumor area versus days after tumor challenge, with B16F10 CD47 KO cells. Each line represents a separate tumor and is fit with an exponential growth equation: A = A0ekt. Complete anti-tumor responses in which a tumor never grew are depicted with the same symbol as their growing counterparts and with solid lines at A = 0. Experimental conditions are as follows: n = 7 mice that were challenged with DMSO-treated B16F10 CD47 KO and subsequently treated with mouse IgG2a control, n = 9 mice that were challenged with DMSO-treated B16F10 CD47 KO and subsequently treated with anti-Tyrp1, n = 14 mice that were challenged with MPS1i-treated B16F10 CD47 KO and subsequently treated with mouse IgG2a control, and n = 35 mice that were challenged with MPS1i-treated B16F10 CD47 KO and subsequently treated with anti-Tyrp1. All data in which mice were challenged with DMSO-treated cells were collected from three independent experiments. Data for the condition in which mice were challenged with MPS1i-challenged cells and then given mouse IgG2a control were collected from four independent experiments. Data for the final condition in which mice were injected with MPS1i-treated cells and then treated with anti-Tyrp1 was collected from seven independent experiments. Inset bar graphs depict response type for each indicated tumor challenge. A partial response was defined as a mouse that survived at least 1 week (20+ days) beyond the median survival of the B16F10 sgCtrl cohort treated with mouse IgG2a isotype control (13 days). (D) Survival curves of mice up to 100 days after the tumor challenges in (B) and (C). (i) Survival curves for mice challenged with B16F10 sgCtrl. (ii) Survival curves for mice challenged with B16F10 CD47 KO. (iii) Triangular matrix depicting p-values between the different tested in vivo conditions. Statistical significance was determined by the Log-rank (Mantel-Cox) test. (E) (i) Schematic depicting the different engineering anti-tumor macrophage strategies that can be used for validating macrophages’ role in clearing chromosomal instability (CIN)-afflicted B16F10 cells. Fresh bone marrow was isolated from the tibia of donor C57BL/6 mice and was then incubated with anti-SIRPα clone P84 (18 μg/mL) or anti-Tyrp1 (1 μg/mL) only, both together added subsequently, or neither. Donor marrow (2×10⁷ cells) is then injected intravenously into C57BL/6 harboring B16F10 WT tumors on day 4 post-challenge. Additional anti-Tyrp1 injections, when necessary, are done on days 5, 7, 9, 11, 13, and 15 post-tumor challenge. (ii) Survival curves of mice up to 100 days after the B16F10 WT tumor challenge. All mice were initially challenged with 2×10⁵ B16F10 WT cells. (iii) Triangular matrix depicting p-values between the different tested in vivo conditions. Statistical significance was determined by the Log-rank (Mantel-Cox) test.
Figure 3—figure supplement 1
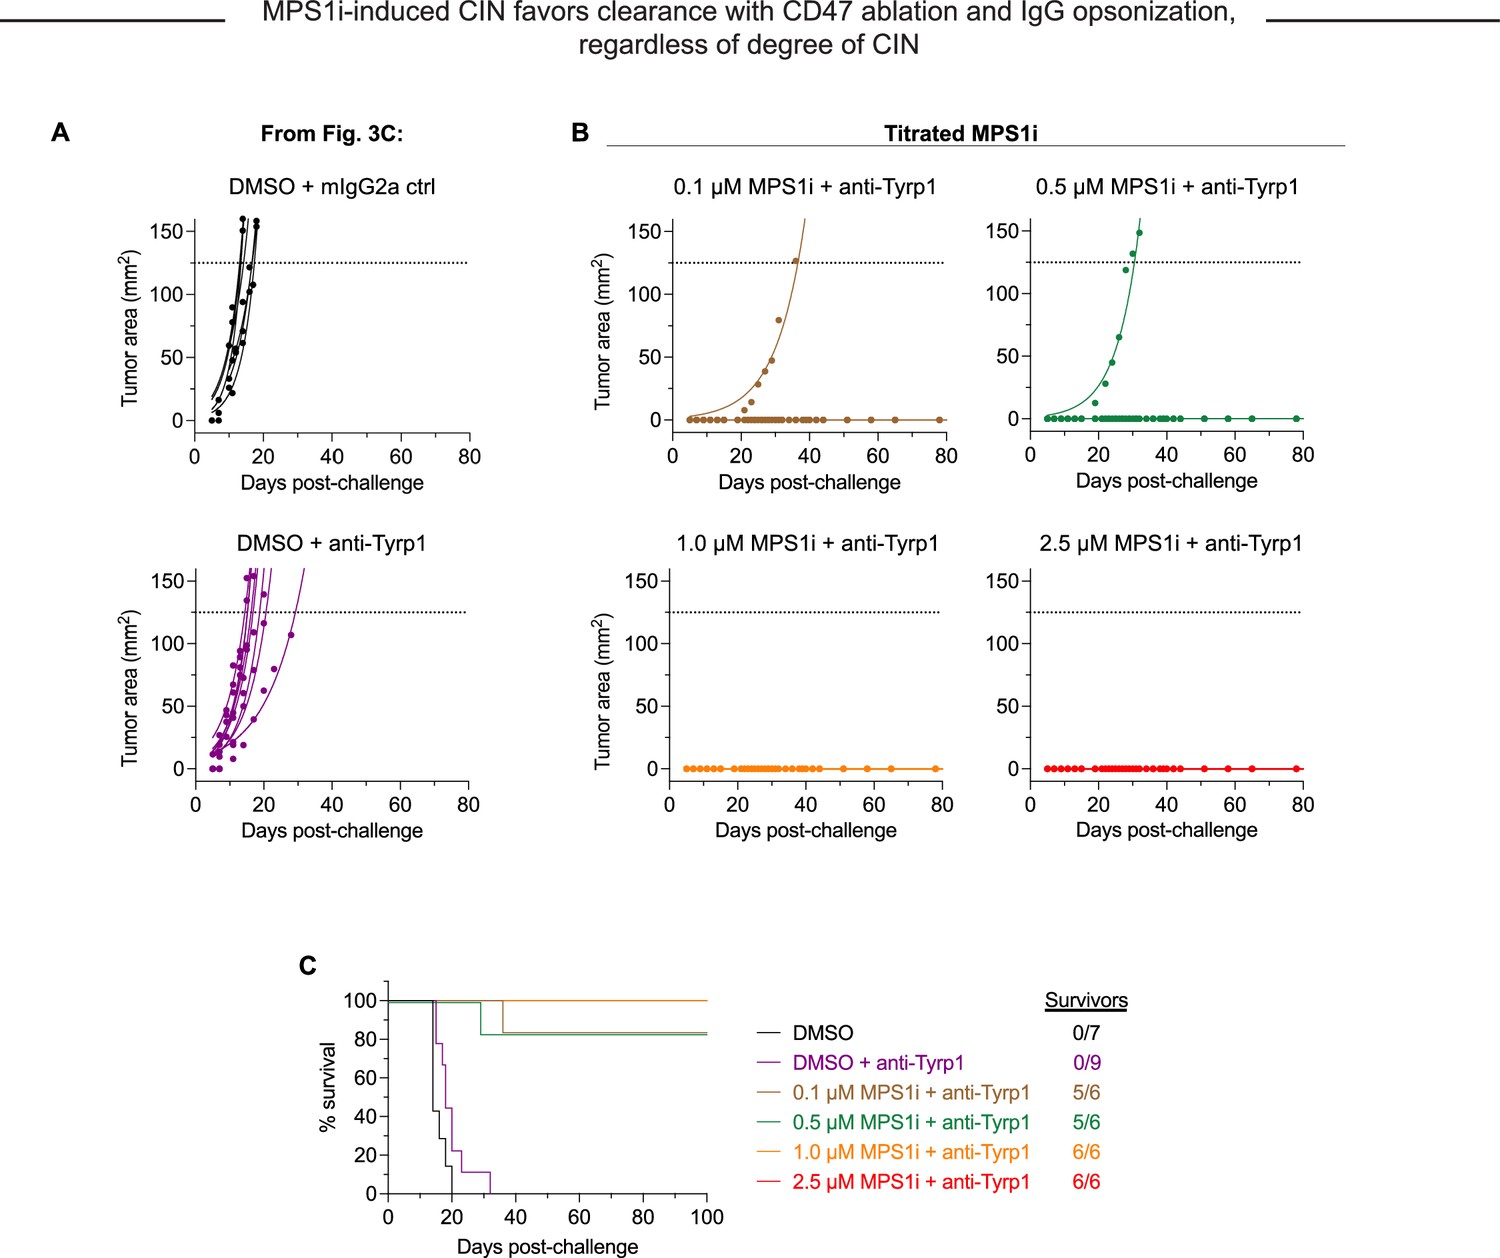
MPS1 kinase inhibition (MPS1i)-induced chromosomal instability (CIN) favors clearance when paired with CD47 knockout (KO) and IgG opsonization, regardless of the degree of CIN.
Tumor growth curve of projected tumor area versus days after tumor challenge, with B16F10 CD47 KO cells. Each line represents a separate tumor and is fit with an exponential growth equation: A = A0ekt. Complete anti-tumor responses in which a tumor never grew are depicted with the same symbol as their growing counterparts and with solid lines at A = 0. (A) Tumor growth curve data in which there was no complete response, from Figure 3C. n = 7 mice that were challenged with DMSO-treated B16F10 CD47 KO and subsequently treated with mouse IgG2a control, n = 9 mice that were challenged with DMSO-treated B16F10 CD47 KO and subsequently treated with anti-Tyrp1. (B) Tumor growth curve data from mice challenged with CIN-afflicted B16F10, but with varying concentration of MPS1i used to cause different degrees of instability. All mice here were challenged with B16F10 CD47 KO and treated with anti-Tyrp1 for conditions of maximal phagocytosis and to better compare to the ~97% cure rate in Figures 3C and 4D – ii. n = 6 mice challenged with cells with each tested MPS1i concentration: 0.1, 0.5, 1.0, or 2.5 μM. (C) Survival curves of mice up to 100 days after the tumor challenges in (A) and (B).
Figure 4 with 3 supplements
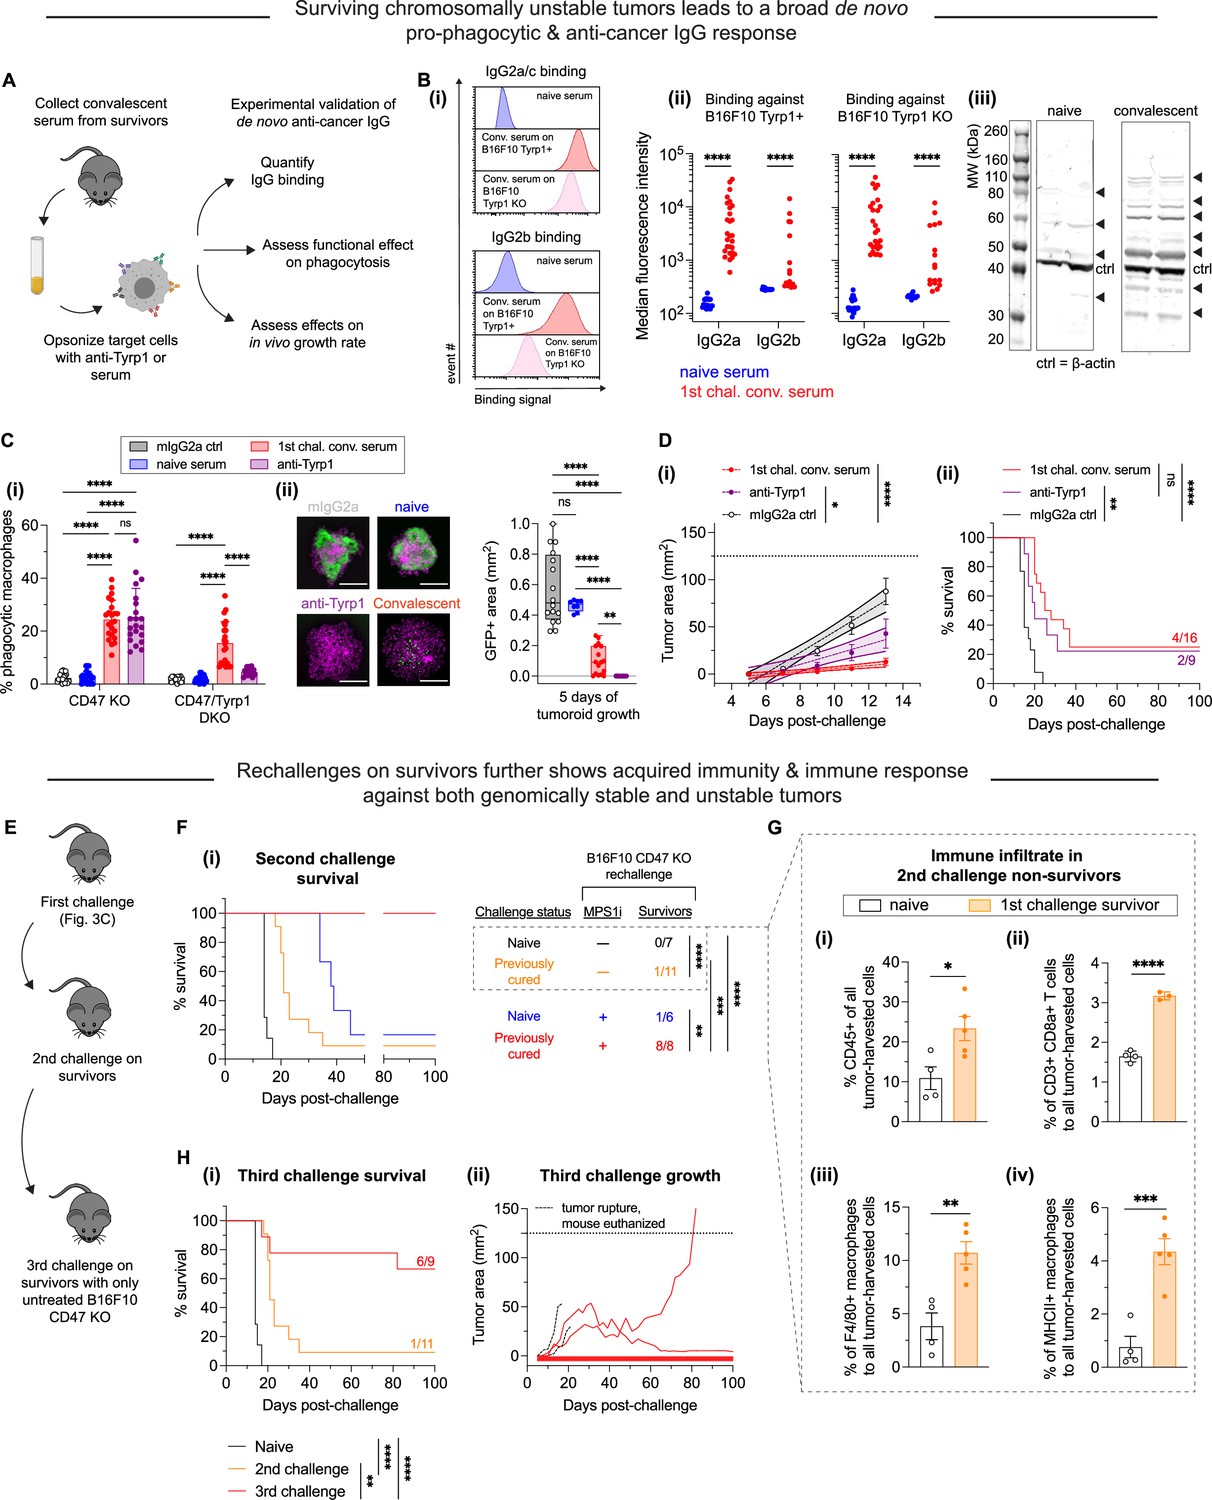
MPS1 kinase inhibition (MPS1i)-induced chromosomal instability favors induction of pro-phagocytic de novo IgG and can lead to durable acquired immunity.
(A) Schematic for sera collection from surviving mice from Figure 3C and D and follow-up experiments to characterize any de novo anti-cancer IgG antibodies and their functionality in vitro and in vivo. Serum from all mice was collected at least 100 days after initial tumor challenge. (B) (i) Representative flow cytometry histograms showing convalescent sera from survivors in Figure 3C and D contain IgG2a/c (top) and IgG2b (bottom) that bind both wild-type (WT) and Tyrp1 knockout (KO) B16F10 cells. (ii) Median fluorescence intensity quantification of IgG2a/c and IgG2b binding from sera of surviving mice, showing a significant increase in both. Binding to Tyrp1 KO cells indicates recognition of other antigens. Statistical significance was calculated by an unpaired two-sample Kolmogorov-Smirnov test (****p<0.0001). For IgG2a/c quantification: for binding against Tyrp1+ cells, n = 23 distinct naïve serum samples and n = 28 distinct convalescent serum samples from surviving mice; for binding against Tyrp1 KO cells, n = 23 distinct naïve serum samples and n = 27 distinct convalescent serum samples. For IgG2b quantification: for binding against Tyrp1+ cells, n = 14 distinct naïve serum samples and n = 16 distinct convalescent serum samples from surviving mice; for binding against Tyrp1 KO cells, n = 13 distinct naïve serum samples and n = 17 distinct convalescent serum samples. (iii) Western blot of B16F10 lysate with either naïve sera or first challenge survivor sera as primary probe followed by anti-mouse IgG [H+L] secondary staining. Numerous bands appear when immunoblotting with convalescent survivor sera compared to naïve sera, confirming multiple neo-antigens and suggesting acquired immunity beyond Tyrp1. (C) (i) Phagocytosis of serum-opsonized CD47 KO or CD47/Tyrp1 double KO B16F10 cells by bone marrow-derived macrophages (BMDMs) on 2D tissue culture plastic. Additionally, B16F10 cells opsonized with either anti-Tyrp1 or mouse IgG2a were included as controls for comparisons. Serum IgG derived from survivors has both opsonization and pro-phagocytic functional ability against B16F10. Furthermore, convalescent sera IgG from survivors is still able to drive engulfment of Tyrp1 KO cells, further suggesting targeting of antigens beyond Tyrp1. Statistical significance was calculated by two-way ANOVA and Tukey’s multiple comparison test (mean ± SD, n = 21–23 distinct sera samples collected from survivors for B16F10 CD47 KO phagocytosis per condition and n = 14–23 for B16F10 CD47/Tyrp1 double KO phagocytosis per condition). (ii) Convalescent sera from first challenge survivors can repress growth of B16F10 CD47 KO immuno-tumoroids (with macrophages). Tumoroid growth was measured by calculating the GFP+ area at the indicated timepoints (mean ± SD, n=16 total tumoroids from two independent experiments for each condition, except n=8 for opsonization with sera from naïve mice). Statistical significance was calculated by Brown-Forsythe and Welch ANOVA tests with Dunnett’s T3 corrections for multiple comparisons (ns, not significant; **p<0.01; ****p<0.0001). Scale bars = 0.5 mm. (D) B16F10 CD47 KO cells were pre-opsonized with either convalescent sera from first challenge survivors, anti-Tyrp1 or mouse IgG2a isotype control. All mice were subcutaneously injected with 2×10⁵ pre-opsonized B16F10 CD47 KO cells. (i) Tumor growth at early timepoints where growth is still linear shows suppression of tumors comprised of B16F10 CD47 KO cells pre-opsonized with convalescent sera and anti-Tyrp1, compared to mouse IgG2a isotype controls. Mean ± SEM for all timepoints, with n=16 mice with tumors pre-opsonized with convalescent sera (each from a distinct survivor), n=9 mice with tumors pre-opsonized with anti-Tyrp1, and n=14 mice with tumors pre-opsonized with mouse IgG2a isotype control. Statistical significance was calculated by ordinary one-way ANOVA and Tukey’s multiple comparison test at days 9, 11, and 13 (*p<0.05; ****p<0.0001). Significance represented in plot legend is representative of all three timepoints. (ii) Survival curves up to 100 days of mice from (D – i) with pre-opsonized tumors. Both convalescent sera and anti-Tyrp1 provide similar survival benefits, suggesting potent de novo IgG opsonization and anti-cancer function. Statistical significance was determined by the Log-rank (Mantel-Cox) test (ns, not significant; **p<0.01; ****p<0.0001). (E) Schematic of tumor challenges to assess acquired immunity. Survivors from the first challenge (Figure 3C and D) were again challenged with either MPS1i-treated or DMSO B16F10 CD47 KO cells. Survivors from this second tumor challenge were once again challenged, this time with untreated B16F10 CD47 KO. (F) Survival curves of survivors from Figure 3C and D for a second tumor challenge experiment. B16F10 CD47 KO cells were pre-treated for 24 hr with 2.5 μM MPS1i (reversine) or the equivalent volume of DMSO vehicle control. Cells were then washed twice with phosphate-buffered saline (PBS) and allowed to recover for 48 hr. Mice were then subcutaneously injected with 2×10⁵ B16F10 CD47 KO cells. n=7 age-matched naïve mice (never tumor-challenged) injected with DMSO-treated B16F10 CD47 KO cells, n=11 surviving mice (from Figure 3C and D) injected DMSO-treated B16F10 CD47 KO cells, n=6 age-matched naïve mice injected with MPS1i-treated B16F10 CD47 KO cells, and n=8 surviving mice (from Figure 3C and D) injected with MPS1i-treated B16F10 CD47 KO cells. Previous survivors challenged with DMSO-treated B16F10 CD47 KO cells show increased median survival (21 days) compared to their naïve counterpart (14 days). All previous survivors that were again challenged with MPS1i-treated B16F10 CD47 KO cells survive. All mice challenged were from three independent experiments. Statistical significance was determined by the Log-rank (Mantel-Cox) test (**p<0.01; ***p<0.001; ****p<0.0001). (G) Non-survivors from the second tumor challenge in (F) were euthanized after tumor size was >150 mm2, and their tumors were excised and disaggregated for immune infiltrate analysis by flow cytometry. (i) Quantification of CD45+ (immune) cells in the excised tumors shows first challenge survivors with ~2.5-fold increased tumor immune cell infiltrate despite terminal burden. n = 4 mice for age-matched naïve control, n = 5 mice that survived the first tumor challenge. (ii) Quantification of tumor infiltrating CD8a+ cytotoxic T cell relative to the total number of tumor cells. First challenge survivors show ~2-fold increase in CD8a+ T cells. n = 4 mice for age-matched naïve control, n = 3 mice that survived the first tumor challenge. (iii) Quantification of tumor infiltrating F4/80+ macrophages relative to the total number of tumor cells. First challenge survivors show ~3-fold increase in macrophages. n = 4 mice for age-matched naïve control, n = 5 mice that survived the first tumor challenge. (iv) Quantification of MHCII+ tumor infiltrating F4/80+ macrophages relative to the total number of F4/80 macrophages. First challenge survivors show ~3-fold increase in MHCII+ macrophages. n = 4 mice for age-matched naïve control, n = 5 mice that survived the first tumor challenge. For all experiments, mean ± SEM shown, and statistical significance was calculated by an unpaired two-tailed t-test with Welch’s correction (*p<0.05; **p<0.01; ***p<0.001; ****p<0.0001). (H) (i) Third tumor challenge survival curves of long-term survivors from (G). All mice were challenged with 2×10⁵ B16F10 CD47 KO cells (n = 9 mice from three independent experiments), delivered subcutaneously. For benchmarking and statistical comparison, survival curves from Figure 3F for naïve mice (n = 7 mice from three independent experiments) and second challenge (n = 11 mice from three independent experiments) are included. Long-term survivors challenged a third time show ~70% survival without any additional therapeutic modality, suggesting significantly improved acquired immune response. Statistical significance was determined by the Log-rank (Mantel-Cox) test (**p<0.01; ***p<0.001; ****p<0.0001). (ii) Individual tumor growth curves for third challenge in long-term survivors (n = 9 mice from three independent experiments) shown in (H – i). In total, four mice developed tumors, two of which had to be euthanized prematurely due to tumor rupture despite not reaching a terminal burden of 125 mm2. These mice are included in the survival analysis. The two remaining mice show significantly slower tumor growth than naïve mice challenged with regular B16F10 CD47 KO (median survival of 14 days) and can be considered partial responders.
Figure 4—figure supplement 1
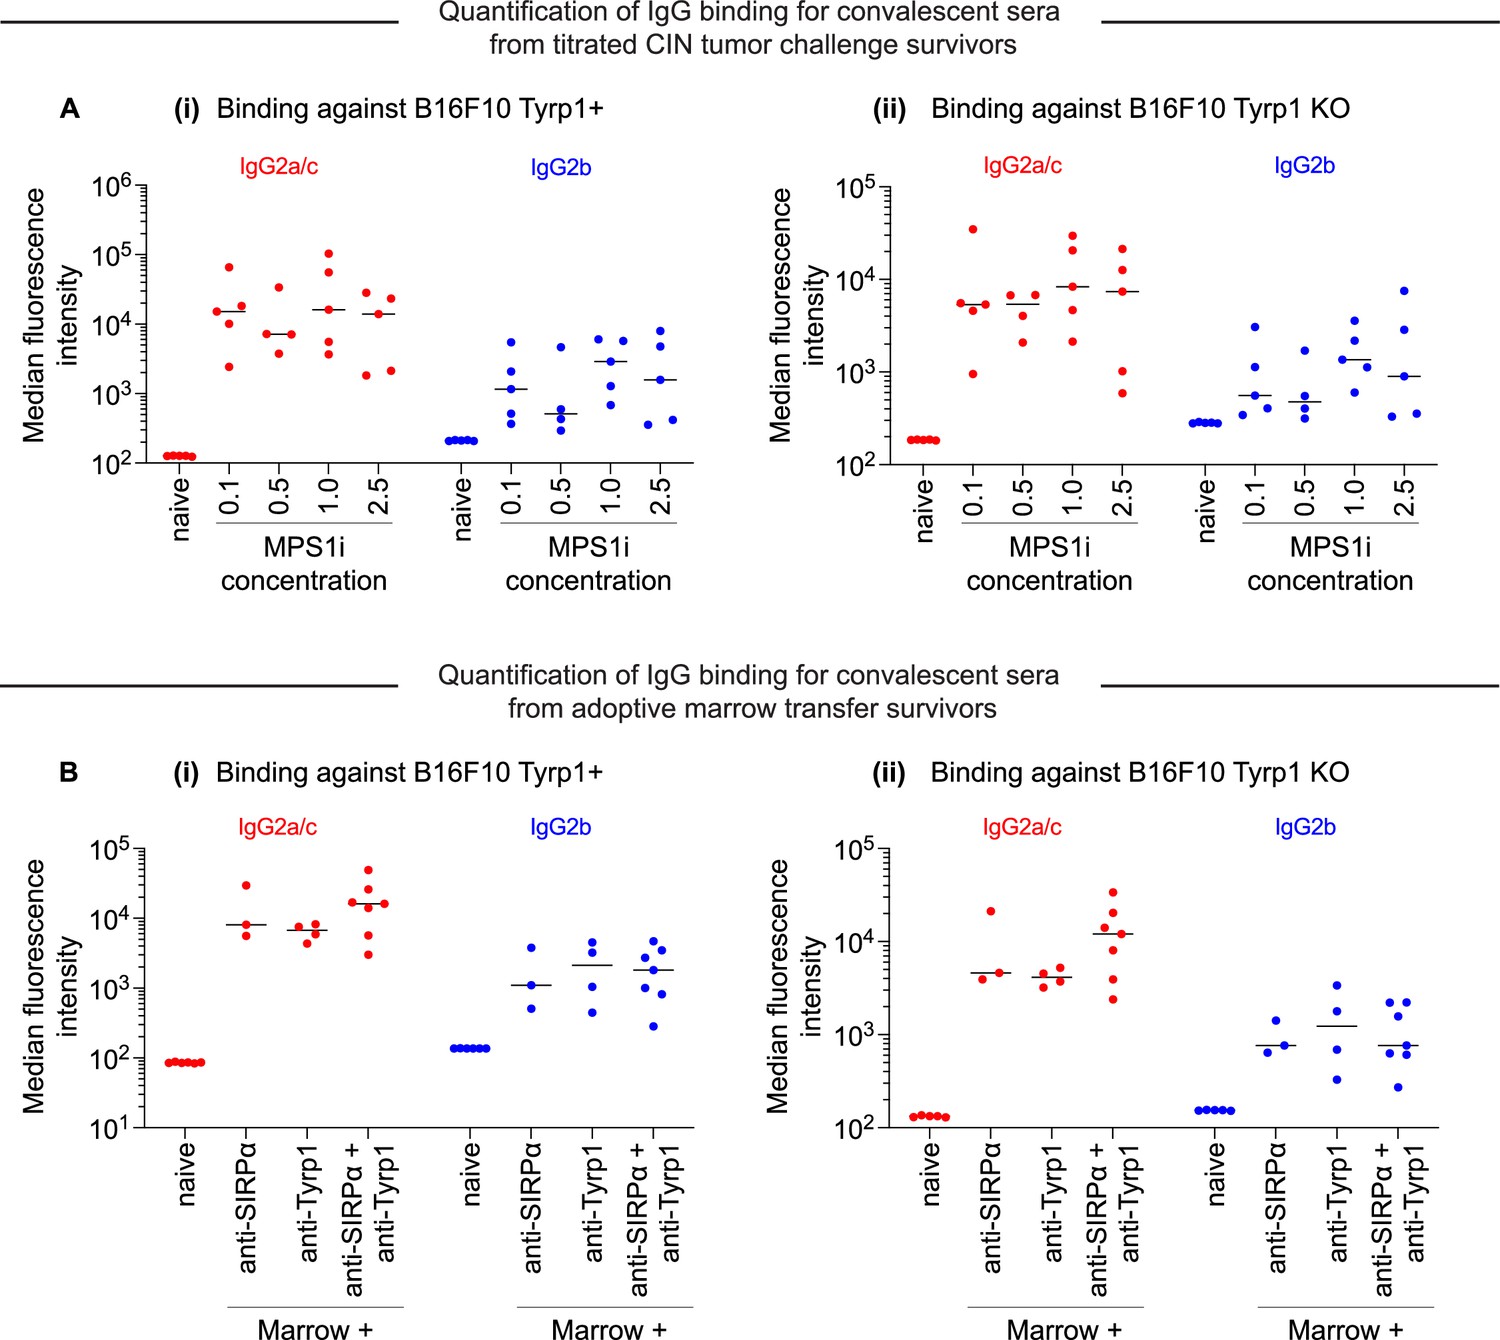
Survivors challenged with chromosomal instability (CIN)-afflicted tumors generate anti-cancer IgG, regardless of the degree of CIN.
(A) Median fluorescence intensity quantification of IgG2a/c and IgG2b binding from sera from surviving mice with different degrees of CIN by titrating reversine concentration used to treat B16F10 CD47 knockout (KO) cells before injection. Convalescent sera are collected from survivors from Figure 3—figure supplement 1. Binding of IgG2a/c and IgG2b against (i) B16F10 cells expressing Tyrp1 and (ii) B16F10 Tyrp1 KO. n = 4–5 distinct sera samples collected from survivors. (B) Median fluorescence intensity quantification of IgG2a/c and IgG2b binding from sera from surviving mice treated with adoptive marrow transfer. Convalescent sera are collected from survivors from Figure 3E. Binding of IgG2a/c and IgG2b against (i) B16F10 cells expressing Tyrp1 and (ii) B16F10 Tyrp1 knockout (KO). n = 3-7 distinct sera samples collected from survivors.
Figure 4—figure supplement 2
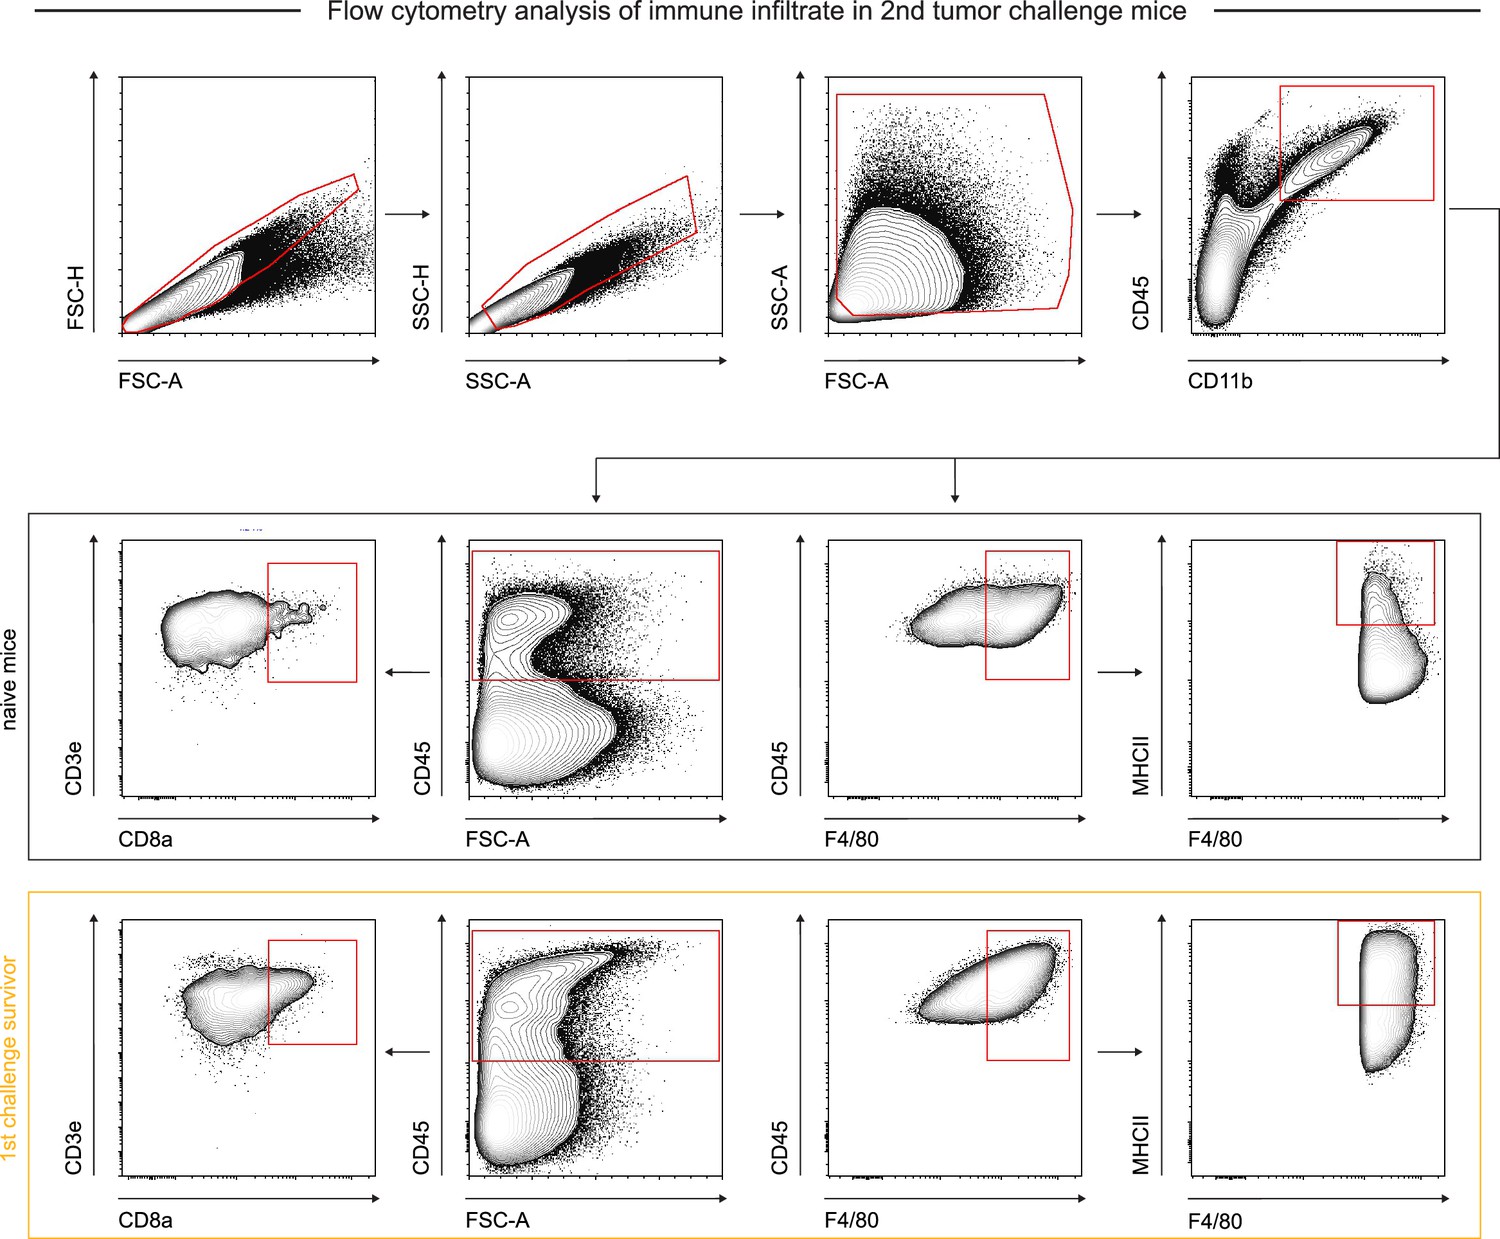
Flow cytometry gating strategy for identification and quantification of immune infiltrate and characterization in re-challenge experiments.
Representative flow cytometry gating strategy for in vivo B16F10 CD47 knockout (KO) tumor immune infiltrate from second challenge non-survivors and age-matched naïve controls. Singlets were separated from debris, doublets, and aggregates by FSC-A vs FSC-H and SSC-A vs SSC-H gates. Debris and dead cells were further removed by FSC-A vs SSC-A gating. For T cell quantification: CD45+ cells were gated on and then analyzed for CD3e and CD8a surface protein expression. For macrophage quantification: myeloid cells were isolated by CD45+ and CD11b+ expression, after which macrophages were isolated based on F4/80 expression.
Figure 4—figure supplement 3
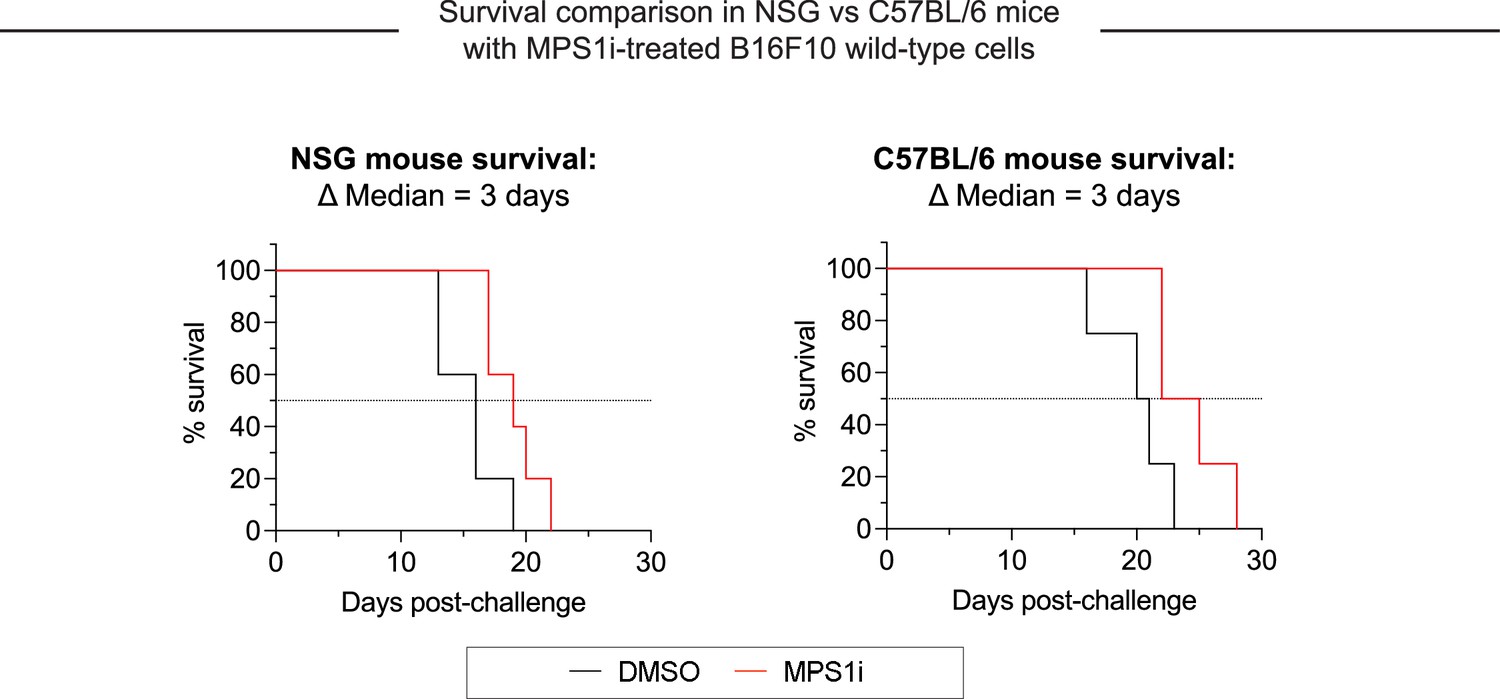
Growth of chromosomal instability (CIN)-afflicted wild-type (WT) tumors in T- and B-cell deficient mice and T- and B-cell replete mice.
Similar growth delays are found for MPS1 kinase inhibition (MPS1i)-pre-treated B16F10 cells in T- and B-cell deficient NSG mice and immunocompetent C57BL/6 mice. Both types of mice have functional macrophages. Parallel studies in vivo were done with WT B16F10 ctrl cells cultured 24 hr in 2.5 μM MPS1i (reversine or DMSO), then washed 3× in growth media for 5 min each and allowed to recover in growth media for 48 hr. 200,000 cells in 100 µL PBS were injected subcutaneously into right flanks, and the standard size limit was used to determine survival curves. The C57BL/6 experiments were done independently here (by co-author LJD) from the similar results (by BHH) shown in Figure 3D – i, which provides evidence of reproducibility.
Author response image 1

Author response image 2
Author response image 3

Author response image 4
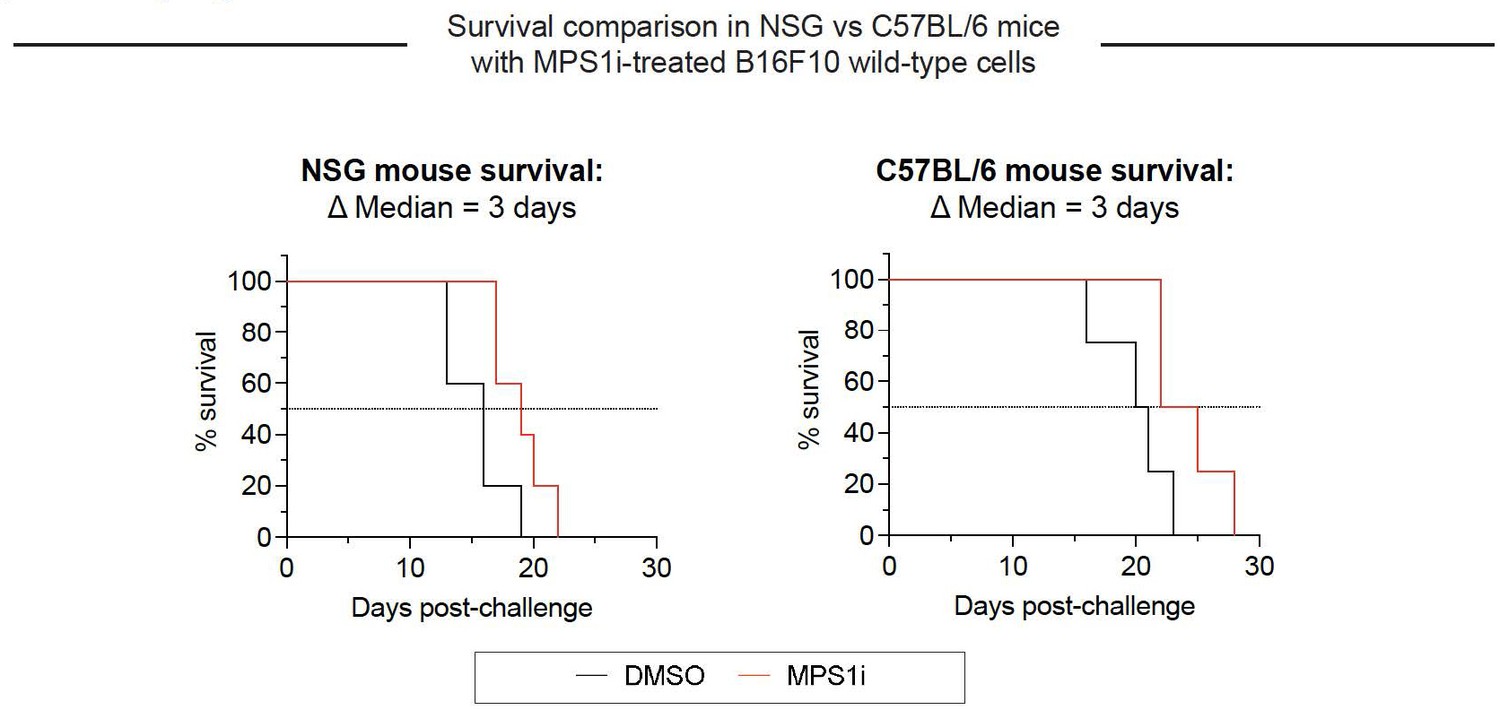
Growth of CIN-afflicted wild-type (WT) tumors in T- and B-cell deficient mice and T- and B-cell replete mice.
Similar growth delays for MPS1i-pretreated B16F10 cells in T- and B-cell deficient NSG mice and immunocompetent C57BL/6 mice. Both types of mice have functional macrophages. Parallel studies in vivo were done with WT B16F10 ctrl cells cultured 24 h in 2.5 μM MPS1i reversine or DMSO, then washed 3x in growth media for 5 min each and allowed to recover in growth media for 48 h. 200,000 cells in 100 uL PBS were injected subcutaneously into right flanks, and the standard size limit was used to determine survival curves. The C57BL/6 experiments were done independently here (by co-author L.J.D.) from the similar results (by B.H.H.) shown in Fig.3D-i, which provides evidence of reproducibility.
Tables
Appendix 1—key resources table
| Reagent type (species) or resource | Designation | Source or reference | Identifiers | Additional information |
|---|---|---|---|---|
| Strain, strain background Mus musculus | C57BL/6J | Jackson Laboratory | Stock# 000664; RRID:IMSR_JAX:000664 | Sex: Male (because B16 cell line is male derived) |
| Strain, strain background Mus musculus (male) | NOD.Cg-Prkdcscid Il2rgtm1Wjl/SzJ | Perelman School of Medicine Stem Cell Xenograft Core | RRID:SCR_010035 | Sex: Male |
| Cell line (Mus musculus) | B16F10 | ATCC | Cat# CRL-6475; RRID:CVCL_0159 | Mouse melanoma |
| Cell line (Mus musculus) | B16F10 CD47 KO | PMID: 31964705 | CD47 KO | Hayes et al., 2020 |
| Cell line (Mus musculus) | B16F10 sgCtrl | PMID: 31964705 | sgCtrl | Hayes et al., 2020 |
| Biological sample (Mus musculus) | C57BL/6J bone marrow cells | This paper | Flushed from femurs, tibias; differentiation into bone marrow-derived macrophages (BMDMs) or adoptive transfer | |
| Biological sample (Mus musculus) | C57BL/6J serum | This paper | Retro-orbital blood collected from convalescent or naïve mice, clotted for 1 hr, separated by centrifugation | |
| Antibody | InVivoMab mouse anti-human/mouse Tryp1 (clone TA99) | BioXCell | Cat# BE0151; RRID:AB_10949462 | (1:1000) Opsonization (10–20 μg/mL) In vivo (250 μg/100 μL per dose) |
| Antibody | InVivoMab mouse IgG2a isotype control (clone C1.18.4) | BioXCell | Cat# BE0085; RRID:AB_1107771 | (1:1000) (10–20 μg/mL) In vivo (250 μg/100 μL per dose) |
| Antibody | Ultra-LEAF rat anti-mouse SIRPα (clone P84) | BioLegend | Cat# 144036; RRID:AB_2832517 | Blockade (18 μg/mL=1:50) |
| Antibody | InVivoMab rat anti-mouse CD47 (clone MIAP301) | BioXCell | Cat# BE0270; RRID:AB_2687793 | (1:500) Flow cytom. (20 μg/mL) |
| Antibody | Alexa Fluor 647 anti-mouse IgG [H+L] (donkey polyclonal) | Thermo Fisher Invitrogen | Cat# A-31571; RRID:AB_162542 | Flow cytom. (10 μg/mL=1:200) |
| Antibody | Alexa Fluor 647 anti-rat IgG [H+L] (goat polyclonal) | Thermo Fisher Invitrogen | Cat# A-21247; RRID:AB_141778 | Flow cytom. (10 μg/mL=1:200) |
| Antibody | Horse radish peroxidase sheep anti-mouse [H+L], polyclonal | GE Life Sciences | Cat# NA931V | WB (1:500) |
| Antibody | Mouse anti-β-actin (clone C4) | Santa Cruz | Cat# sc47778; RRID:AB_626632 | WB (1:1000) |
| Antibody | Brilliant Violet 650 rat anti-mouse CD45 (clone 30-F11) | BioLegend | Cat# 103151; RRID:AB_2565884 | Flow cytom. (2.5 µg/mL=1:80) |
| Antibody | Brilliant Violet 785 rat anti-mouse CD45 (clone 30-F11) | BioLegend | Cat# 103149; RRID:AB_2564590 | Flow cytom. (5 µg/mL=1:40) |
| Antibody | APC/Cyanine7 rat anti-mouse CD45 (clone 30-F11) | BioLegend | Cat# 103115; RRID:AB_312980 | Flow cytom. (2.5 µg/mL=1:80) |
| Antibody | APC rat anti-mouse/human CD11b (clone M1/70) | BioLegend | Cat# 101212; RRID:AB_312795 | Flow cytom. (2.5 µg/mL=1:80) |
| Antibody | PE/Cyanine7 rat anti-mouse/human CD11b (clone M1/70) | BioLegend | Cat# 101216; RRID:AB_312799 | Flow cytom. (2.5 µg/mL=1:80) |
| Antibody | PE/Dazzle 594 rat anti-mouse Ly6G (clone 1A8) | BioLegend | Cat# 127647; RRID:AB_2566318 | Flow cytom. (5 µg/mL=1:40) |
| Antibody | PerCP rat anti-mouse Ly6G (clone 1A8) | BioLegend | Cat# 127653; RRID:AB_2616998 | Flow cytom. (2.5 µg/mL=1:80) |
| Antibody | PE rat anti-mouse F4/80 (clone BM8) | BioLegend | Cat# 123110; RRID:AB_893486 | Flow cytom. (10 µg/mL=1:20) |
| Antibody | Brilliant Violet 605 rat anti-mouse Ly-6C (clone HK1.4) | BioLegend | Cat# 128035 RRID:AB_2562352 | Flow cytom (5 µL/100 µL=1:20) |
| Antibody | APC rat anti-mouse I-A/I-E (clone M5/114.15.2) | BioLegend | Cat# 107614; RRID:AB_313329 | Flow cytom. (2.5 µg/mL=1:80) |
| Antibody | Pacific Blue rat anti-mouse CD86 (clone GL-1) | BioLegend | Cat# 105022; RRID:AB_493466 | Flow cytom. (10 µg/mL=1:50) |
| Antibody | APC/Cyanine7 rat anti-mouse CD86 (clone GL-1) | BioLegend | Cat# 105029; RRID:AB_2074993 | Flow cytom. (2.5 µg/mL=1:80) |
| Antibody | APC rat anti-mouse CD206 (clone C068C2) | BioLegend | Cat# 141707; RRID:AB_10896057 | Flow cytom. (5 µg/mL=1:40) |
| Antibody | Brilliant Violet 421 rat anti-mouse CD206 (clone C068C2) | BioLegend | Cat# 141717; RRID:AB_2562232 | Flow cytom. (5 µL/100 µL=1:20) |
| Antibody | PE/Cyanine7 rat anti-mouse CD163 (clone S15049F) | BioLegend | Cat# 156707; RRID:AB_2910324 | Flow cytom. (2.5 µg/mL=1:80) |
| Antibody | APC/Cyanine7 Armenian hamster anti-mouse CD3e (clone 145-2C11) | BioLegend | Cat# 100329; RRID:AB_1877171 | Flow cytom. (5 µg/mL=1:40) |
| Antibody | Alexa Fluor 647 rat anti-mouse CD8a (clone 53-6.7) | BioLegend | Cat# 100727; RRID:AB_493424 | Flow cytom. (2.5 µg/mL=1:200) |
| Antibody | APC mouse anti-mouse H-2kb/H-2Db (clone 28-8-6) | BioLegend | Cat# 114613; RRID:AB_2750193 | Flow cytom. (5 µg/mL=1:40) |
| Antibody | PE rat anti-mouse IgG2a (clone RMG2a-62) | BioLegend | Cat# 407108; RRID:AB_10549974 | Flow cytom. (5 µg/mL=1:40) |
| Antibody | APC rat anti-mouse IgG2b (clone RMG2b-1) | BioLegend | Cat# 406711; RRID:AB_2750277 | Flow cytom. (2.5 µg/mL=1:80) |
| Antibody | TruStain FcX PLUS rat anti-mouse CD16/32 (clone S17011E) | BioLegend | Cat# 156603; RRID:AB_2783137 | Flow cytom. Fc block (2.5 µg/mL=1:200) |
| Peptide, recombinant protein | Macrophage colony-stimulating factor (M-CSF) | BioLegend | Cat# 576406 | BMDM differentiation (20 ng/mL) |
| Commercial assay or kit | Vybrant CFDA-SE Cell Trace | Thermo Fisher Invitrogen | Cat# V12883 | |
| Commercial assay or kit | CellTracker DeepRed | Thermo Fisher Invitrogen | Cat# C34565 | |
| Commercial assay or kit | NEBNext Ultra II RNA Library Prep Kit | NEB | Cat# E7770S | |
| Sequence-based reagent | NEBNext Multiplex Oligos for Illumina | NEB | Cat# E7335 | |
| Commercial assay or kit | Chromium Single Cell Gene Expression kit | 10x Genomics | Cat# PN-1000128; Cat# PN-1000127; Cat# PN-1000213 | |
| Chemical compound, drug | Reversine | Cayman Chemical | Cat# 10004412 | MPS1 inhibitor |
| Chemical compound, drug | AZ3146 | Cayman Chemical | Cat# 19991 | MPS1 inhibitor |
| Chemical compound, drug | BAY 12-17389 | Selleck Chemicals | Cat# S8215 | MPS1 inhibitor |
| Software, algorithm | Prism v9.4 | GraphPad | RRID:SCR_002798 | |
| Software, algorithm | FCS Express 7 | De Novo Software | ||
| Other | Anti-adherence rinsing solution | StemCell Technologies | Cat# 07010 | Surface treatment for tumoroid studies |
| Other | ACK lysing buffer | Thermo Fisher Gibco | Cat# A1049201 | Bone marrow and tumor red blood cell lysis |
| Other | Dispase | Corning | Cat# 354235 | Tumor disaggregation |
| Other | DNAse I | Millipore Sigma | Cat# 101041159001 | Tumor disaggregation |
| Other | Collagenase type IV | Thermo Fisher Gibco | Cat# 17104-019 | Tumor disaggregation (4 mg/mL) |
Additional files
Download links
A two-part list of links to download the article, or parts of the article, in various formats.
Downloads (link to download the article as PDF)
Open citations (links to open the citations from this article in various online reference manager services)
Cite this article (links to download the citations from this article in formats compatible with various reference manager tools)
Chromosomal instability induced in cancer can enhance macrophage-initiated immune responses that include anti-tumor IgG
eLife 12:RP88054.
https://doi.org/10.7554/eLife.88054.3


