Gene–environment pathways to cognitive intelligence and psychotic-like experiences in children
- Interdisciplinary Program in Artificial Intelligence, College of Engineering, Seoul National University, Republic of Korea
- Department of Psychology, College of Social Sciences, Seoul National University, Republic of Korea
- Department of Psychology, College of Arts and Sciences, The Ohio State University, United States
- Department of Psychology, McGill University, Canada
- Department of Brain and Cognitive Sciences, College of Natural Sciences, Seoul National University, Republic of Korea
- Department of Digital Health, Samsung Advanced Institute for Health Sciences & Technology (SAIHST), Sungkyunkwan University, Republic of Korea
- Samsung Medical Center, Republic of Korea
Figures
Figure 1

Study diagram for longitudinal trajectories of genetic and environmental influences on psychotic-like experiences (PLEs) through cognitive intelligence.
This study examines the mediating role of cognitive intelligence within the effects of cognitive phenotype polygenic scores (PGSs), high family socioeconomic status (SES), low neighborhood SES, and positive family and school environments on PLEs observed at baseline, 1-year follow-up, and 2-year follow-up in children aged 9–10 years. Both direct and indirect effects, as well as total effects, were evaluated for statistical significance.
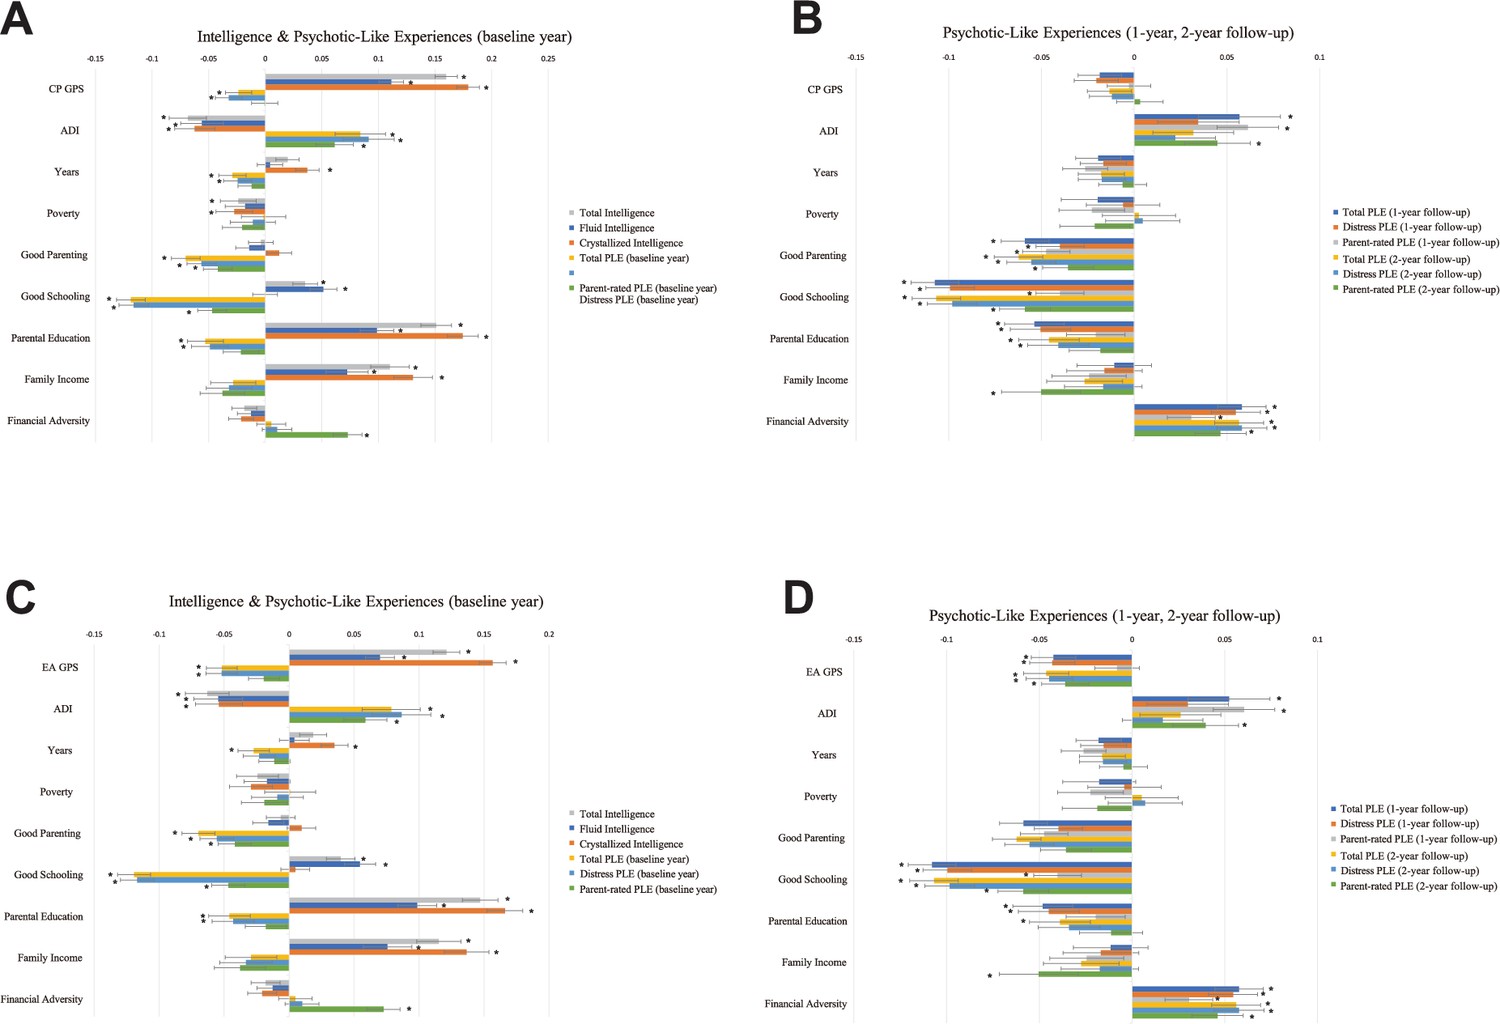
Figure 2
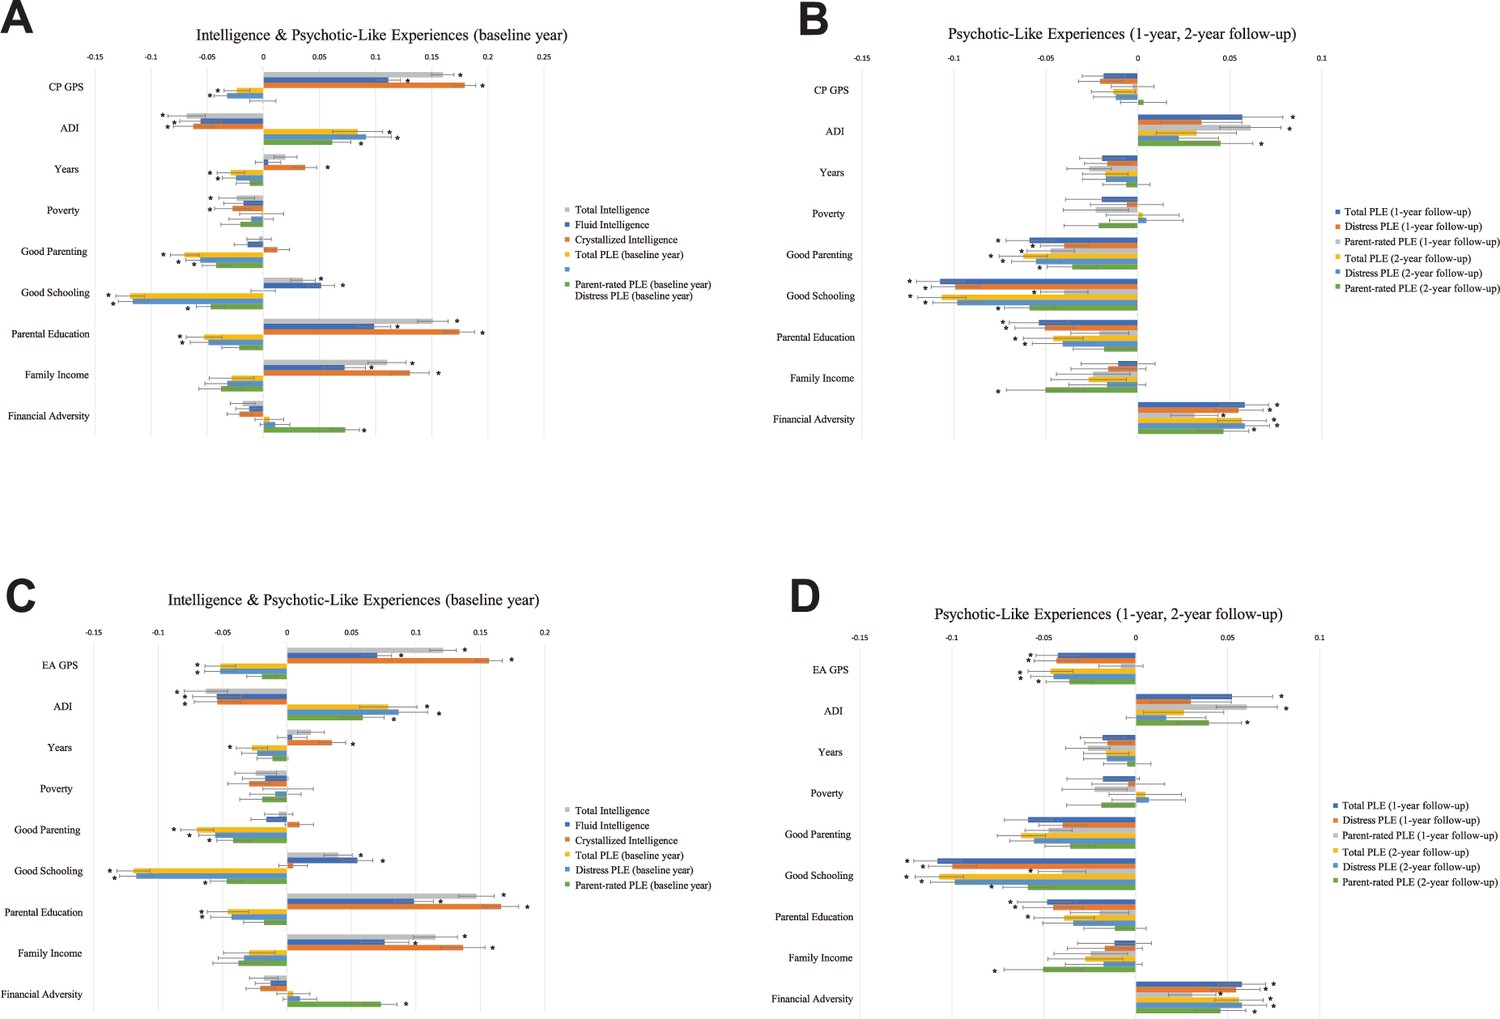
Linear models testing genetic, socioeconomic, and environmental factors associated with cognitive intelligence and PLEs.
Standardized coefficients of a linear mixed model with CP PGS (A, B) and EA PGS (C, D). The analyses included 6602 samples of multiethnicity. Cognitive intelligence and PLEs correlated with the PGSs, residential disadvantage, positive environment, and family SES in the opposite directions. Error bars indicate 95% bootstrapped confidence intervals with 5000 iterations. CP and EA denote cognitive performance and education attainment, respectively; PGS, polygenic scores; SES, socioeconomic status; PLEs, psychotic-like experiences; ADI, Area Deprivation Index; Poverty, percentage of individuals below −125% of the poverty level; Years, years of residence (*p-FDR <0.05).
Figure 3
Direct/indirect effects of gene–environment factors to cognitive and PLEs outcomes.
(A) Direct pathways from PGS, high family SES, low neighborhood SES, and positive environment to cognitive intelligence and PLEs. Standardized path coefficients are indicated on each path as direct effect estimates (significance level *p < 0.05). (B) Indirect pathways to PLEs via intelligence were significant for polygenic scores, high family SES, low neighborhood SES, and positive environment, indicating the significant mediating role of intelligence. (C) Relative effect sizes of direct and indirect pathways within the total effects on PLEs. The standardized effect sizes of direct pathways are colored within each bar. In (A–B), child sex, genetic ancestry, body mass index (BMI), marital status, family history of psychiatric disorders, and ABCD research sites were included as covariates. CP PGS and EA PGS denote polygenic scores of cognitive performance and education attainment, respectively; SES, socioeconomic status; PLEs, psychotic-like experiences; Crystallized and Fluid, crystallized and fluid intelligence; ADI, Area Deprivation Index; Poverty, percentage of individuals below −125% of the poverty level; Years, years of residence. Note: * indicates a statistically significant parameter estimate at α = 0.05.
Appendix 3—figure 1
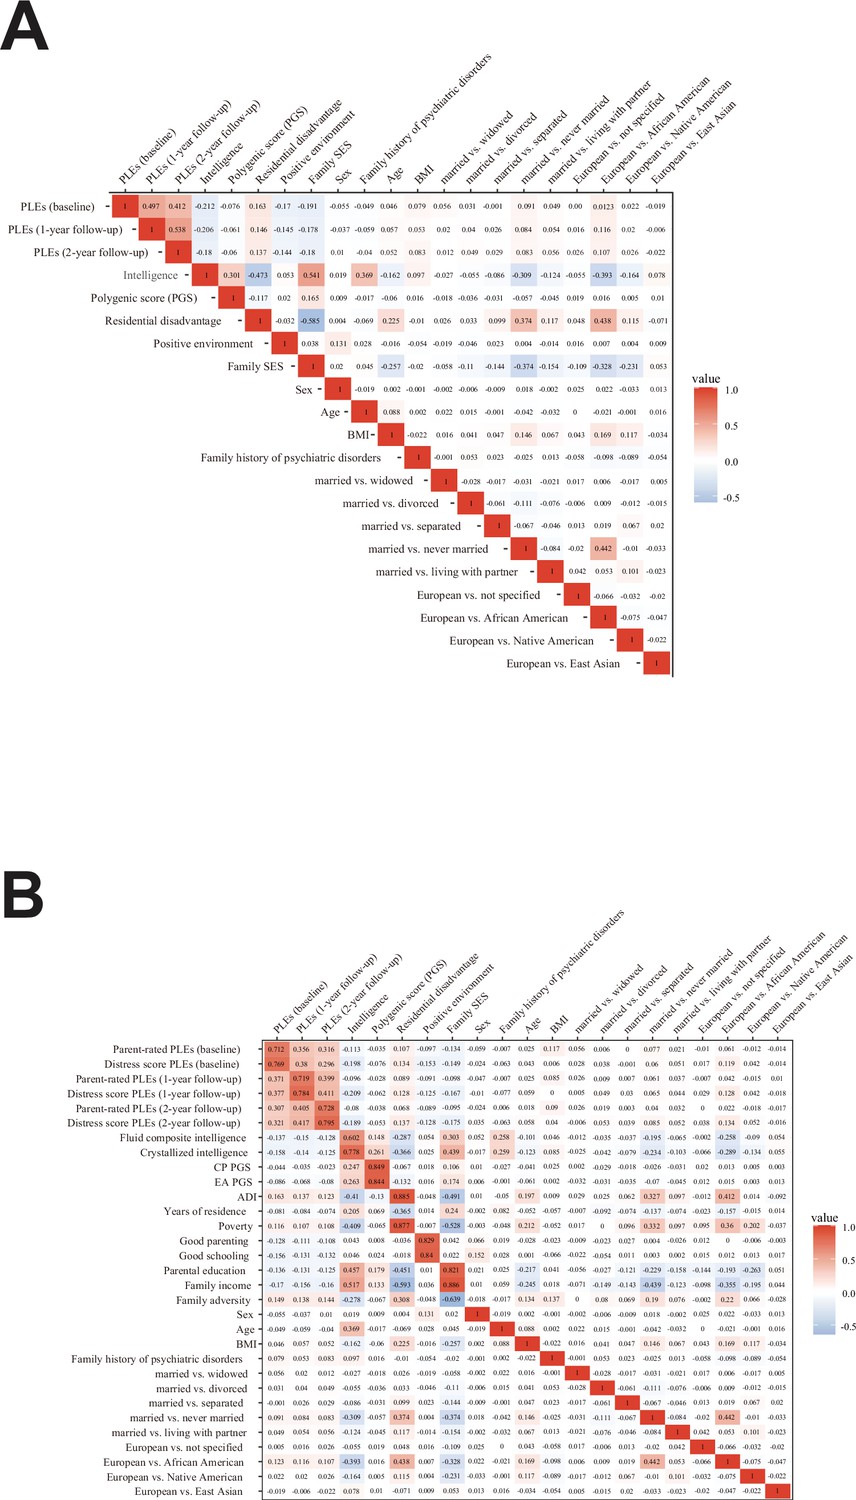
Component correlation matrix of integrated generalized structured component analysis (IGSCA).
(A) Correlation between all component/factor variables of the IGSCA model. (B) Correlation between all observed variables used to construct the relevant component/factor variables in the IGSCA model. CP PGS and EA PGS denote polygenic scores of cognitive performance and education attainment, respectively; PLEs, psychotic-like experiences; Crystallized and Fluid, crystallized and fluid intelligence; ADI, Area Deprivation Index; Poverty, percentage of individuals below −125% of the poverty level; Years, years of residence.
Tables
Table 1
Demographic characteristics of the study participants.
Of the initial 11,878 ABCD samples, we obtained data for the variables of interest for 6602 multiethnic children. For multiethnic subjects (main analyses, n = 6602), 47.15% were female, and the parents of 70.21% were married. In European ancestry samples (sensitivity analyses, n = 5211), 46.71% were female, and the parents of 77.47% were married. Children of European ancestry had significantly different marital status (p < 0.0001), lower body mass index (BMI; p < 0.0001), and higher family history of psychiatric disorders (p < 0.0001) than children of multiethnic ancestries. There were no significant differences in other characteristics between the two ancestry groups. The 6602 multiethnic participants consisted of 890 African-ancestry (13.48%), 229 Native American ancestry (3.47%), 91 East Asian ancestry (1.38%), 181 not specified (2.74%), and 5211 European ancestry (78.93%) children. Differences between genetic ancestry groups were calculated using χ2 tests for categorical variables and t-tests for continuous variables.
| Demographic characteristics | European ancestry (n = 5211) | Multiethnic (n = 6602) | Test statistics | ||||||
|---|---|---|---|---|---|---|---|---|---|
| N | Ratio (%) | Mean (SD) | N | Ratio (%) | Mean (SD) | t(df)/χ2(df) | p value | ||
| Sex | Male | 2777 | 53.29 | 3489 | 52.85 | −0.4795 (11811) | 0.6316 | ||
| Female | 2434 | 46.71 | 3113 | 47.15 | |||||
| Marital status of the caregiver | Married | 4037 | 77.47 | 4635 | 70.21 | −10.2326 (11811) | <0.0001 | ||
| Widowed | 38 | 0.73 | 50 | 0.76 | |||||
| Divorced | 485 | 9.31 | 610 | 9.24 | |||||
| Separated | 155 | 2.97 | 232 | 3.51 | |||||
| Never married | 275 | 5.28 | 718 | 10.88 | |||||
| Living with partner | 221 | 4.24 | 357 | 5.41 | |||||
| Age (rounded to chronological month) | 5211 | 118.99 (7.46) | 6602 | 118.94 (7.41) | 0.3652 (11811) | 0.715 | |||
| BMI | 18.29 (3.67) | 18.72 (4.12) | −5.8889 (11811) | <0.0001 | |||||
| Family history of psychiatric disorders (proportion of first-degree relatives who experienced mental illness) | 0.10 (0.11) | 0.09 (0.11) | 4.4296 (11811) | <0.0001 | |||||
| Genetic ancestry | African | - | 890 | 13.48 | |||||
| Native American | - | 229 | 3.47 | ||||||
| East Asian | - | 91 | 1.38 | ||||||
| European | 5211 | 100 | 5211 | 78.93 | |||||
| Not specified | - | 181 | 2.74 | ||||||
Table 2
Integrated generalized structured component analysis (IGSCA) of multiethnic samples.
Sex, age, genetic ancestry, body mass index (BMI), parental education, marital status of the caregiver, household income, and family’s financial adversity based on parents’ self-report, family history of psychiatric disorders, and ABCD research sites were included as covariates. Family socioeconomic status was included to confirm that the aassociations of polygenic score (PGS), neighborhood disadvantage, and positive environment are meaningful. SE and CI represent standard error and confidence intervals, respectively. Significant effects are marked with a star (*).
| Analysis of total/direct/indirect effects | ||||||
|---|---|---|---|---|---|---|
| Effect type | Paths | Estimate | SE | 95% CI | Significance | |
| Effects from PGS to intelligence (baseline year) | ||||||
| Direct effect | PGS → intelligence | 0.242736 | 0.01277 | 0.218202 | 0.267954 | * |
| Effects from high family SES to intelligence (baseline year) | ||||||
| Direct effect | High family SES → intelligence | 0.293171 | 0.016737 | 0.260337 | 0.326413 | * |
| Effects from low neighborhood SES to intelligence (baseline year) | ||||||
| Direct effect | Low neighborhood SES → intelligence | −0.1121 | 0.016768 | −0.14568 | −0.08118 | * |
| Effects from positive environment to intelligence (baseline year) | ||||||
| Direct effect | Positive environment → intelligence | 0.026793 | 0.012552 | 0.003984 | 0.052633 | * |
| Effects from intelligence to psychotic-like experiences (all years) | ||||||
| Direct effect | Intelligence → psychotic-like experiences (baseline year) | −0.14421 | 0.027683 | −0.20344 | −0.09516 | * |
| Direct effect | Intelligence → psychotic-like experiences (1-year follow-up) | −0.14638 | 0.027507 | −0.20834 | −0.09983 | * |
| Direct effect | Intelligence → psychotic-like experiences (2-year follow-up) | −0.11276 | 0.028708 | −0.17428 | −0.063 | * |
| Effects from PGS to psychotic-like experiences (baseline year) | ||||||
| Total effect | PGS → psychotic-like experiences | −0.05017 | 0.011354 | −0.07292 | −0.02853 | * |
| Indirect effect | PGS → intelligence → psychotic-like experiences | −0.035 | 0.007126 | −0.0508 | −0.02273 | * |
| Direct effect | PGS → psychotic-like experiences | −0.01516 | 0.01347 | −0.04085 | 0.012389 | |
| 7 Effects from high family SES to psychotic-like experiences (baseline year) | ||||||
| Total effect | High family SES → psychotic-like experiences | −0.12126 | 0.019087 | −0.15851 | −0.08313 | * |
| Indirect effect | High family SES → intelligence → psychotic-like experiences | −0.04228 | 0.008652 | −0.06139 | −0.02707 | * |
| Direct effect | High family SES → psychotic-like experiences | −0.07898 | 0.020747 | −0.11856 | −0.03698 | * |
| Effects from low neighborhood SES to psychotic-like experiences (baseline year) | ||||||
| Total effect | Low neighborhood SES → psychotic-like experiences | 0.050374 | 0.018277 | 0.013545 | 0.085934 | * |
| Indirect effect | Low neighborhood SES → intelligence → psychotic-like experiences | 0.016166 | 0.003944 | 0.009843 | 0.025298 | * |
| Direct effect | Low neighborhood SES → psychotic-like experiences | 0.034209 | 0.0184 | −0.00268 | 0.069813 | |
| Effects from positive environment to psychotic-like experiences (baseline year) | ||||||
| Total effect | Positive environment → psychotic-like experiences | −0.15256 | 0.013871 | −0.17965 | −0.1252 | * |
| Indirect effect | Positive environment → intelligence → psychotic-like experiences | −0.00386 | 0.002065 | −0.00859 | −0.00058 | * |
| Direct effect | Positive environment → psychotic-like experiences | −0.14869 | 0.014025 | −0.17573 | −0.12073 | * |
| Effects from PGS to psychotic-like experiences (1-year follow-up) | ||||||
| Total effect | PGS → psychotic-like experiences | −0.035895 | 0.011646 | −0.058499 | −0.013458 | * |
| Indirect effect | PGS → intelligence → psychotic-like experiences | −0.03553 | 0.007062 | −0.05176 | −0.02376 | * |
| Direct effect | PGS → psychotic-like experiences | −0.00036 | 0.013579 | −0.02566 | 0.028107 | |
| Effects from high family SES to psychotic-like experiences (1-year follow-up) | ||||||
| Total effect | High family SES → psychotic-like experiences | −0.11184 | 0.018291 | −0.1478 | −0.07584 | * |
| Indirect effect | High family SES → intelligence → psychotic-like experiences | −0.04291 | 0.008569 | −0.06242 | −0.0288 | * |
| Direct effect | High family SES → psychotic-like experiences | −0.06892 | 0.019586 | −0.10522 | −0.02866 | * |
| Effects from low neighborhood SES to psychotic-like experiences (1-year follow-up) | ||||||
| Total effect | Low neighborhood SES → psychotic-like experiences | 0.032947 | 0.018055 | −0.00264 | 0.068773 | |
| Indirect effect | Low neighborhood SES → intelligence → psychotic-like experiences | 0.016409 | 0.004003 | 0.010133 | 0.025893 | * |
| Direct effect | Low neighborhood SES → psychotic-like experiences | 0.016538 | 0.018503 | −0.02066 | 0.051855 | |
| Effects from positive environment to psychotic-like experiences (1-year follow-up) | ||||||
| Total effect | Positive environment → psychotic-like experiences | −0.13149 | 0.013154 | −0.15756 | −0.10589 | * |
| Indirect effect | Positive environment → intelligence → psychotic-like experiences | −0.00392 | 0.00208 | −0.0087 | −0.00059 | * |
| Direct effect | Positive environment → psychotic-like experiences | −0.12757 | 0.013237 | −0.15343 | −0.10137 | * |
| Effects from PGS to psychotic-like experiences (2-year follow-up) | ||||||
| Total effect | PGS → psychotic-like experiences | −0.03643 | 0.012196 | −0.06027 | −0.01272 | * |
| Indirect effect | PGS → intelligence → psychotic-like experiences | −0.02737 | 0.007142 | −0.04307 | −0.01508 | * |
| Direct effect | PGS → psychotic-like experiences | −0.00906 | 0.014737 | −0.03696 | 0.021152 | |
| Effects from high family SES to psychotic-like experiences (2-year follow-up) | ||||||
| Total effect | High family SES → psychotic-like experiences | −0.11632 | 0.018067 | −0.15258 | −0.08174 | * |
| Indirect effect | High family SES → intelligence → psychotic-like experiences | −0.03306 | 0.008796 | −0.05228 | −0.01807 | * |
| Direct effect | High family SES → psychotic-like experiences | −0.08326 | 0.019462 | −0.12066 | −0.04392 | * |
| Effects from low neighborhood SES to psychotic-like experiences (2-year follow-up) | ||||||
| Total effect | Low neighborhood SES → psychotic-like experiences | 0.01921 | 0.018684 | −0.01767 | 0.055261 | |
| Indirect effect | Low neighborhood SES → intelligence → psychotic-like experiences | 0.012641 | 0.003814 | 0.006533 | 0.0215 | * |
| Direct effect | Low neighborhood SES → psychotic-like experiences | 0.006569 | 0.019176 | −0.03173 | 0.042823 | |
| Effects from positive environment to psychotic-like experiences (2-year follow-up) | ||||||
| Total effect | Positive environment → psychotic-like experiences | −0.13627 | 0.013881 | −0.1635 | −0.10926 | * |
| Indirect effect | Positive environment → intelligence → psychotic-like experiences | −0.00302 | 0.001703 | −0.0069 | −0.00043 | * |
| Direct effect | Positive environment → psychotic-like experiences | −0.13325 | 0.014009 | −0.16069 | −0.10565 | * |
Additional files
-
MDAR checklist
- https://cdn.elifesciences.org/articles/88117/elife-88117-mdarchecklist1-v1.docx
-
Supplementary file 1
Supplementary file containing linear mixed model analyses results, factor loadings of integrated generalized structured component analysis, and sensitivity analyses results.
- https://cdn.elifesciences.org/articles/88117/elife-88117-supp1-v1.xlsx
-
Source data 1
Synthetic dataset for replication (not used in actual analysis).
- https://cdn.elifesciences.org/articles/88117/elife-88117-data1-v1.zip
Download links
A two-part list of links to download the article, or parts of the article, in various formats.
Downloads (link to download the article as PDF)
Open citations (links to open the citations from this article in various online reference manager services)
Cite this article (links to download the citations from this article in formats compatible with various reference manager tools)
Gene–environment pathways to cognitive intelligence and psychotic-like experiences in children
eLife 12:RP88117.
https://doi.org/10.7554/eLife.88117.4


