Ebola virus sequesters IRF3 in viral inclusion bodies to evade host antiviral immunity
Figures
Figure 1 with 1 supplement
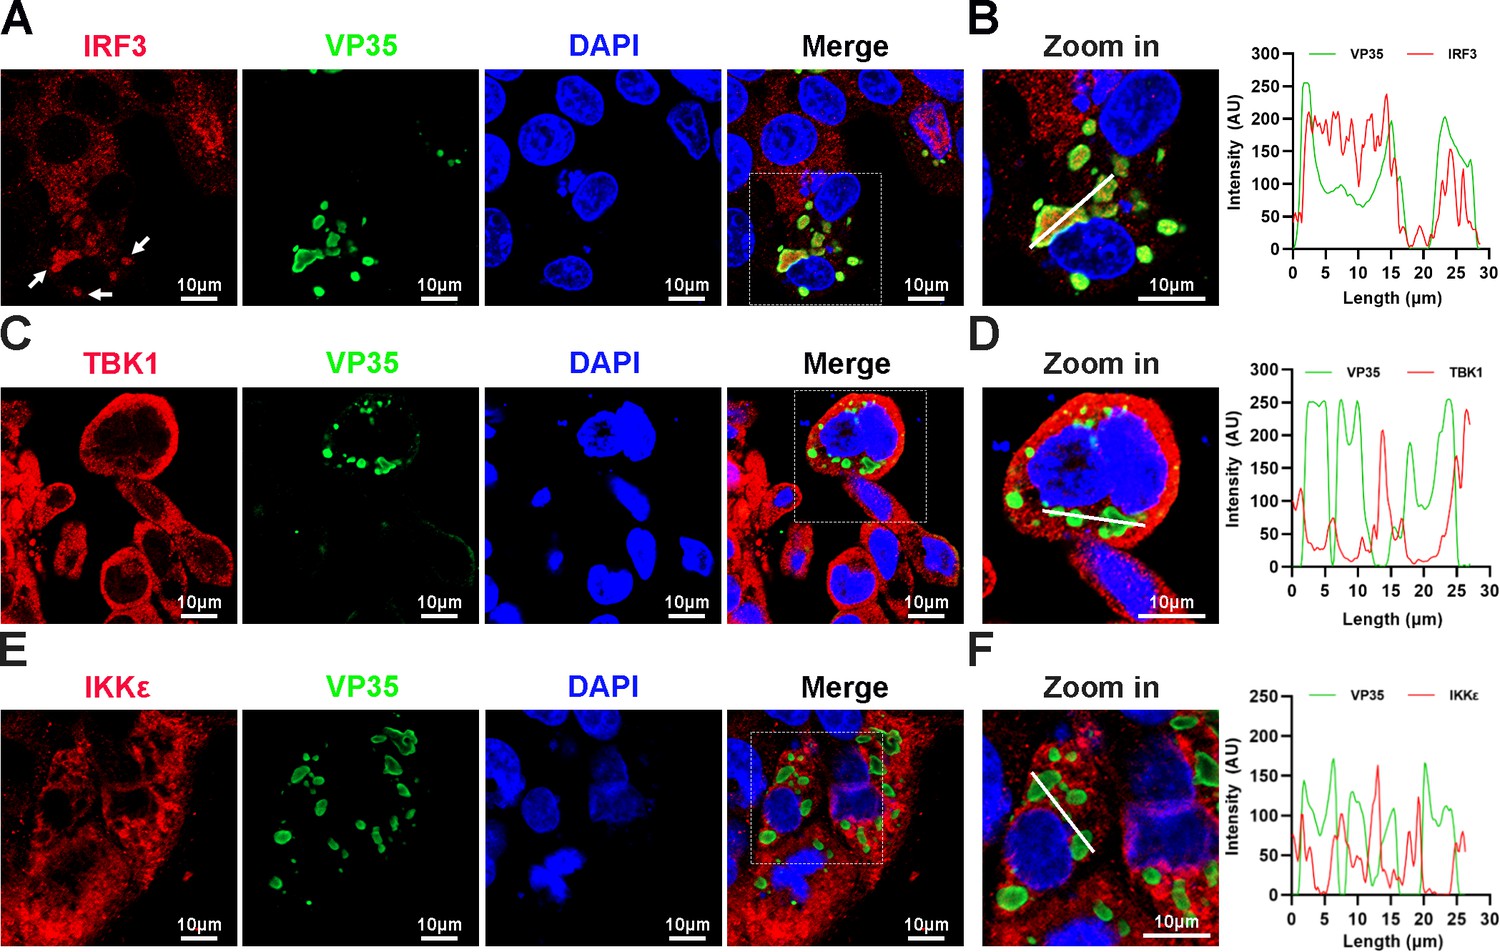
Interferon regulatory factor 3 (IRF3), but not TANK-binding kinase 1 (TBK1) and IκB kinase epsilon (IKKε), is sequestered into viral inclusion bodies (IBs) upon Ebola virus (EBOV) transcription- and replication-competent virus-like particles (trVLPs) infection.
(A) HepG2 cells infected with the EBOV trVLPs were immunostained with anti-IRF3 (red) and anti-VP35 (green) antibodies. Nuclei were stained with DAPI (4’,6-diamidino-2phenylindole; blue), and images were obtained using a Zeiss LSM 800 Meta confocal microscope. White arrows: IRF3 in IBs. (B) The left panel shows a magnified image of the IBs boxed in the merged panel of (A). The graphs (right panel) show the fluorescent intensity profiles along the indicated white lines drawn across one or more IBs. (C, E) HepG2 cells infected with the EBOV trVLPs were immunostained with anti-TBK1 (red in (C)) or anti-IKKε (red in (E)) and anti-VP35 (green in (C, E)) antibodies. Nuclei were stained with DAPI (blue), and images were obtained using a Zeiss LSM 800 Meta confocal microscope. Scale bar, 10 μm. (D, F) The left panel shows a magnified image of the IBs boxed in the merged panel shown in (C) and (E). The graphs (right panel) show the fluorescent intensity profiles along the indicated white lines drawn across one or more IBs.
-
Figure 1—source data 1
Numerical data for Figure 1B.
- https://cdn.elifesciences.org/articles/88122/elife-88122-fig1-data1-v1.zip
-
Figure 1—source data 2
Numerical data for Figure 1D.
- https://cdn.elifesciences.org/articles/88122/elife-88122-fig1-data2-v1.zip
-
Figure 1—source data 3
Numerical data for Figure 1F.
- https://cdn.elifesciences.org/articles/88122/elife-88122-fig1-data3-v1.zip
Figure 1—figure supplement 1
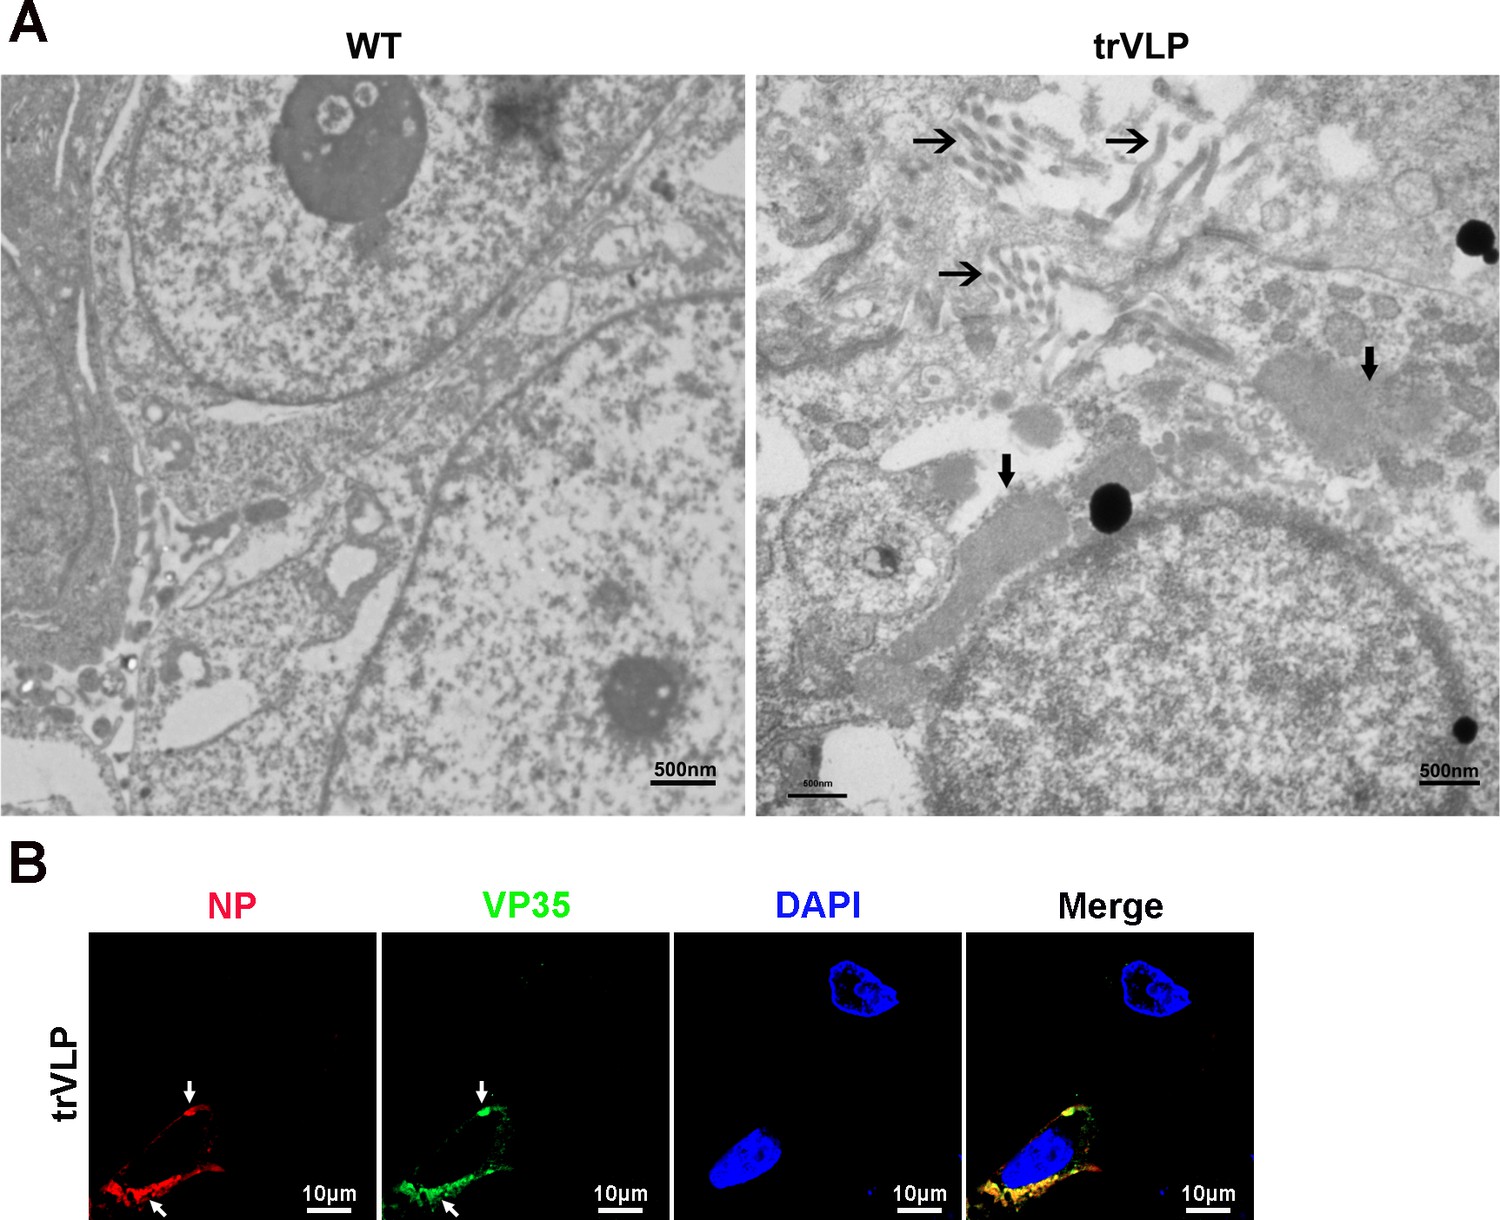
Transmission electron microscopy and immunofluorescence detection of Ebola virus (EBOV) transcription- and replication-competent virus-like particles (trVLPs) and inclusion bodies (IBs).
(A) HepG2 cells infected with or without EBOV trVLPs were fixed and observed with a HITACHI H-7650 transmission electron microscope at an accelerating voltage of 80 kV. The IBs and viral particles (right panel) are marked with bold arrows and regular arrows, respectively. Scale bar, 500 nm. (B) HepG2 cells infected with the EBOV trVLPs were immunostained with anti-NP (red) and anti-VP35 (green) antibodies. Nuclei were stained with DAPI (blue), and images were obtained using a Zeiss LSM 800 Meta confocal microscope. Scale bar, 10 μm.
Figure 2
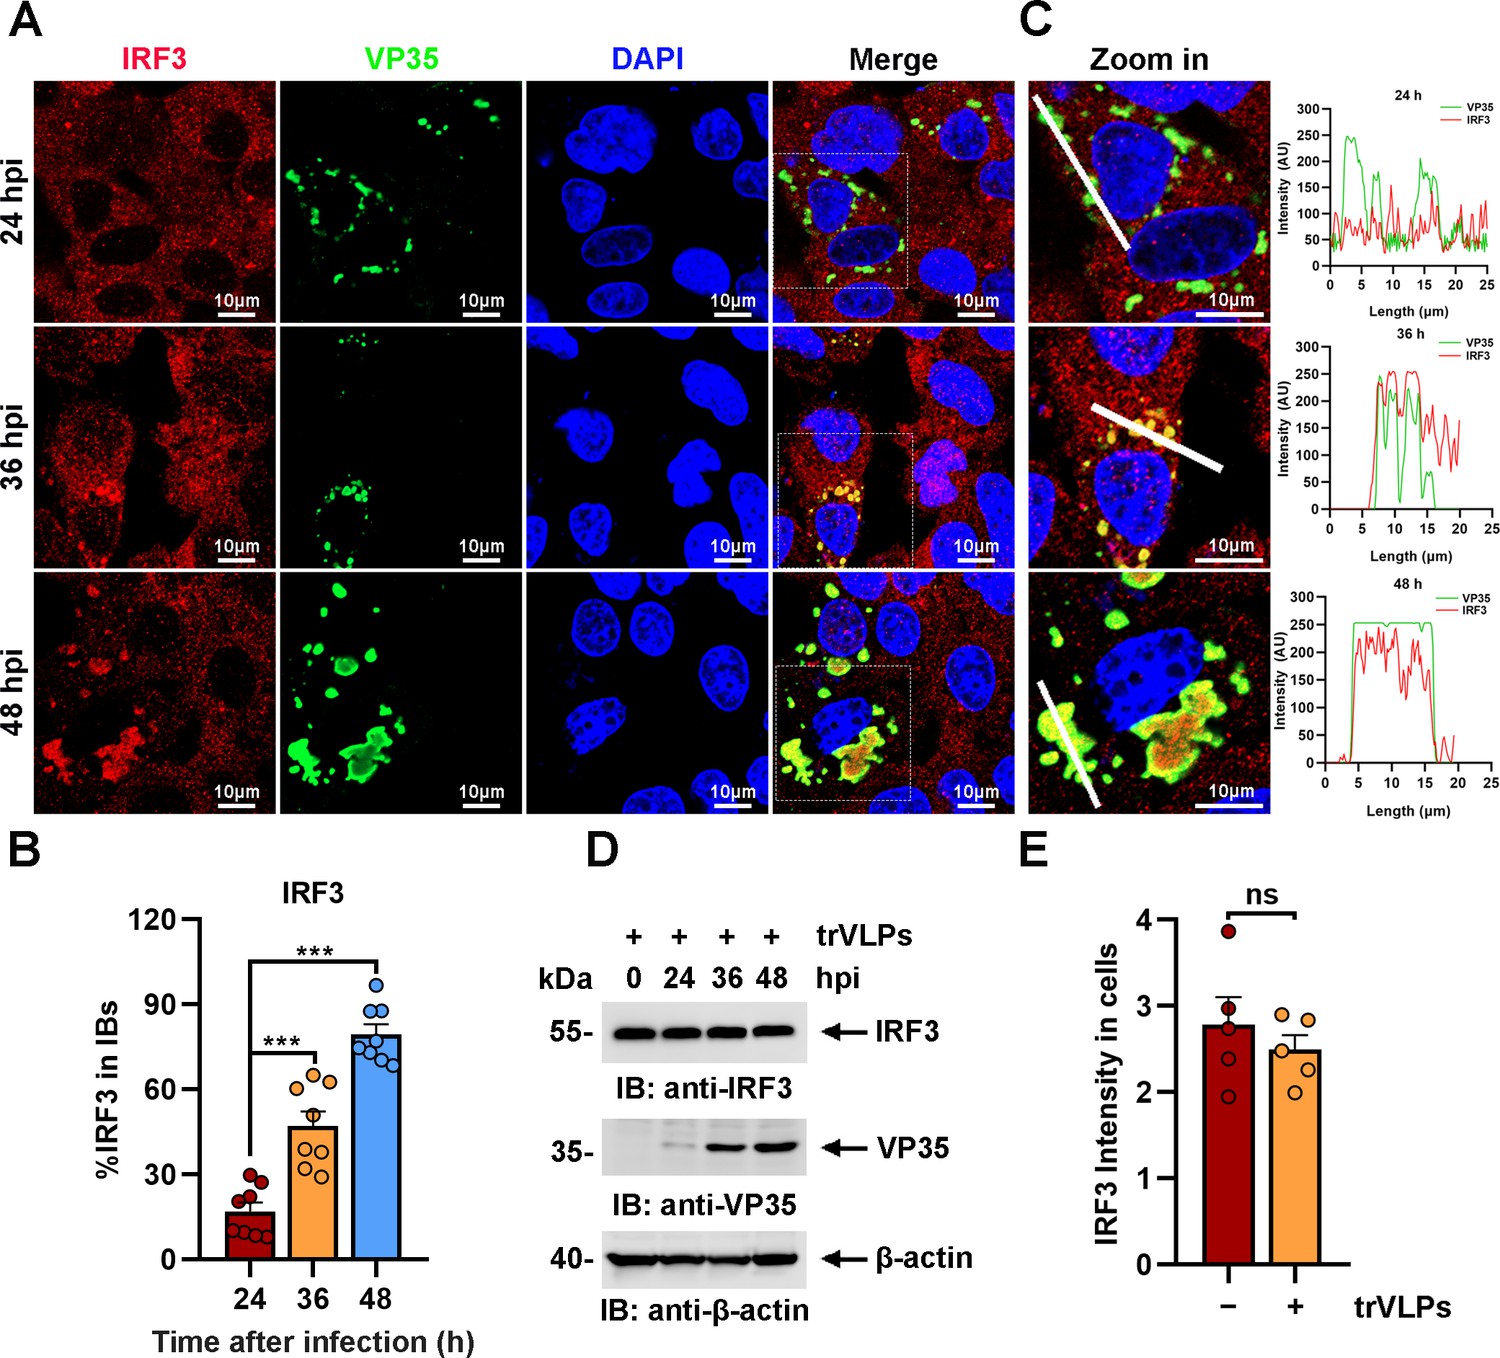
Ebola virus (EBOV) transcription- and replication-competent virus-like particles (trVLPs) induce the recruitment of interferon regulatory factor 3 (IRF3) into intracytoplasmic inclusion bodies (IBs).
(A) HepG2 cells were infected with EBOV trVLPs. At the indicated time points after infection, cells were fixed and immunostained with anti-IRF3 (red) and anti-VP35 (green) antibodies. Nuclei were stained with DAPI (blue), and images were obtained using a Zeiss LSM 800 Meta confocal microscope. Scale bar, 10 μm. The data from two independent replicates are presented. (B) The percentage of IRF3 distribution in IBs at different time points in cells infected with EBOV trVLPs (A) was analyzed using the R programming language. The intensity of IRF3 in eight cells from two independent assays is presented as the mean ± standard error of the mean (SEM; n = 8; ***p < 0.001). (C) The left panel shows a magnified image of the IBs boxed in the merged panel shown in (A). The graphs (right panel) show the fluorescent intensity profiles along the indicated white lines drawn across one or more IBs. (D) IRF3 levels in HepG2 cells infected with EBOV trVLPs were analyzed by immunoblotting with an anti-IRF3 antibody at the indicated hours post infection (hpi). (E) The IRF3 intensity in cells infected with or without EBOV trVLPs for 48 hr (the lower panel of (A)) was analyzed using ImageJ software. Differences between the two groups were evaluated using a two-sided unpaired Student’s t-test. The intensity of IRF3 in five cells from two independent assays is presented as the mean ± SEM (n = 5; ns, not significant).
-
Figure 2—source data 1
Numerical data for Figure 2B.
- https://cdn.elifesciences.org/articles/88122/elife-88122-fig2-data1-v1.zip
-
Figure 2—source data 2
Numerical data for Figure 2C.
- https://cdn.elifesciences.org/articles/88122/elife-88122-fig2-data2-v1.zip
-
Figure 2—source data 3
Raw image for Figure 2D.
- https://cdn.elifesciences.org/articles/88122/elife-88122-fig2-data3-v1.zip
-
Figure 2—source data 4
Numerical data for Figure 2E.
- https://cdn.elifesciences.org/articles/88122/elife-88122-fig2-data4-v1.zip
Figure 3
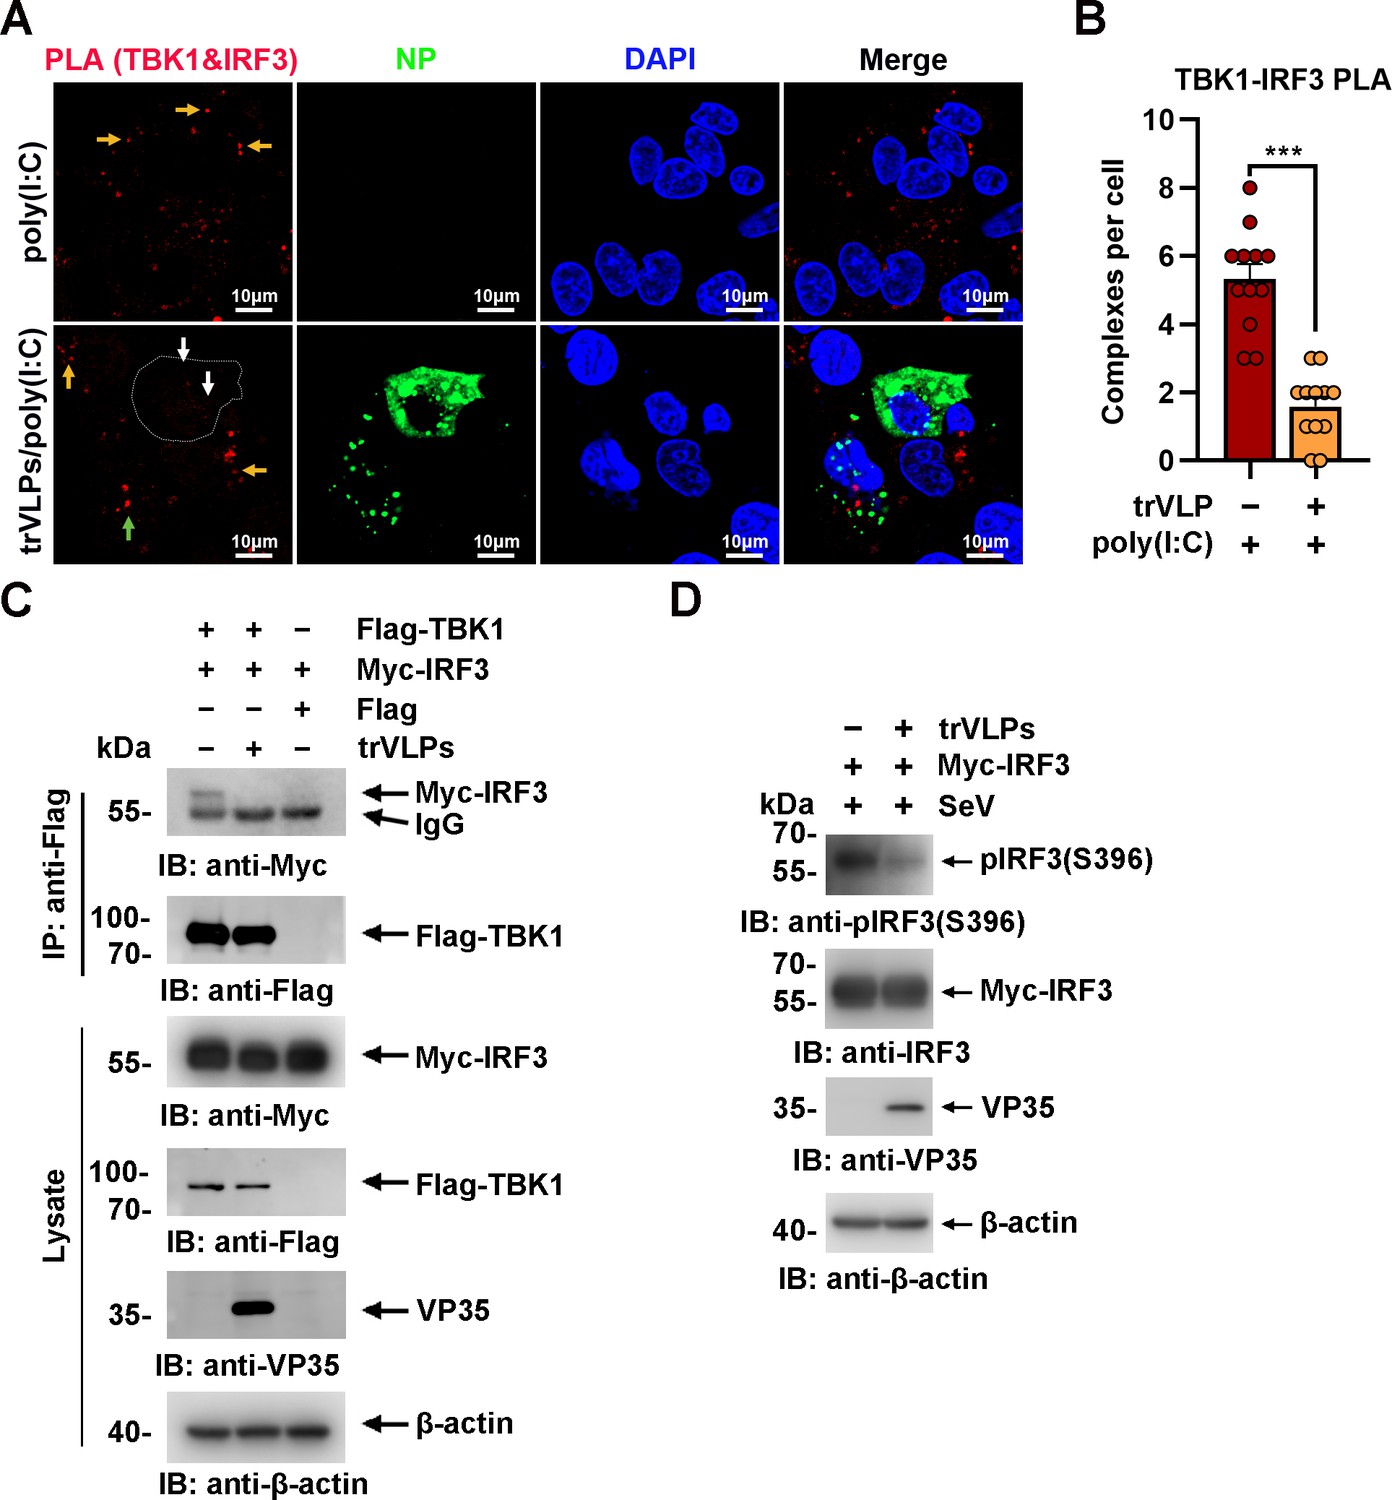
Ebola virus (EBOV) transcription- and replication-competent virus-like particles (trVLPs) inhibit interferon regulatory factor 3 (IRF3) activation.
(A) HepG2 cells were infected with or without the EBOV trVLPs. Thirty-six hours after infection, the cells were treated with or without 5 μg/ml poly(I:C) for 12 hr and then subjected to in situ proximity ligation assay (PLA) with anti-TANK-binding kinase 1 (TBK1) and anti-IRF3 antibodies and immunostaining with an anti-NP antibody (green). Nuclei were stained with DAPI (blue), and images were obtained using a Zeiss LSM 800 Meta confocal microscope. Arrows: white arrows indicate TBK1–IRF3 complexes in trVLP-infected cells, and yellow and green arrows indicate TBK1–IRF3 complexes in uninfected and infected cells with small inclusion bodies (IBs), respectively. Scale bar, 10 μm. (B) The signal for the PLA complex in each cell in (A) was counted from at least 12 cells and is presented as the mean ± standard error of the mean (SEM, ***p<0.001). (C) Lysates of HEK293 cells cotransfected with or without the EBOV minigenome (p0) and the indicated plasmids were subjected to anti-Flag immunoprecipitation and analyzed by immunoblotting. (D) HEK293 cells were cotransfected with or without the EBOV minigenome (p0) and Myc-IRF3 plasmids. Thirty-six hours after transfection, the cells were infected with Sendai virus (SeV) at an MOI (multiplicity of infection) of 2 for 12 hr, and the phosphorylation of IRF3 was analyzed by immunoblotting with an anti-IRF3-S396 antibody.
-
Figure 3—source data 1
Numerical data for Figure 3B.
- https://cdn.elifesciences.org/articles/88122/elife-88122-fig3-data1-v1.zip
-
Figure 3—source data 2
Raw image for Figure 3C.
- https://cdn.elifesciences.org/articles/88122/elife-88122-fig3-data2-v1.zip
-
Figure 3—source data 3
Raw image for Figure 3D.
- https://cdn.elifesciences.org/articles/88122/elife-88122-fig3-data3-v1.zip
Figure 4
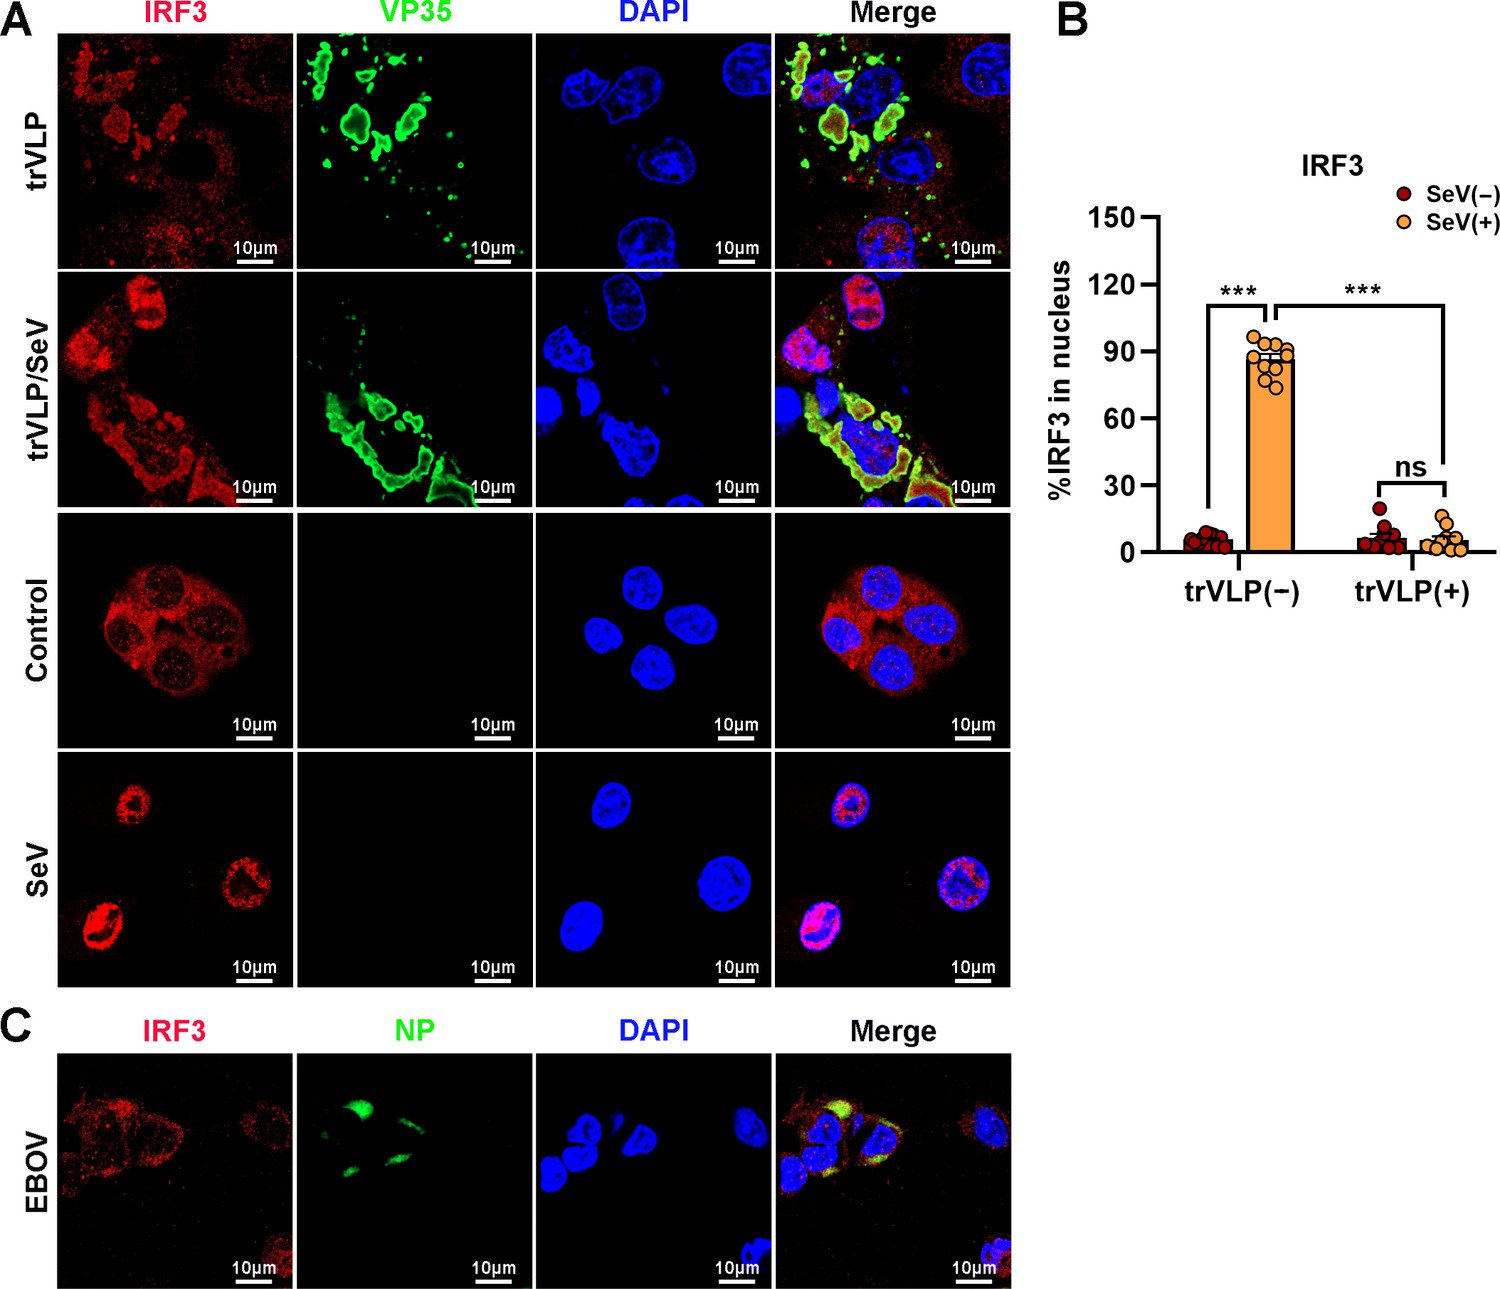
Ebola virus (EBOV) transcription- and replication-competent virus-like particles (trVLPs) inhibit nuclear translocation of interferon regulatory factor 3 (IRF3).
(A) HepG2 cells were infected with or without the EBOV trVLPs for 36 hr, and the cells were infected with or without Sendai virus (SeV) at an MOI of 2 for another 12 hr. The cells were then fixed and immunostained with anti-IRF3 (red) and anti-VP35 (green) antibodies. Nuclei were stained with DAPI (blue), and images were obtained using a Zeiss LSM 800 Meta confocal microscope. Scale bar, 10 μm. (B) The percentage of IRF3 nuclear distribution in (A) was analyzed using ImageJ software. The ratio of IRF3 distribution in ten cells from two independent assays is presented as the mean ± standard error of the mean (SEM; ns, not significant, ***p < 0.001). (C) HepG2 cells infected with live EBOV (MOI = 10) for 72 hr were immunostained with anti-IRF3 (red) and anti-NP (green) antibodies. Nuclei were stained with DAPI (blue), and images were obtained using a Zeiss LSM 800 Meta confocal microscope. Scale bar, 10 μm.
-
Figure 4—source data 1
Numerical data for Figure 4B.
- https://cdn.elifesciences.org/articles/88122/elife-88122-fig4-data1-v1.zip
Figure 5 with 2 supplements
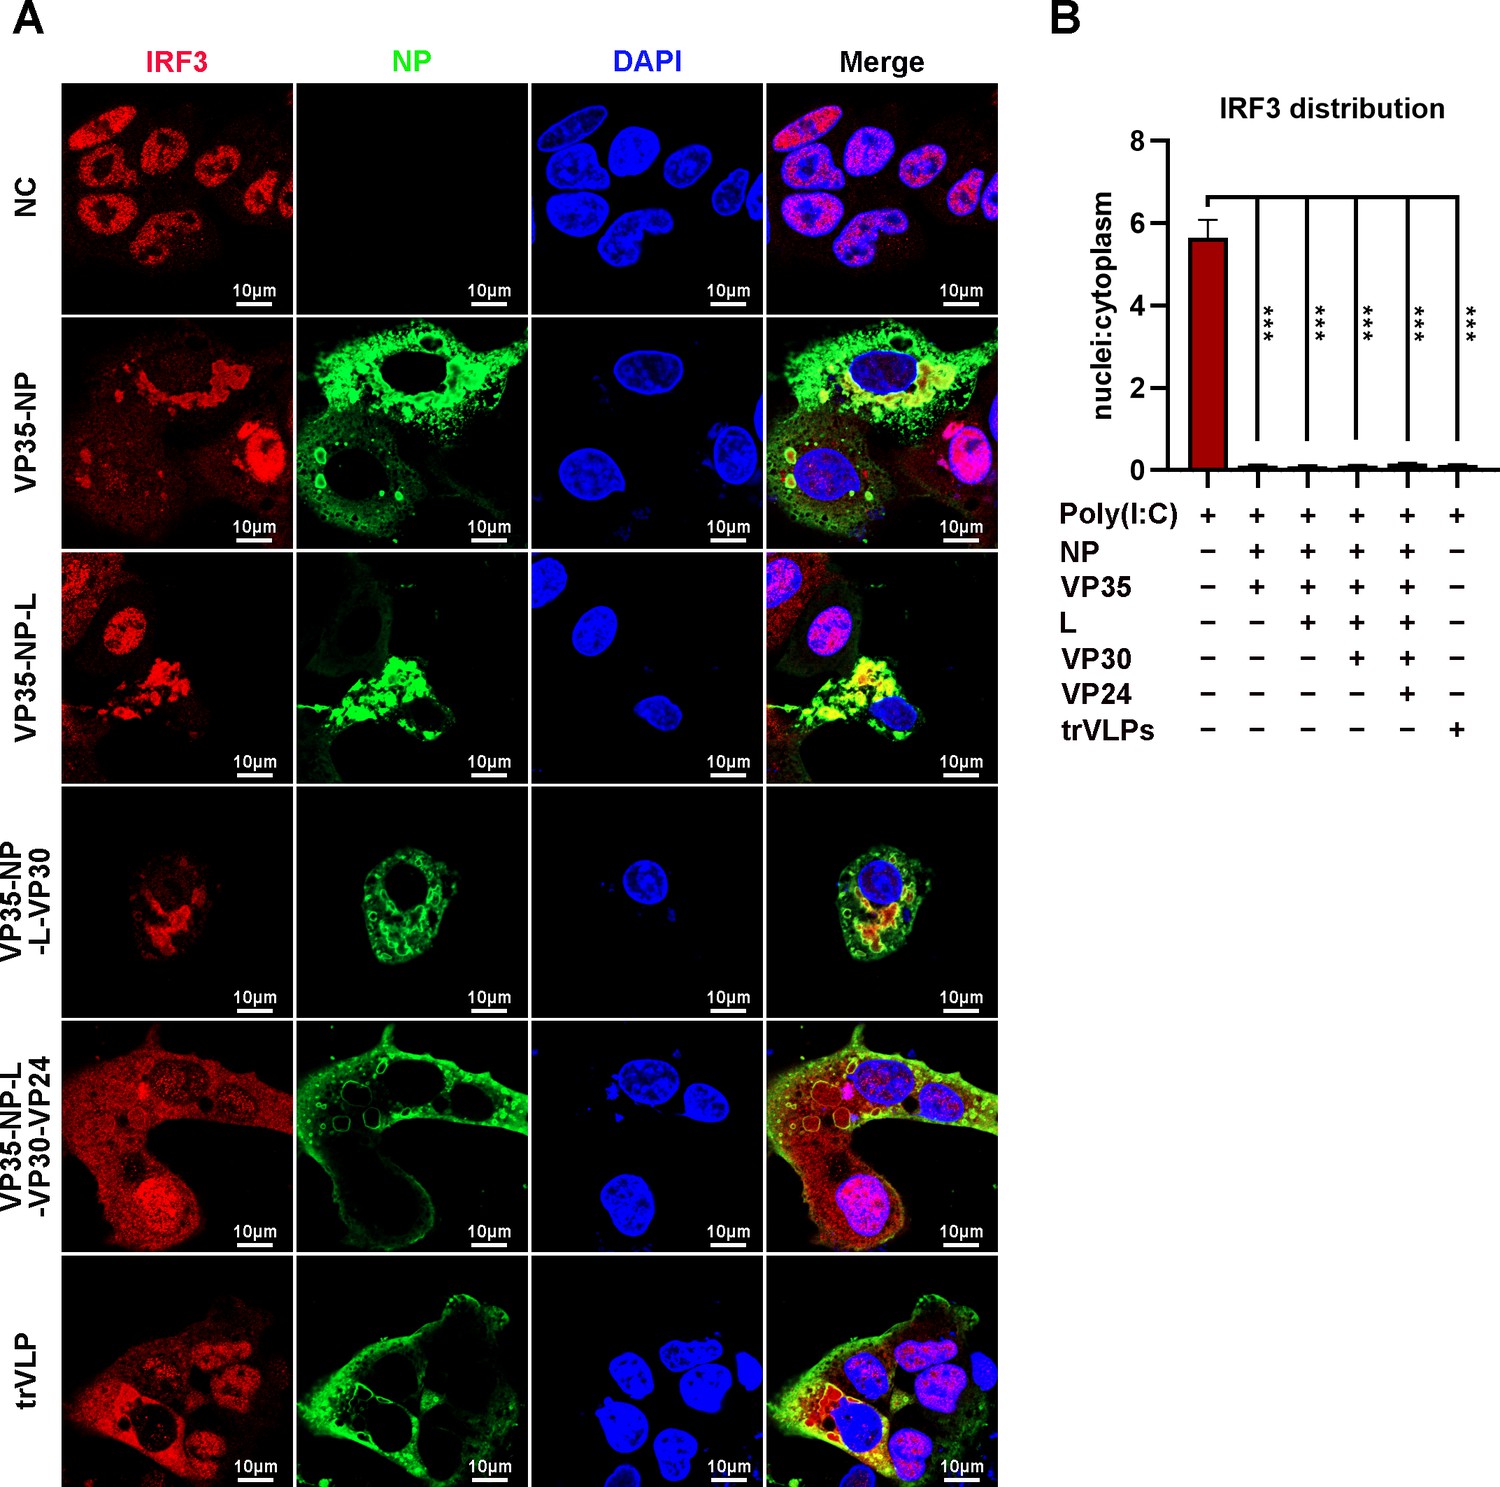
Ebola virus (EBOV) nucleoprotein (NP) and virion protein 35 (VP35) play an important role in sequestering interferon regulatory factor 3 (IRF3) into inclusion bodies (IBs).
(A) HepG2 cells were transfected with the indicated plasmids for 36 hr, and the cells were treated with 5 μg/ml poly(I:C) for another 12 hr. Then, the cells were fixed and immunostained with anti-IRF3 (red) and anti-NP (green) antibodies. Nuclei were stained with DAPI (blue), and images were obtained using a Zeiss LSM 800 Meta confocal microscope. Scale bar, 10 μm. (B) The nuclear/cytoplasmic distribution of IRF3 in (A) was analyzed by ImageJ software. Differences between the two groups were evaluated using a two-sided unpaired Student’s t-test. The ratio of IRF3 distribution in at least five cells from two independent assays is presented as the mean ± standard error of the mean (SEM; n = 5; ***p < 0.001).
-
Figure 5—source data 1
Numerical data for Figure 5B.
- https://cdn.elifesciences.org/articles/88122/elife-88122-fig5-data1-v1.zip
Figure 5—figure supplement 1
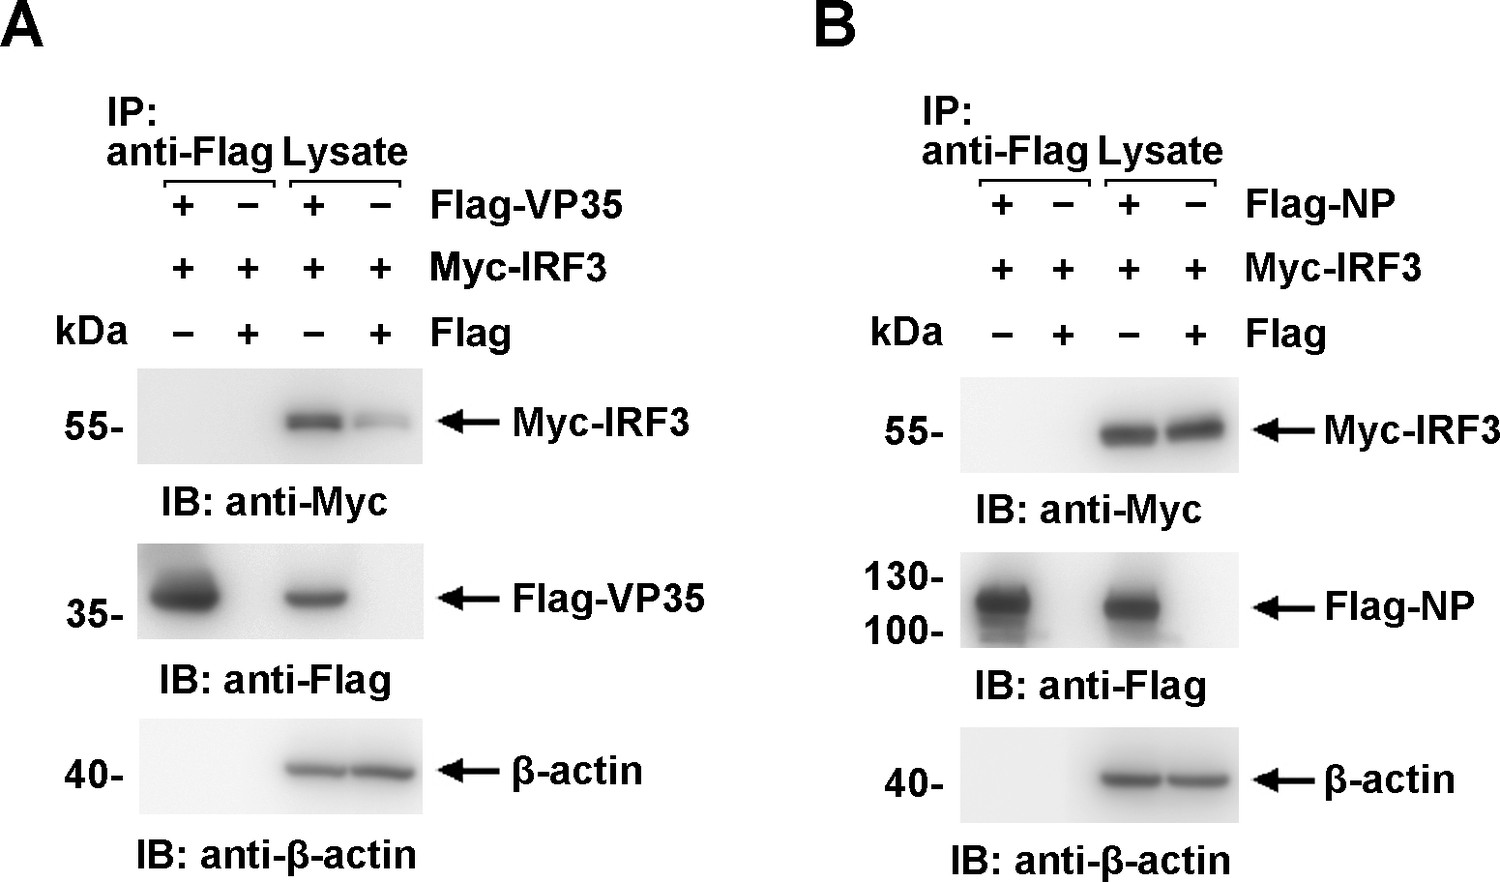
Neither virion protein 35 (VP35) nor nucleoprotein (NP) interacts directly with interferon regulatory factor 3 (IRF3) in cells.
(A, B) Lysates of HEK293 cells transfected with the indicated plasmids were subjected to anti-Flag immunoprecipitation and analyzed by immunoblotting. The data from two independent replicates are presented.
-
Figure 5—figure supplement 1—source data 1
Raw image for Figure 5—figure supplement 1A.
- https://cdn.elifesciences.org/articles/88122/elife-88122-fig5-figsupp1-data1-v1.zip
-
Figure 5—figure supplement 1—source data 2
Raw image for Figure 5—figure supplement 1B.
- https://cdn.elifesciences.org/articles/88122/elife-88122-fig5-figsupp1-data2-v1.zip
Figure 5—figure supplement 2
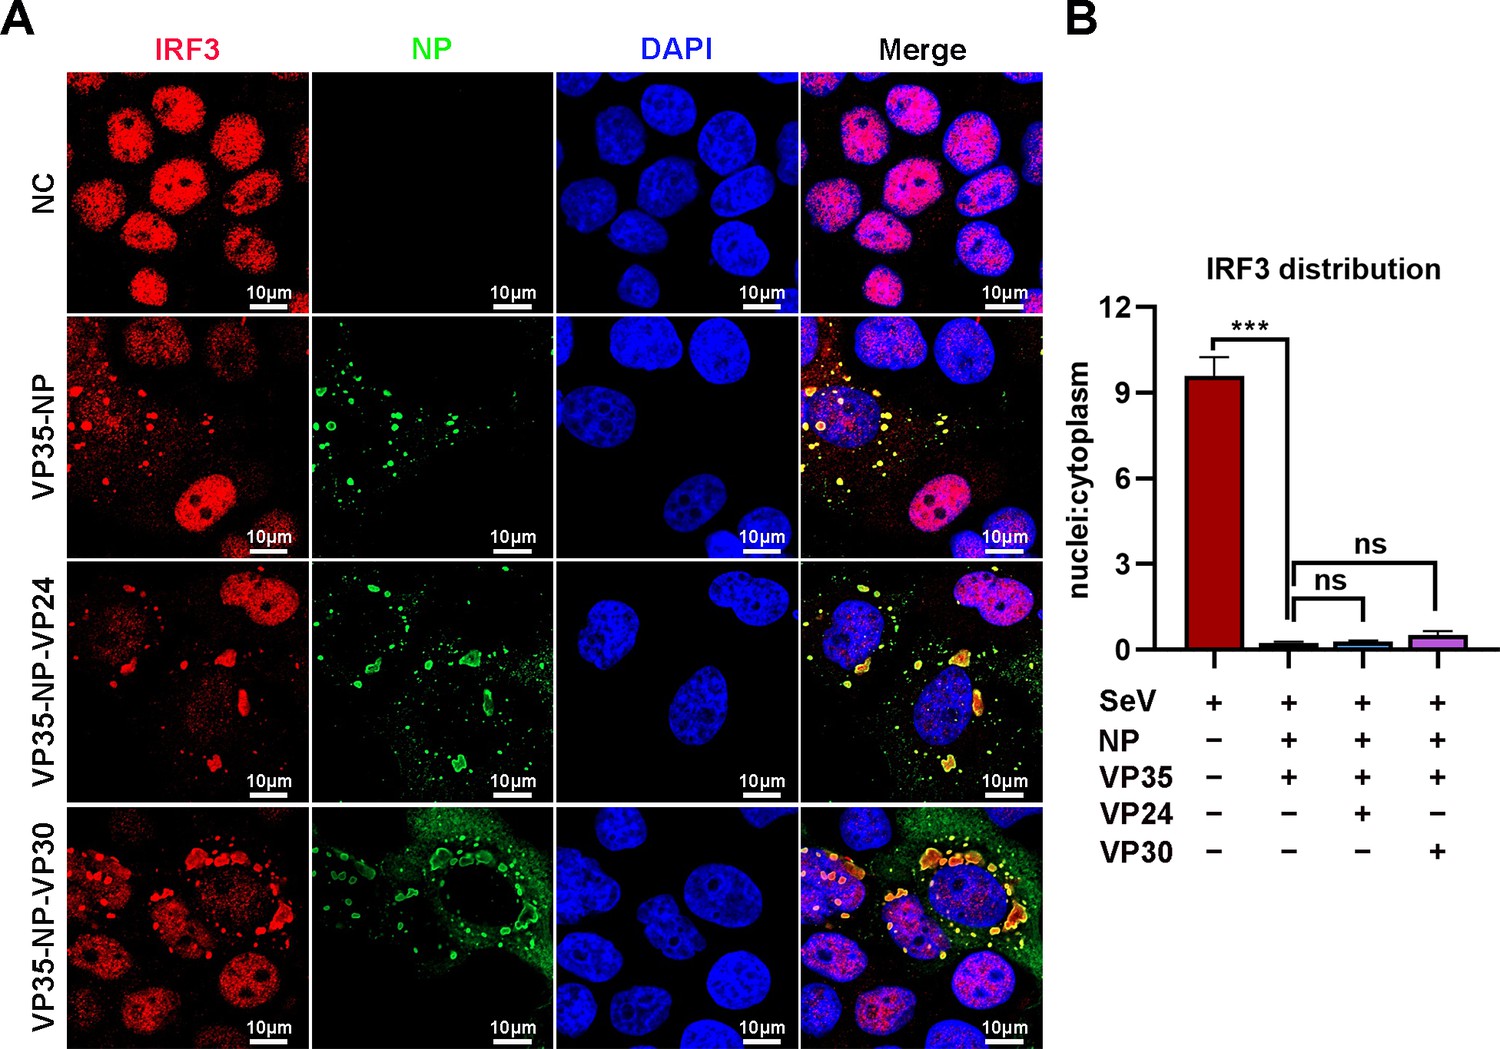
Neither VP24 nor VP30 plays an important role in sequestering interferon regulatory factor 3 (IRF3) into inclusion bodies (IBs).
(A) HepG2 cells were transfected with the indicated plasmids for 36 hr, and the cells were infected with Sendai virus (SeV) at an MOI of 2 for another 12 hr. The cells were then fixed and immunostained with anti-IRF3 (red) and anti-NP (green) antibodies. Nuclei were stained with DAPI (blue), and images were obtained using a Zeiss LSM 800 Meta confocal microscope. Scale bar, 10 μm. (B) The nuclear/cytoplasmic distribution of IRF3 in (A) was analyzed using ImageJ software. Differences between the two groups were evaluated using a two-sided unpaired Student’s t-test. The ratio of IRF3 distribution in at least five cells from two independent assays is presented as the mean ± standard error of the mean (SEM; n = 5; ns, not significant, ***p < 0.001).
-
Figure 5—figure supplement 2—source data 1
Raw image for Figure 5—figure supplement 2B.
- https://cdn.elifesciences.org/articles/88122/elife-88122-fig5-figsupp2-data1-v1.zip
Figure 6 with 1 supplement
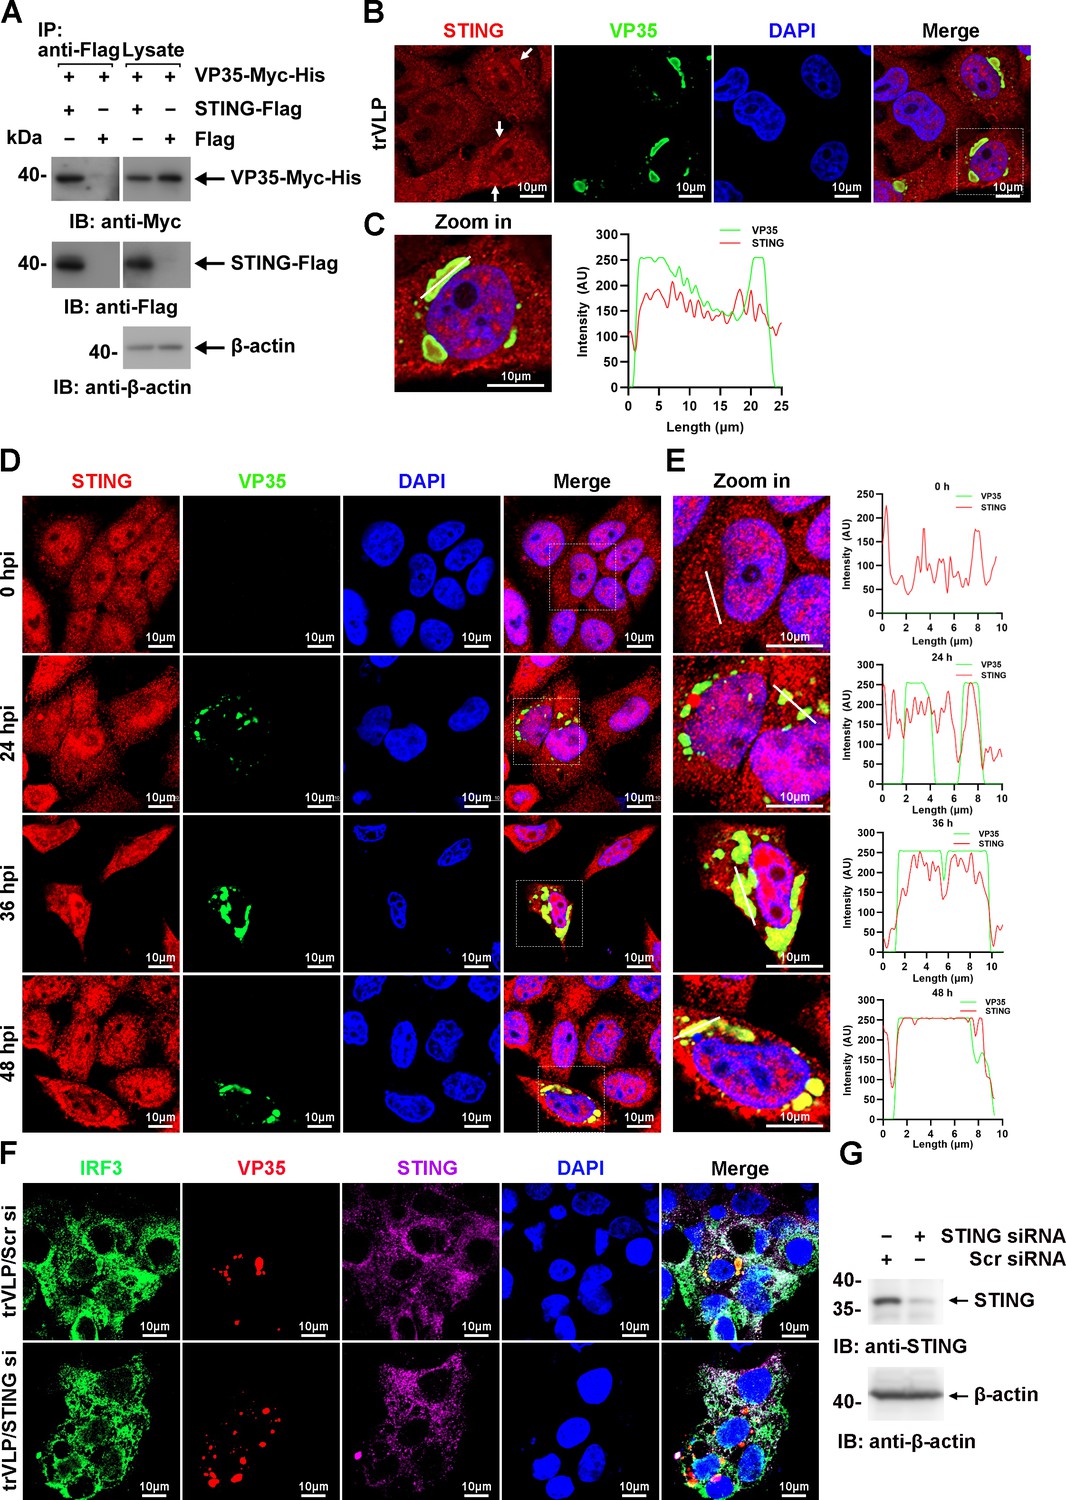
Ebola virus (EBOV) transcription- and replication-competent virus-like particles (trVLPs) recruit interferon regulatory factor 3 (IRF3) into viral inclusion bodies (IBs) via STING.
(A) Lysates of HEK293 cells transfected with the indicated plasmids were subjected to anti-Flag immunoprecipitation and analyzed by immunoblotting. (B) HepG2 cells were transfected with the EBOV minigenome (p0). Forty-eight hours after infection, the cells were fixed and immunostained with anti-STING (red) and anti-VP35 (green) antibodies. White arrows: STING in IBs. Nuclei were stained with DAPI (blue), and images were obtained using a Zeiss LSM 800 Meta confocal microscope. Scale bar, 10 μm. (C) The left panel shows a magnified image of the IBs boxed in the merged panel of (B). The graphs (right panel) show the fluorescent intensity profiles along the indicated white lines drawn across one or more IBs. (D) HepG2 cells were infected with the EBOV trVLPs. At the indicated hours post infection (hpi), cells were fixed and immunostained with anti-STING (red) and anti-VP35 (green) antibodies. Nuclei were stained with DAPI (blue), and images were obtained using a Zeiss LSM 800 Meta confocal microscope. Scale bar, 10 μm. The data from two independent replicates are presented. (E) The left panel shows a magnified image of the IBs boxed in the merged panel of (D). The graphs (right panel) show fluorescent intensity profiles along the indicated white lines drawn across one or more IBs. (F, G) HepG2 cells were transfected with STING siRNA (STING si) or scrambled siRNA (Scr si) for 6 hr. The cells were then infected with the EBOV trVLPs for 36 hr and then immunostained with Fluor 488-conjugated-anti-IRF3 (green), anti-VP35 (red), and anti-STING (purple) antibodies. Nuclei were stained with DAPI (blue), and images were obtained using a Zeiss LSM 800 Meta confocal microscope. Scale bar, 10 μm. The silencing efficiency of STING siRNA was determined by immunoblotting (G).
-
Figure 6—source data 1
Raw image for Figure 6A.
- https://cdn.elifesciences.org/articles/88122/elife-88122-fig6-data1-v1.zip
-
Figure 6—source data 2
Numerical data for Figure 6C.
- https://cdn.elifesciences.org/articles/88122/elife-88122-fig6-data2-v1.zip
-
Figure 6—source data 3
Numerical data for Figure 6E.
- https://cdn.elifesciences.org/articles/88122/elife-88122-fig6-data3-v1.zip
-
Figure 6—source data 4
Raw image for Figure 6G.
- https://cdn.elifesciences.org/articles/88122/elife-88122-fig6-data4-v1.zip
Figure 6—figure supplement 1
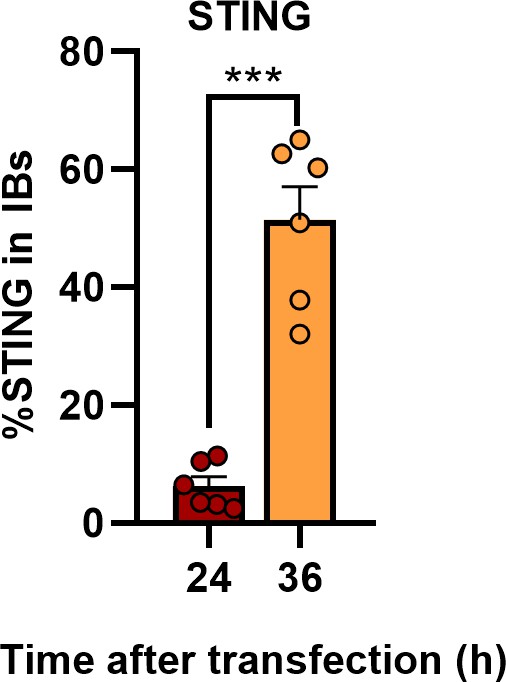
Ebola virus (EBOV) transcription- and replication-competent virus-like particles (trVLPs) recruit STING into viral inclusion bodies (IBs).
The percentage of STING distribution in IBs at different time points in cells infected with EBOV trVLPs in Figure 6D was analyzed with R programming language. The intensity of STING in six cells from two independent assays is presented as the mean ± standard error of the mean (SEM; n = 6; ***p < 0.001).
-
Figure 6—figure supplement 1—source data 1
Numerical data for Figure 6—figure supplement 1.
- https://cdn.elifesciences.org/articles/88122/elife-88122-fig6-figsupp1-data1-v1.zip
Figure 7 with 1 supplement
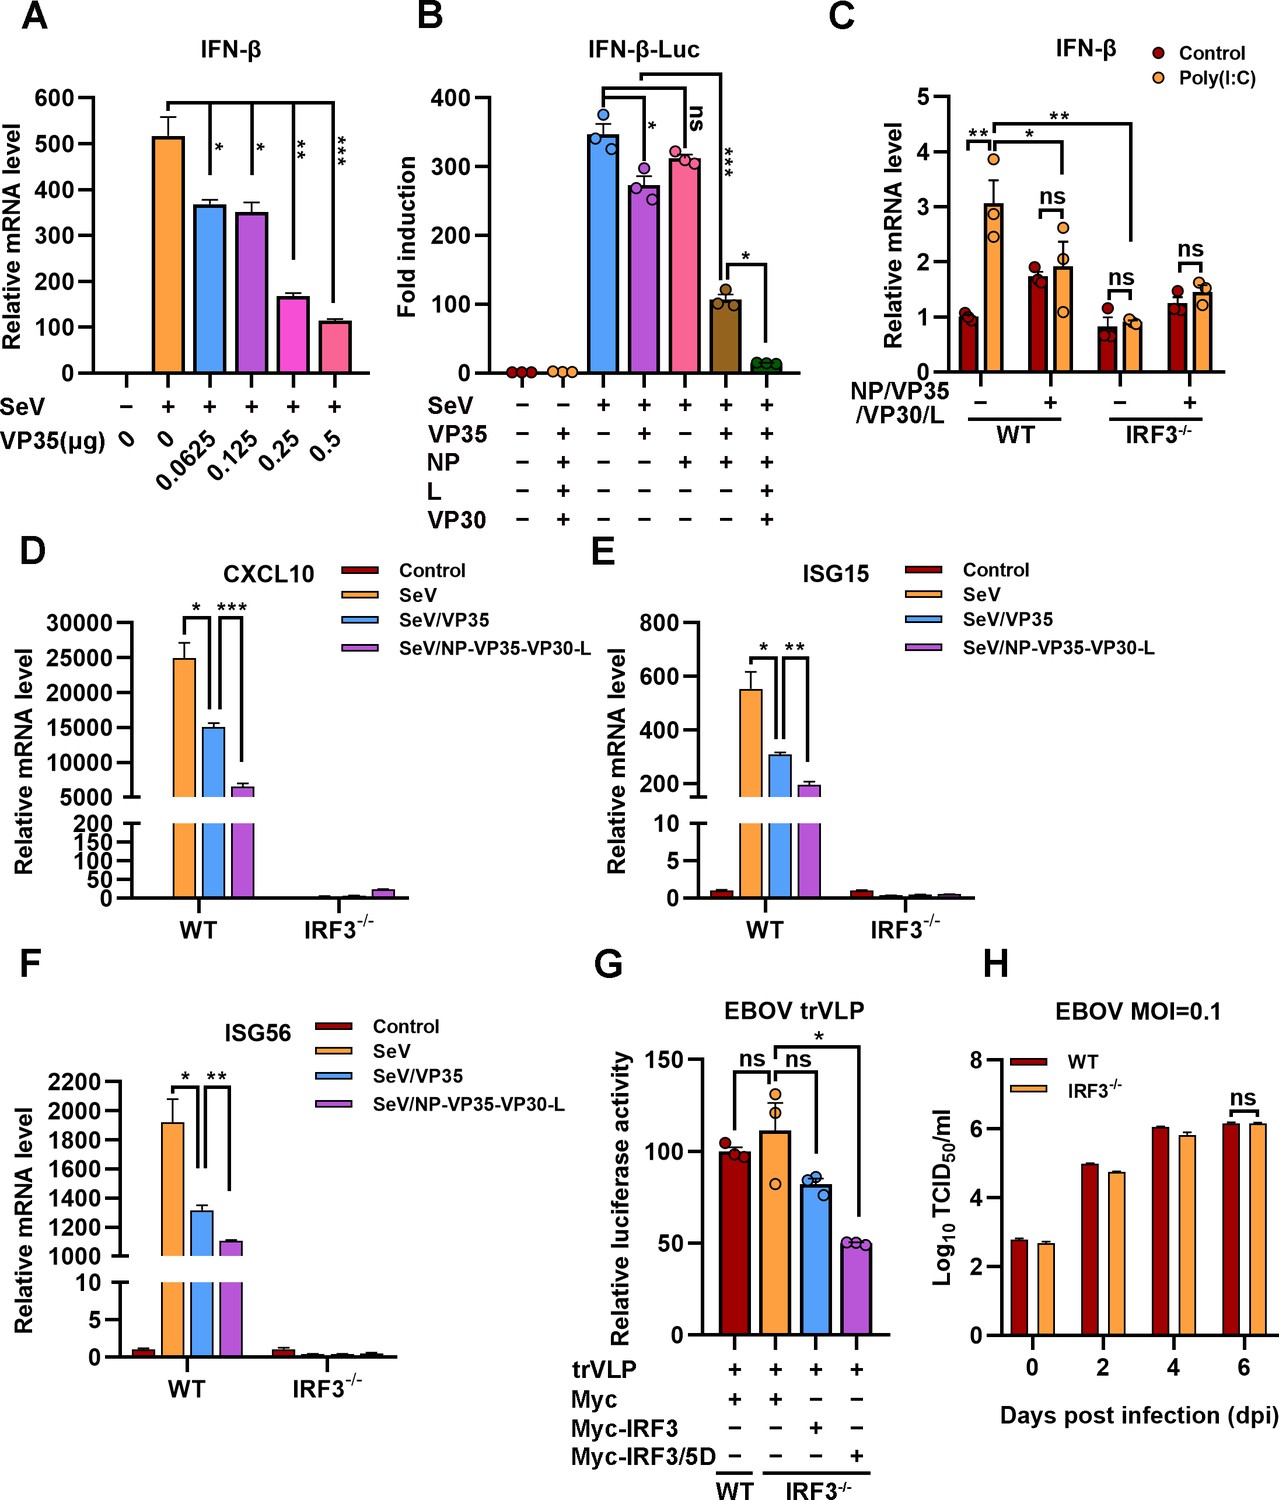
The hijacking of interferon regulatory factor 3 (IRF3) by viral inclusion bodies (IBs) inhibits IFN-β production.
(A) HEK293 cells were transfected with the indicated plasmids for 24 hr, and the cells were infected with or without Sendai virus (SeV) at an MOI of 2 for another 12 hr. The mRNA level of IFN-β was quantified by quantitative RT-PCR (qRT-PCR). Differences between the two groups were evaluated by a two-sided unpaired Student’s t-test. The data are presented as the means ± standard error of the mean (SEM; n=3; *p < 0.05, **p < 0.01, ***p < 0.001). (B) HEK293 cells were cotransfected with the firefly luciferase reporter plasmid pGL3-IFN-β-Luc, the Renilla luciferase control plasmid pRL-TK, and viral protein expression plasmids (0.0625 μg of pCAGGS-NP, 0.0625 μg of pCAGGS-VP35, 0.0375 μg of pCAGGS-VP30, and 0.5 μg of pCAGGS-L) for 24 hr, and the cells were infected with or without SeV at an MOI of 2 for another 12 hr. The luciferase activities were then analyzed. The data were analyzed to determine the fold induction by normalizing the firefly luciferase activity to the Renilla luciferase activity. Empty plasmid without SeV infection was used as a control, and the corresponding data point was set to 100%. Differences between the two groups were evaluated using a two-sided unpaired Student’s t-test. The data are presented as the means ± SEM (n=3; ns, not significant, *p < 0.05, ***p < 0.001). (C) Wild-type (WT) and IRF3-depleted (IRF3−/−) HeLa cells were transfected with or without pCASSG-NP, pCASSG-VP35, pCASSG-VP30, and pCASSG-L plasmids for 36 hr and then treated with or without 5 μg/ml poly(I:C) for 12 hr. The mRNA level of IFN-β was quantified by qRT-PCR. Differences between the two groups were evaluated using a two-sided unpaired Student’s t-test. The data are presented as the means ± SEM (n=3; ns, not significant, *p < 0.05). (D–F) Wild-type (WT) and IRF3-depleted (IRF3−/−) HeLa cells were transfected with or without pCAGGS-VP35 or pCASSG-NP, pCASSG-VP35, pCASSG-VP30, and pCASSG-L plasmids for 36 hr, and the cells were infected with or without SeV at an MOI of 5 for another 12 hr. The mRNA level of CXCL10 (D), ISG15 (E), and ISG56 (F) was quantified by qRT-PCR. Differences between the two groups were evaluated using a two-sided unpaired Student’s t-test. The data are presented as the means ± SEM (n=3; *p < 0.05, **p < 0.01, ***p < 0.001). (G) Wild-type (WT) and IRF3-knockout (IRF3−/−) HeLa cells were transfected with the Ebola virus (EBOV) minigenome (p0), pGL3-promoter and Myc-vector, Myc-IRF3 or Myc-IRF3/5D plasmids for 96 hr. The amounts of transcription- and replication-competent virus-like particles (trVLPs) were determined by a luciferase activity assay (left panel). Differences between the two groups were evaluated by a two-sided unpaired Student’s t-test. The data are presented as the means ± SEM (n=3; ns, not significant, ***p < 0.001). (H) Wild-type (WT) and IRF3-knockout (IRF3−/−) HeLa cells were infected with live EBOV (MOI = 0.1). The cell culture supernatants were collected on the indicated days post infection (dpi), and the viral titers were quantified as TCID50 by a plaque assay. Differences between the two groups were evaluated using a two-sided unpaired Student’s t-test. The data are presented as the means ± SEM (n=3; ns, not significant).
-
Figure 7—source data 1
Numerical data for Figure 7A.
- https://cdn.elifesciences.org/articles/88122/elife-88122-fig7-data1-v1.zip
-
Figure 7—source data 2
Numerical data for Figure 7B.
- https://cdn.elifesciences.org/articles/88122/elife-88122-fig7-data2-v1.zip
-
Figure 7—source data 3
Numerical data for Figure 7C.
- https://cdn.elifesciences.org/articles/88122/elife-88122-fig7-data3-v1.zip
-
Figure 7—source data 4
Numerical data for Figure 7D.
- https://cdn.elifesciences.org/articles/88122/elife-88122-fig7-data4-v1.zip
-
Figure 7—source data 5
Numerical data for Figure 7E.
- https://cdn.elifesciences.org/articles/88122/elife-88122-fig7-data5-v1.zip
-
Figure 7—source data 6
Numerical data for Figure 7F.
- https://cdn.elifesciences.org/articles/88122/elife-88122-fig7-data6-v1.zip
-
Figure 7—source data 7
Numerical data for Figure 7G.
- https://cdn.elifesciences.org/articles/88122/elife-88122-fig7-data7-v1.zip
-
Figure 7—source data 8
Numerical data for Figure 7H.
- https://cdn.elifesciences.org/articles/88122/elife-88122-fig7-data8-v1.zip
Figure 7—figure supplement 1
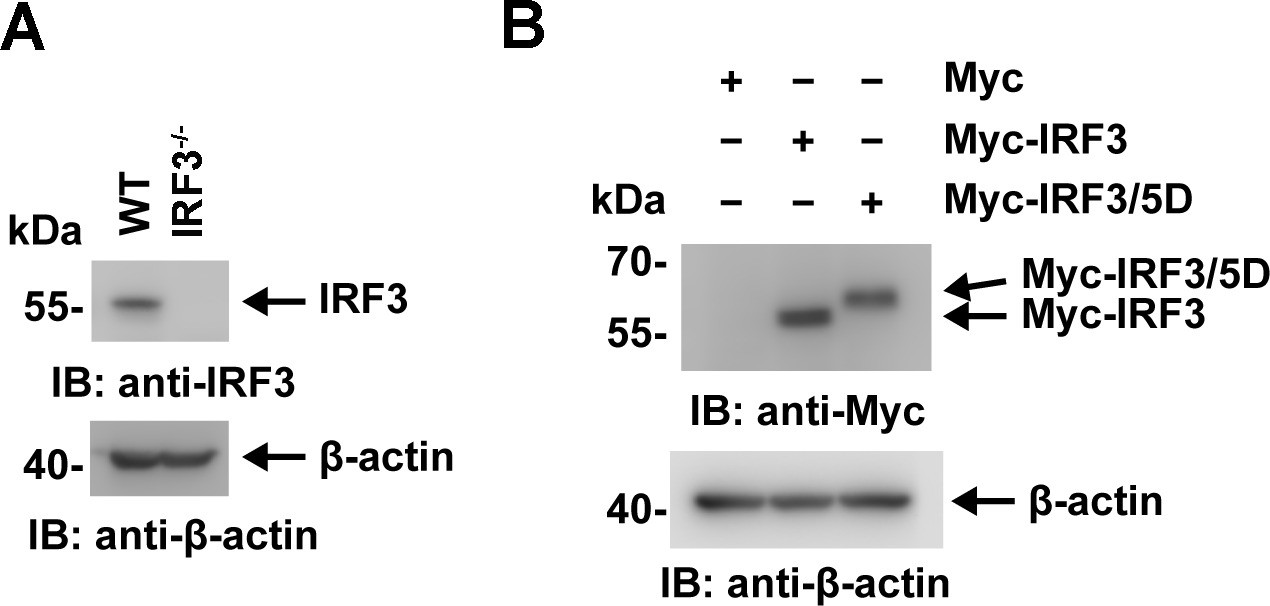
The expression of interferon regulatory factor 3 (IRF3) and its mutants were detected by immunoblotting.
(A) Lysates of WT and IRF3−/− HeLa cells were analyzed by immunoblotting with an anti-IRF3 antibody. (B) Lysates of HeLa cells transfected with Myc-vector, Myc-IRF3 or Myc-IRF3/5D were analyzed by immunoblotting with the indicated antibodies.
-
Figure 7—figure supplement 1—source data 1
Raw image for Figure 7—figure supplement 1A.
- https://cdn.elifesciences.org/articles/88122/elife-88122-fig7-figsupp1-data1-v1.zip
-
Figure 7—figure supplement 1—source data 2
Raw image for Figure 7—figure supplement 1B.
- https://cdn.elifesciences.org/articles/88122/elife-88122-fig7-figsupp1-data2-v1.zip
Figure 8
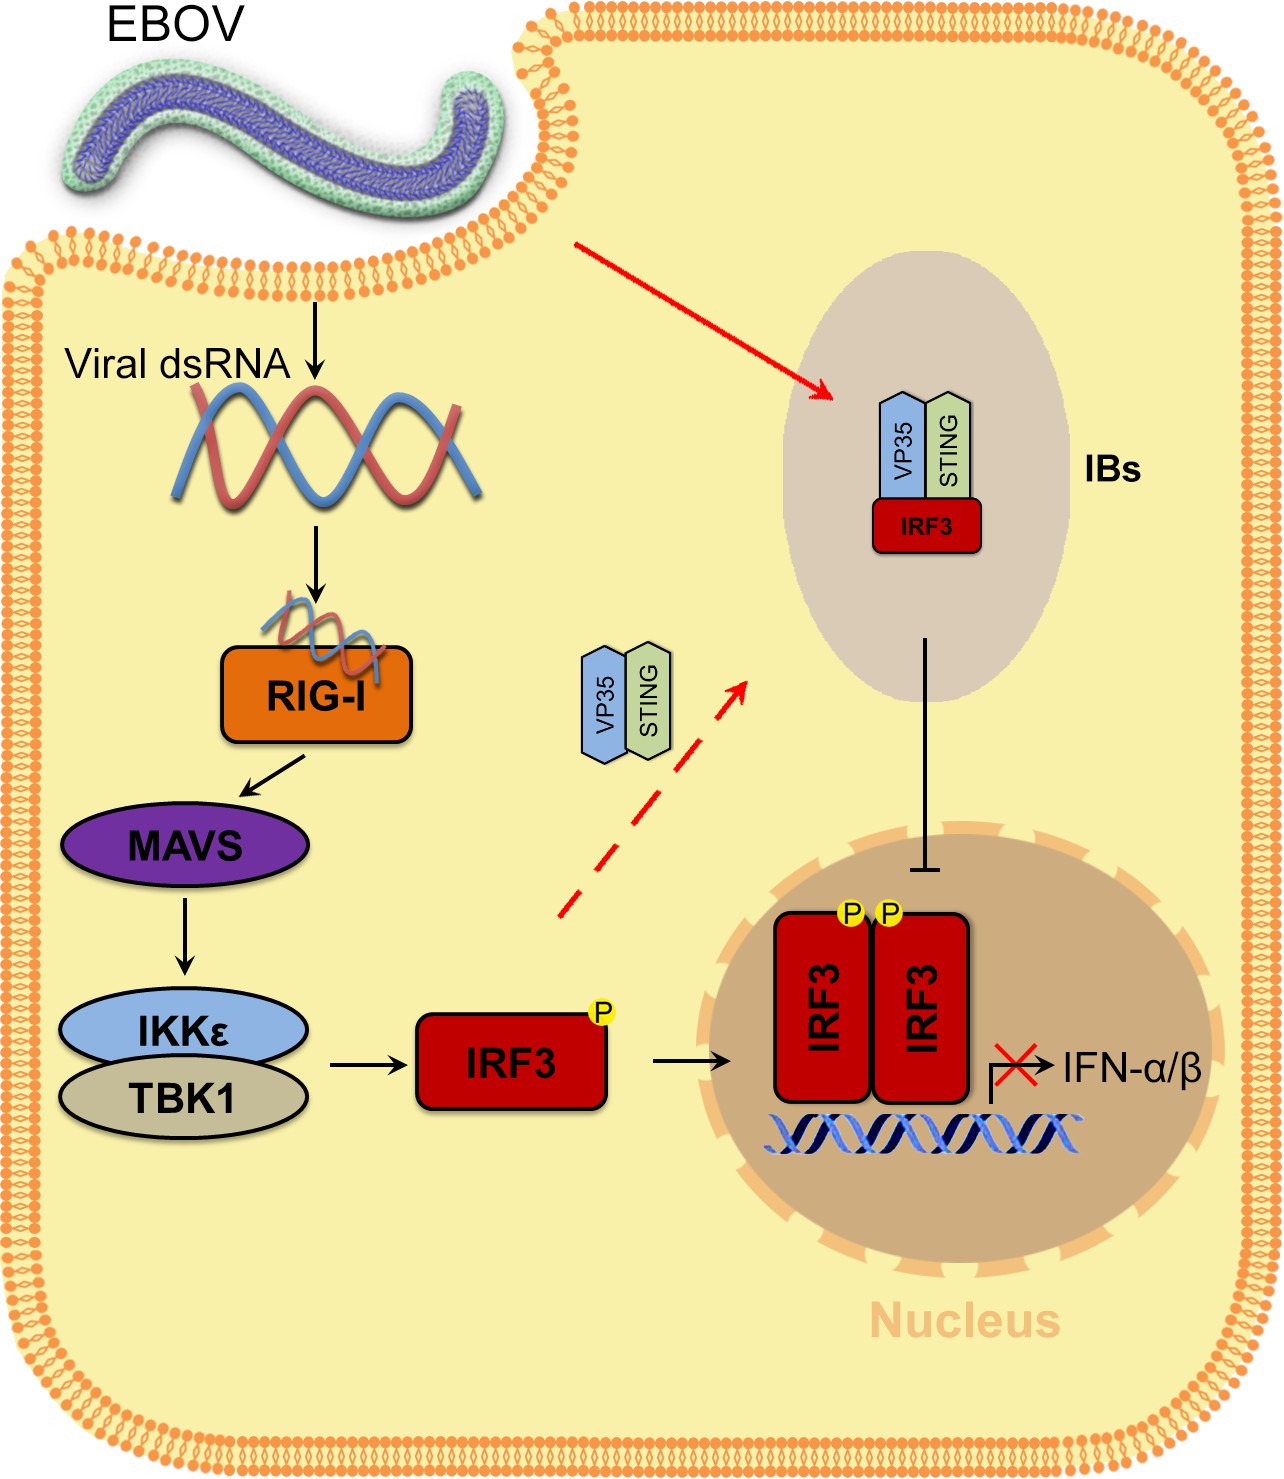
Model of the molecular mechanism by which EBOV hijacks IRF3 into viral IBs through VP35-STING to comprehensively disrupt IFN-I production.
VP35 sequesters IRF3 to EBOV IBs, which in turn spatially segregates IRF3 from TANK-binding kinase 1 (TBK1) and IκB kinase epsilon (IKKε), blocks RLR signaling and inhibits IFN-I production.
Tables
Key resources table
| Reagent type (species) or resource | Designation | Source or reference | Identifiers | Additional information |
|---|---|---|---|---|
| Strain, strain background (Escherichia coli) | DH5α E. coli | TIANGEN | Cat# CB101 | Competent cells |
| Strain, strain background (Sendai virus) | SeV | ther | Provided by Changchun Veterinary Research Institute | |
| Strain, strain background (Ebola virus) | Ebola virus (Mayinga strain) | ther | Provided by National Biosafety Laboratory, Chinese Academy of Sciences | |
| Cell line (Homo sapiens) | IRF3-knockout HeLa cells (normal, adult) | Abclonal | Cat# RM02113 | |
| Antibody | anti-Flag M2 affinity Gel (Rabbit polyclonal) | Sigma-Aldrich | Cat# F2426; RRID:AB_2616449 | IP (1:50) |
| Antibody | anti-c-Myc affinity Gel (Mouse monoclonal) | Sigma-Aldrich | Cat# E6654; RRID:AB_10093201 | IP (1:50) |
| Antibody | HRP-conjugated anti-Flag antibody (Mouse monoclonal) | Sigma-Aldrich | Cat# A8592; RRID:AB_439702 | WB (1:4000) |
| Antibody | HRP-conjugated anti-c-Myc antibody (Mouse monoclonal) | Sigma-Aldrich | Cat# SAB4200742 | WB (1:2000) |
| Antibody | HRP-conjugated anti-β-Actin antibody (Mouse monoclonal) | Sigma-Aldrich | Cat# A3854; RRID:AB_262011 | WB (1:20,000) |
| Antibody | anti-Zaire Ebola virus VP35 antibody (Mouse monoclonal) | Creative Diagnostics | Cat# CABT-B292 | IF (1:50); WB (1:1000) |
| Antibody | anti-IRF3 antibody (Rabbit monoclonal) | Cell Signaling Technology | Cat# 11904; RRID:AB_2722521 | IF (1:50); WB (1:1000) |
| Antibody | anti-phospho-IRF3 (Ser396) antibody (Rabbit monoclonal) | Cell Signaling Technology | Cat# 29047; RRID:AB_2773013 | IB (1:500) |
| Antibody | anti-IRF3 antibody (Mouse monoclonal) | Cell Signaling Technology | Cat# 10949; RRID:AB_2797733 | IF (1:50) |
| Antibody | CoraLite Plus 488-conjugated IRF3 antibody (Rabbit polyclonal) | Proteintech | Cat# CL488-11312; RRID:AB_2919025 | IF (1:50) |
| Antibody | anti-TBK1 antibody (Rabbit monoclonal) | Abcam | Cat# ab40676; RRID:AB_776632 | IF (1:100) |
| Antibody | anti-TBK1 antibody (Rabbit monoclonal) | Cell Signaling Technology | Cat# 38066; RRID:AB_2827657 | IF (1:100) |
| Antibody | anti-IKKε antibody (Rabbit monoclonal) | Abcam | Cat# ab7891; RRID:AB_2124814 | IF (1:100) |
| Antibody | anti-STING antibody (Rabbit polyclonal) | Proteintech | Cat# 19851-1-AP; RRID:AB_10665370 | WB (1:1000) |
| Antibody | anti-STING antibody (Rabbit polyclonal) | Bioss | Cat# bs-8335R | IF (1:50) |
| Antibody | anti-Zaire Ebola virus NP antibody (Rabbit polyclonal) | Sino Biological | Cat# 40443-T62 | WB (1:1000) |
| Recombinant DNA reagent | Flag-VP35; Flag-NP (plasmid) | DOI: 10.1038/s41467-022-29948-4 | ||
| Recombinant DNA reagent | STING-Flag (plasmid) | Miaoling biology | Cat# P39762 | Flag-tagged of pCMV-vector (STING: NM_198282.4) |
| Recombinant DNA reagent | Flag-TBK1 (plasmid) | This paper | Synthesized by General Biol | Flag-tagged of pCDNA3.0-vector (TBK1: NM_013254.4) |
| Recombinant DNA reagent | Myc-IRF3 (plasmid) | This paper | Synthesized by General Biol | Myc-tagged of pCMV-vector (IRF3: NM_013254.4) |
| Recombinant DNA reagent | Myc-IRF3/5D (plasmid) | This paper | Synthesized by General Biol | The amino acids of IRF3 at S396, S398, S402, T404, and S405 were mutated to D |
| Recombinant DNA reagent | VP35-Myc-His (plasmid) | This paper | Synthesized by General Biol | Myc-tagged of pCMV-vector |
| Recombinant DNA reagent | pCAGGS-VP35; pCAGGS-NP; pCAGGS-VP30; pCAGGS-L; pCAGGS-T7; pCAGGS-Tim1; p4cis-vRNA-RLuc (plasmid) | DOI: 10.3791/52381 | ||
| Recombinant DNA reagent | pRL-TK vector (plasmid) | Promega | Cat# E2241 | |
| Recombinant DNA reagent | pGL3-IFNβ-Luc (plasmid) | This paper | pGL3-basic vector | |
| Recombinant DNA reagent | pGL3-Promoter (plasmid) | Youbio | Cat# VT1726 | |
| Sequence-based reagent | STING siRNA- sense | This paper | Synthesized by Tsingke Biotechnology | GCACCUGUGUCCUGGAGUATT |
| Sequence-based reagent | STING siRNA- anti-sense | This paper | Synthesized by Tsingke Biotechnology | UACUCCAGGACACAGGUGCTT |
| Sequence-based reagent | siRNA: nontargetin control-sense | This paper | Synthesized by Tsingke Biotechnology | UUCUCCGAACGUGUCACGUTT |
| Sequence-based reagent | siRNA: nontargetin control-anti-sense | This paper | Synthesized by Tsingke Biotechnology | ACGUGACACGUUCGGAGAATT |
| Sequence-based reagent | h-IFN-β-F | This paper | qPCR primers | AGGACAGGATGAACTTTGAC |
| Sequence-based reagent | h-IFN-β-R | This paper | qPCR primers | TGATAGACATTAGCCAGGAG |
| Sequence-based reagent | h-CXCL10-F | This paper | qPCR primers | TCCCATCACTTCCCTACATG |
| Sequence-based reagent | h- CXCL10-R | This paper | qPCR primers | TGAAGCAGGGTCAGAACATC |
| Sequence-based reagent | h-ISG15-F | This paper | qPCR primers | TCCTGGTGAGGAATAACAAGGG |
| Sequence-based reagent | h-ISG15-R | This paper | qPCR primers | CTCAGCCAGAACAGGTCGTC |
| Sequence-based reagent | h-ISG56-F | This paper | qPCR primers | TCGGAGAAAGGCATTAGATC |
| Sequence-based reagent | h-ISG56-R | This paper | qPCR primers | GACCTTGTCTCACAGAGTTC |
| Sequence-based reagent | h-GAPDH-F | This paper | qPCR primers | AAggTCATCCCTgAgCTgAAC |
| Sequence-based reagent | h-GAPDH-R | This paper | qPCR primers | ACgCCTgCTTCACCACCTTCT |
| Commercial assay or kit | ReverTra Ace qPCR RT Master Mix with gDNA Remover | TOYOBO | Cat# FSQ-301 | |
| Commercial assay or kit | SYBR Green Real-time PCR Master Mix | TOYOBO | Cat# QPK-201 | |
| Commercial assay or kit | Duolink in situ PLA reagent | Sigma-Aldrich | Cat# DUO92008 | |
| Commercial assay or kit | Dual-Luciferase Reporter Assay System | Promega | Cat# E1960 | |
| Software, algorithm | Prism 8.0 software | Graphpad | https://www.graphpad.com/scientific-software/prism/; | |
| Software, algorithm | ImageJ 1.48v software | National Institutes of Health | https://imagej.net/software/imagej/ | |
| Software, algorithm | QuantStudio 6 Flex multicolor real-time PCR Software | Applied Biosystems | ||
| Other | Mounting Medium with DAPI | Abcam | Ab104139 | DAPI is used for staining nuclei in immunofluorescence |
Additional files
Download links
A two-part list of links to download the article, or parts of the article, in various formats.
Downloads (link to download the article as PDF)
Open citations (links to open the citations from this article in various online reference manager services)
Cite this article (links to download the citations from this article in formats compatible with various reference manager tools)
Ebola virus sequesters IRF3 in viral inclusion bodies to evade host antiviral immunity
eLife 12:RP88122.
https://doi.org/10.7554/eLife.88122.3


