A synergistic workspace for human consciousness revealed by Integrated Information Decomposition
- Department of Clinical Neurosciences, University of Cambridge, United Kingdom
- University Division of Anaesthesia, School of Clinical Medicine, University of Cambridge, United Kingdom
- Department of Psychology, University of Cambridge, United Kingdom
- Center for Psychedelic Research, Department of Brain Science, Imperial College London, United Kingdom
- Center for Complexity Science, Imperial College London, United Kingdom
- Data Science Institute, Imperial College London, United Kingdom
- Department of Neurosciences, Cambridge University Hospitals NHS Foundation, Addenbrooke's Hospital, United Kingdom
- Wolfson Brain Imaging Centre, University of Cambridge, United Kingdom
- Division of Neurosurgery, School of Clinical Medicine, University of Cambridge, Addenbrooke's Hospital, United Kingdom
- Psychedelics Division - Neuroscape, Department of Neurology, University of California, United States
- Department of Psychology and Department of Physiology and Pharmacology, The Brain and Mind Institute, University of Western Ontario, Canada
- Trinity College Institute of Neuroscience, School of Psychology, Lloyd Building, Trinity College, Ireland
Figures
Figure 1
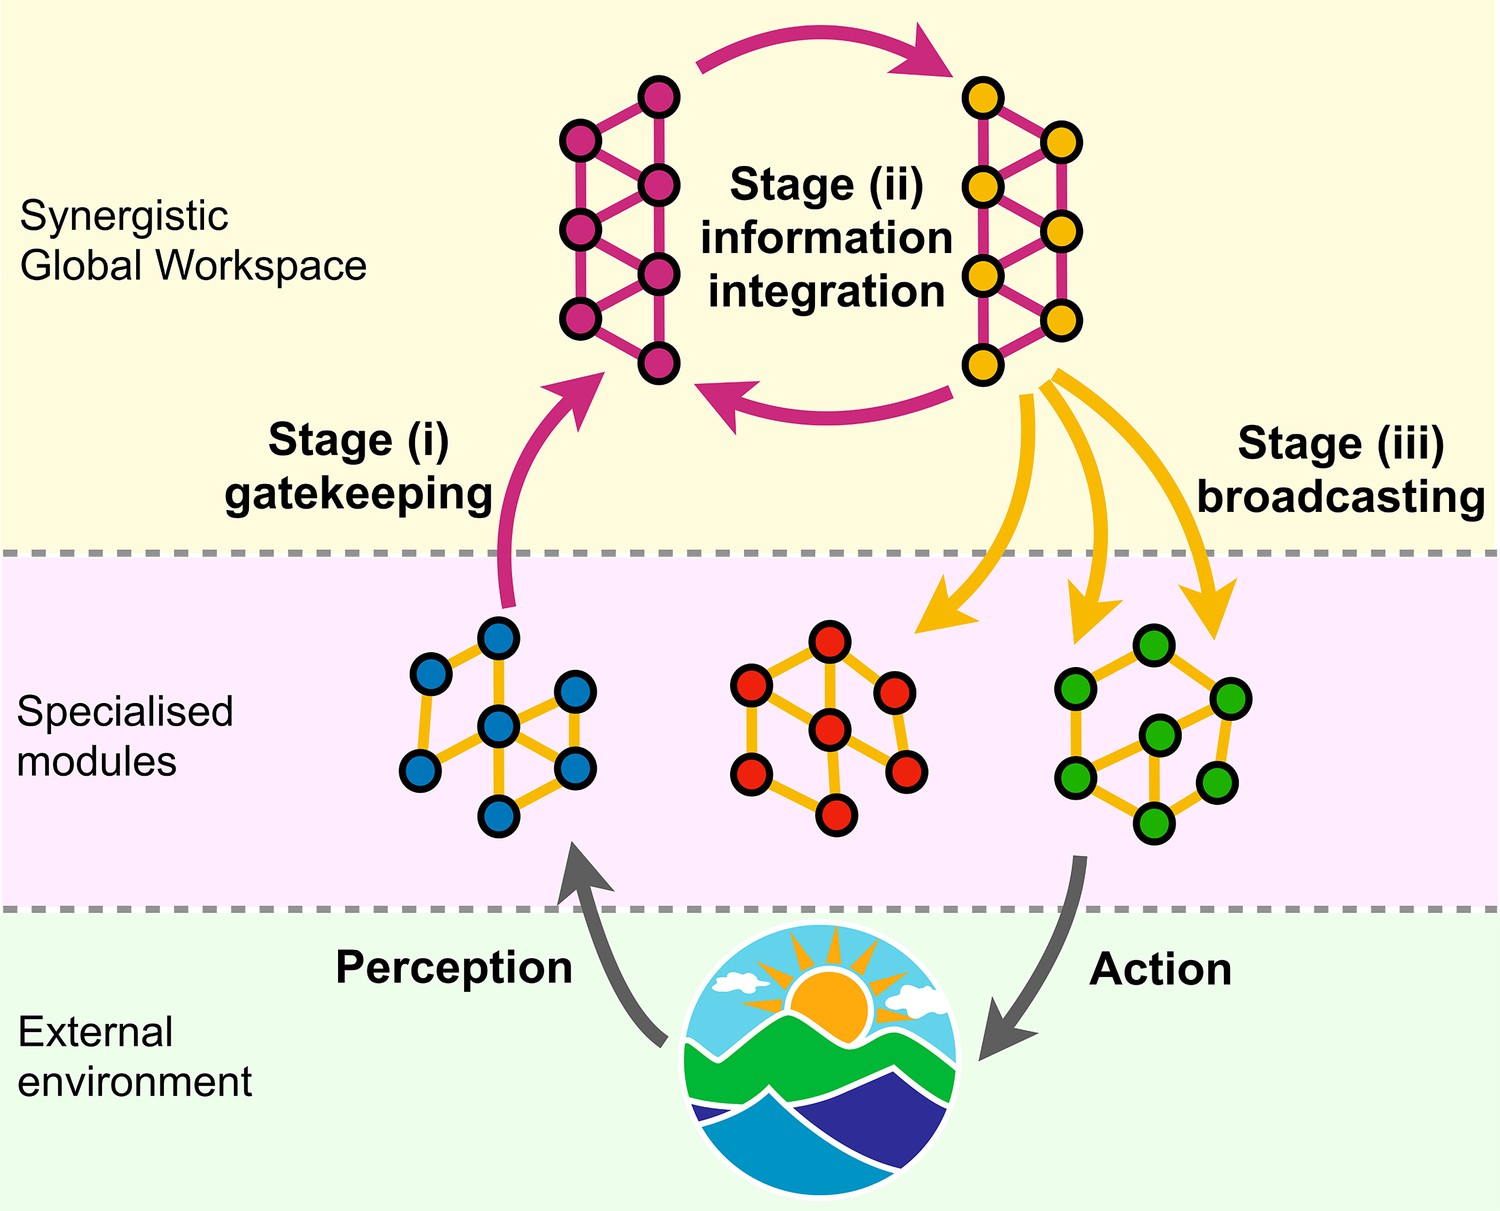
Schematic of the proposed SAPHIRE neurocognitive architecture.
Below, specialised modules characterised by robust redundant functional interactions process information about the environment. Information is then collected by workspace gateways through synergistic interactions [Stage (i)]; synergistic interactions integrate information within the synergistic global workspace [Stage (ii)]; workspace broadcasters spread the integrated information back to the specialised modules, through redundant interactions [Stage (iii)], for further processing and to guide behaviour. Orange links represent redundant interactions, and violet links represent synergistic interactions. Grey arrows represent interactions between the system and its environment.
Figure 2 with 3 supplements
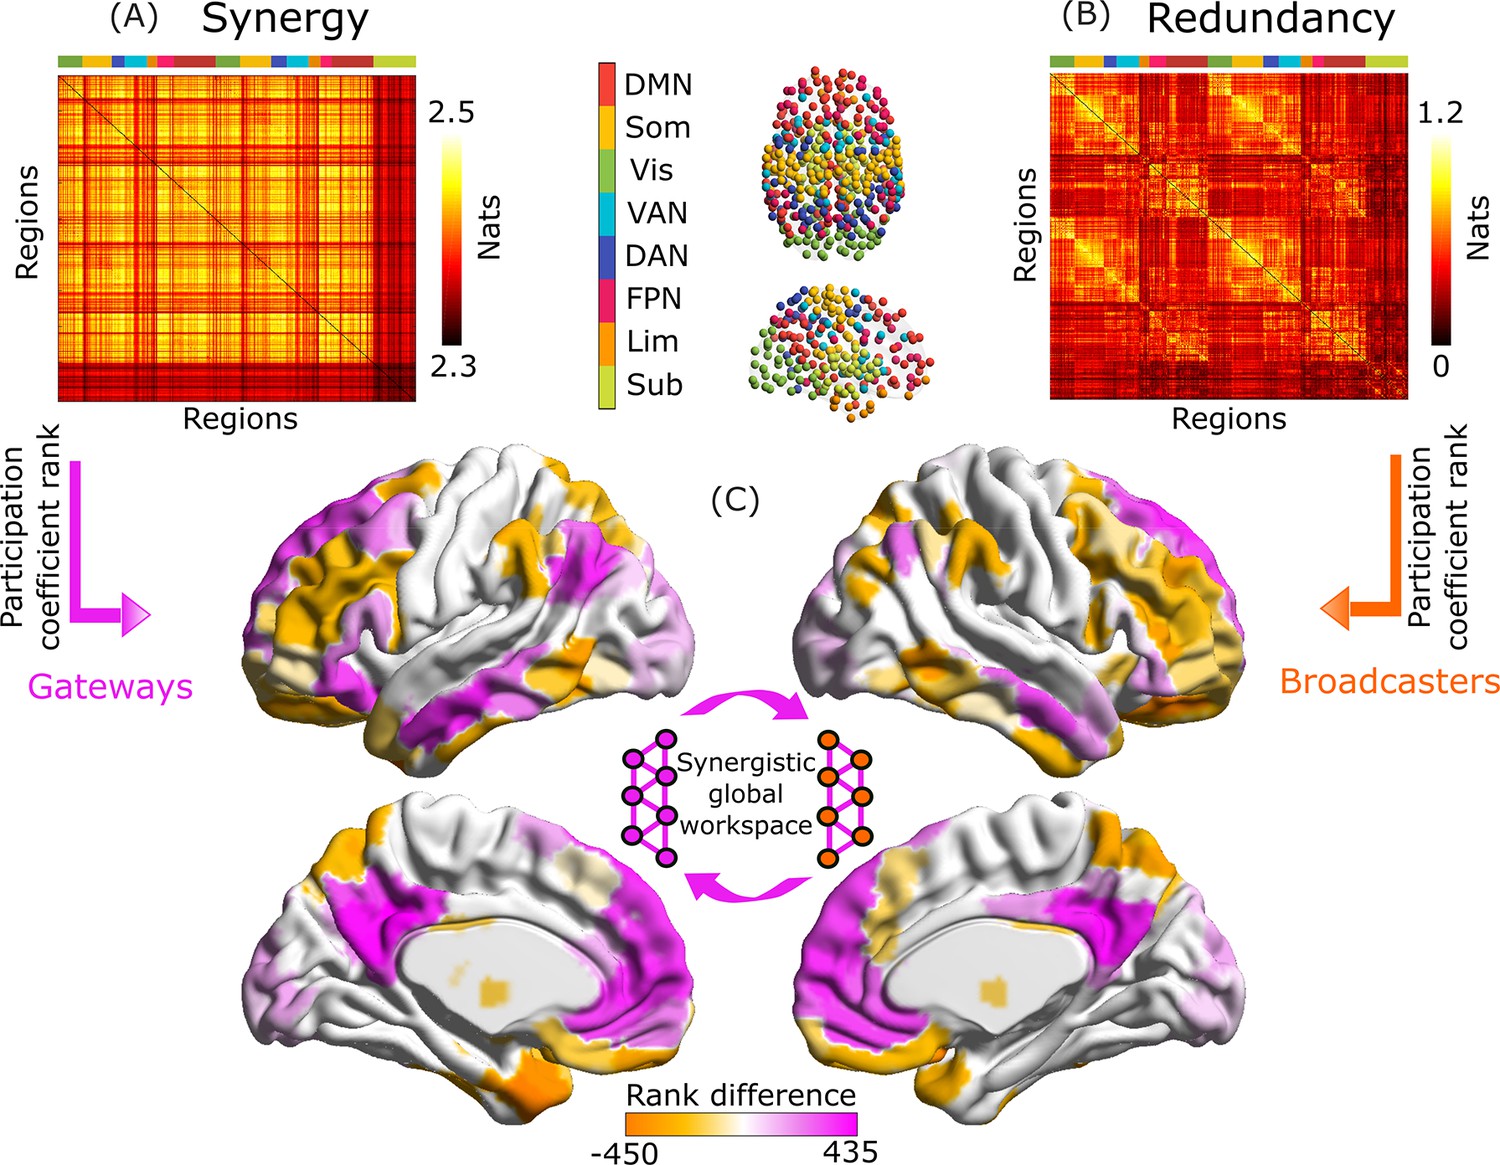
Gateways and broadcaster regions identified by their network connectivity profiles.
(A) Group-average matrix of synergistic interactions between regions of the 454-ROI augmented Schaefer atlas. (B) Group-average matrix of redundant interactions. For ease of visualization, the colorscale in (B) pertains to log-transformed values. We highlighted modular allegiance to the canonical resting-state networks by using the colour scheme shown in between A and B. (C) Regions are identified as gateways (violet) or broadcasters (orange) based on the difference between rank of participation coefficient for synergy and redundancy, (only shown for brain regions identified as belonging to the synergistic global workspace, as per Luppi et al., 2022b). Violet indicates synergy rank >redundancy rank, corresponding to workspace regions that combine information of many brain modules (gateways); orange indicates the opposite, identifying workspace regions that broadcast information to many modules. Inset: illustration of the synergistic workspace. Legend: DMN, default mode network. Som, somatomotor network. Vis, visual network. VAN, ventral attention network. DAN, dorsal attention network. FPN, fronto-parietal control network. Lim, limbic network. Sub, subcortical network (comprised of 54 regions of the atlas of Tian et al., 2020). These results were also replicated using an alternative parcellation with 232 cortical and subcortical nodes (Figure 2—figure supplement 3).
-
Figure 2—source data 1
Source data associated with Figure 2.
- https://cdn.elifesciences.org/articles/88173/elife-88173-fig2-data1-v1.xlsx
Figure 2—figure supplement 1
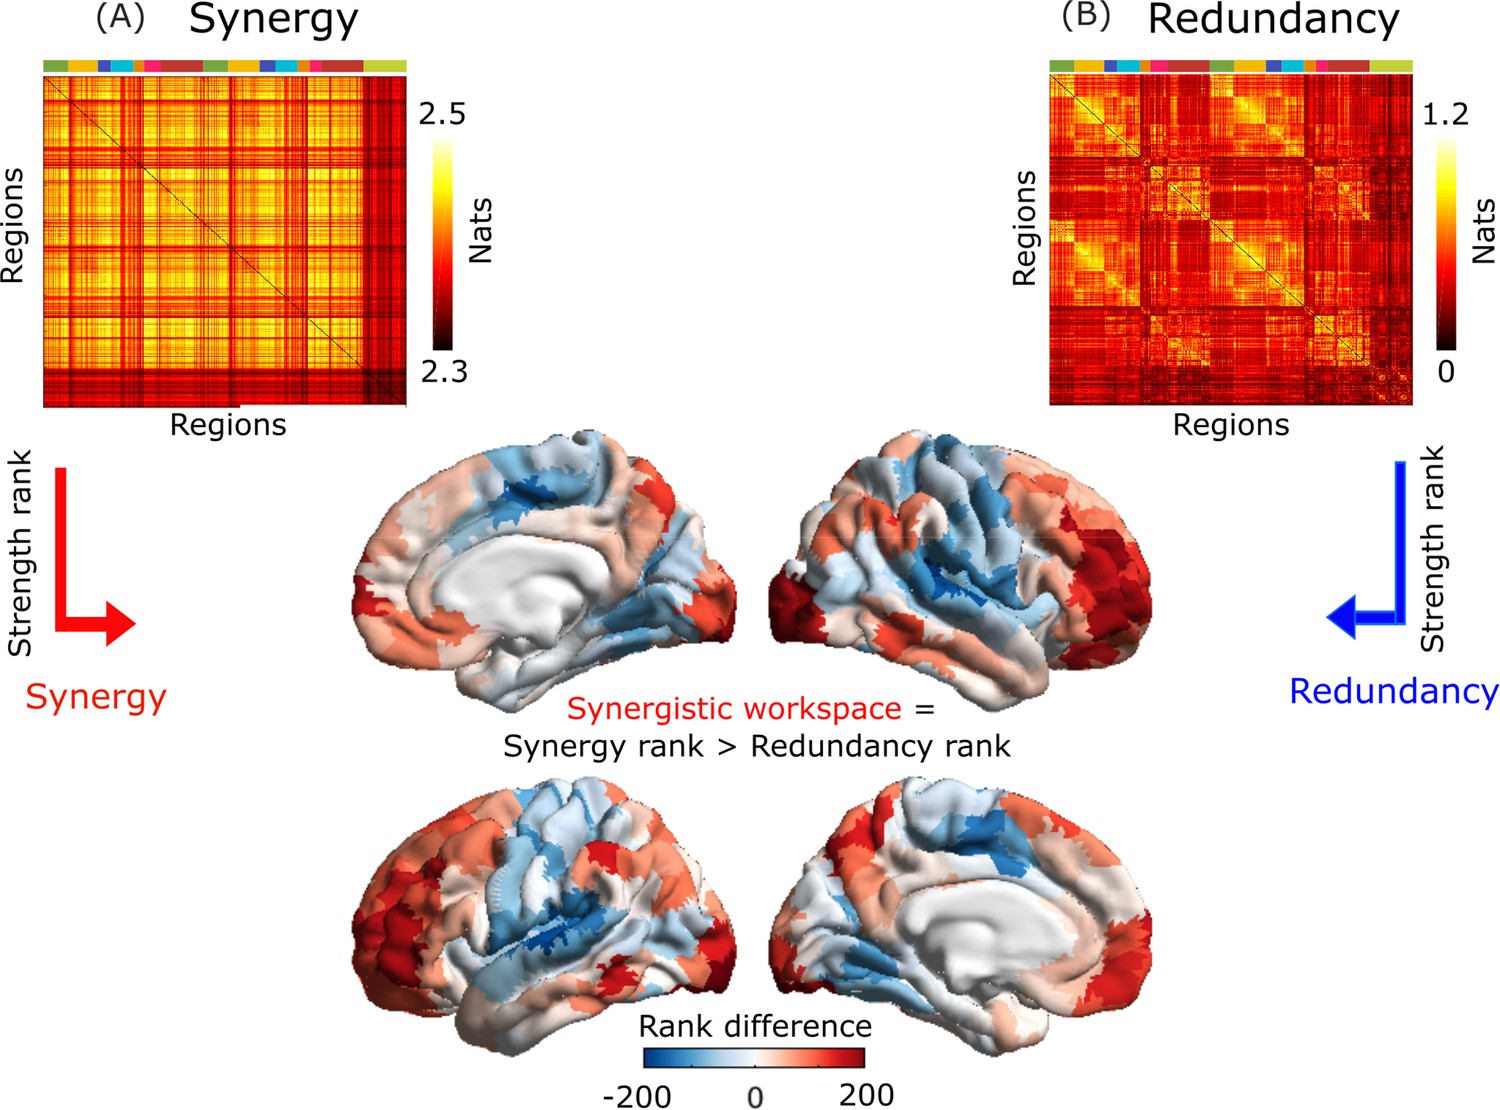
Identification of the synergistic workspace.
Following Luppi et al., 2022b, regions of the synergistic workspace (red) are identified as those regions whose rank, in terms of strength of synergy with the rest of the brain (A), is greater than the corresponding strength rank for redundancy (B).
Figure 2—figure supplement 2
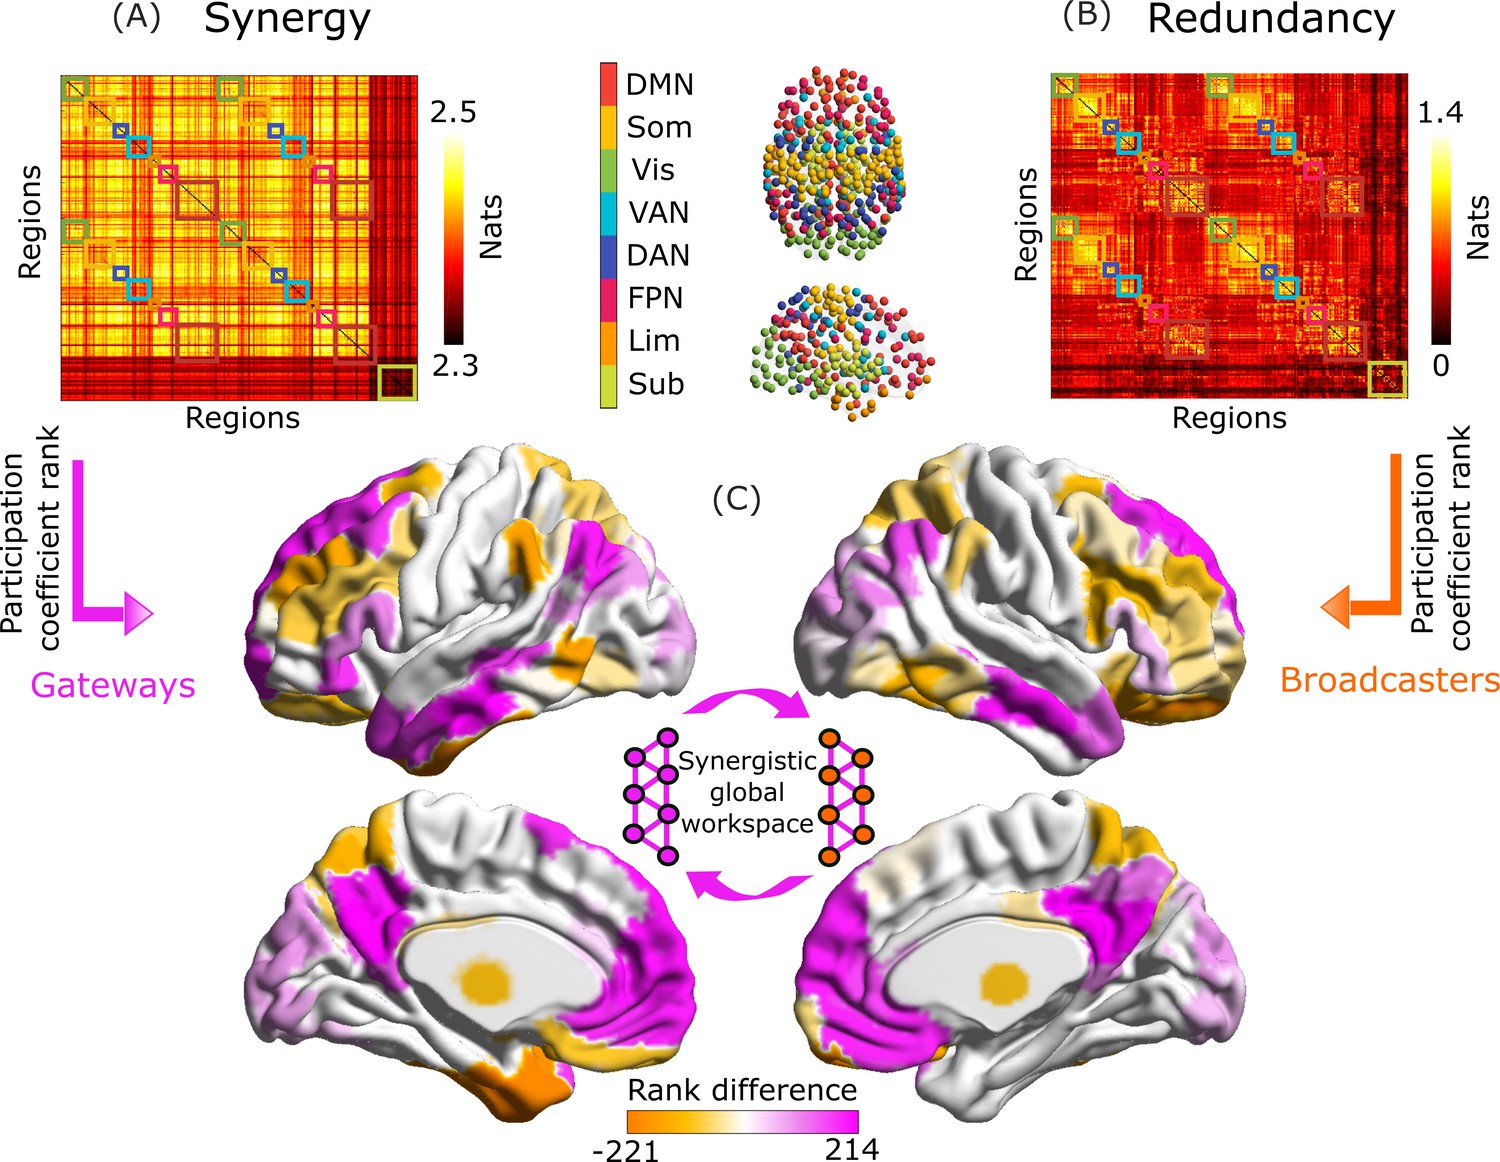
Identification of workspace gateways and broadcasters is robust to node definition.
(A) Group-average matrix of synergistic interactions between regions of the 232-ROI augmented Schaefer atlas. (B) Group-average matrix of redundant interactions in the Schaefer-232 atlas. (C) Regions of the 232-ROI augmented Schaefer atlas are identified as gateways (violet) or broadcasters (orange) based on the difference between rank of participation coefficient for synergy and redundancy, (only shown for brain regions identified as belonging to the synergistic global workspace, as per Luppi et al., 2022b). Violet indicates synergy rank >redundancy rank, corresponding to workspace regions that combine information of many brain modules (gateways); orange indicates the opposite, identifying workspace regions that broadcast information to many modules.
Figure 2—figure supplement 3
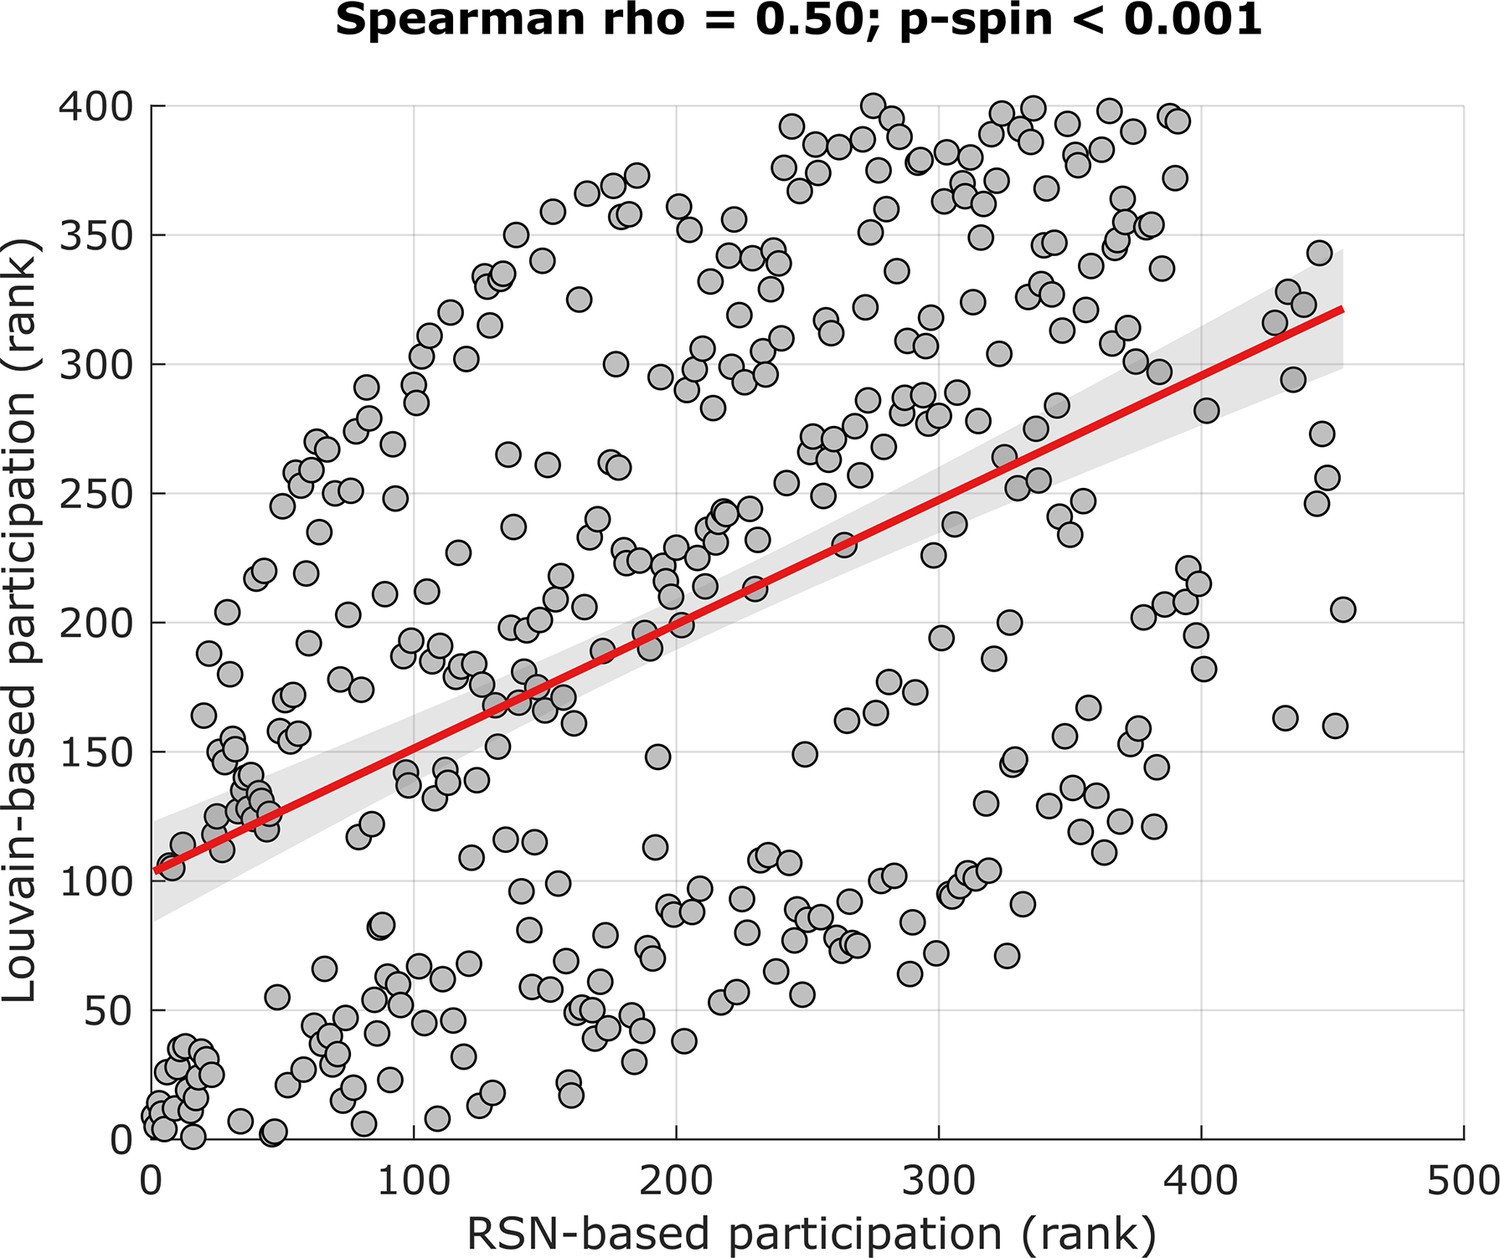
Significant correlation between regional participation coefficient computed with modules defined as resting-state networks (X-axis), and with modules defined from Louvain modularity detection (Y-axis).
Significance is assessed against a null distribution of 10,000 autocorrelation-preserving maps.
Figure 3
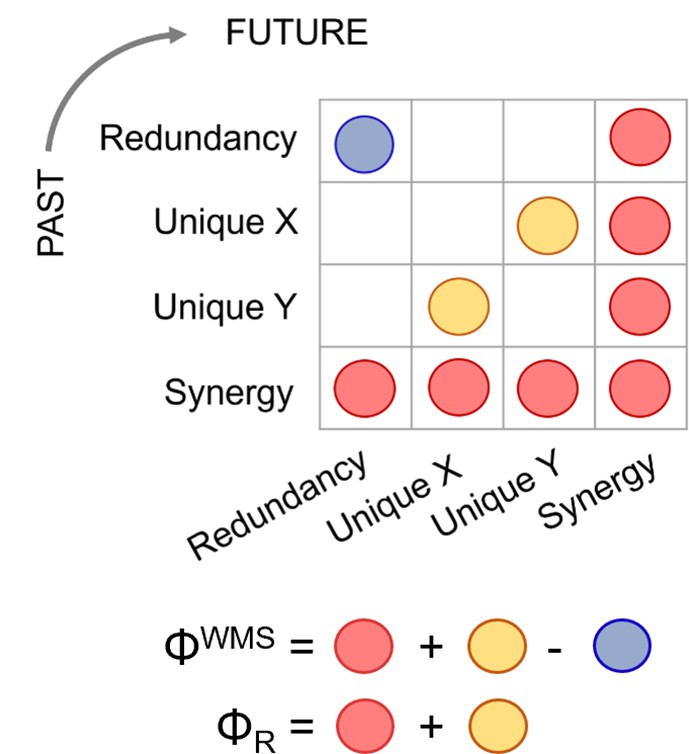
Integrated Information Decomposition.
Integrated Information Decomposition identifies how two sources X and Y jointly convey information across time, corresponding to all possible 4x4 combinations of redundancy, unique information (of X and of Y), and synergistic information. This decomposition highlights why the original whole-minus-sum Φ measure introduced by Balduzzi and Tononi can be negative: because it involves the subtraction of the persistent redundancy that is present in the system, leading to negative values in systems that are redundancy-dominated. This shortcoming can be corrected with the revised measure of Φ, termed ΦR.
Figure 4 with 2 supplements
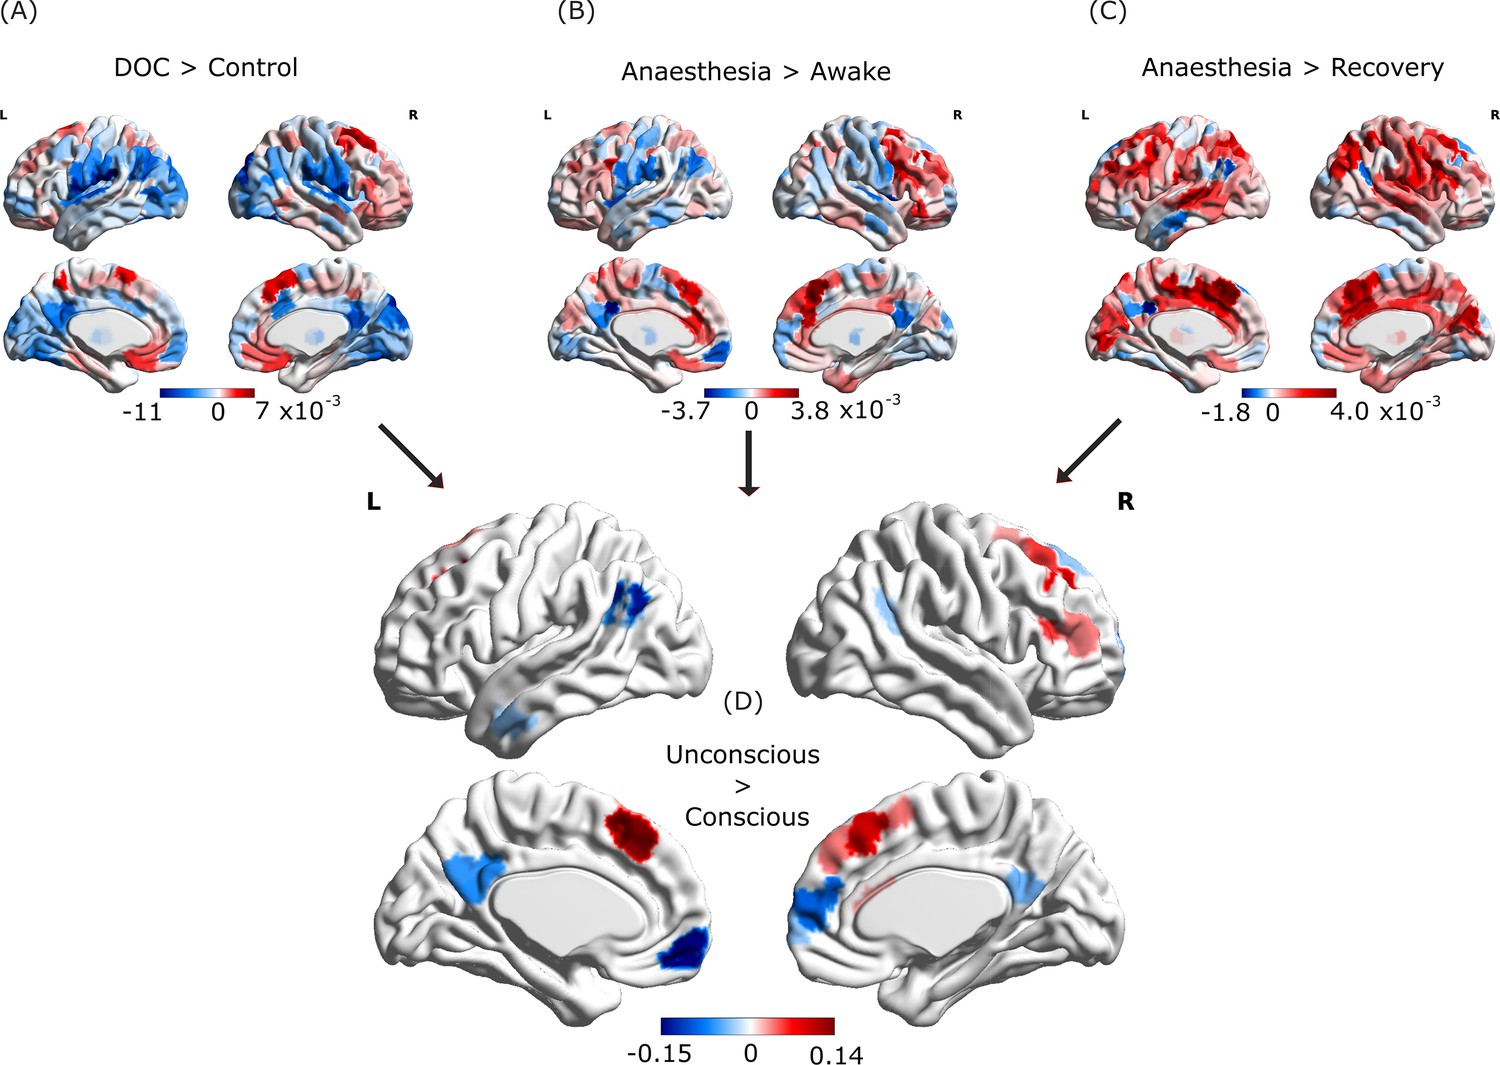
Loss of consciousness induces similar reorganisation of cortical integrated information across anaesthesia and disorders of consciousness.
Top: Brain regions exhibiting overall NBS-corrected increases (red) and decreases (blue) in integrated information exchange when consciousness is lost. (A) DOC patients minus awake healthy volunteers; (B), propofol anaesthesia minus pre-induction wakefulness; (C) propofol-anaesthesia minus post-anaesthetic recovery. (D) Overlaps between the three contrasts in (A–C), showing increases and decreases that are common across anaesthesia and disorders of consciousness.
-
Figure 4—source data 1
Source data associated with Figure 4 and Figure 4—figure supplement 2.
- https://cdn.elifesciences.org/articles/88173/elife-88173-fig4-data1-v1.xlsx
Figure 4—figure supplement 1
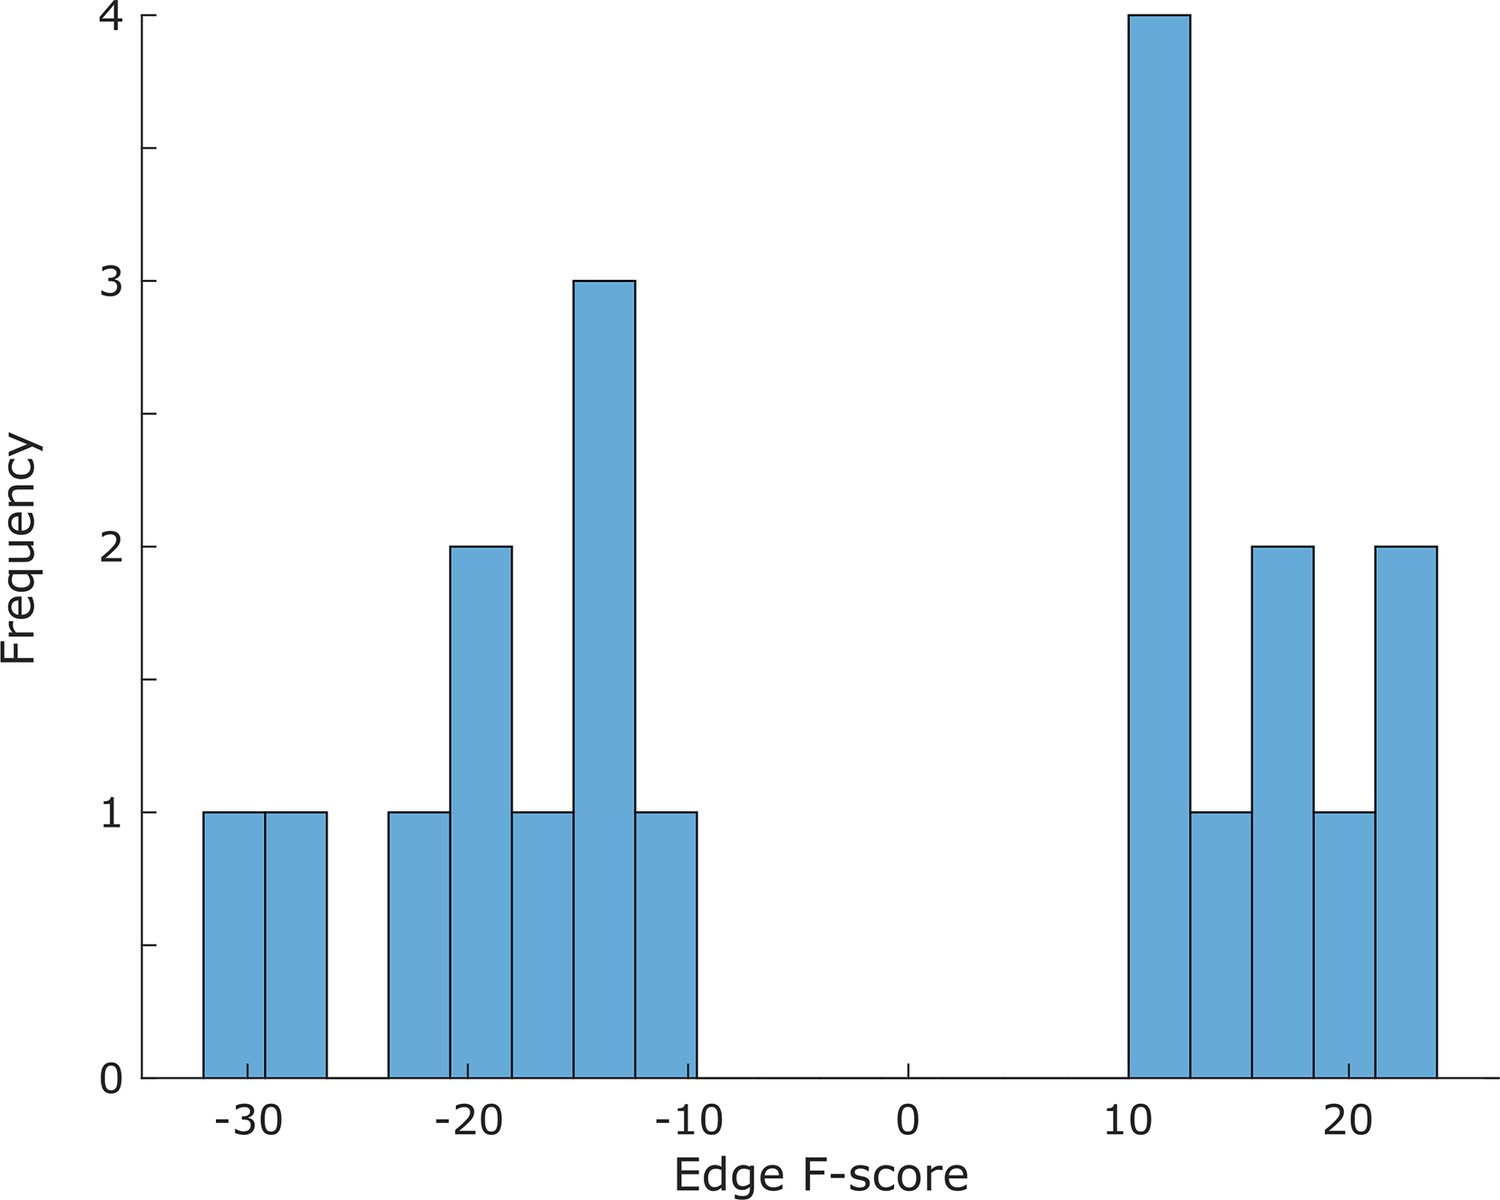
Histogram of significant connectivity changes.
Distribution of F-scores for brain connections that are consistently and significantly increased (positive) or decreased (negative) during unconsciousness.
Figure 4—figure supplement 2
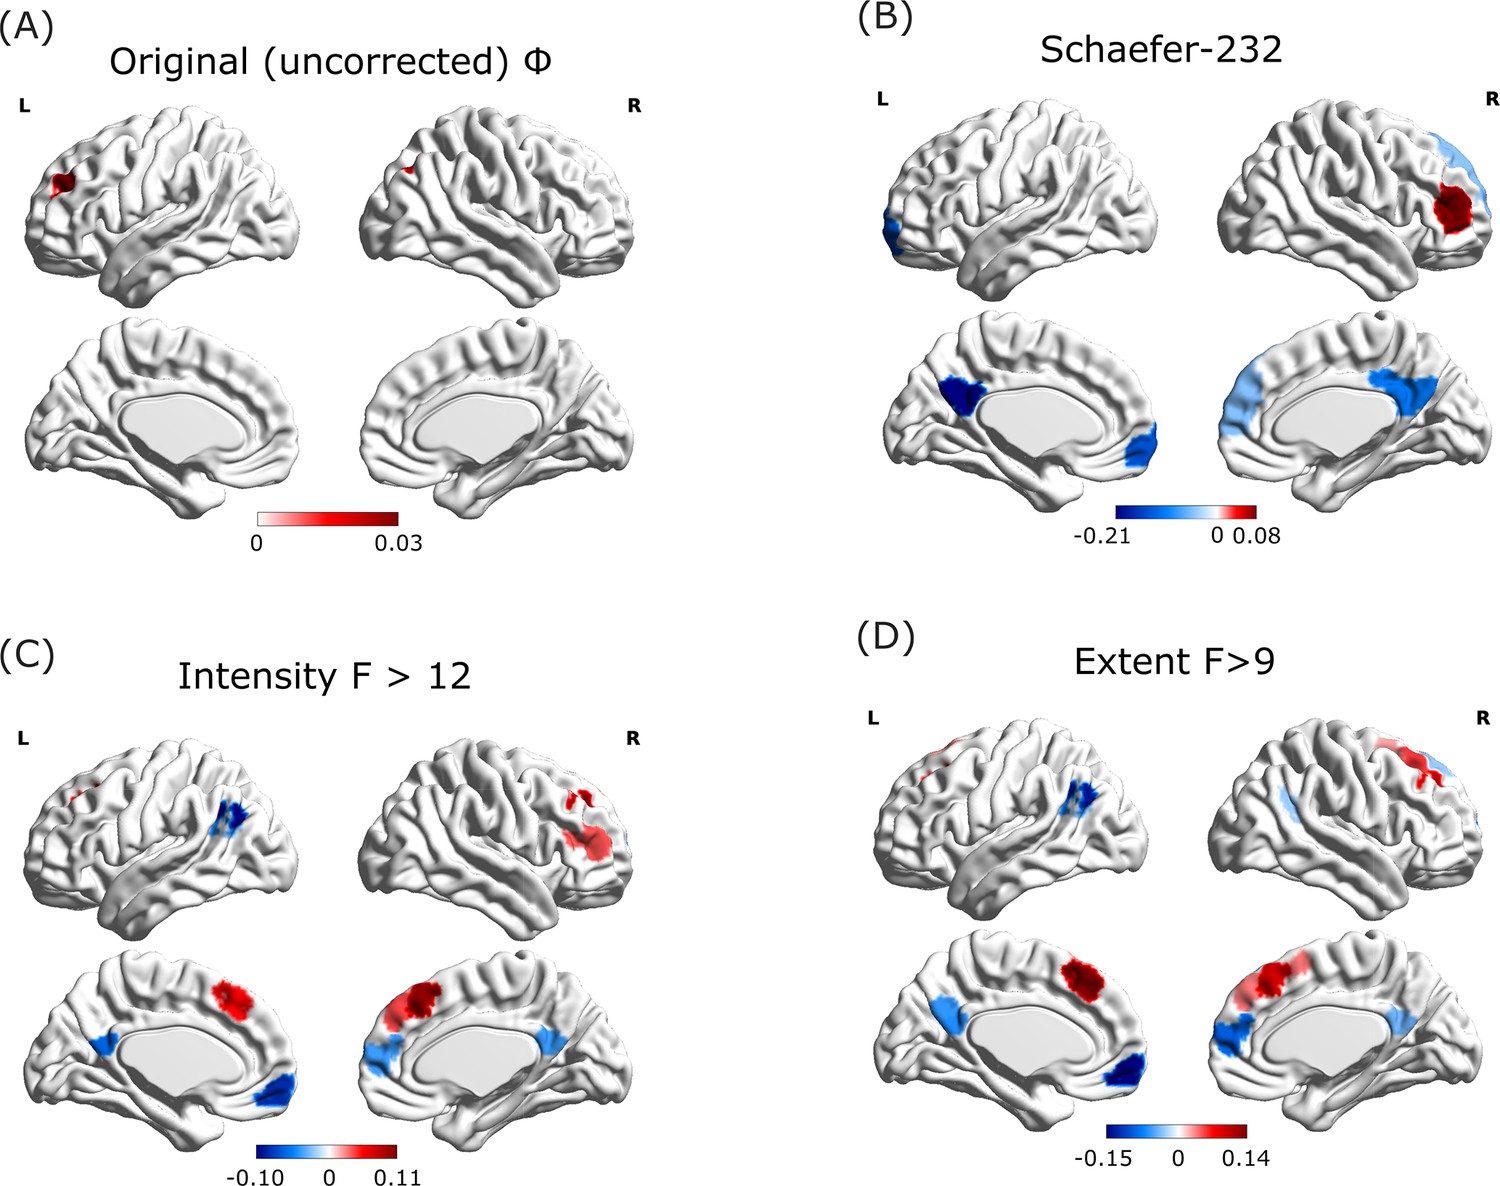
Results of alternative analysis choices.
Brain regions exhibiting overall increases (red) and decreases (blue) in integrated information exchange, when comparing patients with disorders of consciousness with awake healthy volunteers, propofol anaesthesia with pre-induction wakefulness, and propofol-anaesthesia with post-anaesthetic recovery. (A) When the original formulation of whole-minus-sum Φ (Balduzzi and Tononi, 2008) is used, no consistent reductions are observed: only increases. (B) Results with revised Φ are robust to the use of an alternative parcellation scheme (Schaefer-200 cortical ROIs plus Tian-32 subcortical ROIs). (C) Results with revised Φ are robust to the use of a more stringent threshold value (F>12). (D) Results with revised Φ are robust to the use of alternative threshold definition (extent vs intensity).
Figure 5
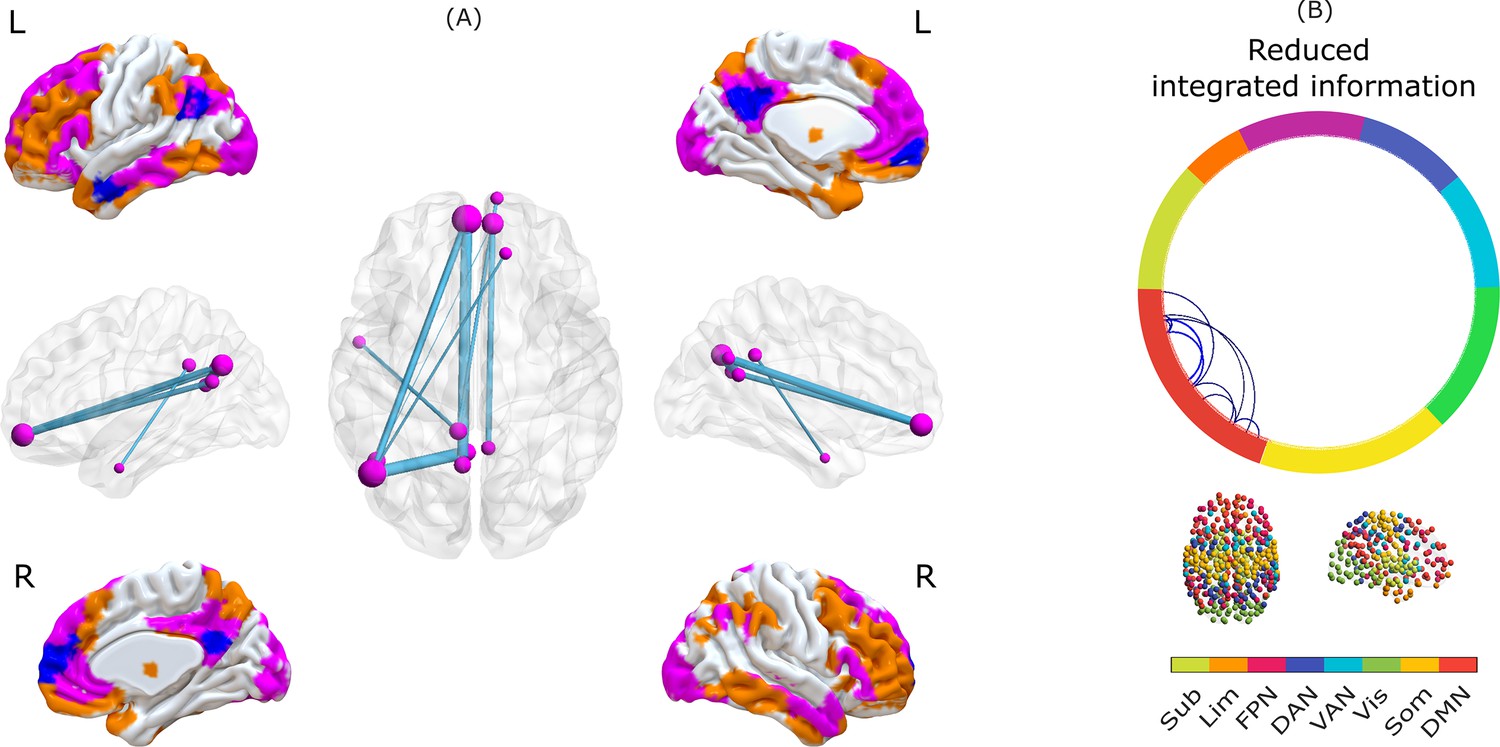
Synergistic core of human consciousness.
(A) Surface representations of medial and lateral views of the brain (L indicates left, R indicates right). Colours indicate brain regions that belong to the synergistic workspace, as identified from HCP data. Orange indicates broadcasters, and violet indicates gateways. Blue indicates regions that exhibit an overall significant reduction in integrated information across anaesthesia and disorders of consciousness. All blue regions overlap with violet ones. The network representation indicates edges with significantly reduced integrated information (ΦR) during both propofol anaesthesia and disorders of consciousness. The color of the nodes (violet or orange) indicates whether the corresponding regions are workspace gateways (violet) or broadcasters (orange); all regions are gateways (violet). (B) Circular graph representation of significant reductions in integrated information (ΦR) between brain regions, observed in all three contrasts, indicating membership of canonical resting-state networks. Connections indicate pairs of regions with a significant decrease of integrated information. Colour of the circle border indicates the RSN affiliation of the corresponding regions. Legend: DMN, default mode network. Som, somatomotor network. Vis, visual network. VAN, ventral attention network. DAN, dorsal attention network. FPN, fronto-parietal control network. Lim, limbic network. Sub, subcortical network (comprised of 54 regions of the Tian et al., 2020 atlas).
-
Figure 5—source data 1
Source data associated with Figure 5.
- https://cdn.elifesciences.org/articles/88173/elife-88173-fig5-data1-v1.xlsx
Tables
Key resources table
| Reagent type (species) or resource | Designation | Source or reference | Identifiers | Additional information |
|---|---|---|---|---|
| Software, algorithm | Java Information Dynamics Toolbox | Lizier, 2014 | https://github.com/jlizier/jidt | v1.5 |
| Software, algorithm | CONN toolbox | Whitfield-Gabrieli and Nieto-Castanon, 2012 | http://www.nitrc.org/projects/conn | version 17 f |
| Software, algorithm | Brain Connectivity Toolbox | Rubinov and Sporns, 2010 | https://sites.google.com/site/bctnet/ | |
| Software, algorithm | HRF deconvolution toolbox | Wu et al., 2013 | https://www.nitrc.org/projects/rshrf | v2.2 |
| Software, algorithm | Spin-test | Alexander-Bloch et al., 2018 | https://github.com/frantisekvasa/rotate_parcellation | |
| Software, algorithm | Integrated Information Decomposition code | Luppi et al., 2024a | https://github.com/Imperial-MIND-lab/integrated-info-decomp |
Additional files
Download links
A two-part list of links to download the article, or parts of the article, in various formats.
Downloads (link to download the article as PDF)
Open citations (links to open the citations from this article in various online reference manager services)
Cite this article (links to download the citations from this article in formats compatible with various reference manager tools)
A synergistic workspace for human consciousness revealed by Integrated Information Decomposition
eLife 12:RP88173.
https://doi.org/10.7554/eLife.88173.4


