Imputation of 3D genome structure by genetic–epigenetic interaction modeling in mice
- The Jackson Laboratory, United States
Figures
Figure 1
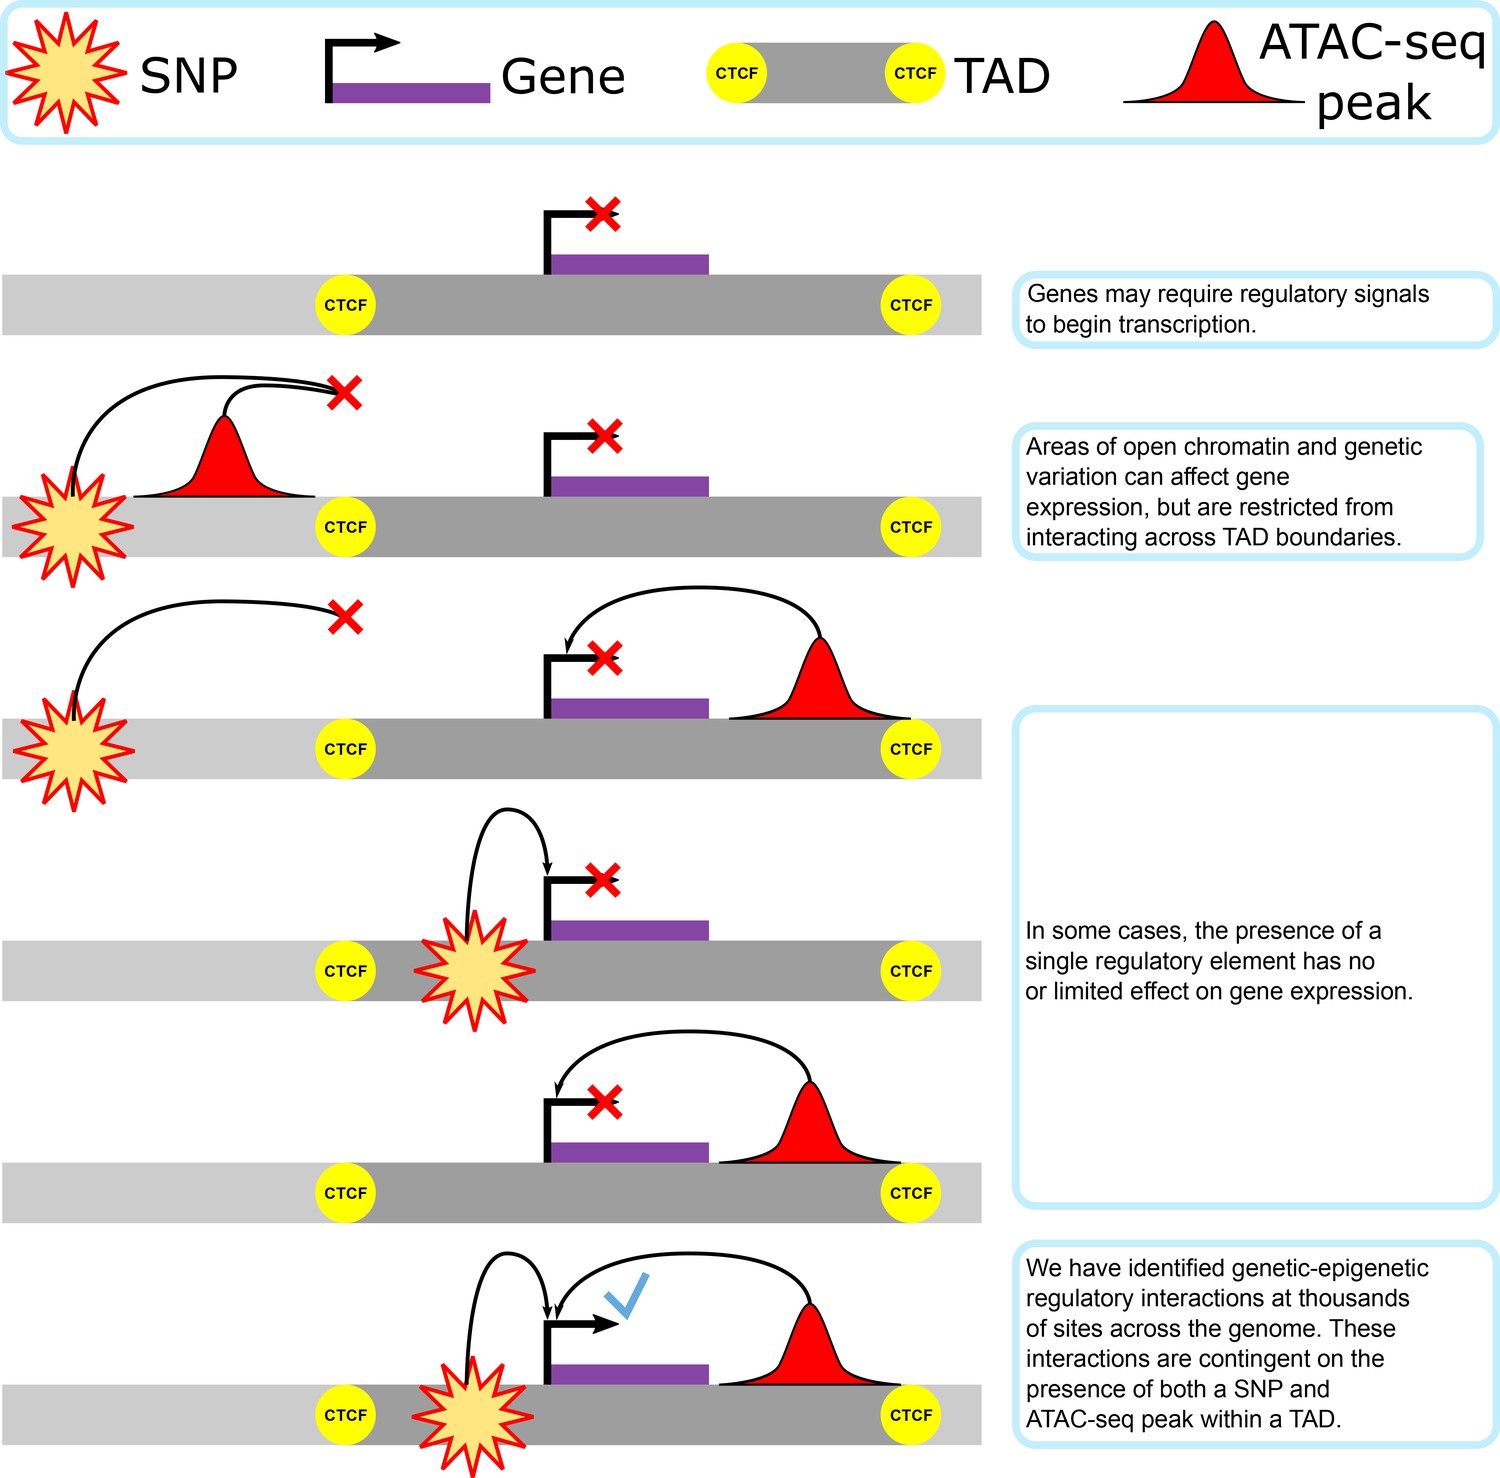
Our proposed model of genetic–epigenetic regulatory interaction, as bounded by topologically associating domains.
Figure 2 with 1 supplement
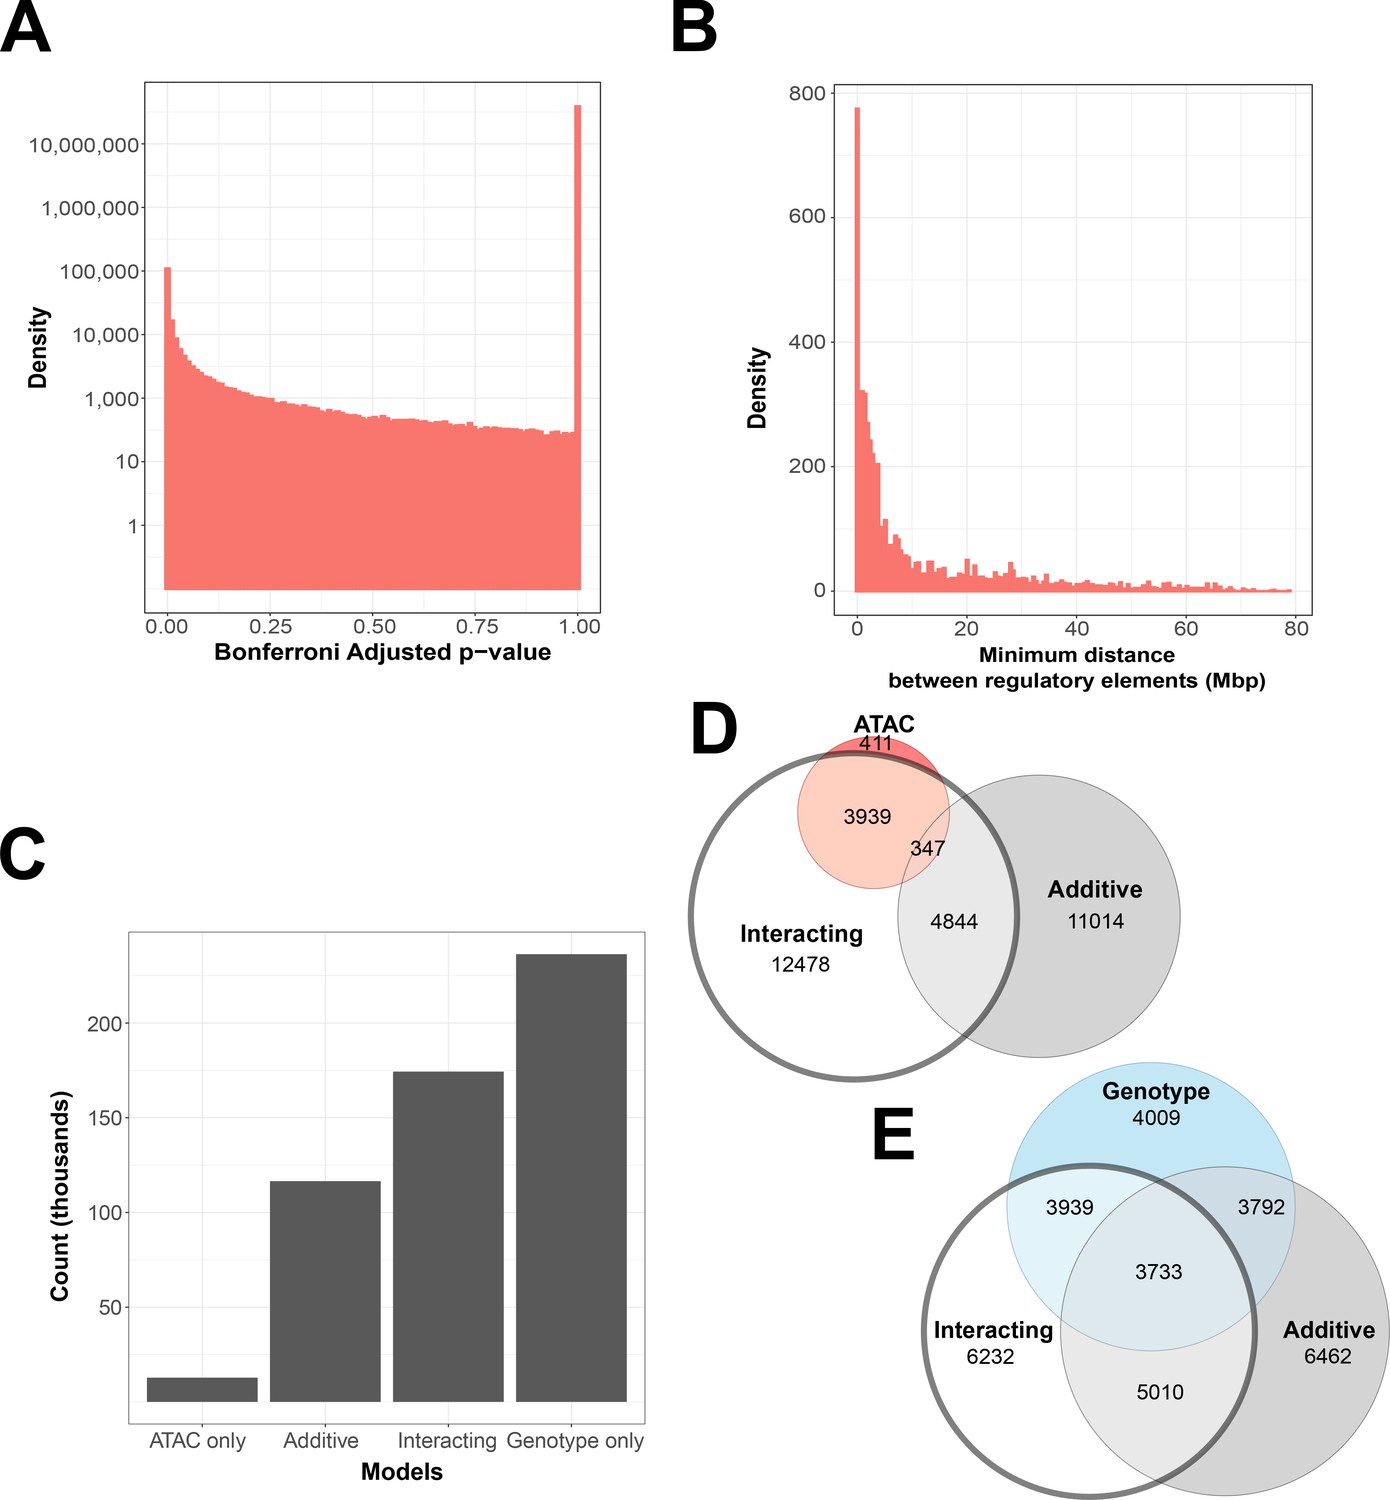
Interacting and additive models are abundant and favor local genes.
(A) Density of Bonferroni adjusted p-value distribution in randomly sampled intrachromosomal models. (B) Density of non-additive interacting models where adj. p < 1 × 10⁻⁷, by minimum distance between regulatory elements. (C) Distribution of model term retention across intra-topologically associated domain (TAD) models. (D, E) Euler plots of ATAC-seq peaks and genetic variants, dividing them by their participation in single-term, additive, and non-additive interacting models. ATAC-seq peaks and genetic variants involved in interacting models are highlighted, as they are investigated further in this paper.
Figure 2—figure supplement 1
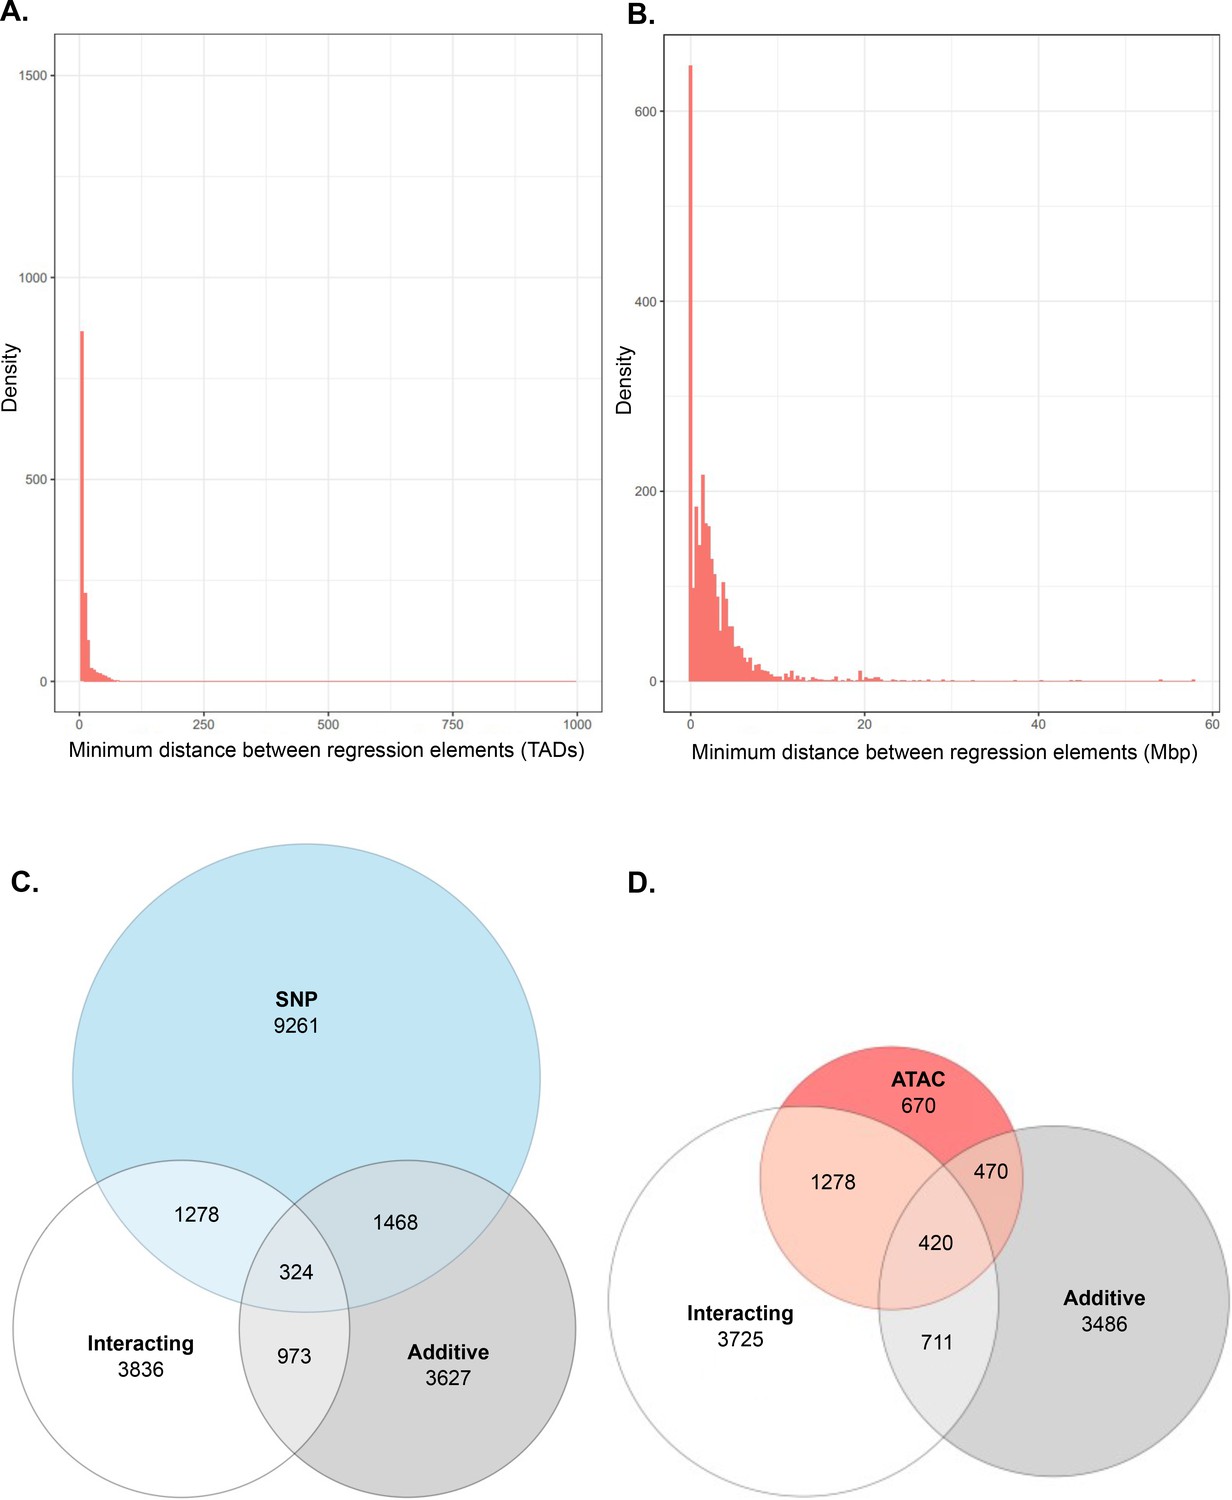
Additional analysis of interacting and additive models and their relation to local genes.
(A) Density of interacting models where adj. p < 1 × 10⁻⁷, by minimum distance between regulatory elements, measured in relation to number of topologically associated domains (TADs) between elements. (B) Density of additive models where adj. p < 1 × 10⁻⁷, by minimum bp distance between regulatory elements. (C, D) ATAC-seq peak and single-nucleotide polymorphism (SNP) participation in single-term, additive, and interacting models.
Figure 3 with 2 supplements
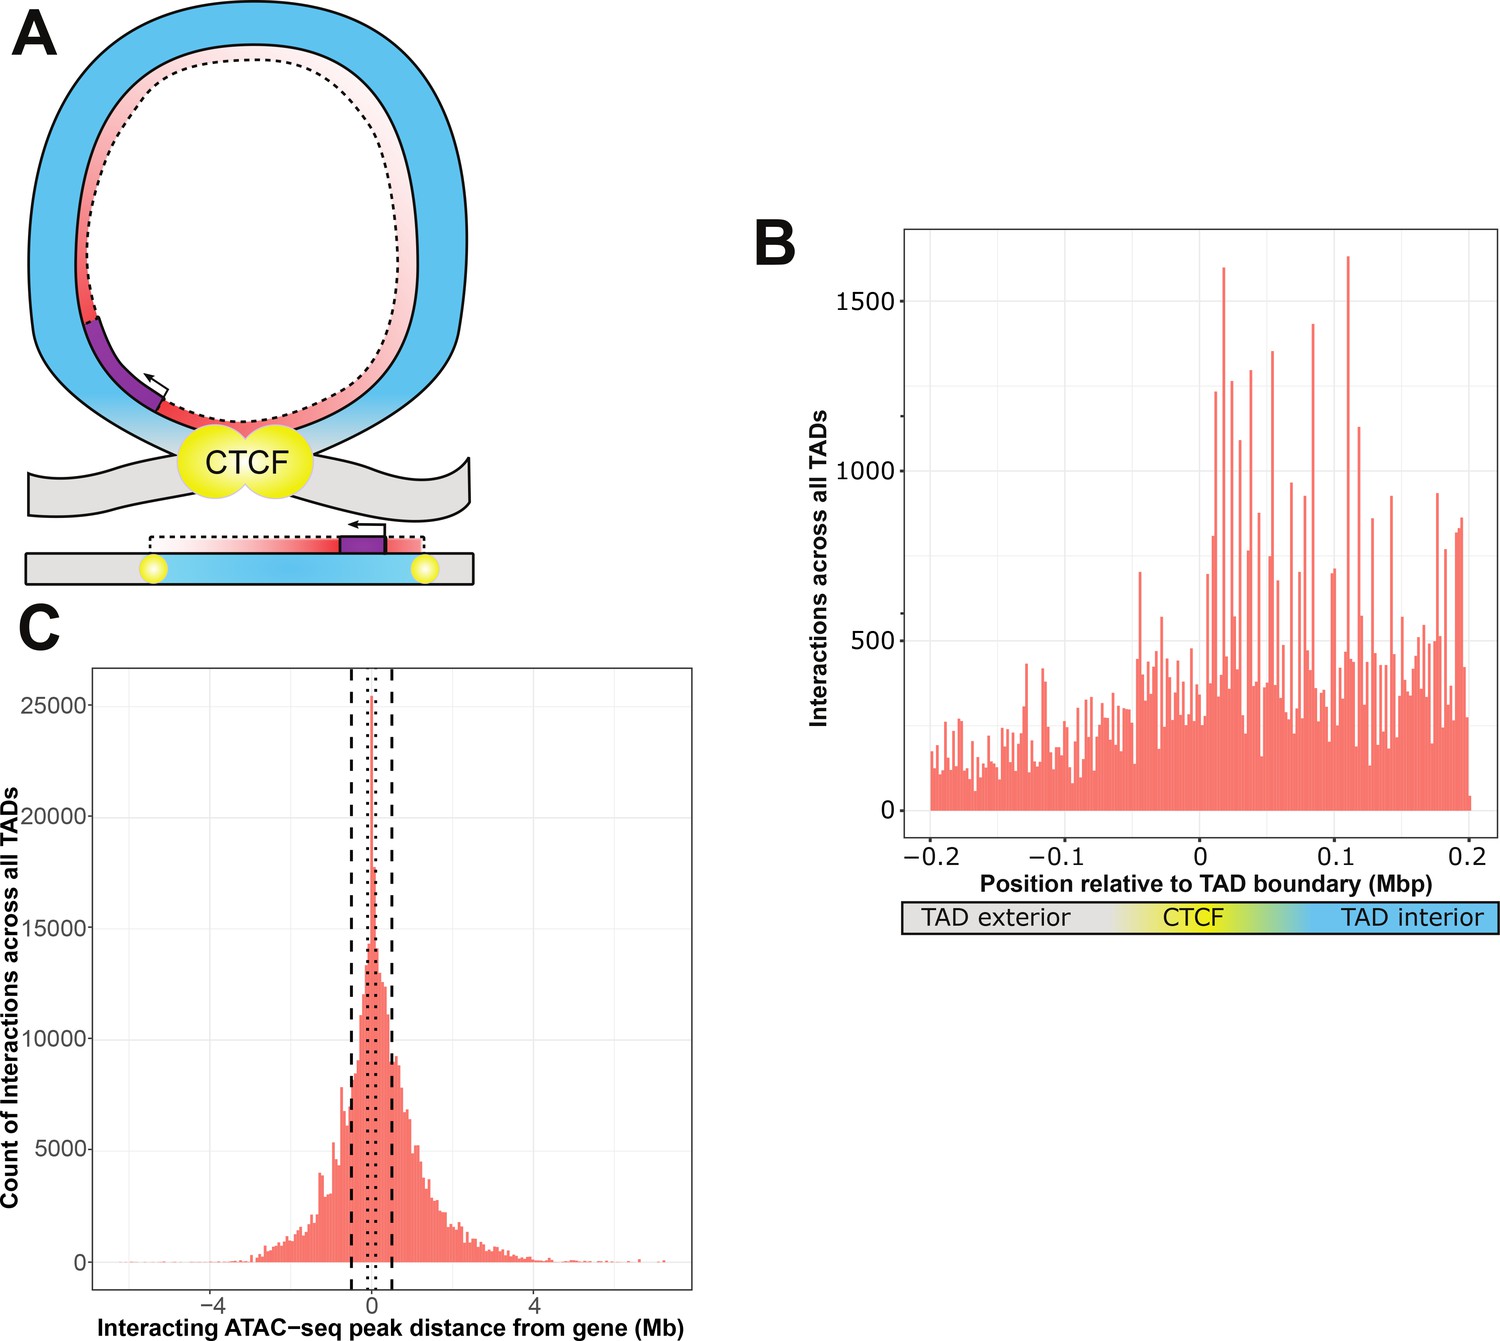
ATAC-seq peaks that interact with genetic variants generally reside within the affected gene’s topologically associated domain (TAD).
(A) Schematic of a TAD loop, including gene (purple) and density of interacting model elements (red). Loop interior is in blue, exterior DNA is gray, and CTCF-binding sites are in yellow. (B) Location of interacting ATAC-seq peaks relative to TAD boundary location, merged across all genes. TAD interior denotes the TAD in which the dependent gene was found. (C) Interacting ATAC-seq peaks by distance from associated gene transcription start site (TSS). Local area cutoffs of 100 and 500 kb flanking regions are marked.
Figure 3—figure supplement 1

Overall ATAC-seq peak distribution does not fully explain the distribution of interacting ATAC-seq peaks.
Location of all ATAC-seq peaks relative to topologically associated domain (TAD) boundary location, merged across all genes. TAD interior (x > 0) denotes the TAD in which the dependent gene was found.
Figure 3—figure supplement 2

Highly interacting ATAC-seq peaks are contained within the same topologically associated domain (TAD) as the genes they affect.
Location of interacting ATAC-seq peaks relative to TAD boundary location, merged across all genes. Each bar represents an individual ATAC-seq peak, to demonstrate interactions per peak rather than density of interactions (see Figure 2B for this alternate view). Black horizontal line indicates 200 interactions per ATAC peak. TAD interior (x > 0) denotes the TAD in which the dependent gene was found.
Figure 4 with 1 supplement
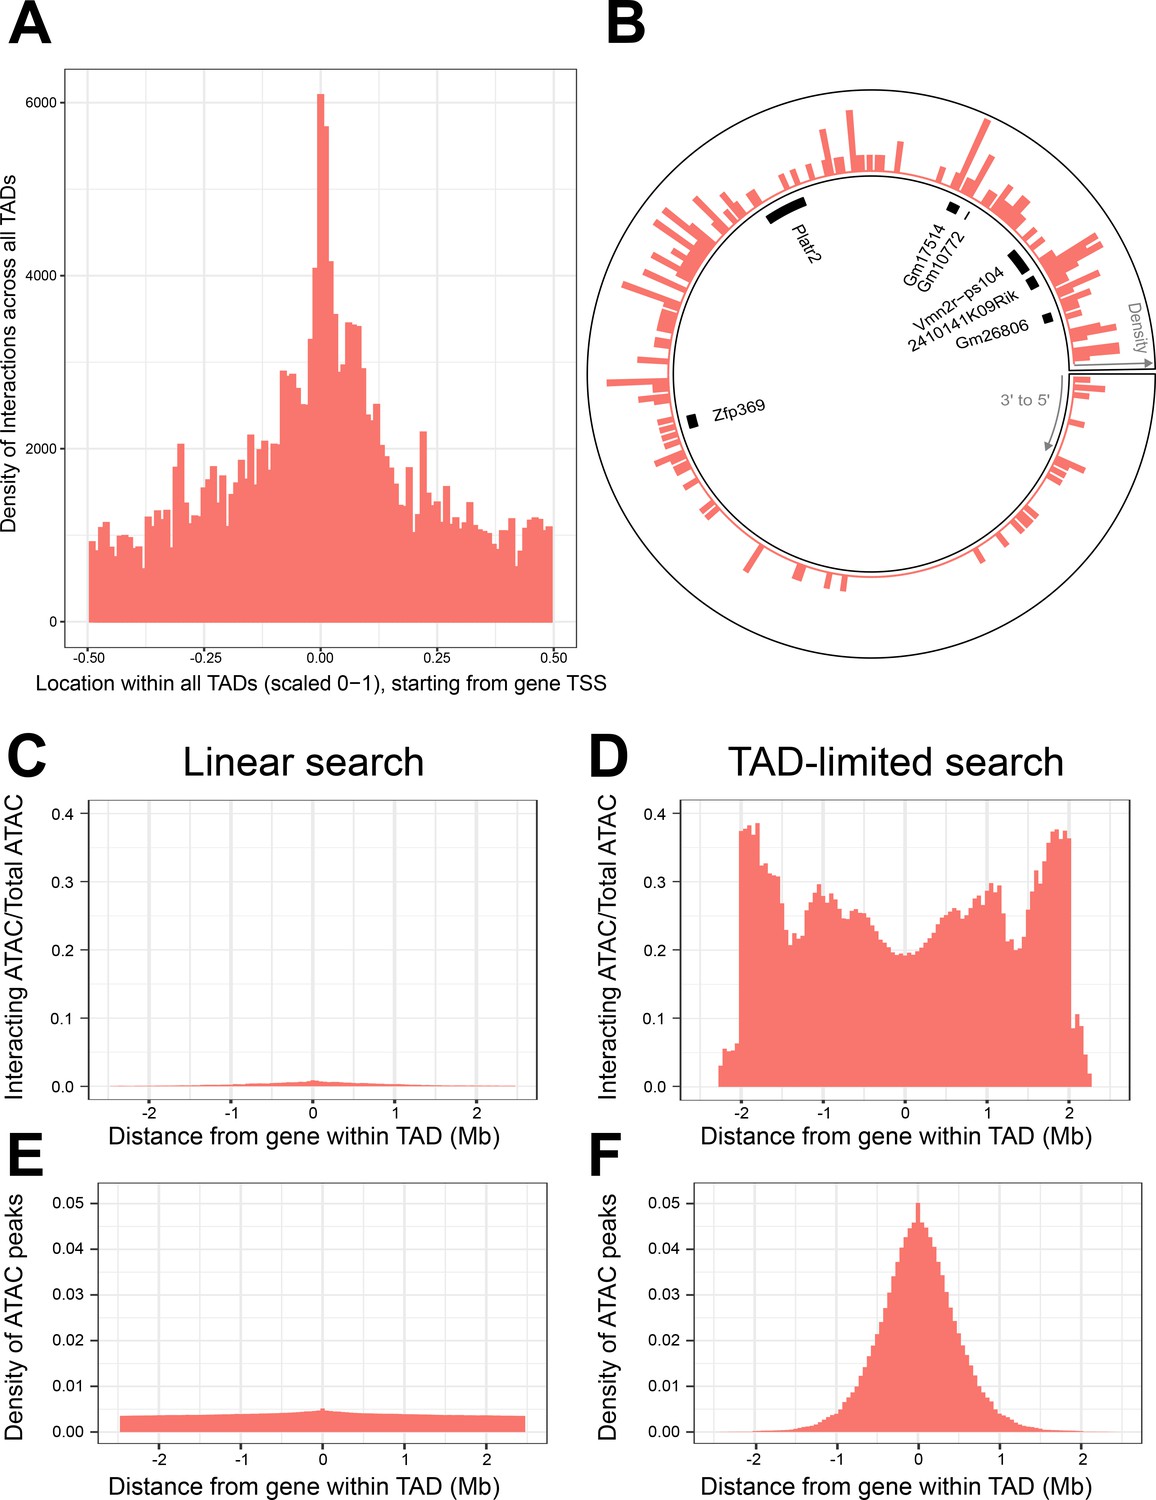
Topologically associated domains (TADs) provide context for interactions and increase interaction search efficacy.
(A) Counts of intra-TAD ATAC-seq peaks involved in all non-additive interactive models, centered on the transcription start site (TSS) of the gene affected by the genotype–ATAC interaction. Coordinates transformed to a standard scale. (B) Example TAD, displaying interacting ATAC peak density and gene locations. Peak relevance generally decays relative to intra-TAD distance rather than linear chromosomal distance. (C–F) A comparison between linear sequence-based and TAD-limited search methods for interacting ATAC-seq peaks. (C, D) compare percentage of significantly interacting ATAC-seq peaks at each gene-relative locus. (E, F) compare density of ATAC-seq peaks at each locus. TAD-based search shows a higher density of interactions and places limits on search distance due to testing only TAD-internal ATAC-seq peaks.
Figure 4—figure supplement 1
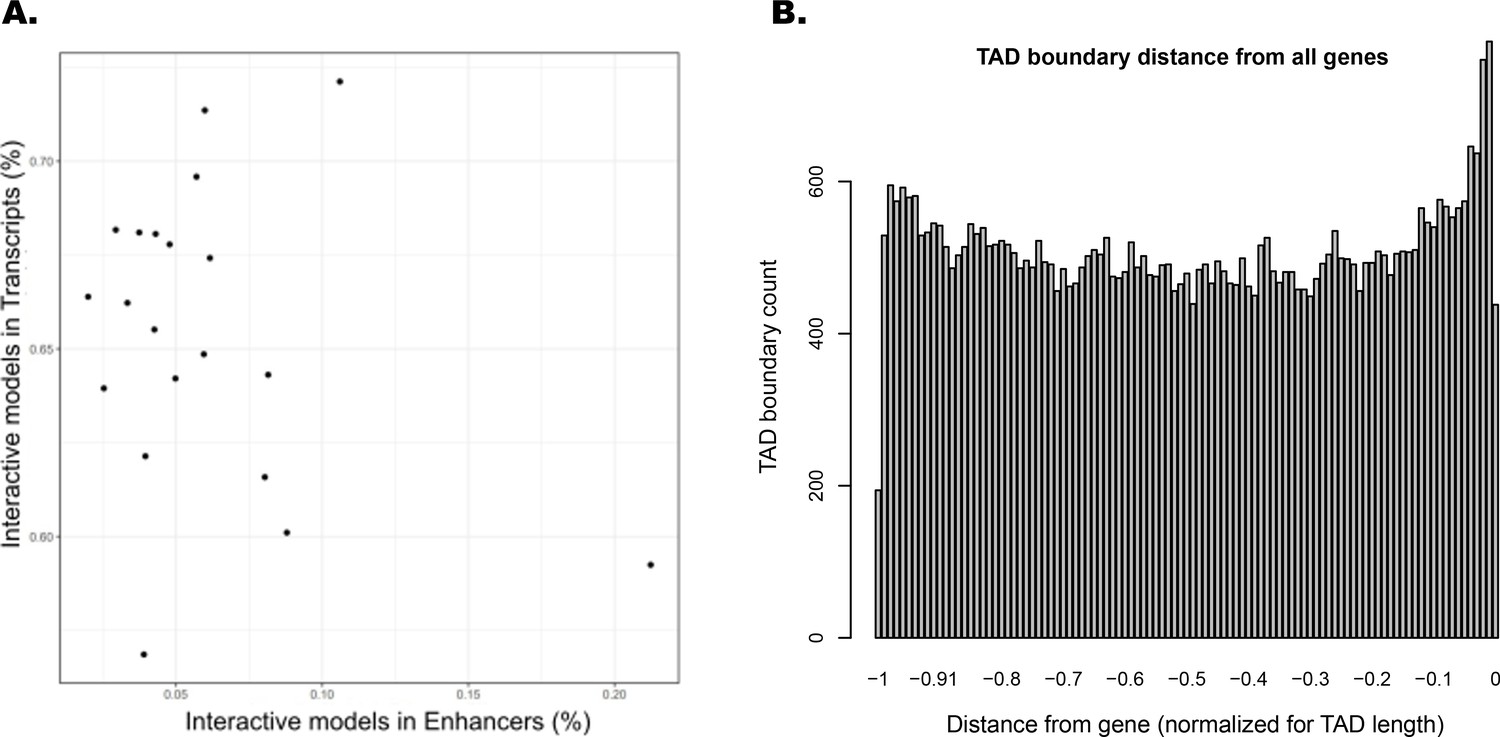
Interacting ATAC-seq peaks do not correlate with enhancers, while topologically associated domain (TAD) boundary locations favor gene proximity.
(A) Per-chromosome comparison of percentages of interacting ATAC-seq peaks in transcripts versus in enhancers. (B) TAD boundary locations relative to distance from each gene contained within them, normalized for TAD length.
Figure 5 with 2 supplements
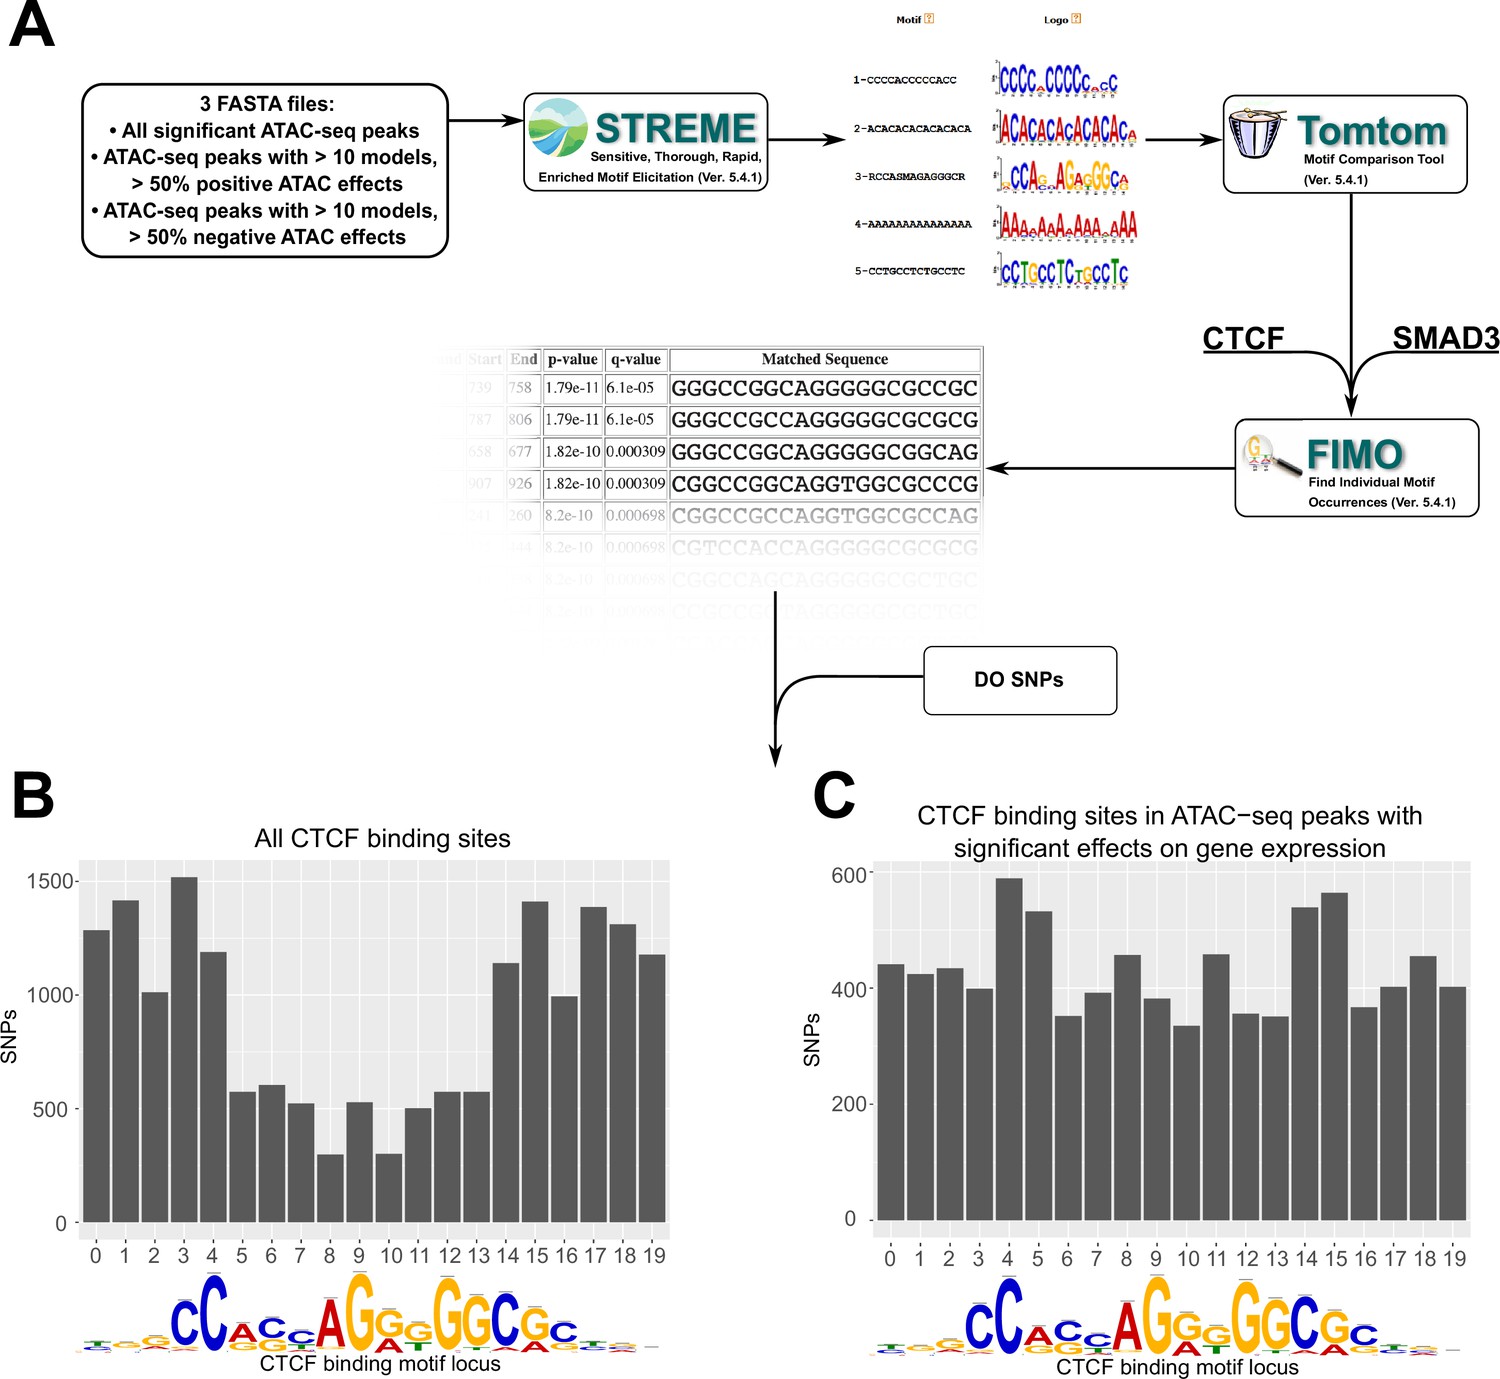
Motif analysis identifies differences in interacting CTCF-binding motifs.
(A) A schematic of our motif analysis through MEMEsuite. FASTA files derived from interacting ATAC-seq peaks are used to identify enriched motifs, identify protein-binding sequences, and locate the sequences within the ATAC-seq peaks. (B, C) Binding sites found within significant motifs are less protected from genetic variation. Single-nucleotide polymorphism (SNP) counts are shown at each locus in the CTCF-binding sequence, comparing motifs within interacting ATAC-seq peaks versus all CTCF-binding sites.
Figure 5—figure supplement 1

Motif analysis identifies CTCF- and Smad3-binding motifs in example topologically associated domain (TAD).
(A, B) Smad3- and CTCF-binding sites within motifs identified in Platr2’s TAD.
Figure 5—figure supplement 2
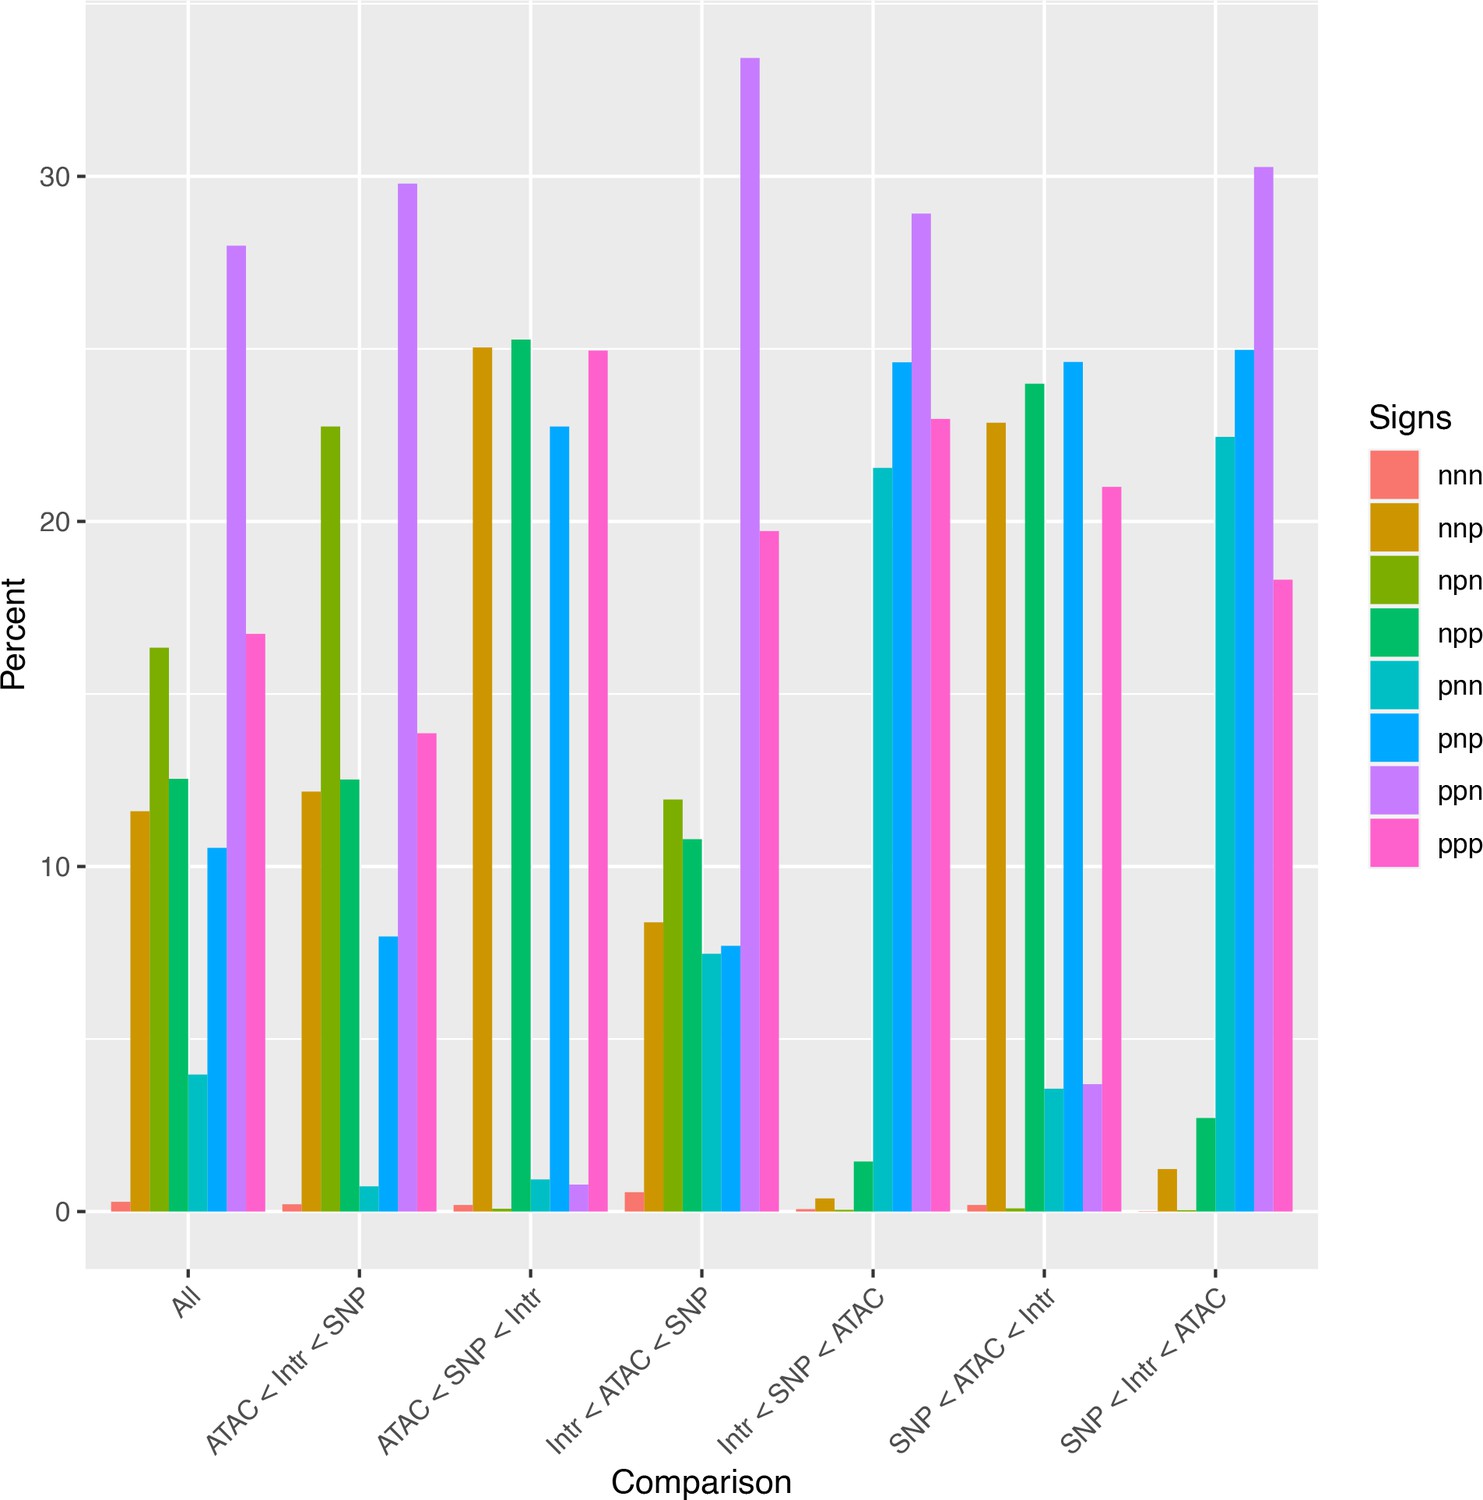
Analysis of relative effect magnitudes indicates multiple genetic–epigenetic interaction subtypes.
Relative effect magnitudes of all significant intra-topologically associated domain (TAD) interaction models, split by effect signs. Model signs are listed in the order ATAC, single-nucleotide polymorphism (SNP), Interaction, and positive (p) or negative (n).
Figure 6 with 1 supplement
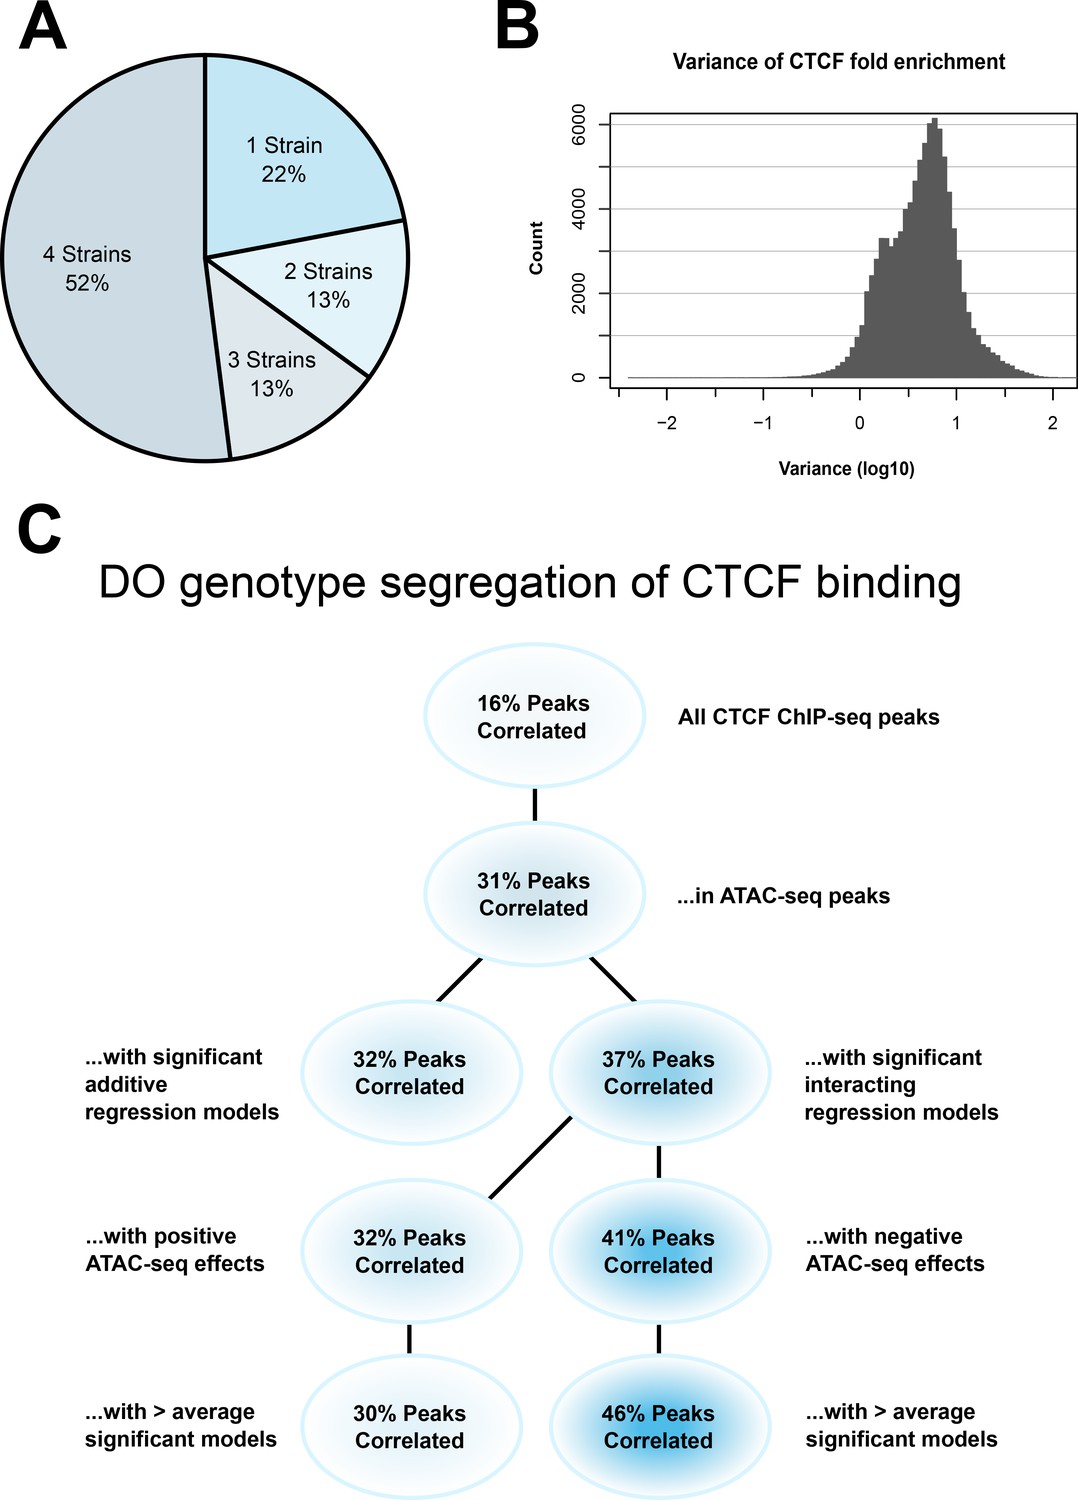
CTCF ChIP-seq analysis shows predictable strain-specific differences in binding intensity.
(A) Percentage of ChIP-seq peaks in surveyed strains. (B) Variance (log10) in binding intensity fold enrichment for all ChIP-seq peaks. (C) Percentage of significance in association between DO genotype at CTCF peaks and CTCF-binding intensity on inbred ChIP-seq samples, in various subsets.
Figure 6—figure supplement 1
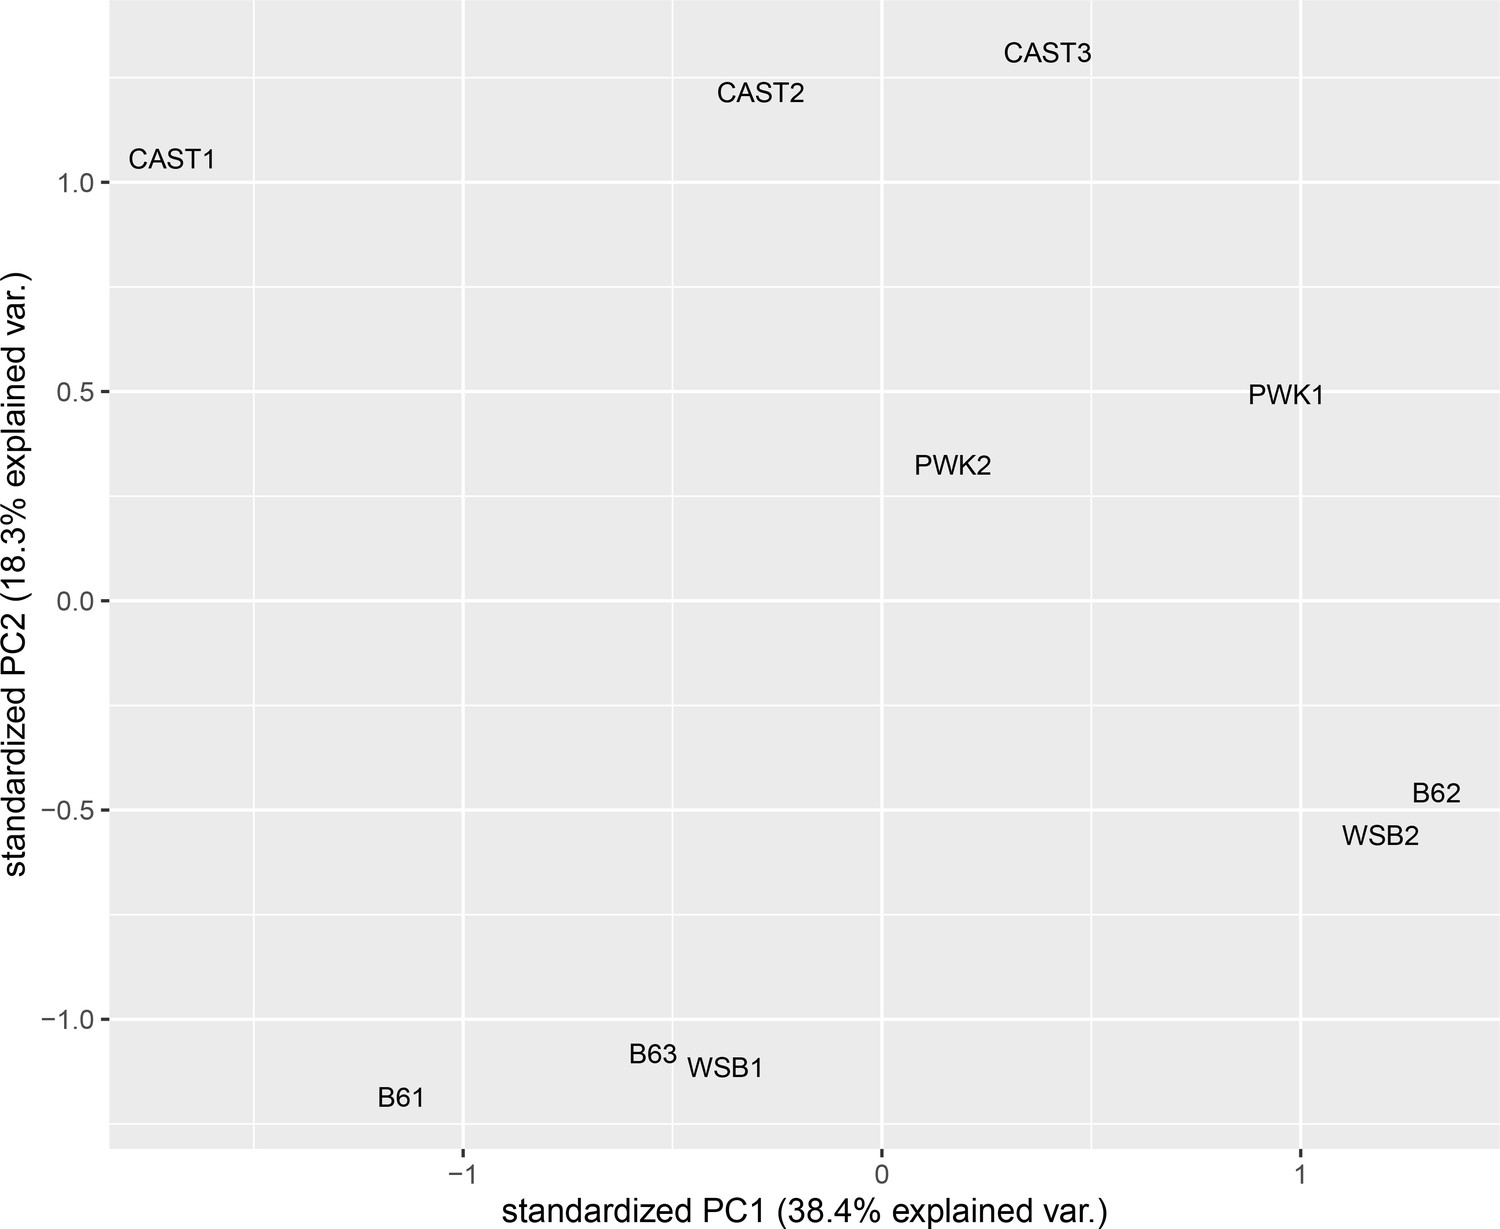
Samples cluster by subspecies and strain, not by batch.
Principle component analysis of CTCF ChIP-seq-binding intensity. Batch numbers are included for each sample.
Additional files
-
Supplementary file 1
Counts and percentages within a database of randomly generated regression models.
- https://cdn.elifesciences.org/articles/88222/elife-88222-supp1-v1.xlsx
-
Supplementary file 2
Counts and percentages within a database of all possible regression models where all single-nucleotide polymorphisms (SNPs) and ATAC peaks are within ±1 TAD of the gene they interact with.
- https://cdn.elifesciences.org/articles/88222/elife-88222-supp2-v1.xlsx
-
Supplementary file 3
Counts and percentages of genotypic variants and ATAC-seq peaks within ±2 Mb of the gene they are imputed to affect.
In additive and interacting models, we include the percent of models in which the genotypic variant and ATAC peak are closer to each other than to the gene they affect.
- https://cdn.elifesciences.org/articles/88222/elife-88222-supp3-v1.xlsx
-
Supplementary file 4
Table providing a breakdown of interacting ATAC-seq peak locations relative to gene features.
- https://cdn.elifesciences.org/articles/88222/elife-88222-supp4-v1.xlsx
-
Supplementary file 5
Chromosome comparison of percentages of interacting ATAC-seq peaks in transcripts versus in enhancers.
- https://cdn.elifesciences.org/articles/88222/elife-88222-supp5-v1.xlsx
-
Supplementary file 6
Model percentages calculated by distribution of effect signs for all significant interacting models.
- https://cdn.elifesciences.org/articles/88222/elife-88222-supp6-v1.xlsx
-
Supplementary file 7
STREME output of motifs detected within negative effector ATAC-seq peaks.
- https://cdn.elifesciences.org/articles/88222/elife-88222-supp7-v1.zip
-
Supplementary file 8
Model percentages calculated by distribution of effect signs for Platr2’s interacting models.
- https://cdn.elifesciences.org/articles/88222/elife-88222-supp8-v1.xlsx
-
Supplementary file 9
TOMTOM output of motifs aligned to a sequence identified as enriched by MEME within interacting significantly enriched ATAC-seq peaks.
- https://cdn.elifesciences.org/articles/88222/elife-88222-supp9-v1.zip
-
MDAR checklist
- https://cdn.elifesciences.org/articles/88222/elife-88222-mdarchecklist1-v1.docx
Download links
A two-part list of links to download the article, or parts of the article, in various formats.
Downloads (link to download the article as PDF)
Open citations (links to open the citations from this article in various online reference manager services)
Cite this article (links to download the citations from this article in formats compatible with various reference manager tools)
Imputation of 3D genome structure by genetic–epigenetic interaction modeling in mice
eLife 12:RP88222.
https://doi.org/10.7554/eLife.88222.3


