Broad functional profiling of fission yeast proteins using phenomics and machine learning
- University College London, Institute of Healthy Ageing and Department of Genetics, Evolution & Environment, United Kingdom
- University College London, Institute of Structural and Molecular Biology, United Kingdom
- University of Bristol, United Kingdom
- Helwan University, Faculty of Pharmacy, Egypt
Figures
Figure 1
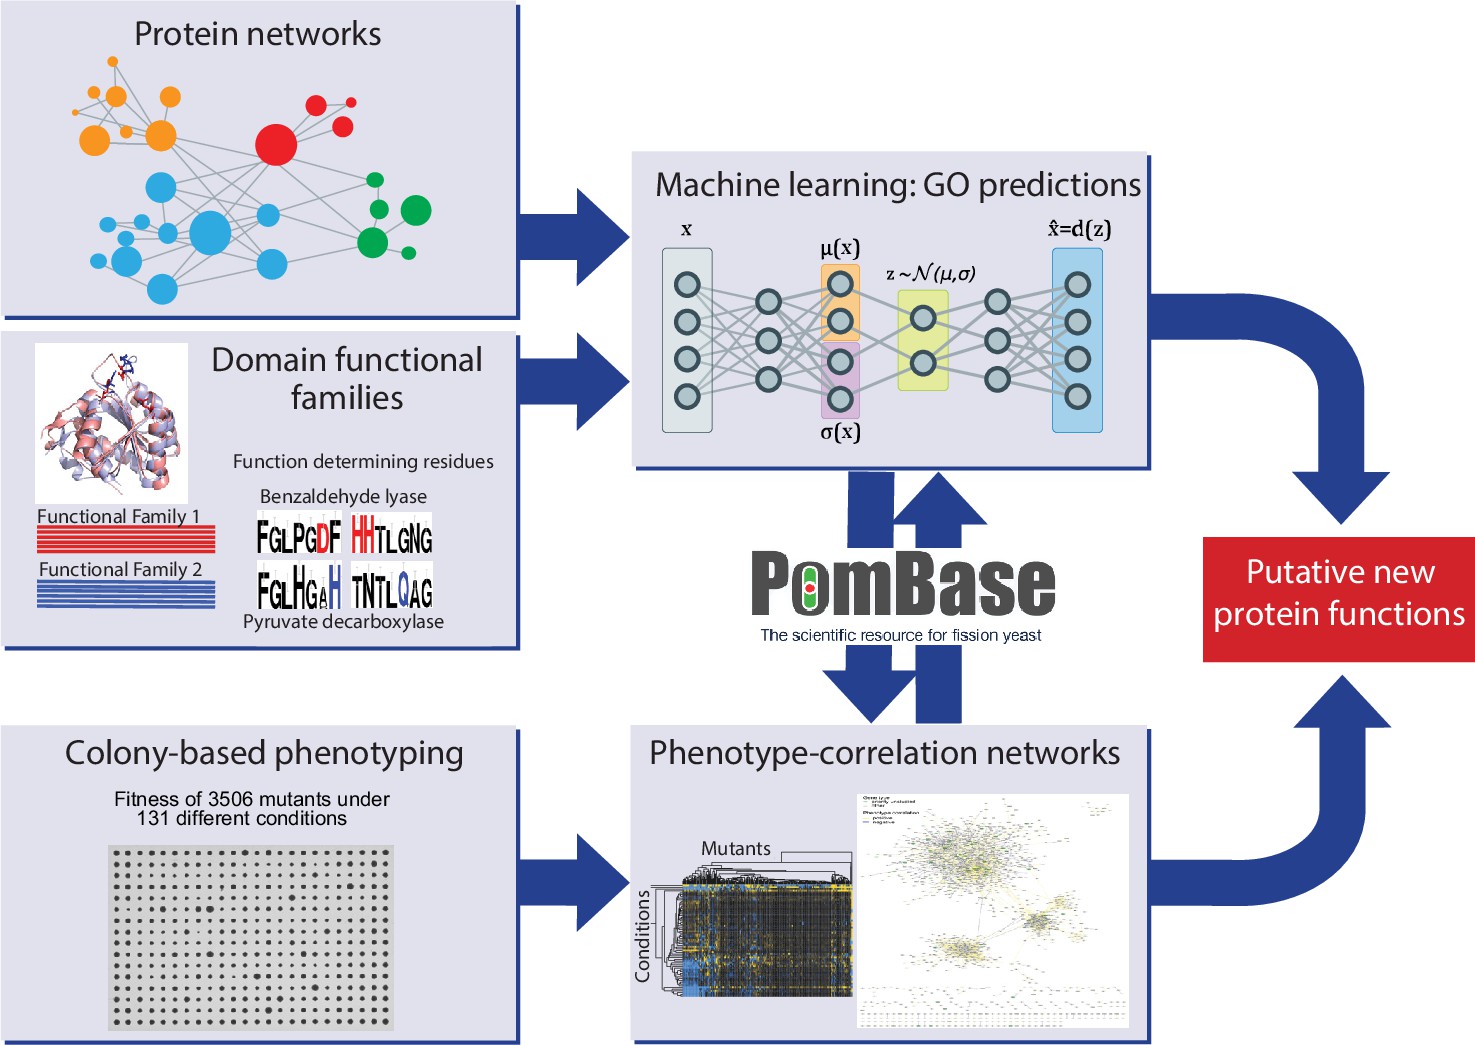
Schematic overview of study design.
Experimental and computational tasks along with the relationships between the different aspects of the work to generate new information on protein function.
Figure 2 with 3 supplements
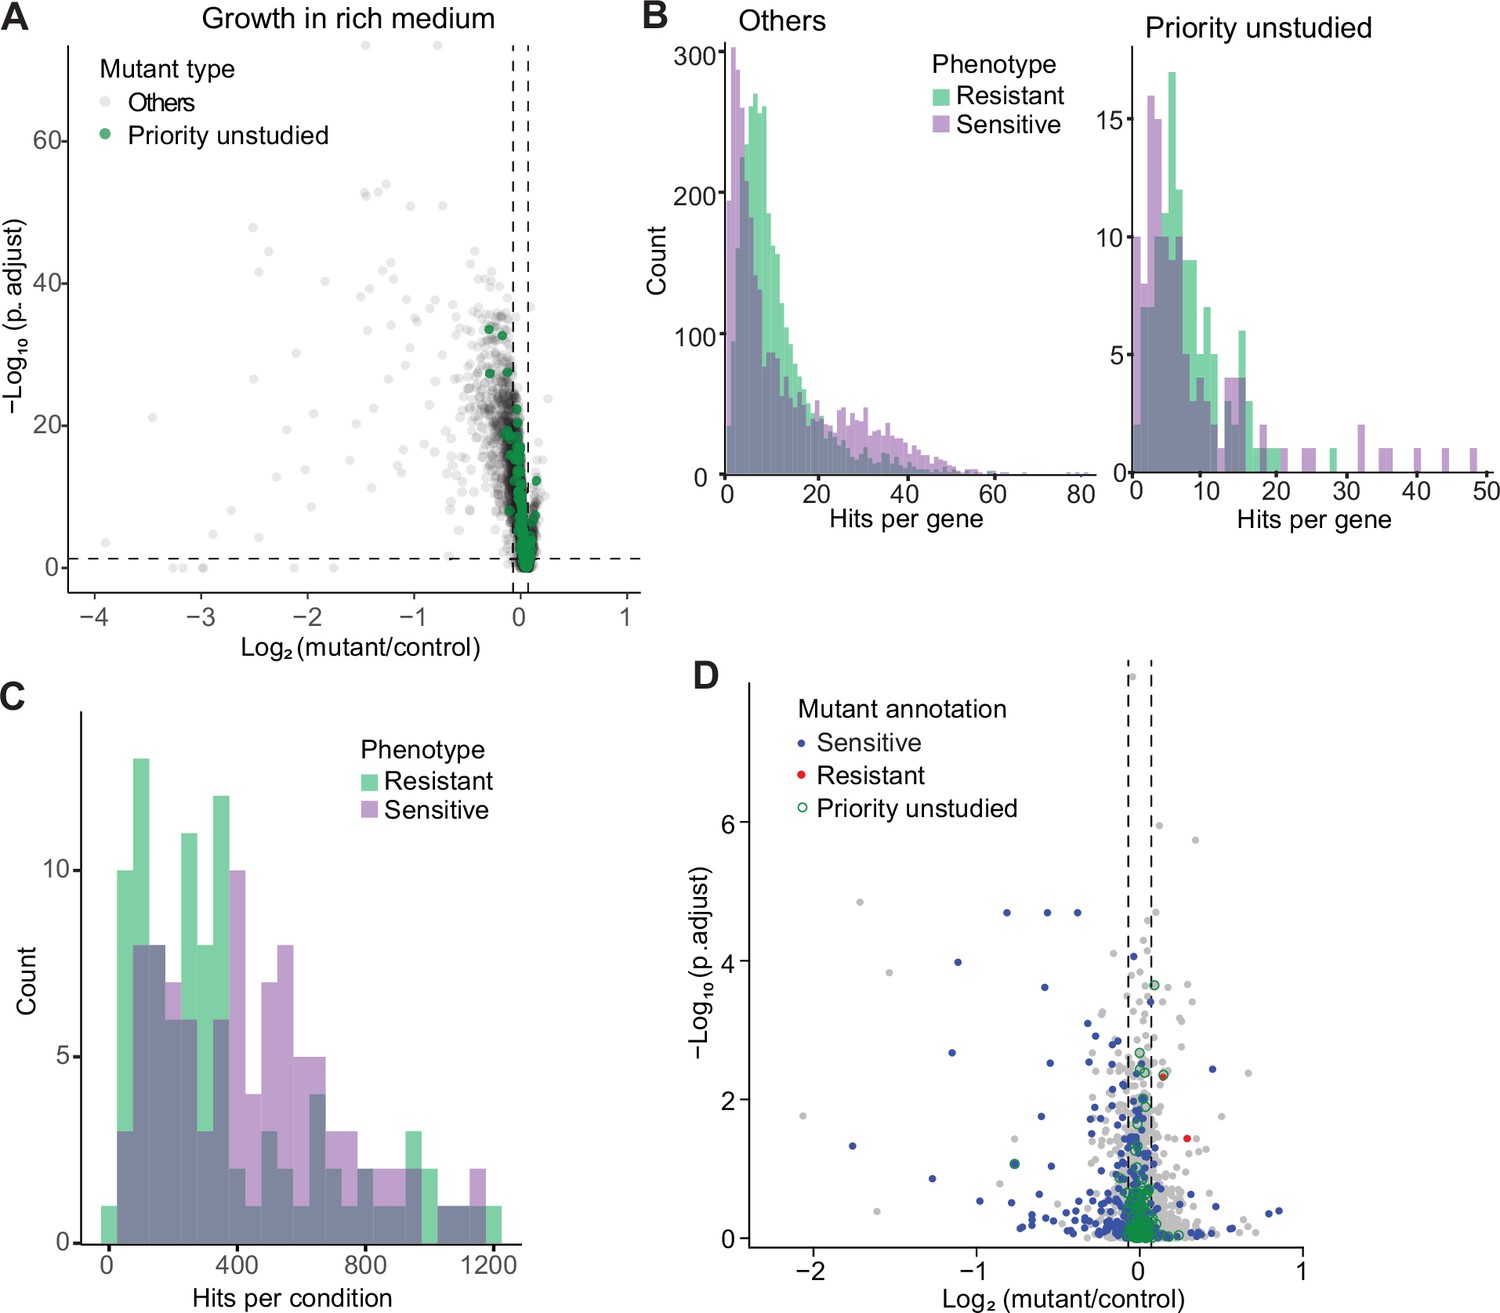
Colony-based phenotyping of deletion mutants.
(A) Volcano plot of mutant colony sizes for priority unstudied genes (green) and all other genes (gray) growing in rich medium. The dashed vertical and horizontal lines show the 5% difference in effect size and significance threshold, respectively. Strains with lower fitness (smaller colonies) are <0 on the x-axis, and those with higher fitness are >0. We applied a significance threshold of 0.05 after Benjamini–Hochberg correction for multiple testing and a difference in fitness of abs(log2(mutant/wild type))>log2(0.05) to call hits based on colony size (n=60). (B) Distributions of significant hits per gene for priority unstudied mutants (right) and all other mutants (left) showing faster (green) or slower (purple) colony growth compared to wild-type cells. (C) Distributions of significant hits per condition for all mutants showing faster (green) or slower (purple) colony growth compared to wild-type cells. (D) Fitness of mutant cells growing in 2% glycerol + 0.01% glucose in this study, plotted as in (A). Blue: mutants identified as slow growing in the same condition in our previous screen Malecki and Bähler, 2016; red: mutants annotated as ‘increased cell population growth on glycerol carbon source’ (FYPO:0004167) in PomBase (Harris et al., 2013); green rings: mutants in priority unstudied genes. Seventy-nine mutants were slow-growing in both screens (p=1 × 10–39; Fisher’s exact test, FDR corrected for multiple testing).
Figure 2—figure supplement 1
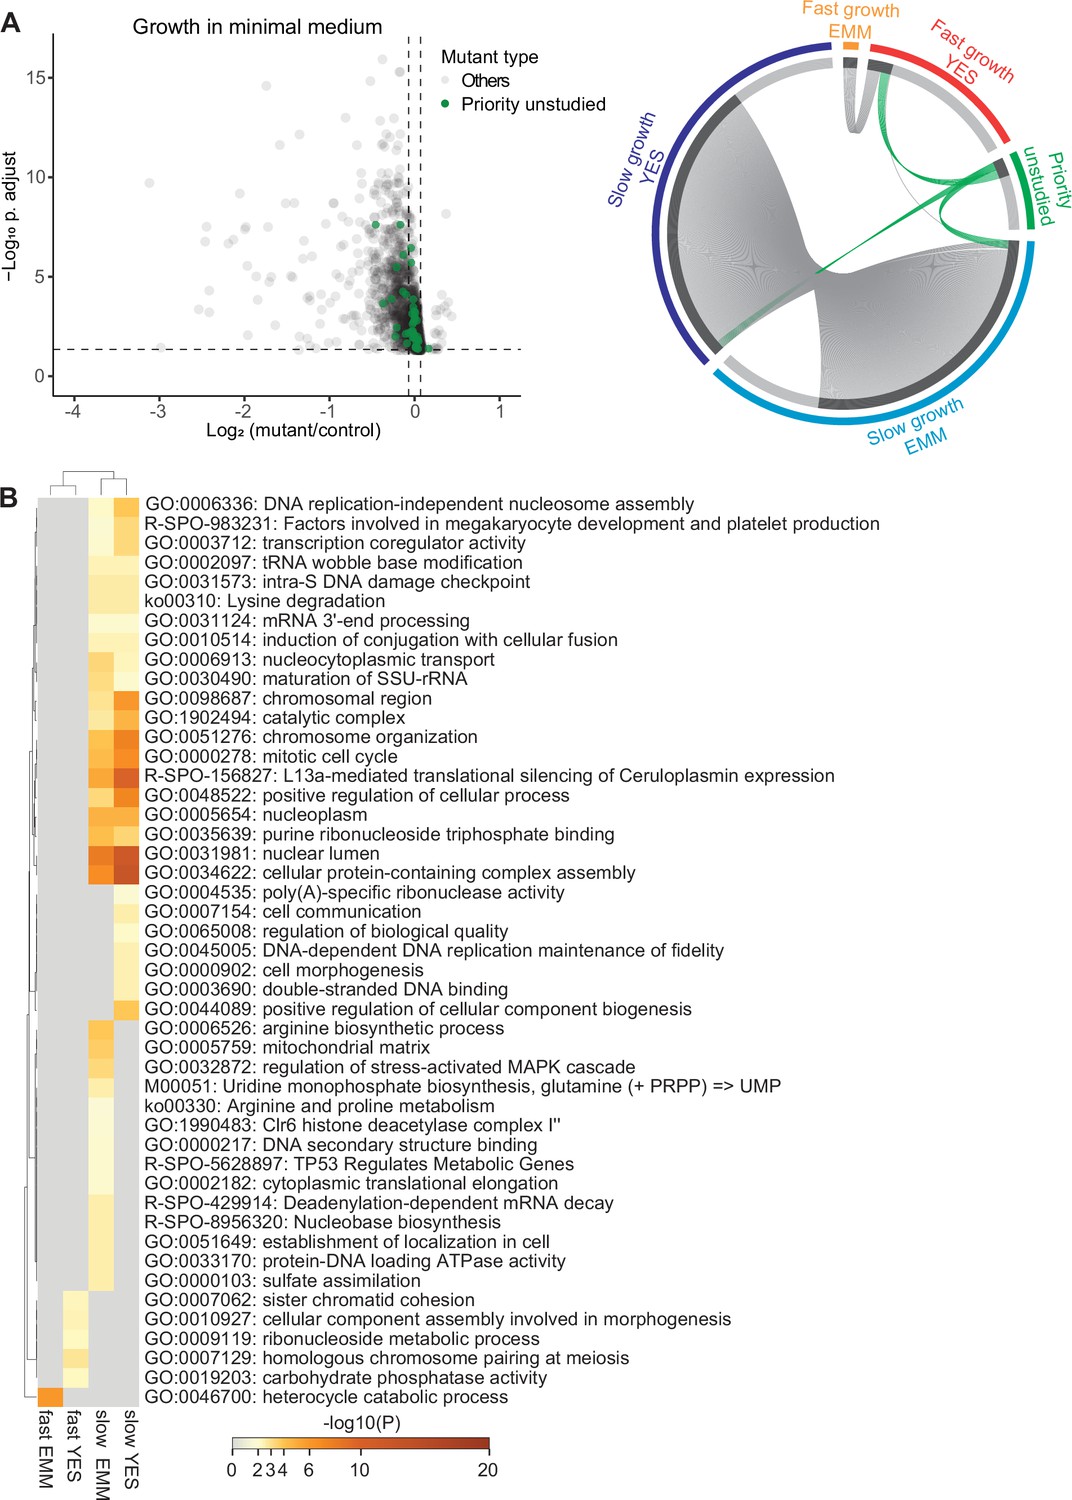
Colony-based phenotyping of mutants in benign conditions.
(A) Left: Volcano plot of mutant colony sizes for priority unstudied genes (green) and all other genes (gray) growing in minimal medium. The dashed vertical and horizontal lines show the 5% difference in effect size and significance threshold, respectively (statistics as in Figure 2A; n=8). Right: Visualisation of overlapping genes among different sets as indicated using Metascape (Zhou et al., 2019b). We classified the mutants as fast- or slow-growing relative to their growth compared to the wild-type strain in minimal (EMM) and rich (YES) media and separately show the mutants in priority unstudied genes. (B) Top gene ontology (GO) and Reactome terms enriched for fast- and slow-growth mutants in minimal (EMM) and rich (YES) medium. The different mutant classes showing phenotypes were subjected to GO enrichment analysis using Metascape.
Figure 2—figure supplement 2
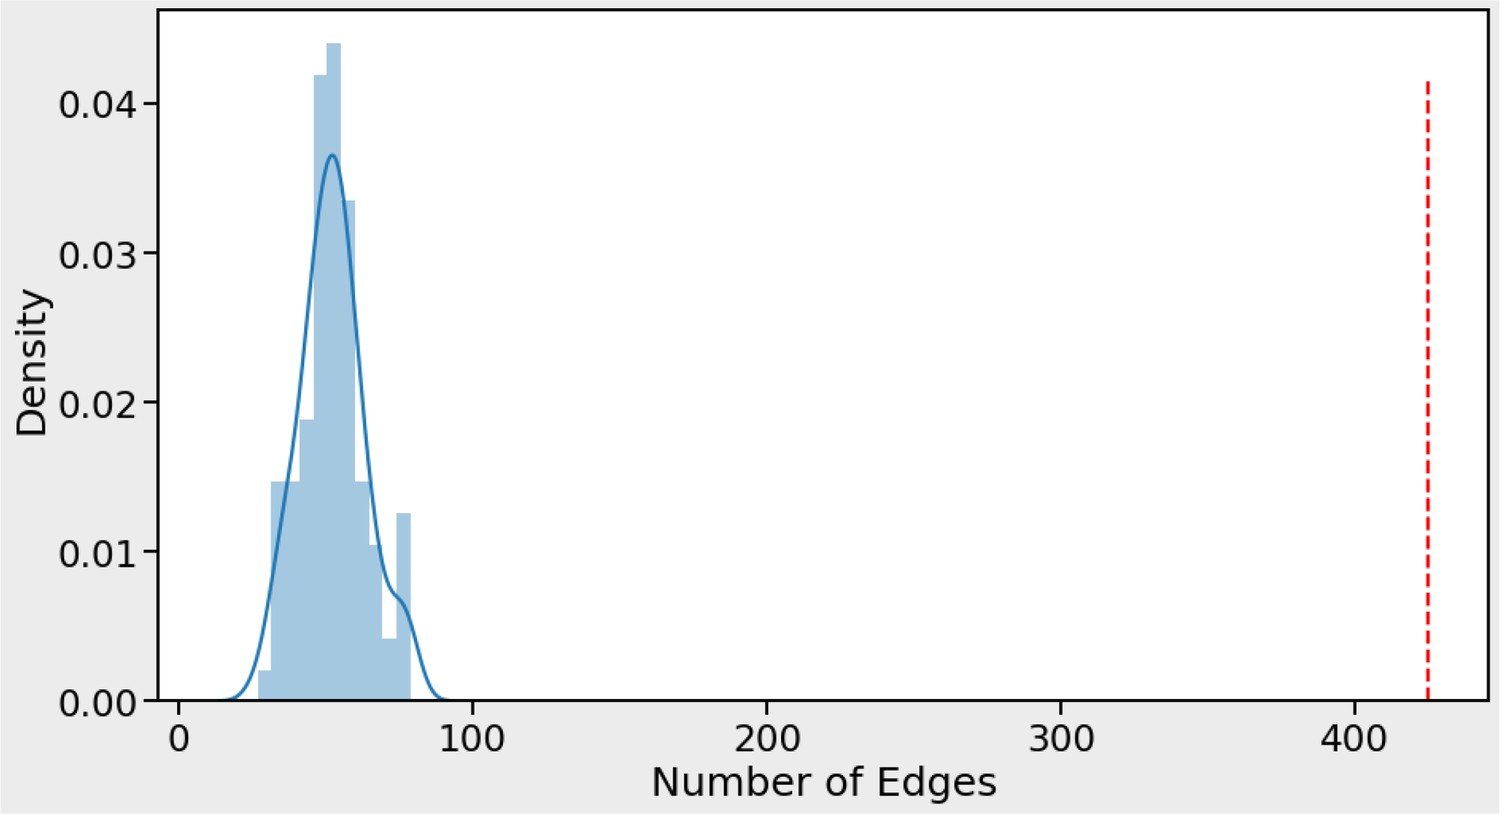
Our phenotype association matrix has much higher concordance with STRING than expected by chance.
Number of edges obtained from STRING protein interactions that are concordant with phenotype correlations (red vertical line) compared to 100 randomizations of the phenotype data (blue curve). For each STRING protein pair with a STRING-SCORE ≥750 the association was kept and the STRING-SCORE was multiplied by the phenotype-correlation score for the corresponding protein pair (obtained by measuring Pearson correlation of phenotype profiles for protein pair). In total, 425 protein pairs (edges) had a combined product of STRING-SCORE and phenotype-correlation score >0.5 (red dashed line). This number was never obtained by repeating the process 100 times after randomizing the genes in the phenotype matrix. A maximum of only 79 protein pairs (edges) was obtained for the random process (blue curve). This result indicates that the STRING data show above random concordance with the phenotype data.
Figure 2—figure supplement 3
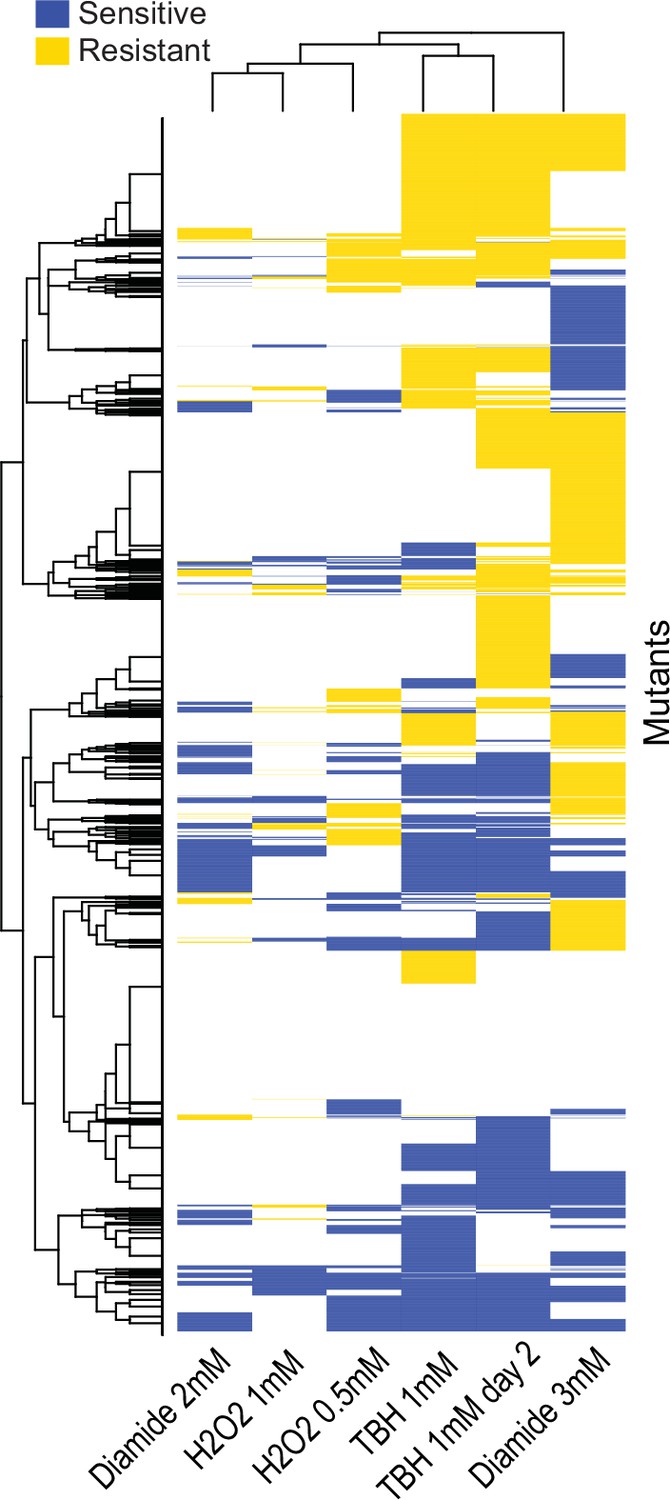
Clusters of mutant phenotype profiles for oxidative-stress conditions.
Hierarchical clustering of discretized data for 3449 deletion mutants (rows) in six conditions (columns). For discretizing the phenotype data, we classed mutants as either resistant (yellow), sensitive (blue), or similar (white) relative to their fitness in the corresponding control condition (as in Figure 3A). Basic clustering was performed in R using heatmap.2, with Euclidean measure to obtain the distance matrix and complete agglomeration method.
Figure 3
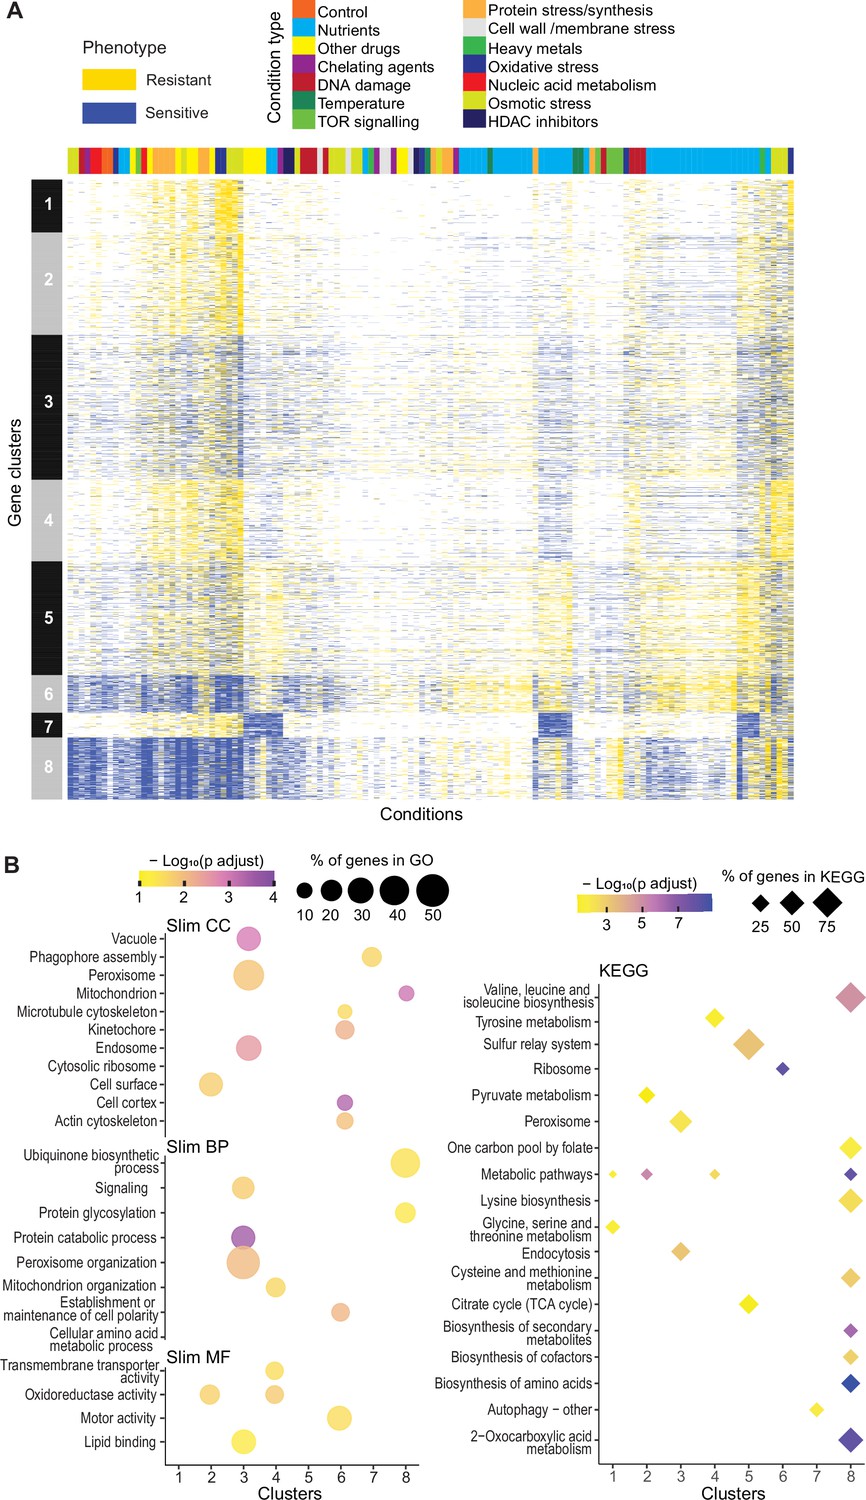
Mutant phenotype profiles.
(A) Clustering of discretized data for 3449 deletion mutants (rows) in 98 conditions (columns), following recommendations from the R package microbial Phenotypes. For discretizing the phenotype data, we classed mutants as either resistant (yellow), sensitive (blue), or similar (white) relative to their fitness in the corresponding control condition, applying an effect-size threshold of ≥10% and, for the two benign conditions, also a significance threshold of p<0.05 (Supplementary file 1). To improve the clustering, we removed conditions and mutants that produced <4 phenotypes, the three conditions that produced >2400 phenotypes, and genes with >50% of missing values. Different types of conditions are color-coded on top. Indicated at left are the eight main clusters, calculated using k-medoids in R (pam function) and a distance of 1-Pearson correlation. Using the function fviz_nbclust (R package factoextra), we determined that 8 is an optimum number of clusters. (B) Functional enrichments of the eight gene clusters in (A) using GO slim categories (Carbon et al., 2021) for Cellular Component (CC), Biological Process (BP), and Molecular Function (MF) (left, using SystempipeR) as well as KEGG pathways (right, using g:Profiler) (Raudvere et al., 2019).
Figure 4 with 2 supplements
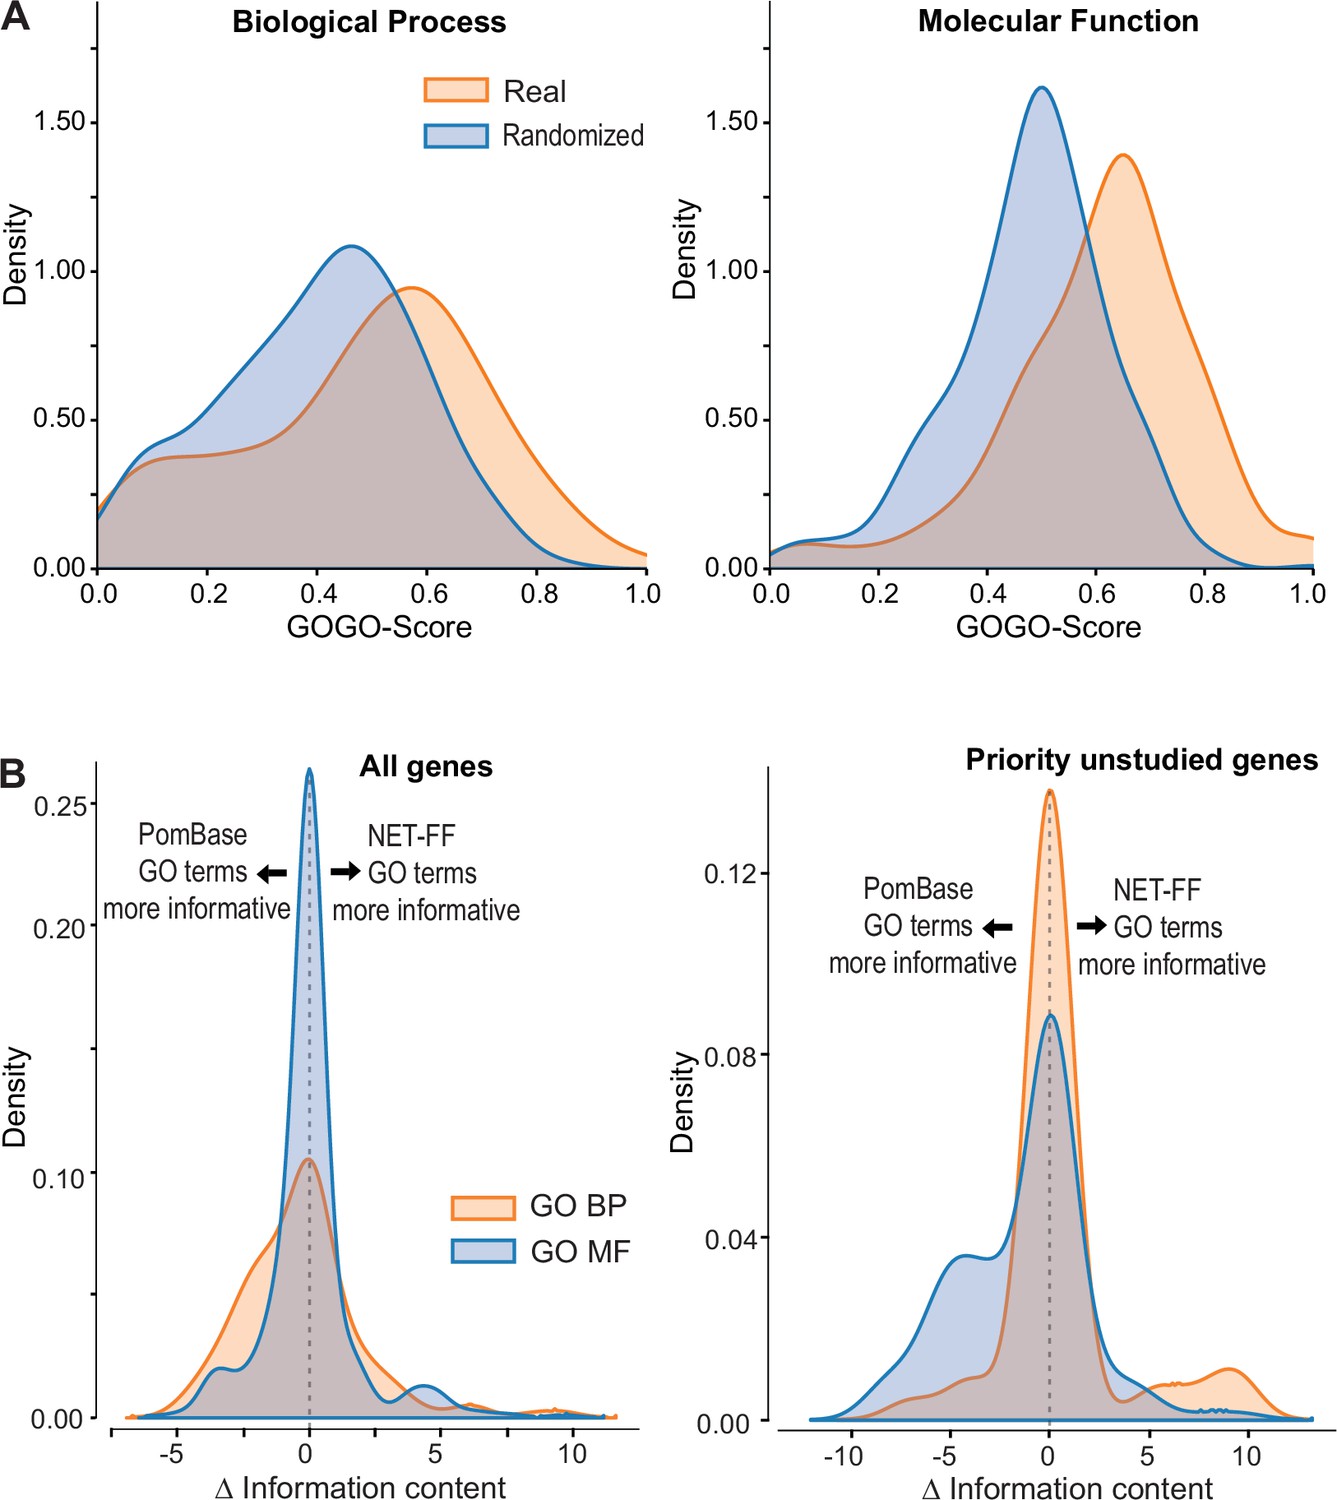
NET-FF predictions of gene ontology (GO) terms for S. pombe proteins.
(A) GOGO semantic similarity scores for GO terms predicted by NET-FF and GO terms annotated by PomBase, both for real (orange) and randomized (blue) datasets from NET-FF. Left: Biological Process data, right: Molecular function data. (B) Information content distribution for GO terms predicted by NET-FF and GO terms annotated by PomBase, both for GO Biological Process (orange) and GO Molecular Function (blue) terms. Left: dataset for all genes, right: subset for priority unstudied genes.
Figure 4—figure supplement 1
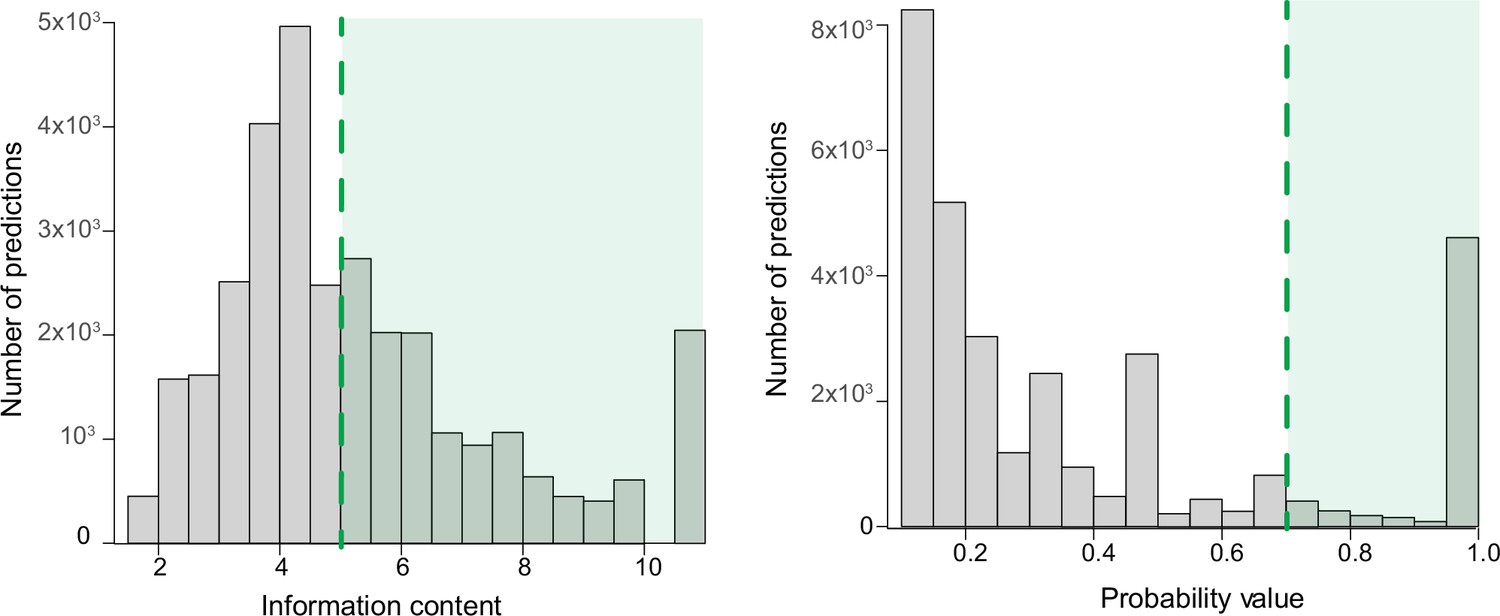
Filtering of predictions by information content and probability value.
Illustration of the criteria for filtering the predictions (green area) by information content >5 (left) and by probability value >0.7 (right).
Figure 4—figure supplement 2

Performance of NET-FF predictor by source data.
Precision-recall curves plotted for each repeat (translucent curves) and micro-averaged data (solid curves). FF: FunFam homology data; NET: network data; NET-FF: combined FF and NET information; numbers indicate corresponding micro-averaged AUPR.
Figure 5
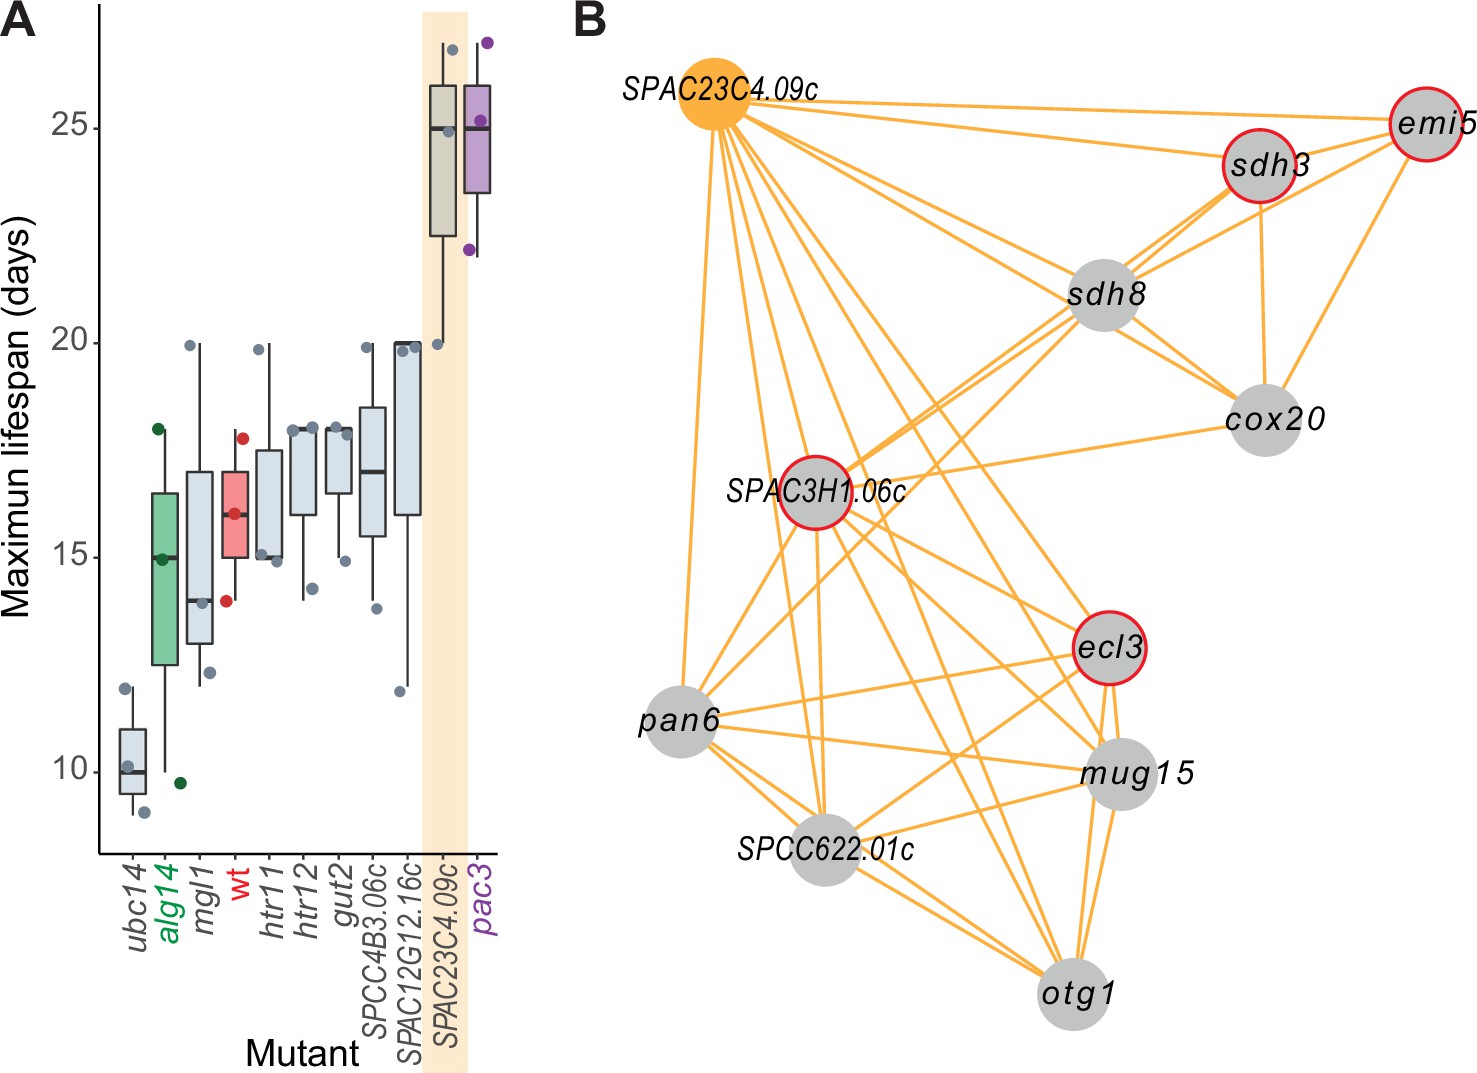
Experimental validation of new aging-related gene reflecting its NET-FF gene ontology (GO) predictions and phenotype-correlation network.
(A) Maximal chronological lifespan (CLS) for eight selected deletion mutants of genes with NET-FF GO terms related to aging/cell death and DNA damage repair, measured using a high-throughput CLS assay (Romila et al., 2021). Known short- and long-lived mutants are highlighted in green and purple, respectively. Of the eight mutants, ubc14 and htr12 were known to be short- and long-lived, respectively (Romila et al., 2021). As controls, the maximal CLS of known short-lived (alg14) and long-lived (pac3) mutants (Romila et al., 2021) and wild-type cells (wt, red) are included. Three independent biological repeats were performed with actual data points shown as dots. Orange band: mutant in priority unstudied gene (SPAC23C4.09c) showing strong longevity phenotype. Data available in Figure 5—source data 1. (B) Cluster from Cytoscape network (see Figure 6) representing phenotype correlations between the SPAC23C4.09c gene-deletion mutant and ten other mutants. Orange edges show positive phenotype correlations, and red circles indicate genes with previously known CLS phenotypes (Romila et al., 2021; Ohtsuka et al., 2011). Details are discussed in the main text.
-
Figure 5—source data 1
Data for chronological lifespan (CLS) plots in Figure 5A.
- https://cdn.elifesciences.org/articles/88229/elife-88229-fig5-data1-v1.xlsx
Figure 6 with 3 supplements
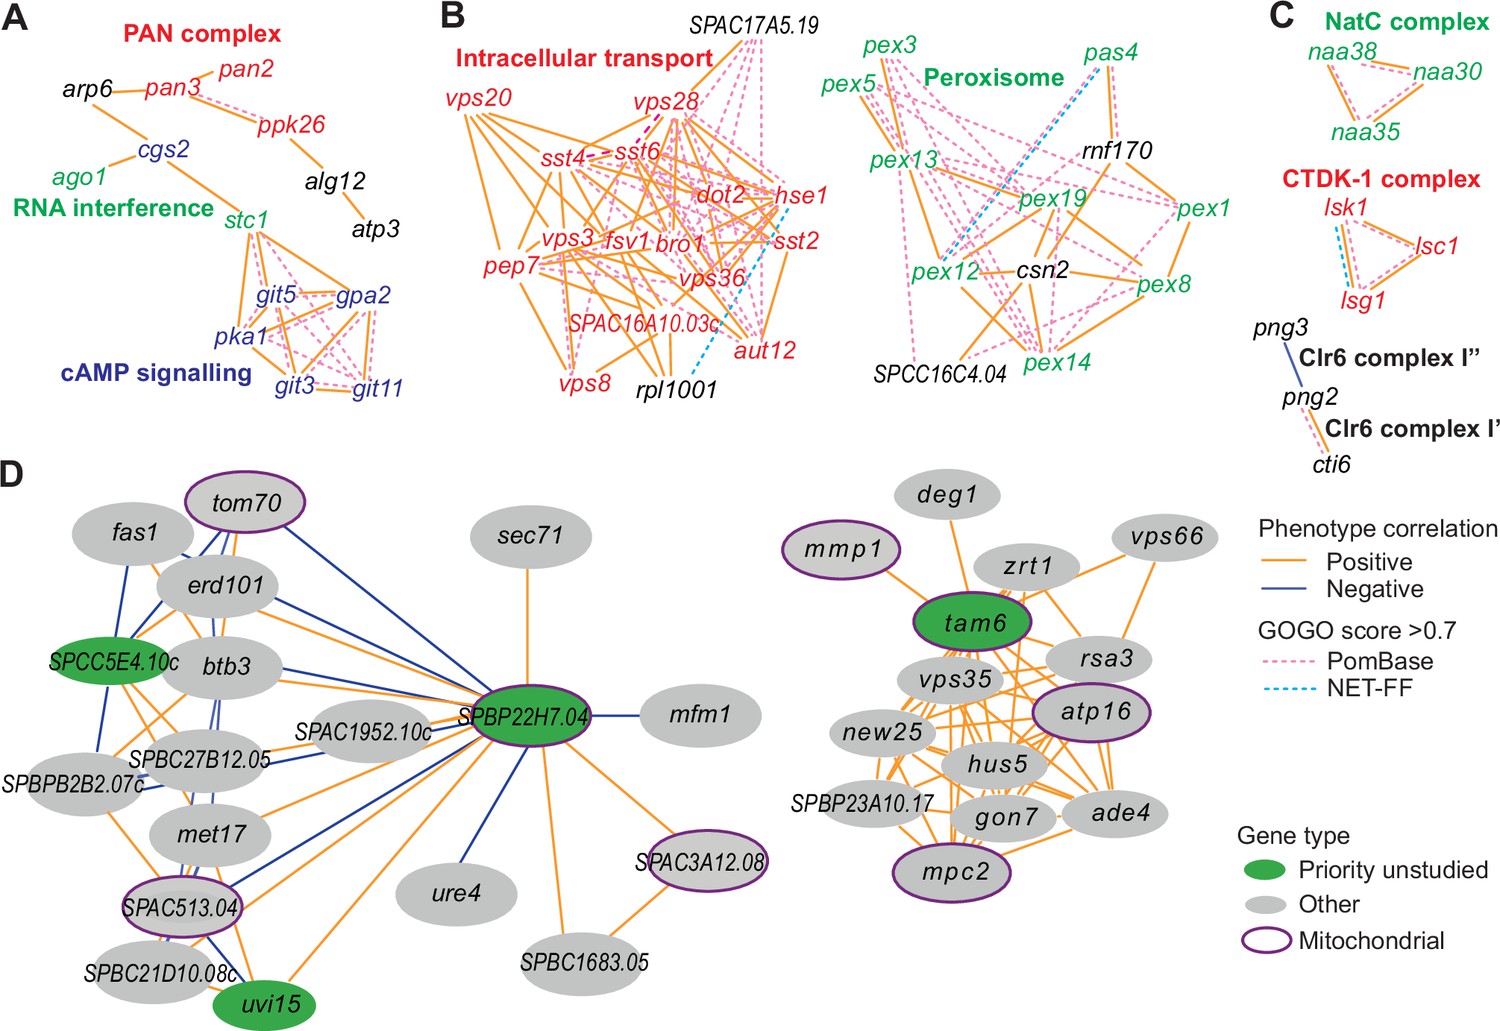
Example phenotype-correlation clusters from Cytoscape network.
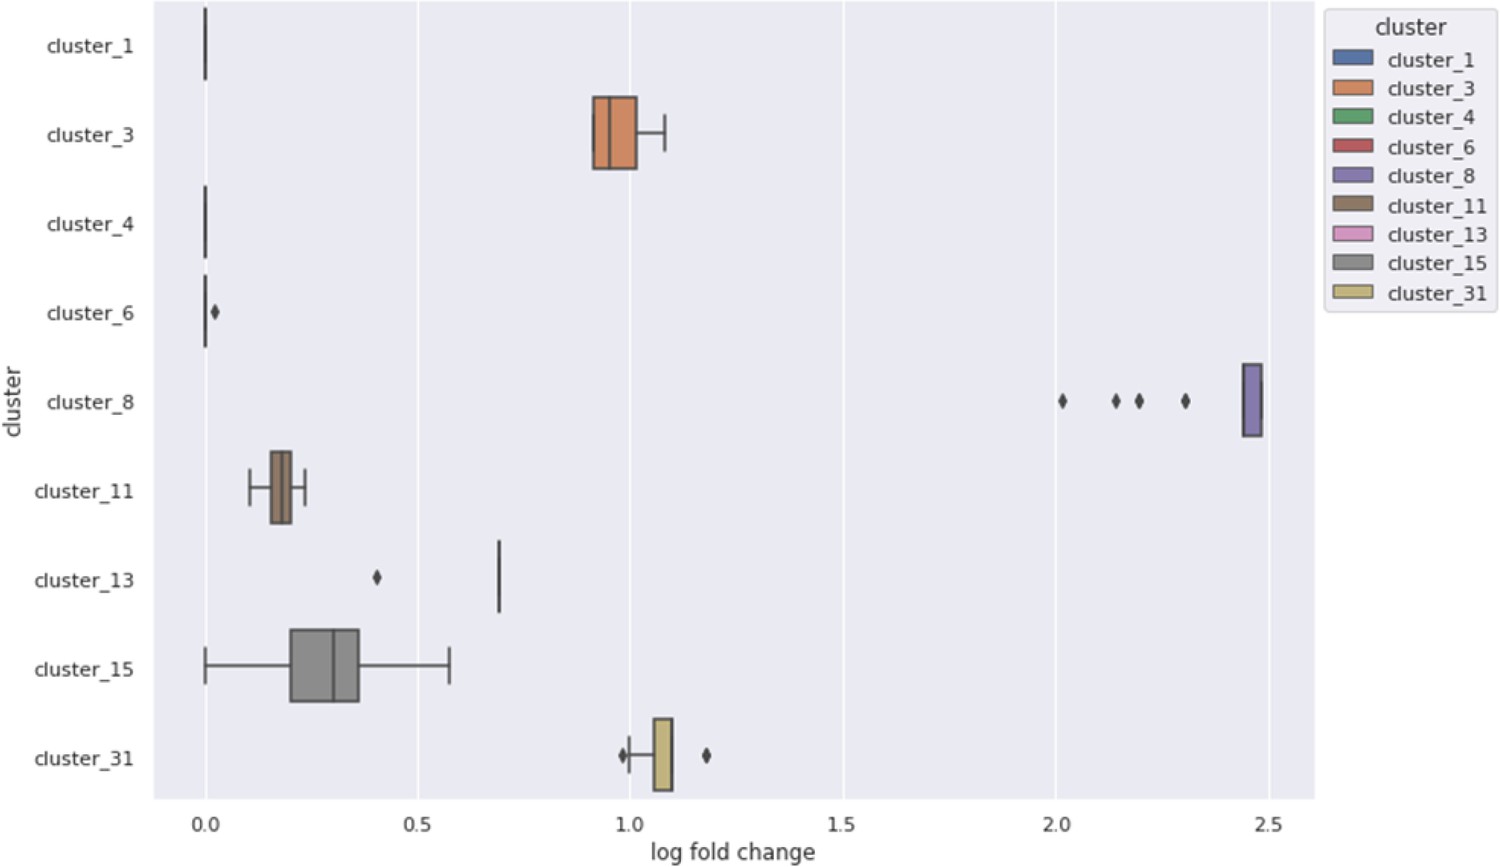
Positive and negative phenotype correlations across the 131 conditions are indicated as orange and blue edges, respectively. Gene pairs with high gene ontology (GO) similarities based on PomBase annotations or NET-FF predictions are indicated as hatched pink and bright blue edges, respectively. (A) Cluster 13 consists of a branch with all members of the PAN complex (red) and a branch containing six genes involved in cAMP signaling (blue), along with two genes involved in RNA interference (green). (B) Cluster 31 enriched for genes involved in vacuolar and endosomal transport (red) and Cluster 22 enriched for genes with peroxisome functions (green). (C) Three clusters linking members of the same protein complexes, involved in protein maturation (NatC, green), regulation of transcription elongation (CTDK-1, red), and histone deacetylation (Clr6, black). The data reflect different Clr6 sub-complexes, with png2 and cti6 being positively correlated (Clr6 complex I’) but png2 and png3 being negatively correlated (Clr6 complex I”) (Zilio et al., 2014). (D) Two networks containing priority unstudied genes (green), including those with implicated mitochondrial functions (green with purple ellipses), together with their nearest neighbors based on phenotype correlation, which includes genes with known mitochondrial functions (gray with purple ellipses). For simplicity, high GOGO pairs are not indicated in these networks.
Figure 6—figure supplement 1
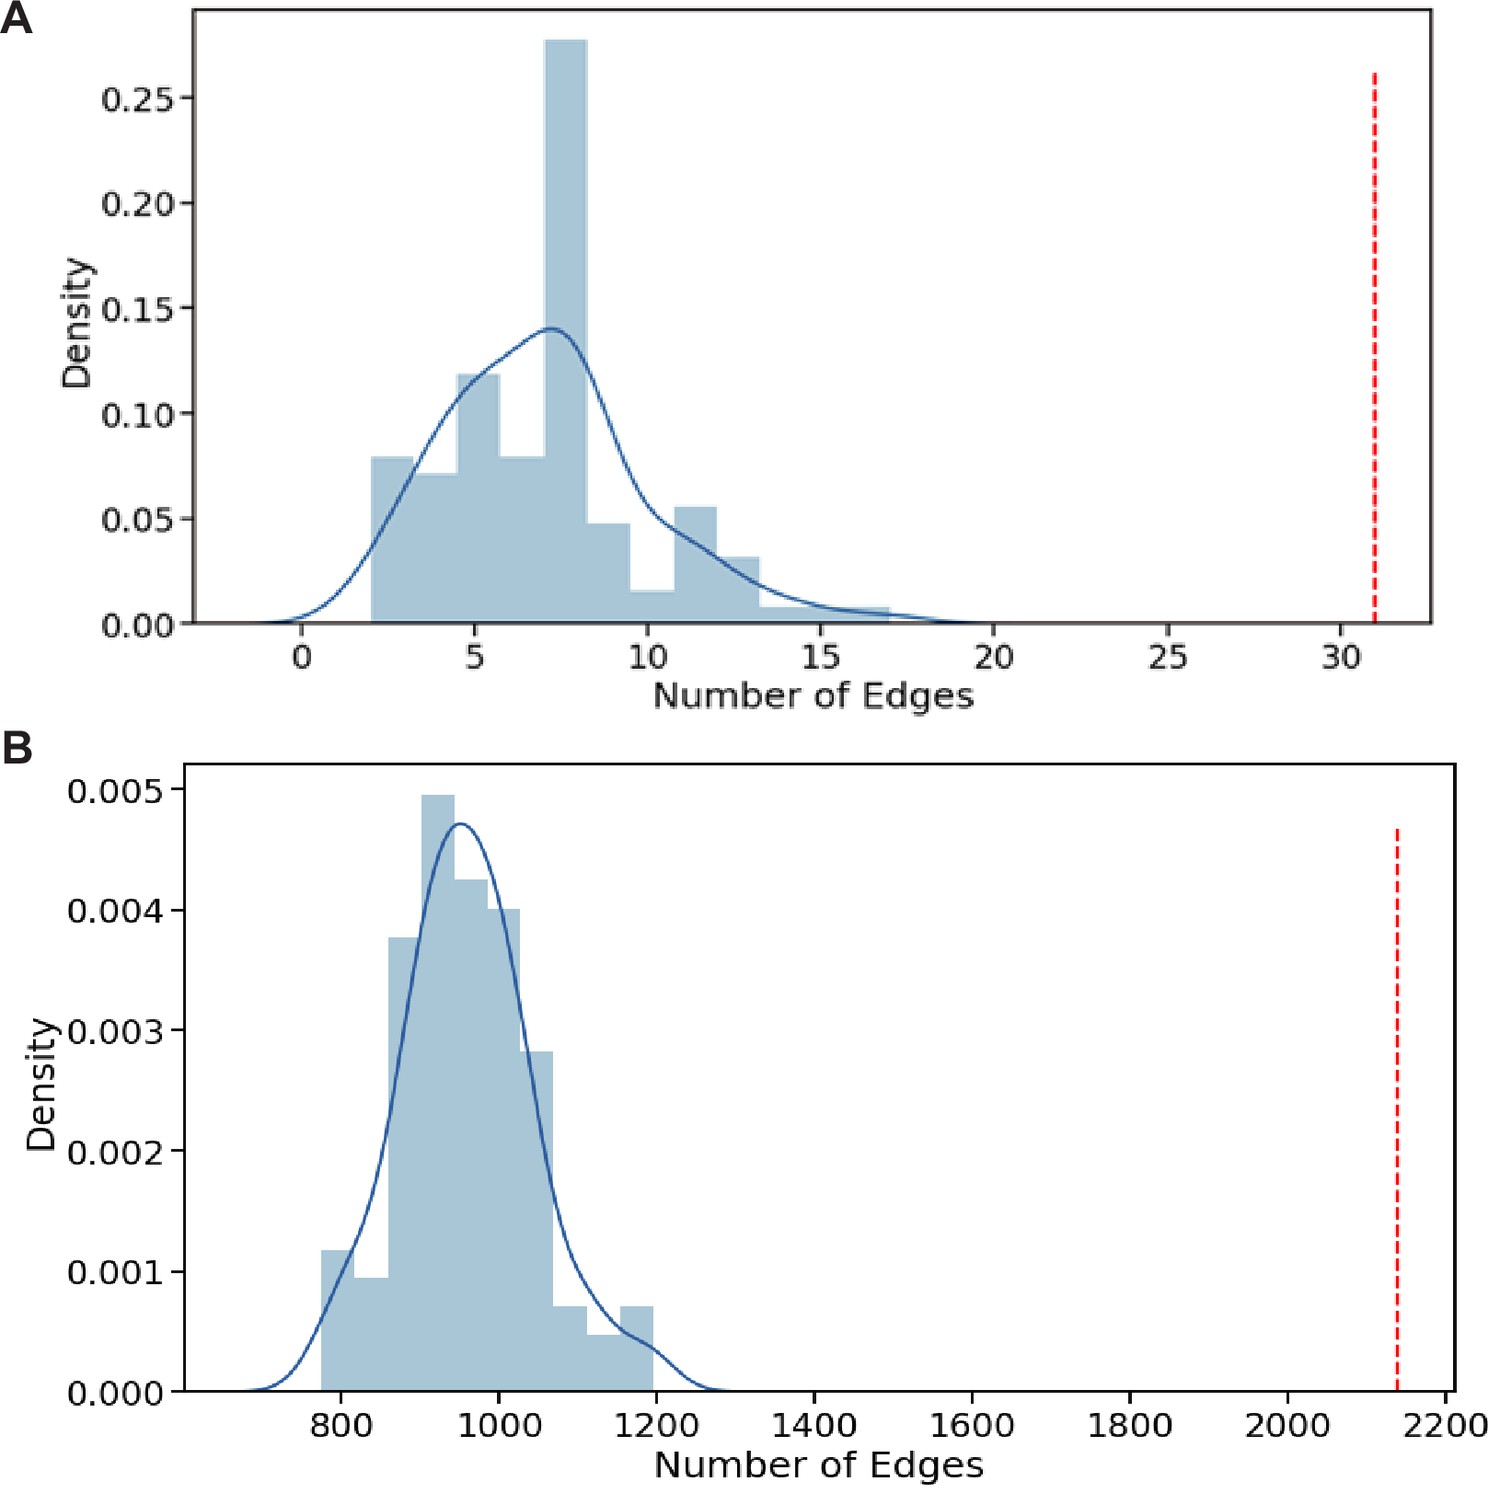
Gene ontology (GO) association networks show higher concordance with our phenotype data than expected by chance.
(A) For each gene pair with a predicted GOGO BP (score >0.5) the GOGO score was multiplied by the PHEPHE score of the same gene pair (obtained from Pearson correlation of phenotype profiles across conditions for each gene). If the resulting combined product of GOGO and PHEPHE scores was >0.5, we added the gene pair link to a graph (network). For our dataset, this resulted in a graph of 31 edges (red line above). Graphs of this size were never obtained by repeating the process 100 times by randomizing the PHEPHE matrix column gene labels before the lookup on the PHEPHE score (blue data). A maximum graph size of 17 edges was found through 100 randomizations. This result indicates that the GO predictions show above random concordance with the phenotype data. (B) For each gene pair with a PomBase GOGO MF or BP score >0.7, the GOGO score was multiplied by the PHEPHE score of the same gene pair (obtained from Pearson correlation of phenotype profiles across conditions). If the resulting combined product of PomBase GOGO and PHEPHE scores was >0.5, we added the gene pair link to a graph (network). For our dataset, this resulted in a graph of over 2100 edges (red line above). Graphs of this size were never obtained by repeating the process 100 times by randomizing the PHEPHE matrix column gene labels before the lookup on the PHEPHE score (blue data). This result indicates that the PomBase GO associations show above random concordance with the phenotype data.
Figure 6—figure supplement 2
Enrichment of high GOGO gene pair edges in nine clusters from the Cytoscape clustering of phenotype correlations, containing at least 15 genes.
Six showed more high GOGO gene pairs based on NET-FF predictions than expected by chance.
Figure 6—figure supplement 3
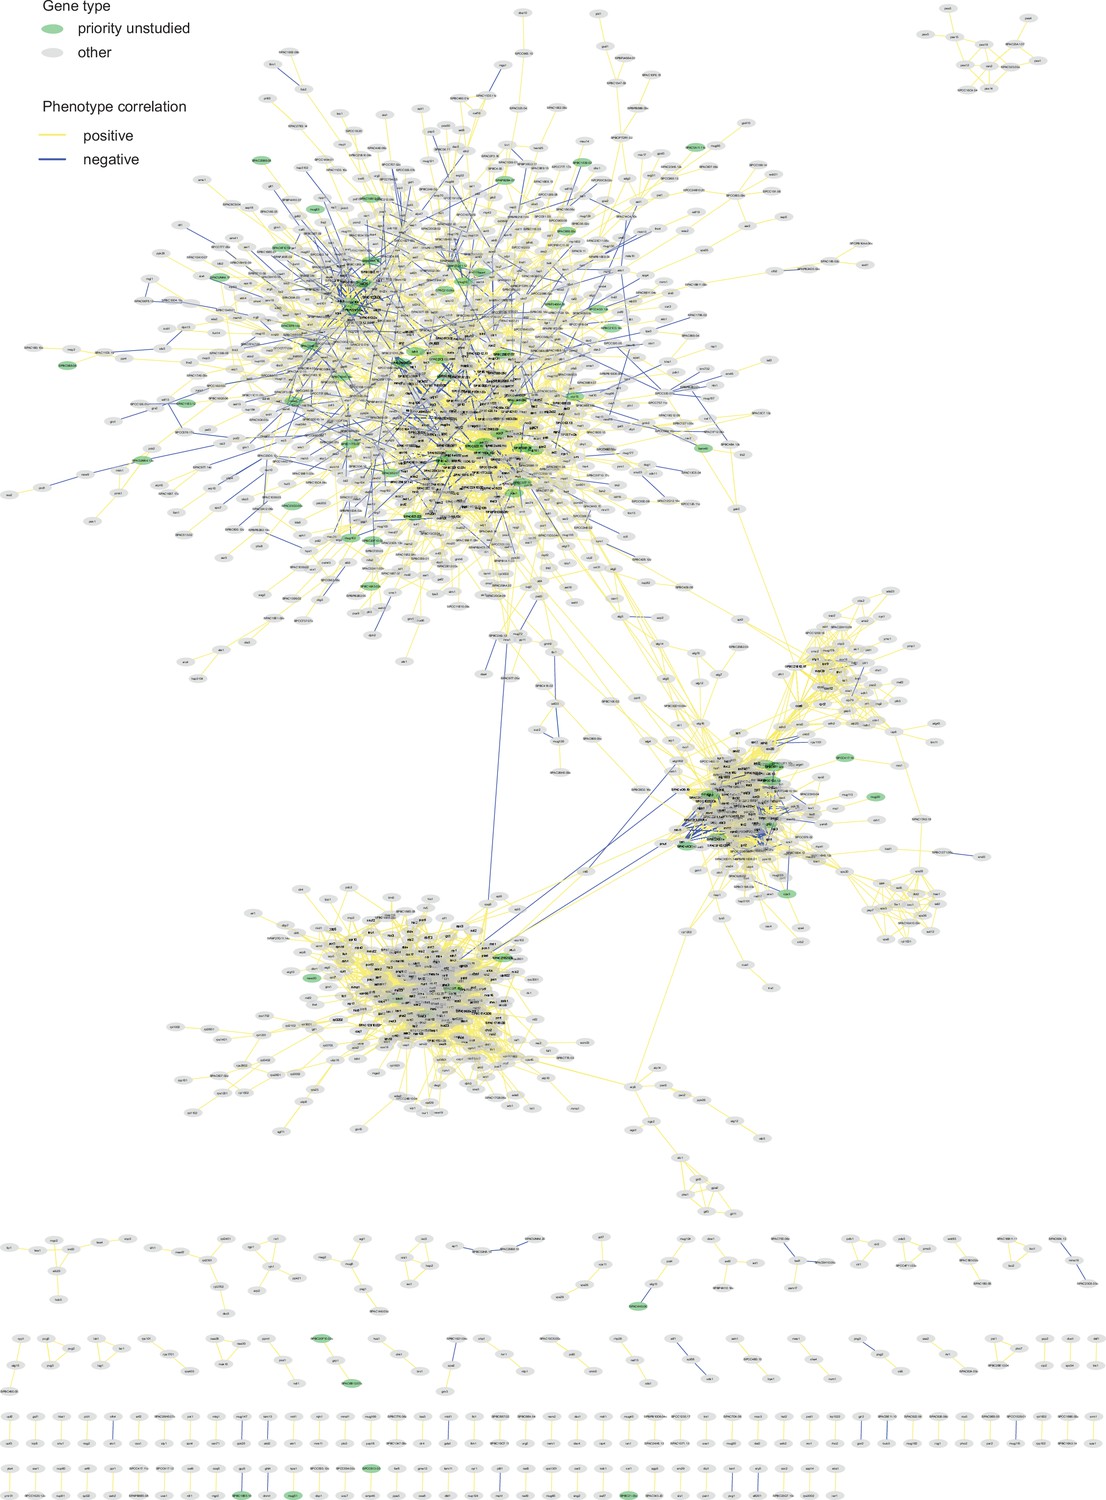
Phenotype-correlation clusters from the entire Cytoscape network.
Author response image 1

Additional files
-
Supplementary file 1
Supporting data for phenomics assays.
- https://cdn.elifesciences.org/articles/88229/elife-88229-supp1-v1.xlsx
-
Supplementary file 2
Data for NET-FF predictions and integrated analyses.
- https://cdn.elifesciences.org/articles/88229/elife-88229-supp2-v1.xlsx
-
MDAR checklist
- https://cdn.elifesciences.org/articles/88229/elife-88229-mdarchecklist1-v1.docx
Download links
A two-part list of links to download the article, or parts of the article, in various formats.
Downloads (link to download the article as PDF)
Open citations (links to open the citations from this article in various online reference manager services)
Cite this article (links to download the citations from this article in formats compatible with various reference manager tools)
Broad functional profiling of fission yeast proteins using phenomics and machine learning
eLife 12:RP88229.
https://doi.org/10.7554/eLife.88229.3


