A timeline of bacterial and archaeal diversification in the ocean
- Department of Biological Sciences, Virginia Tech, United States
- Center for Emerging, Zoonotic, and Arthropod-borne Pathogens, Virginia Tech, United States
Figures
Figure 1
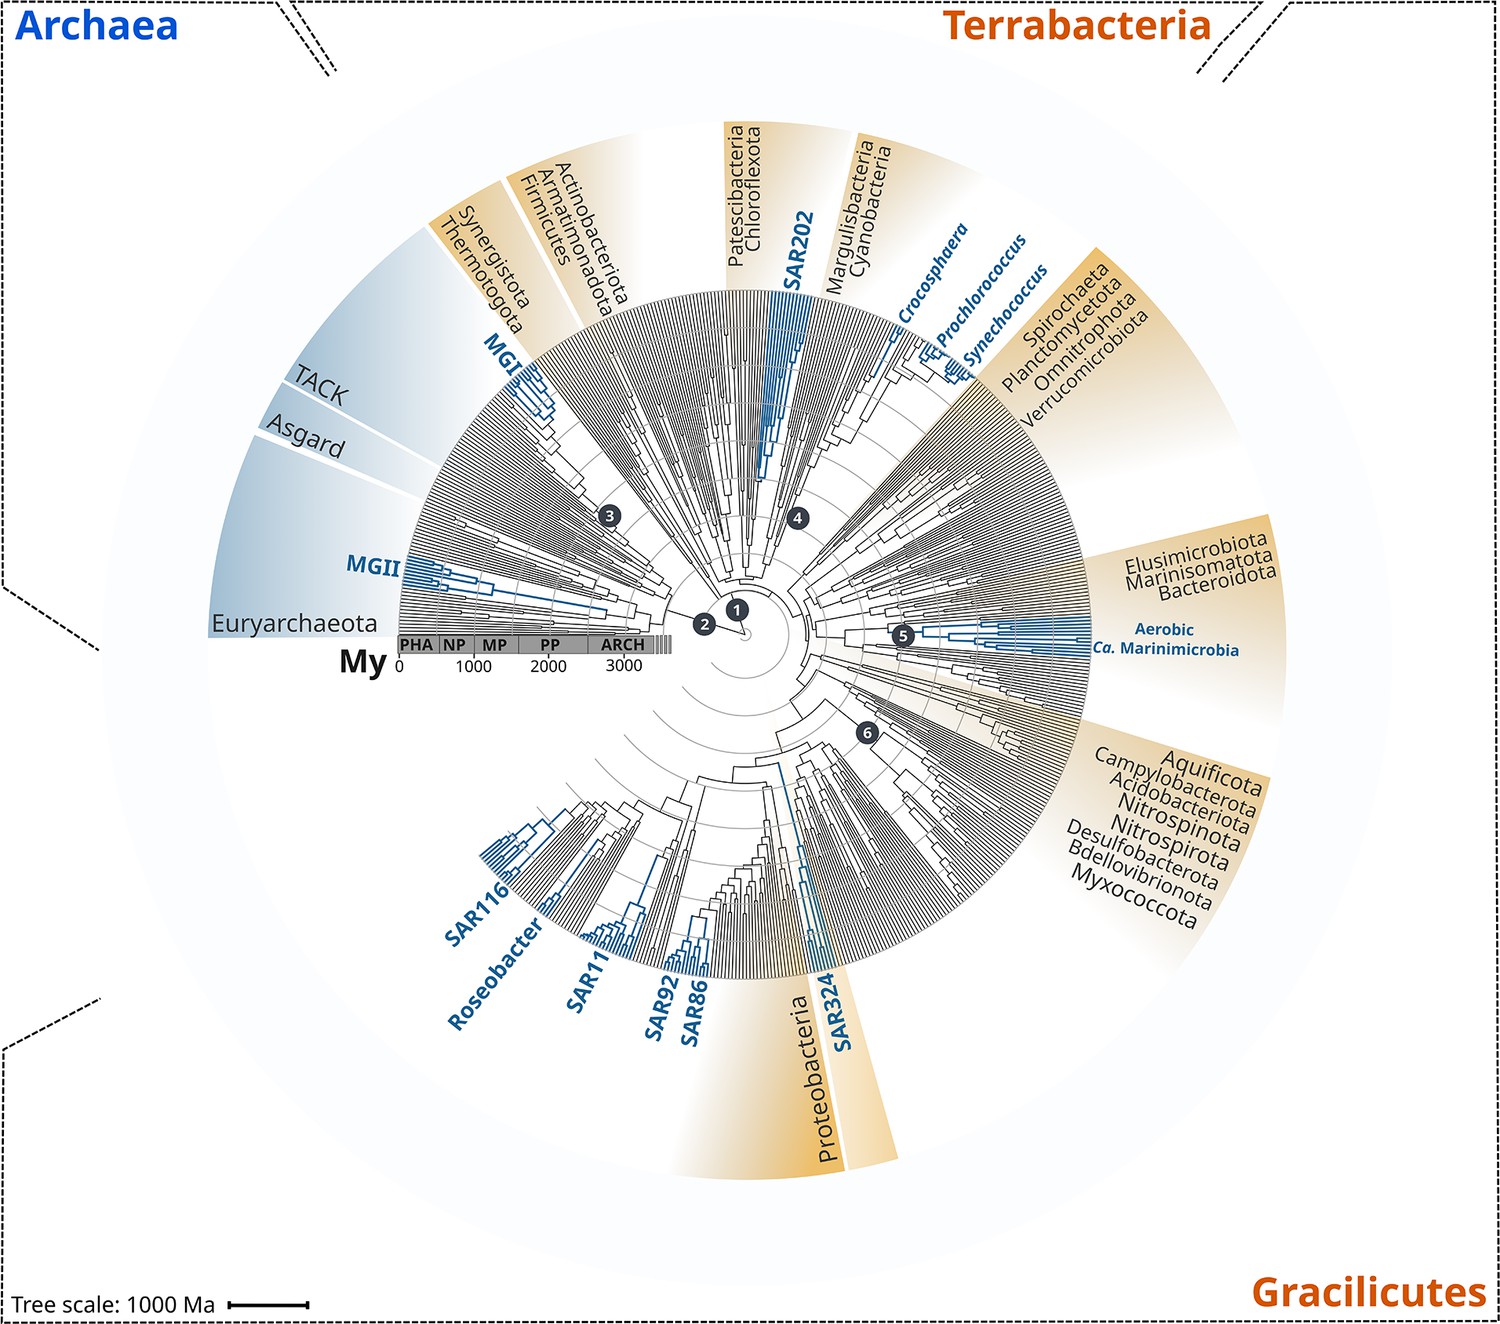
Rooted inter-domain Tree of Life used for molecular dating analyses.
Maximum likelihood tree constructed with IQ-TREE v1.6.12 using the concatenation of 30 RNAP subunits and ribosomal protein sequences and the substitution model LG + R10. Blue labels represent the marine clades dated in our study. Dark gray dots show the temporal calibration used in our molecular dating analyses (Table 1). The marine clades shown are classified on the Genome Taxonomy Database (GTDB) as follows: MGII, Poseidoniales; MGI, Nitrososphaerales; SAR202, SAR202; Crocosphaera, Crocosphaera; Prochlorococcus, Prochlorococcus; Synechococcus, Synechococcus; Ca. Marinimicrobia, Marinisomatia; SAR324, SAR324; SAR86, Oceanospirillales; SAR92, Porticoccaceae; SAR11, Pelagibacterales; Roseobacter, Rhodobacteraceae; SAR116, Puniceispirillaceae. Abbreviations: PHA, Phanerozoic; NP, Neoproterozoic; MP, Mesoproterozoic; PP, Paleoproterozoic; ARCH, Archaean.
Figure 2 with 3 supplements
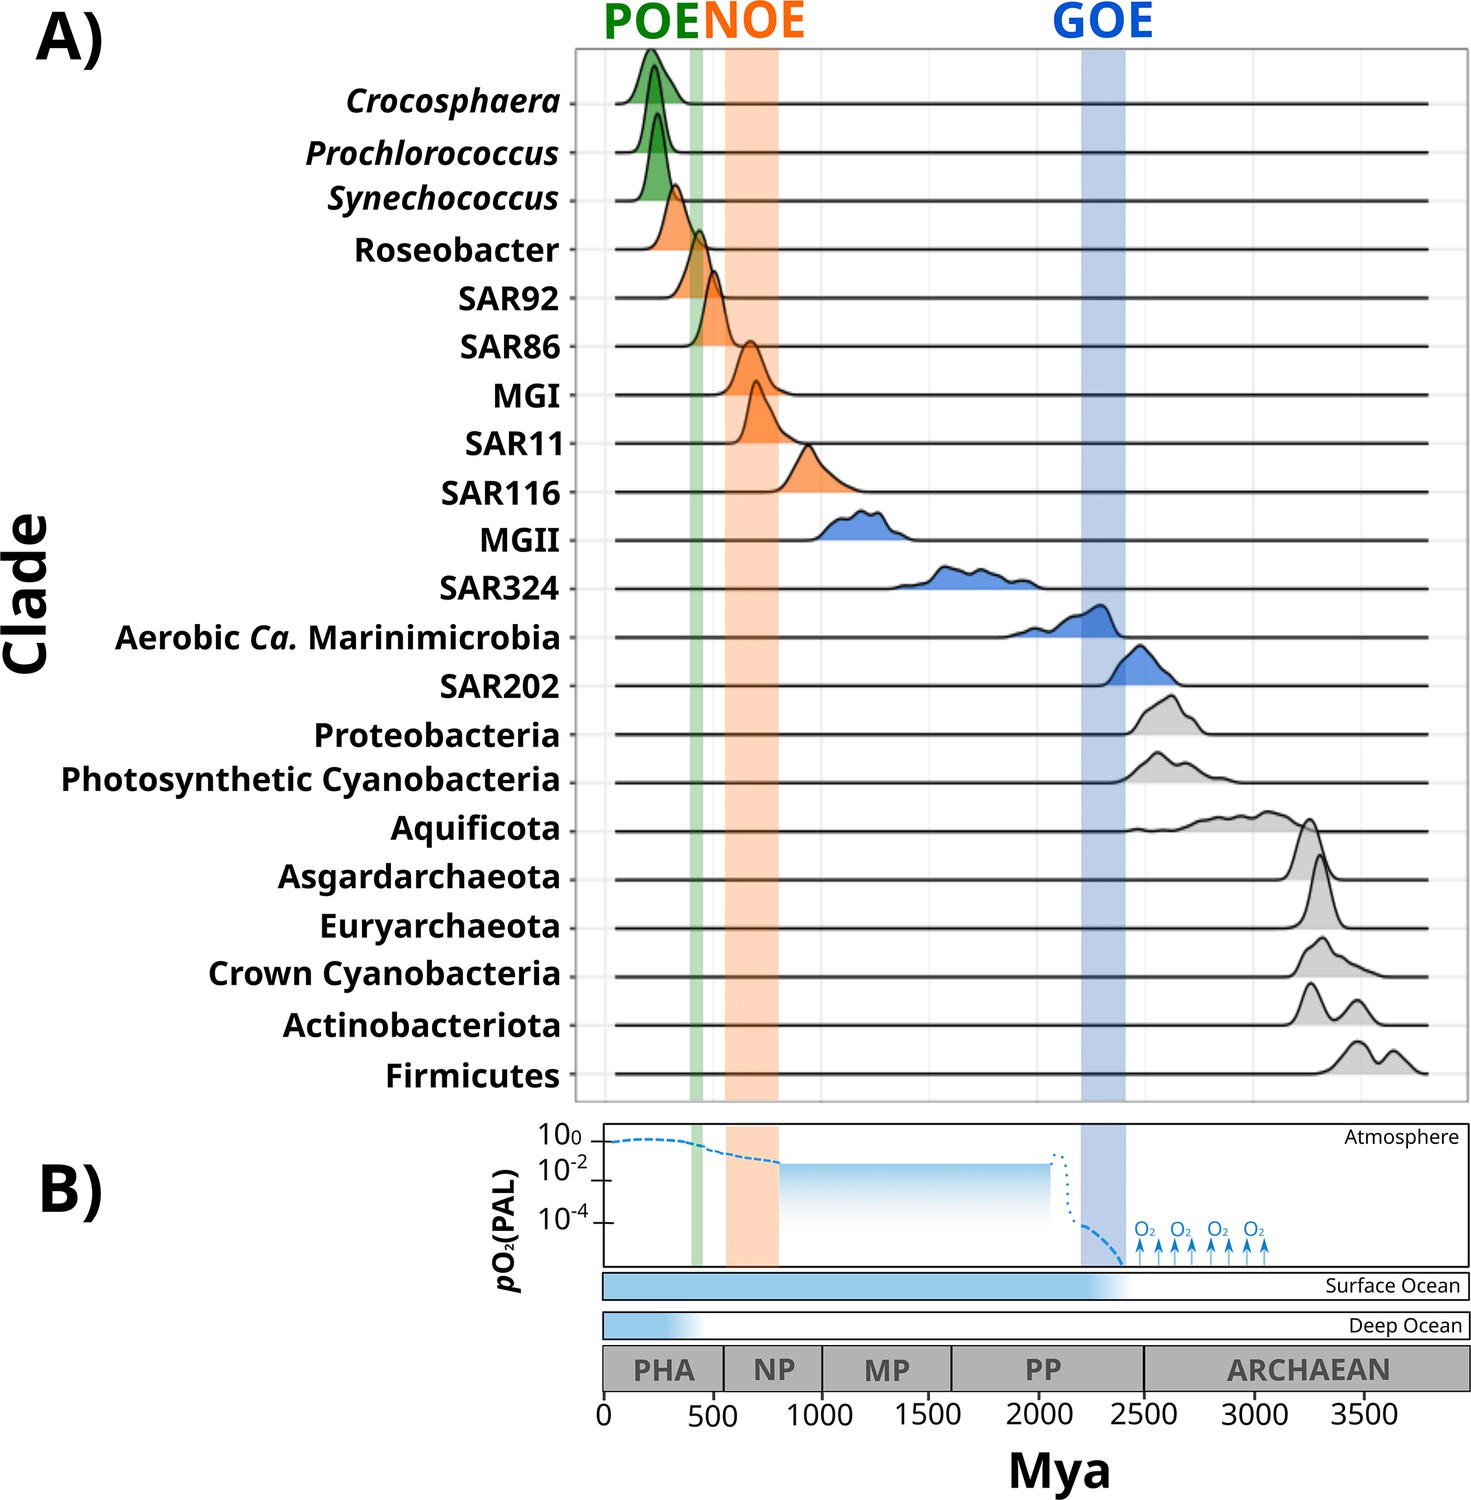
Dates of the diversification of marine microbial clades and the redox history of Earth’s atmosphere, surface ocean, and deep ocean.
(A) Ridges represent the distribution of 100 Bayesian dates estimated using a relaxed molecular clock and an autocorrelated model (see ‘Materials and methods’). Ridges of marine clades were colored based on their diversification date: green, late-branching phototrophs; orange, late-branching clades; blue, early-branching clades. The timing of the diversification of major bacterial and archaeal superphyla is represented with gray ridges. Molecular dating estimates resulting from the uncorrelated model Uncorrelated Gamma Multiplies (UGAM) and the Autocorrelated Model CIR are shown in Figure 2—figure supplement 3. (B) Oxygenation events and redox changes across Earth’s history. Panel adapted from previous work (Figure 1 of Alcott et al., 2019). Abbreviations: POE, Paleozoic Oxidation Event; NOE, Neoproterozoic Oxidation Event; GOE, Great Oxidation Event; Pha, Paleozoic; NP, Neoproterozoic; MP, Mesoproterozoic; PP, Paleoproterozoic.
Figure 2—figure supplement 1
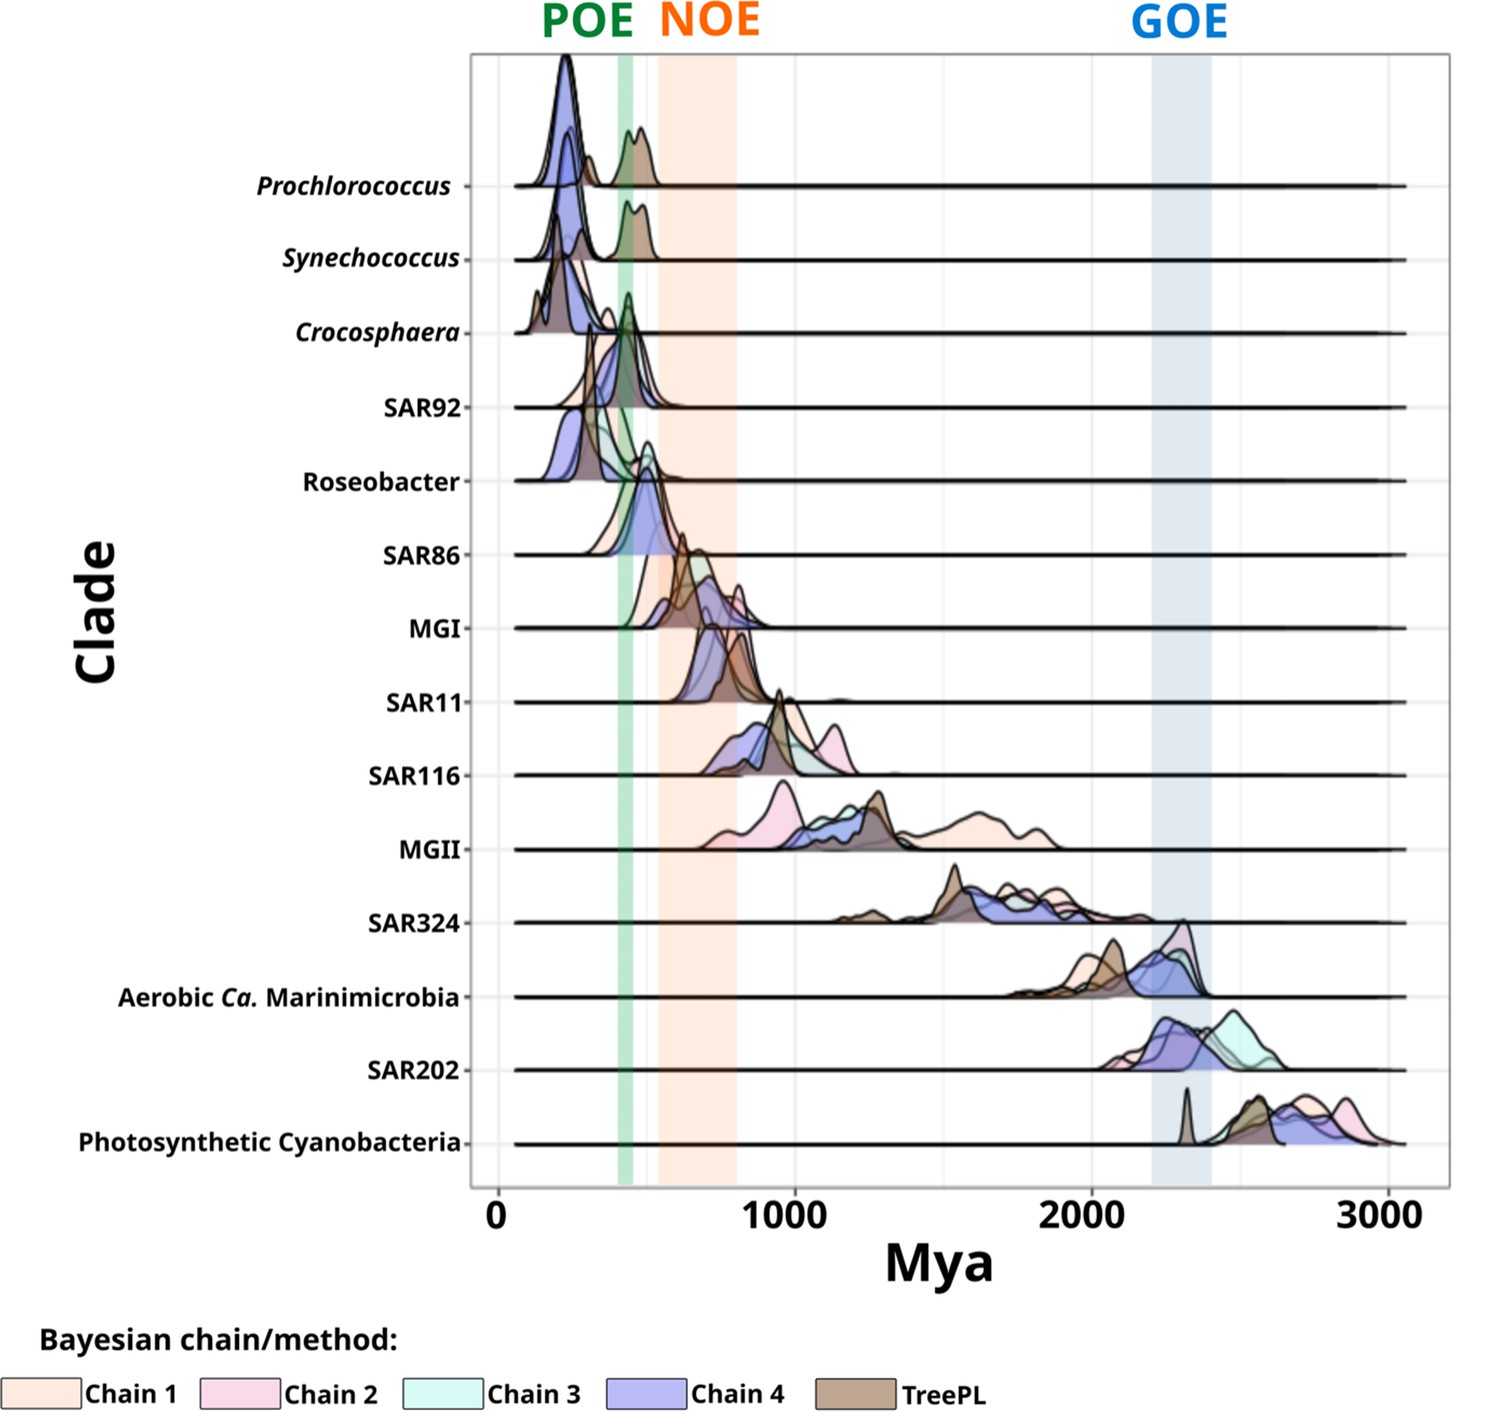
Comparison of the age distribution of marine microbial clades using a Bayesian and a penalized likelihood approach for molecular dating.
Ridges represent the age of 100 and 1000 replicate age estimates for each Bayesian independent chains and penalized likelihood analyses, respectively (see ‘Materials and methods’).
Figure 2—figure supplement 2
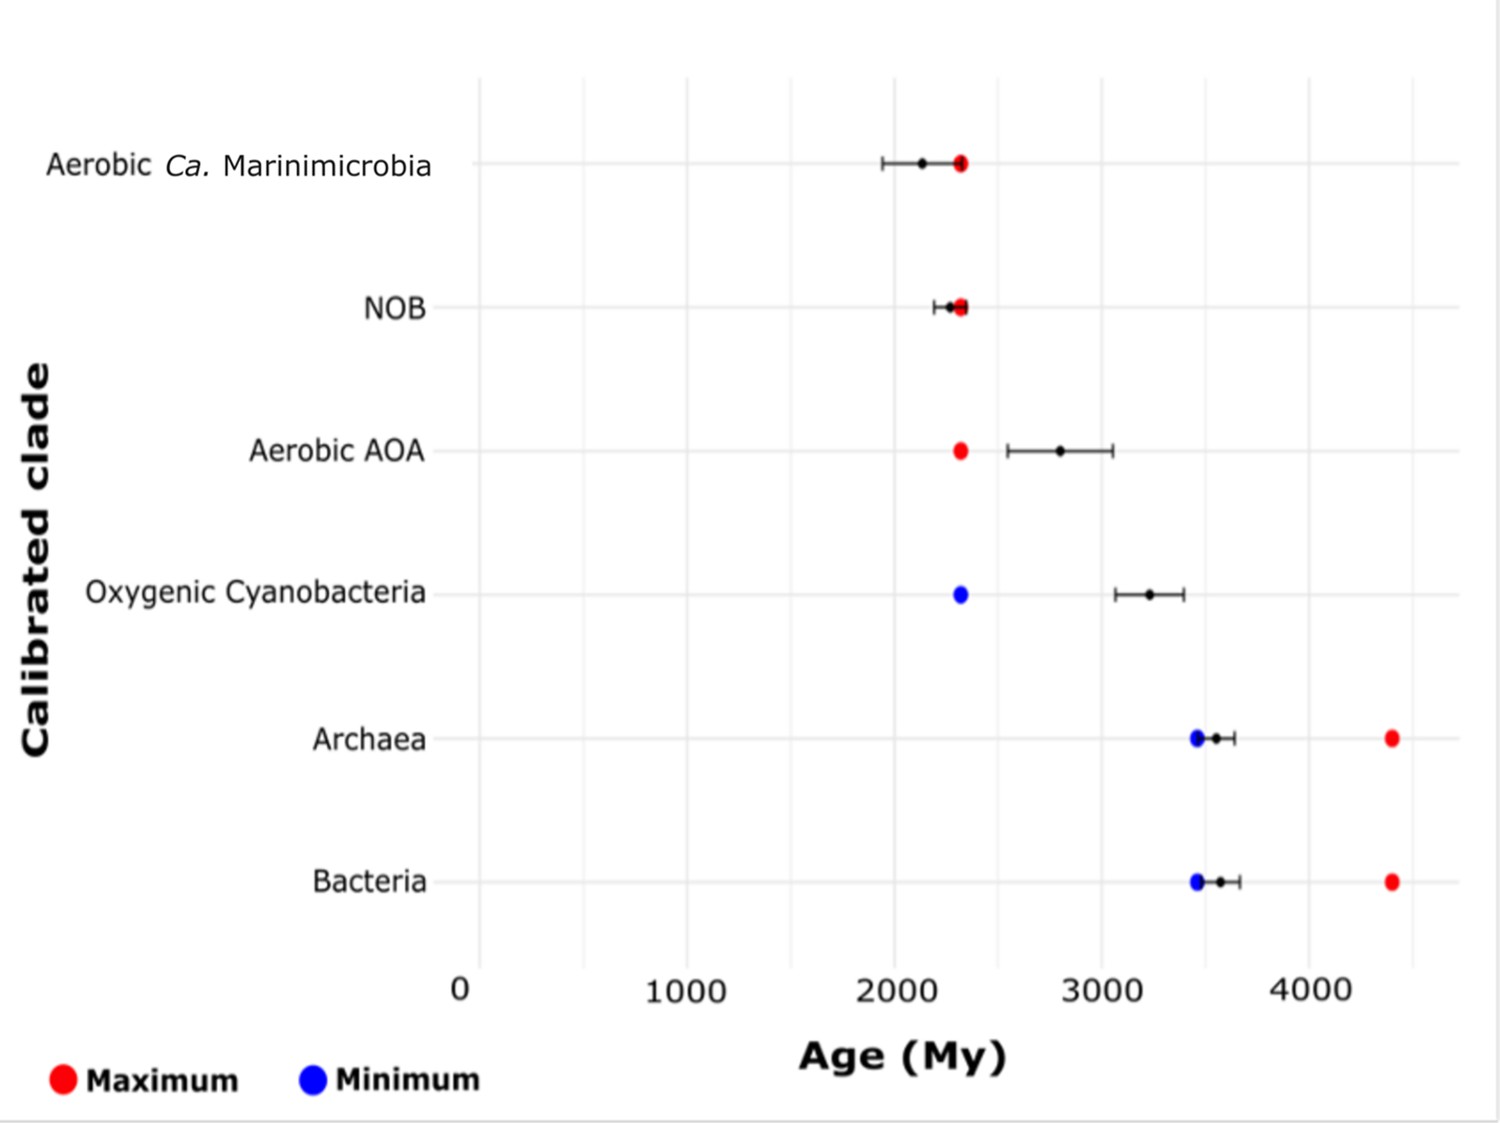
Estimated ages for calibrated nodes showing their suitability as priors for Bayesian molecular dating.
Values resulted from running an independent chain on the temporal calibrations without sequence data (-root option on Phylobayes). Error bars represent the standard error of the cycles tested.
Figure 2—figure supplement 3
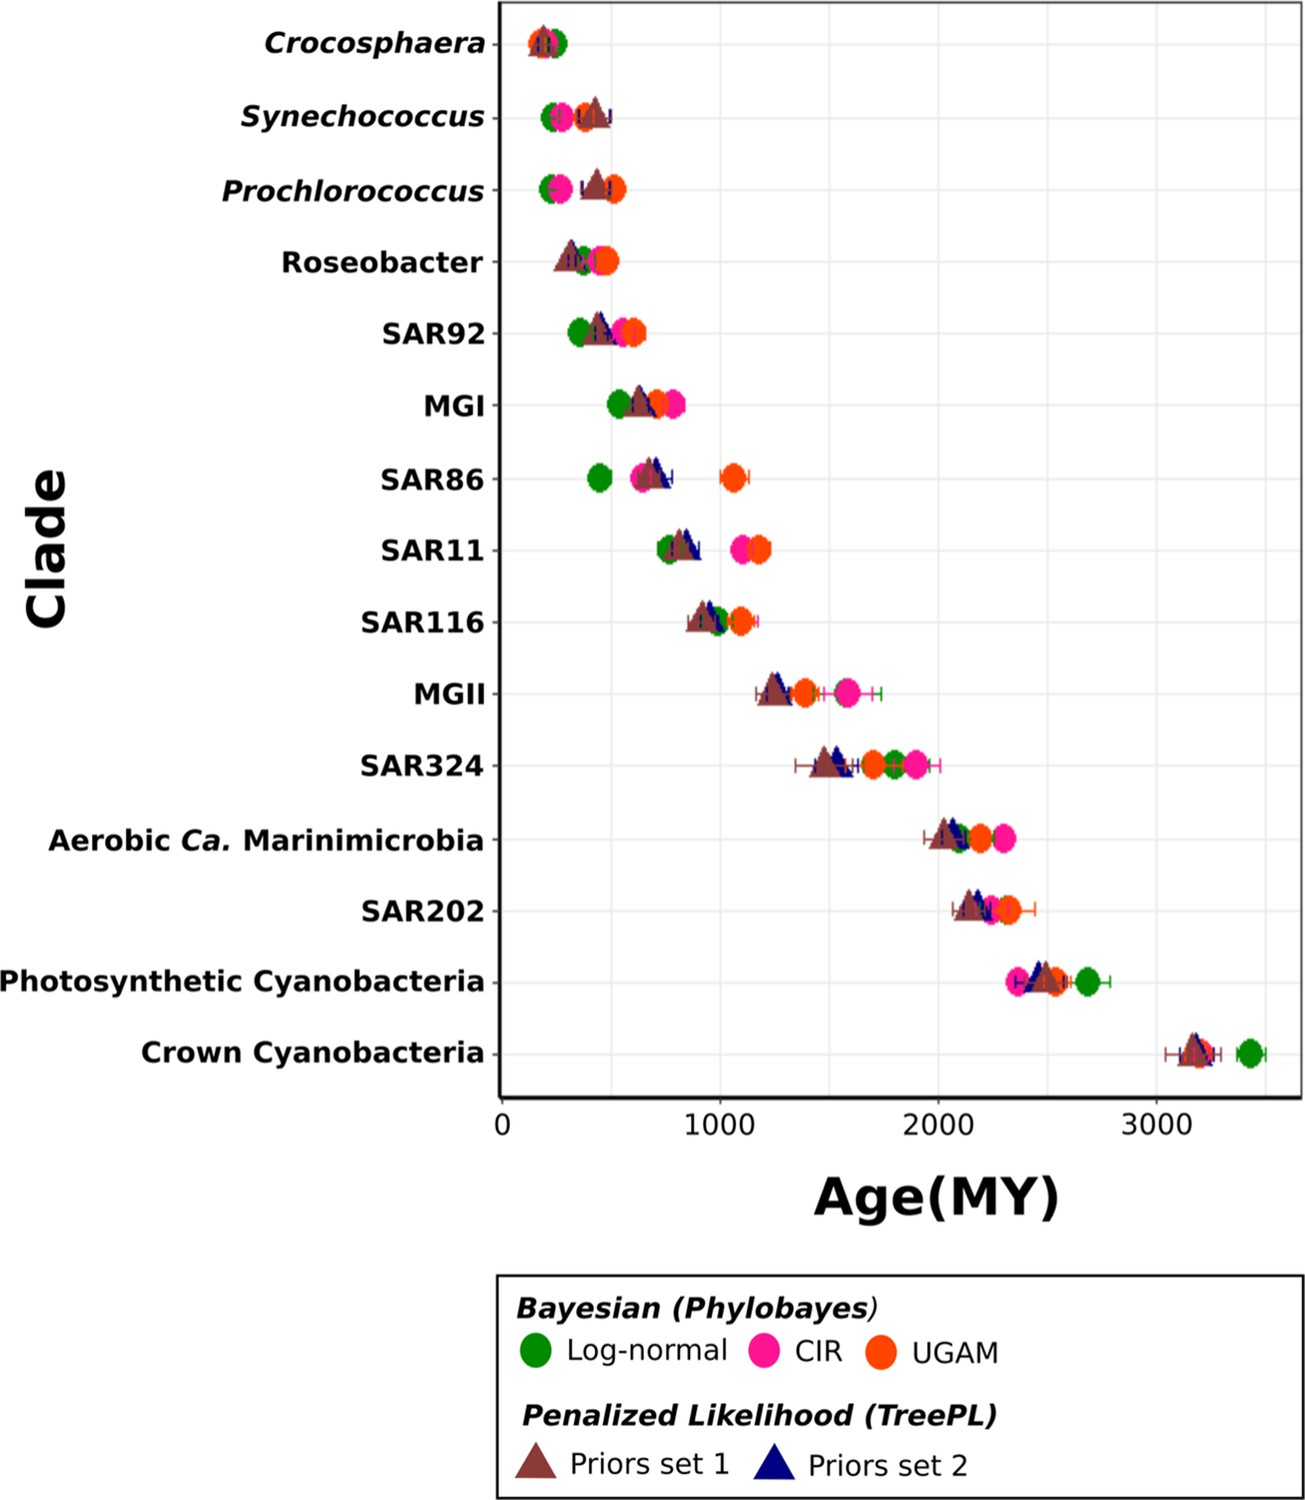
Assessment of the role of molecular dating Bayesian model and calibrations on the diversification timing of marine microbial clades.
Bayesian estimates represent the average of the last 1000 cycles sampled every 10 cycles of chain 1 (Supplementary file 5). TreePL analyses show 1000 age replicates using the priors shown in Table 1 (Priors set 1), and the independent root of Bacteria and Archaea and the minimum age of Cyanobacteria as priors (Priors set 2). Error bars represent the standard deviation of each distribution of age replicates.
Figure 3 with 1 supplement
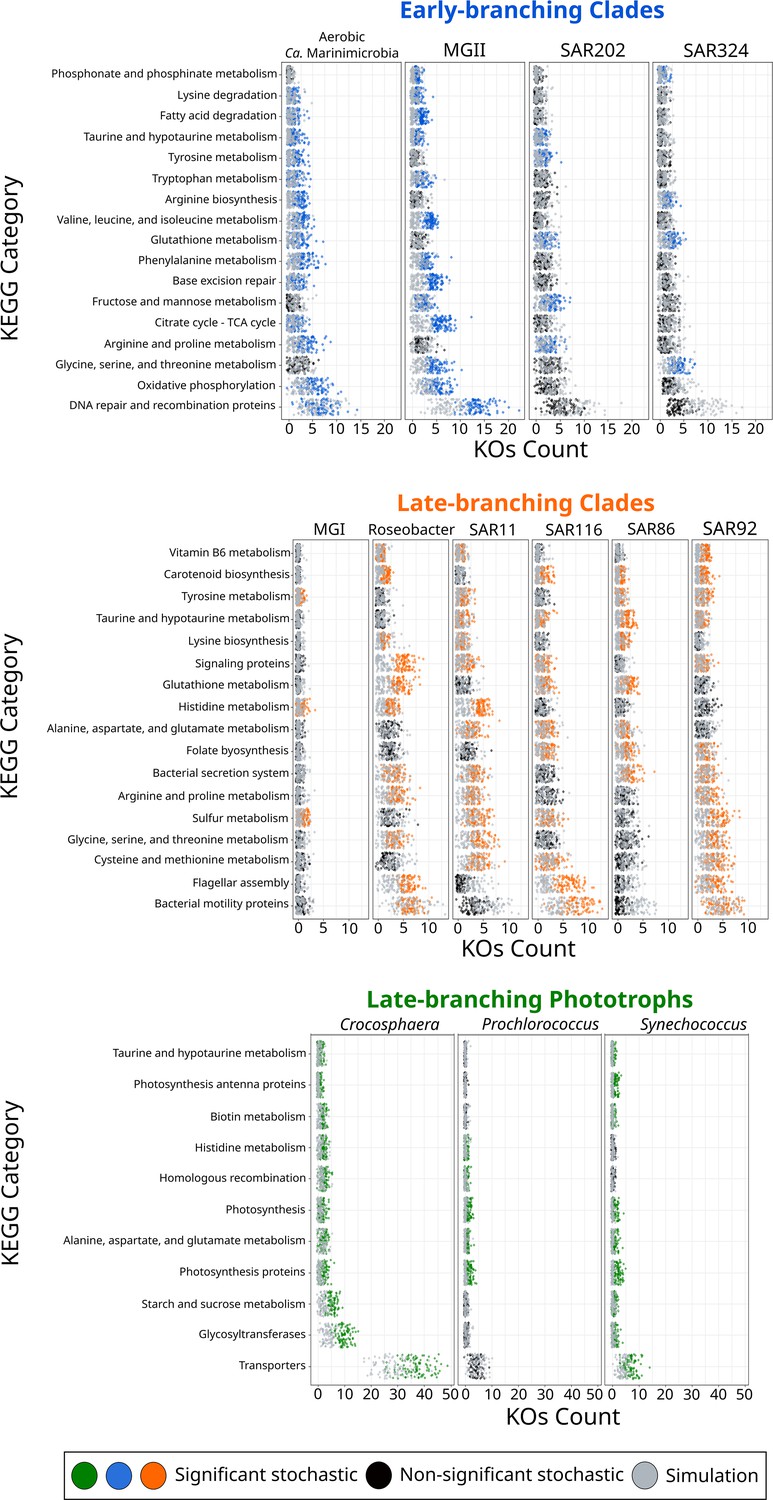
KEGG categories enriched at the crown node of each marine microbial clade.
Clades were classified based on their diversification timing shown in Figure 2. Enriched categories were identified by statistically comparing a stochastic mapping distribution with an all-rates-different model vs a null distribution with a constant rate model without conditioning on the presence/absence data at the tips of the phylogeny. Each dot represents one replicate (see ‘Materials and methods’). X-axis represents the number of KEGG Orthologous Groups (KOs) gained at each crown node for each KEGG category. Stochastic mapping and null distributions were sorted for visualization purposes. The complete list of enriched KEGGs is shown in Figure 3—figure supplement 1.
Figure 3—figure supplement 1
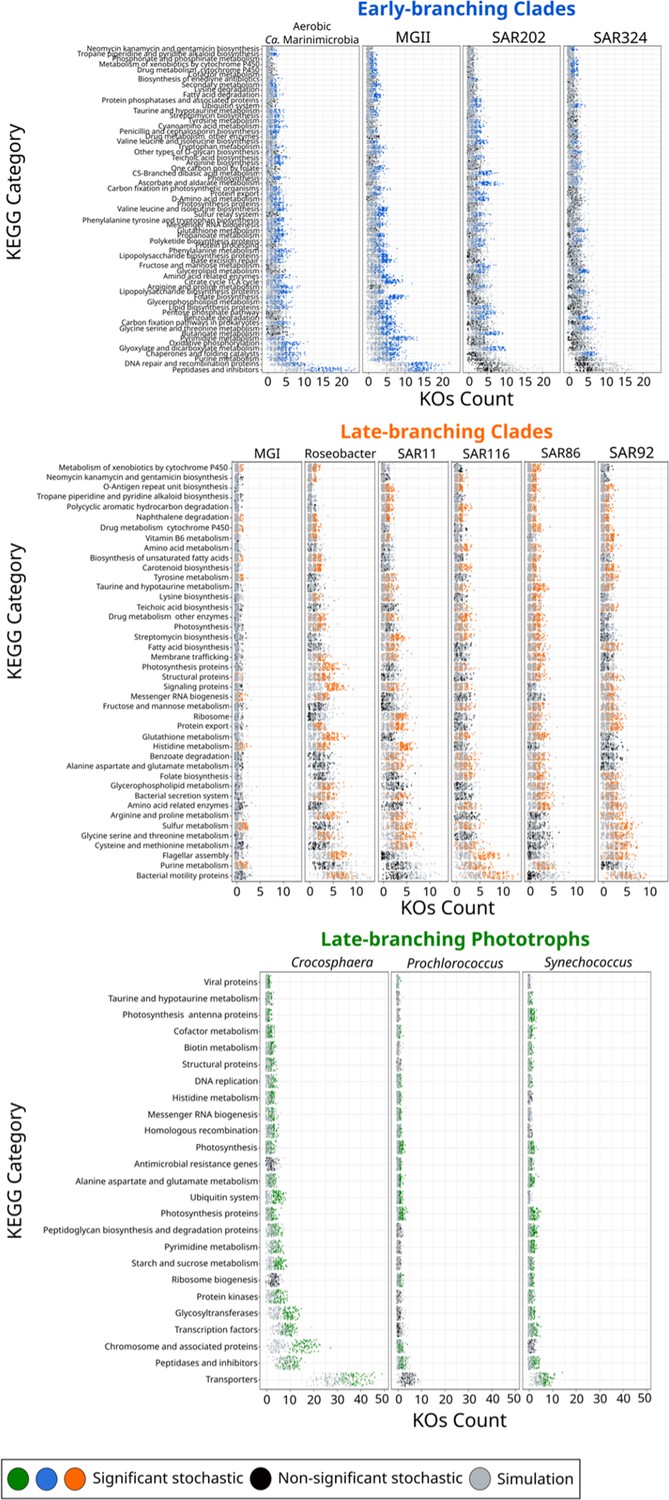
Enriched KEGG categories at the crown node of each marine microbial clade.
Clades were classified based on the diversification timing shown in Figure 2. Enriched categories were identified by statistically comparing a stochastic mapping distribution with an all-rates-different vs a null distribution with a constant rate model without conditioning on the presence/absence data at the tips. Each dot represents one replicate (see ‘Materials and methods’). X-axis represents the number of KOs gained at each crown node for each KEGG category. Stochastic mapping and null distributions were sorted for visualization purposes.
Figure 4
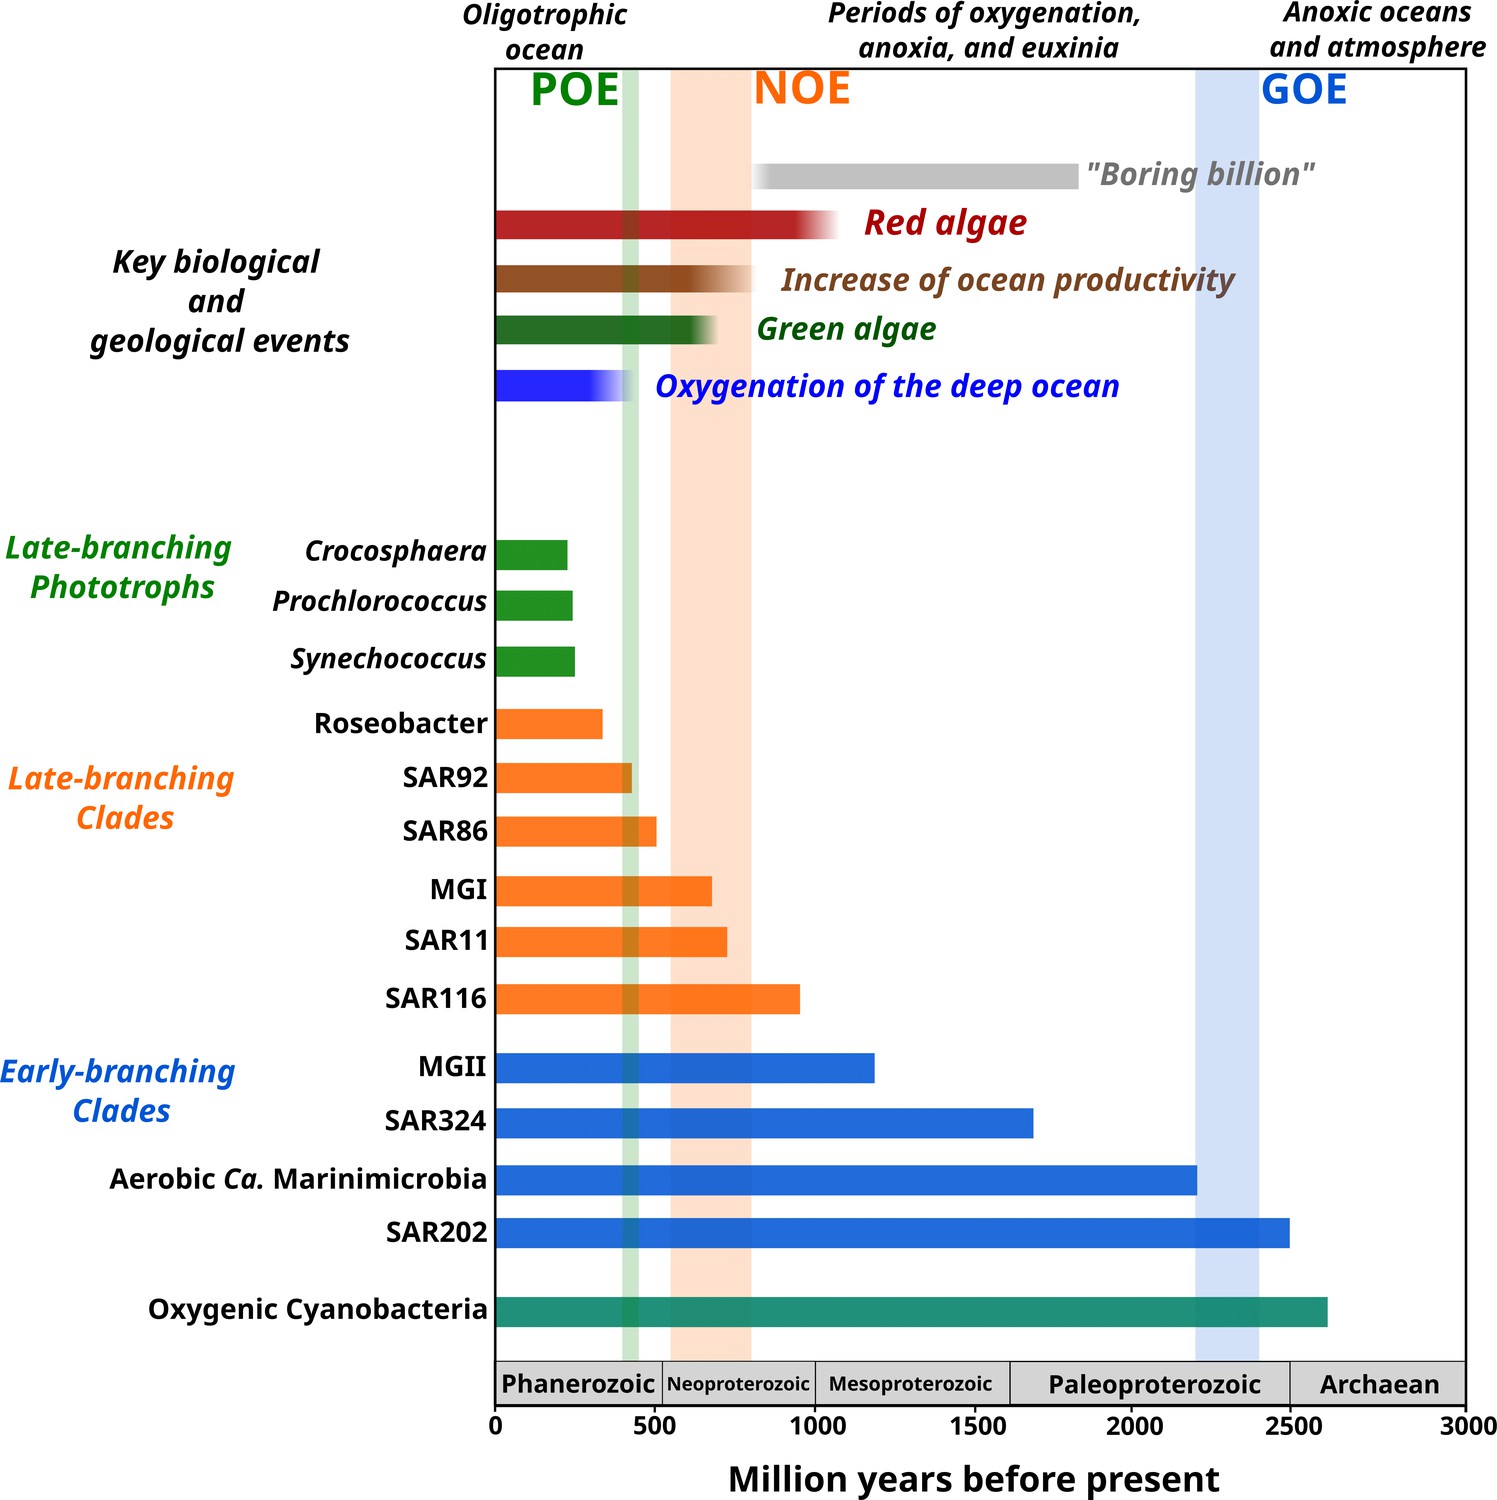
Link between the timing of the diversification of the main marine microbial clades and major geological and biological events.
The timing of the geological and biological events potentially involved in the diversification of marine clades is based on previously published data: ‘boring billion’ (Brasier and Lindsay, 1998; Hodgskiss et al., 2019), red algae fossils (Butterfield, 2000), increased of ocean productivity (Butterfield, 2000; Och and Shields-Zhou, 2012), green algae fossils (Butterfield et al., 2006), and oxygenation of the deep ocean (Lenton et al., 2016). The length of each bar represents the estimated age for marine clades according to Bayesian estimates. The timing of the main oxygenation events is based on previous work (Alcott et al., 2019).
Tables
Table 1
Temporal calibrations used as priors for the molecular dating of the main marine microbial clades.
See ‘Materials and methods’ for a detailed explanation of the calibrations used.
| Node | Calibration group | Minimum (My) | Maximum (My) | Evidence | Reference |
|---|---|---|---|---|---|
| 1,2 | Bacteria-Archaea Root | - | 4400 | Identification of the most ancient zircons showing evidence of liquid water. | Valley et al., 2014 |
| 1,2 | Bacteria-Archaea Root | 3460 | - | Identification of the most ancient traces of methane. Minimum age for life on Earth. Calibration consistent with the most ancient fossils found to date (~3.5 Ga; Walter et al., 1980). | Ueno et al., 2006 |
| 3 | Aerobic Nitrososphaerales | - | 2320 | Strict aerobic metabolism. | Ueno et al., 2006 |
| 4 | Oxygenic Cyanobacteria | 2320 | - | Oxygenation of the atmosphere. The Great Oxidation Event has been associated with oxygenic Cyanobacteria. | Bekker et al., 2004; Holland, 2006; Holland, 2002 |
| 5 | Aerobic Ca. Marinimicrobia | - | 2320 | Strict aerobic metabolism. | Bekker et al., 2004; Holland, 2006; Holland, 2002 |
| 6 | Nitrite-oxidizing bacteria | - | 2320 | Strict aerobic metabolism. | Bekker et al., 2004; Holland, 2006; Holland, 2002 |
Additional files
-
Supplementary file 1
Genomes dataset used for the molecular dating of the main marine microbial clades.
- https://cdn.elifesciences.org/articles/88268/elife-88268-supp1-v1.tsv
-
Supplementary file 2
Raw maximum likelihood phylogenetic tree used for molecular dating and stochastic mapping analyses.
- https://cdn.elifesciences.org/articles/88268/elife-88268-supp2-v1.pdf
-
Supplementary file 3
Assessment of parameters convergence of four independent chains used for Bayesian molecular dating analyses.
Relative difference < 0.3 is shown in bold letters and denotes parameters that reached convergence after 100,000 cycles using a burn-in of 250 and sampling every two cycles.
- https://cdn.elifesciences.org/articles/88268/elife-88268-supp3-v1.docx
-
Supplementary file 4
KOs gained at the crown node of each marine microbial clade.
A KO was considered as gained when found in 51 out of 100 stochastic mapping replicates.
- https://cdn.elifesciences.org/articles/88268/elife-88268-supp4-v1.tsv
-
Supplementary file 5
Age estimates of marine microbial clades resulting from different Bayesian molecular dating models (log-normal, CIR, and UGAM) and calibrations (TreePL priors set 1 and 2).
Bayesian estimates represent the average of the last 1000 cycles sampled every 10 cycles of each of the four chains. TreePL analyses show 1000 age replicates using the priors shown in Table 1 (Priors set 1), and the independent root of Bacteria and Archaea and the minimum age of Cyanobacteria as priors (Priors set 2).
- https://cdn.elifesciences.org/articles/88268/elife-88268-supp5-v1.tsv
-
MDAR checklist
- https://cdn.elifesciences.org/articles/88268/elife-88268-mdarchecklist1-v1.docx
Download links
A two-part list of links to download the article, or parts of the article, in various formats.
Downloads (link to download the article as PDF)
Open citations (links to open the citations from this article in various online reference manager services)
Cite this article (links to download the citations from this article in formats compatible with various reference manager tools)
A timeline of bacterial and archaeal diversification in the ocean
eLife 12:RP88268.
https://doi.org/10.7554/eLife.88268.3


