Deciphering neuronal deficit and protein profile changes in human brain organoids from patients with creatine transporter deficiency
- Université Paris-Saclay, CEA, INRAE, Département Médicaments et Technologies pour la Santé, France
- Department of Pharmacy Practice and Pharmacotherapeutics, College of Pharmacy, University of Sharjah, United Arab Emirates
- Sharjah Institute for Medical Research, University of Sharjah, United Arab Emirates
- CERES BRAIN Therapeutics, France
- Institute of Enzymology, Research Centre for Natural Sciences, ELKH, and Doctoral School of Molecular Medicine, Semmelweis University, Hungary
- Department of Pediatrics, University of Cincinnati College of Medicine and Division of Neurology, Cincinnati Children’s Research Foundation, United States
- SupBiotech/Service d'Etude des Prions et des Infections Atypiques (SEPIA), Institut François Jacob, CEA, Université Paris Saclay, France
- Université Paris-Saclay, CEA, INRAE, Département Médicaments et Technologies pour la Santé (DMTS), SPI, France
- Clinical Sciences Department, College of Medicine, University of Sharjah, United Arab Emirates
- Division of Surgery and Interventional Science, University College London, United Kingdom
- ASPIRE Precision Medicine Research Institute Abu Dhabi, University of Sharjah, United Arab Emirates
Figures
Figure 1 with 3 supplements
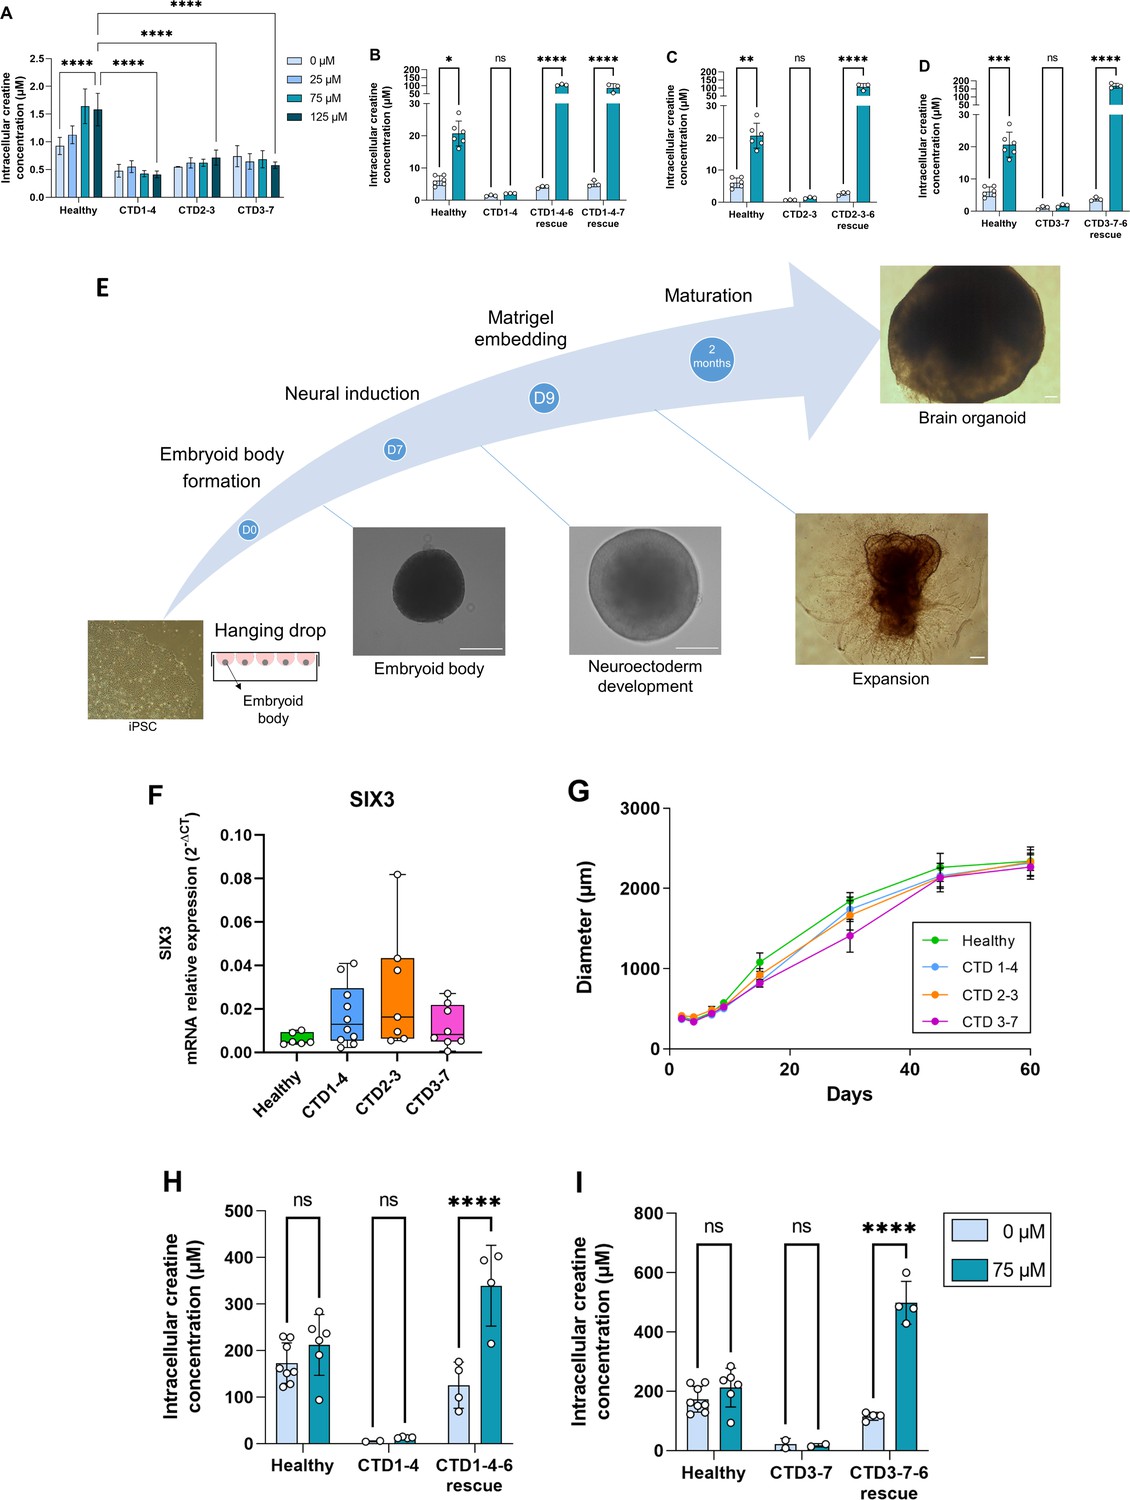
Generation and characterization of human creatine transporter deficiency (CTD) brain organoids.
(A) Intracellular concentration of creatine in CTD iPSCs after 1 hr incubation with creatine-supplemented media. Healthy control is BJ. n=3–4, one-way ANOVA, Tukey’s multiple comparison test. (B–D) Intracellular concentration of creatine in CTD-rescue iPSCs CTD1-4 (B), CTD2-3 (C), and CTD3-7 (D) after 1 hr of incubation with creatine-supplemented media. Healthy controls are BJ and SP. n=3, two-way ANOVA, Šídák’s multiple comparisons test. (E) Schematic protocol of brain organoid development from iPSCs. Representative images are shown for each stage. Scale bar: 200 µm. (F) Relative mRNA expression of the telencephalon marker SIX3. n=6–10 (G) Quantification of the diameters of healthy (BJ) and pathological brain organoids at different time points. n=2–22 brain organoids per production, 4–6 productions per cell line. (H–I) Intracellular concentration of creatine in brain organoids and CTD-rescue brain organoids CTD1-4 (H) and CTD3-7 (I) after 6 h of incubation in creatine-supplemented media. Healthy controls are BJ and SP. n=2–4, two-way ANOVA, Šídák’s multiple comparisons test.
Figure 1—figure supplement 1
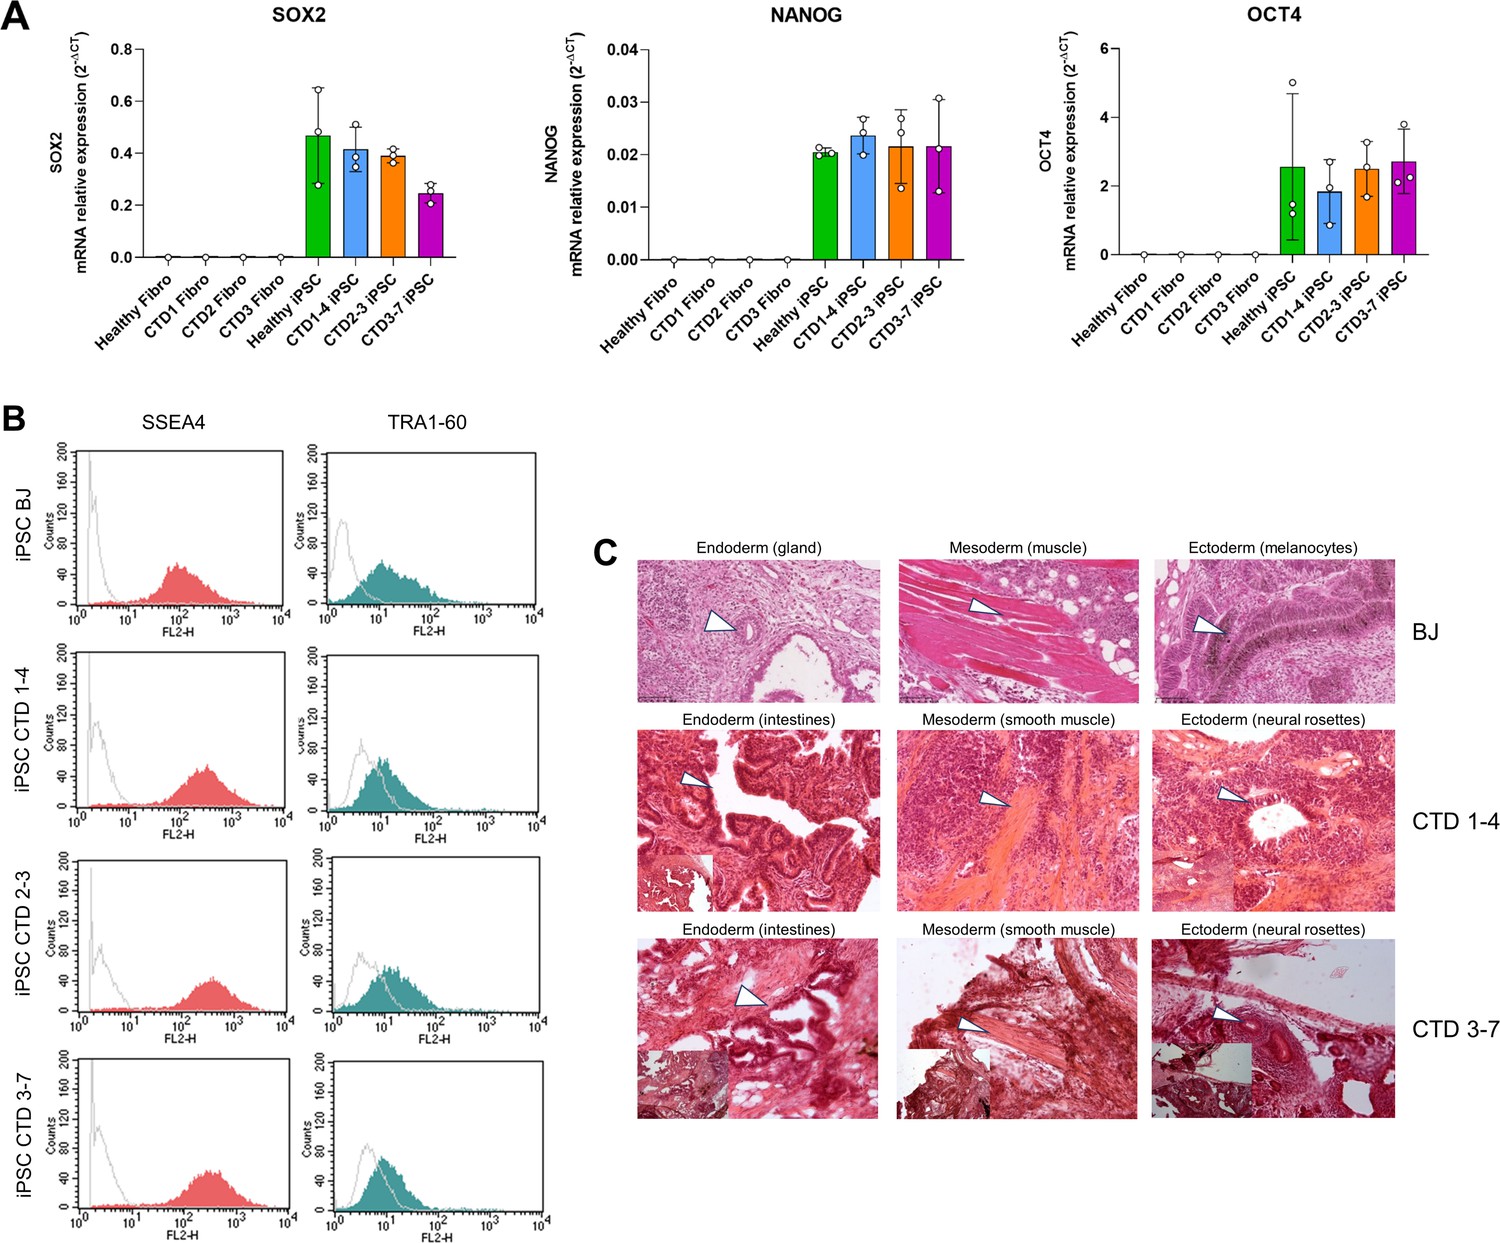
Generation of creatine transporter deficiency (CTD) iPSCs.
(A) Real-time PCR (RT-qPCR) of pluripotency markers SOX2, NANOG, and OCT4 in fibroblasts (PK and CTD1, 2, and 3) and iPSCs (BJ and CTD1-4, 2–3, and 3–7). n=1–3. (B) Representative analysis of SSEA4 and TRA1-60 expression for each iPSC line by flow cytometry. SSEA4 is compared with the appropriate mouse IgG3 control, and TRA1-60 is compared with unlabeled cells. Control: gray line; test: red and green line. (C) Generation of all three germ cell layer components within teratomas from each iPSC line (endoderm, mesoderm, ectoderm). Whole sections of teratoma were performed 5–10 weeks of growth and stained with hematoxylin and eosin. Scale bar = 50 µm.
Figure 1—figure supplement 2
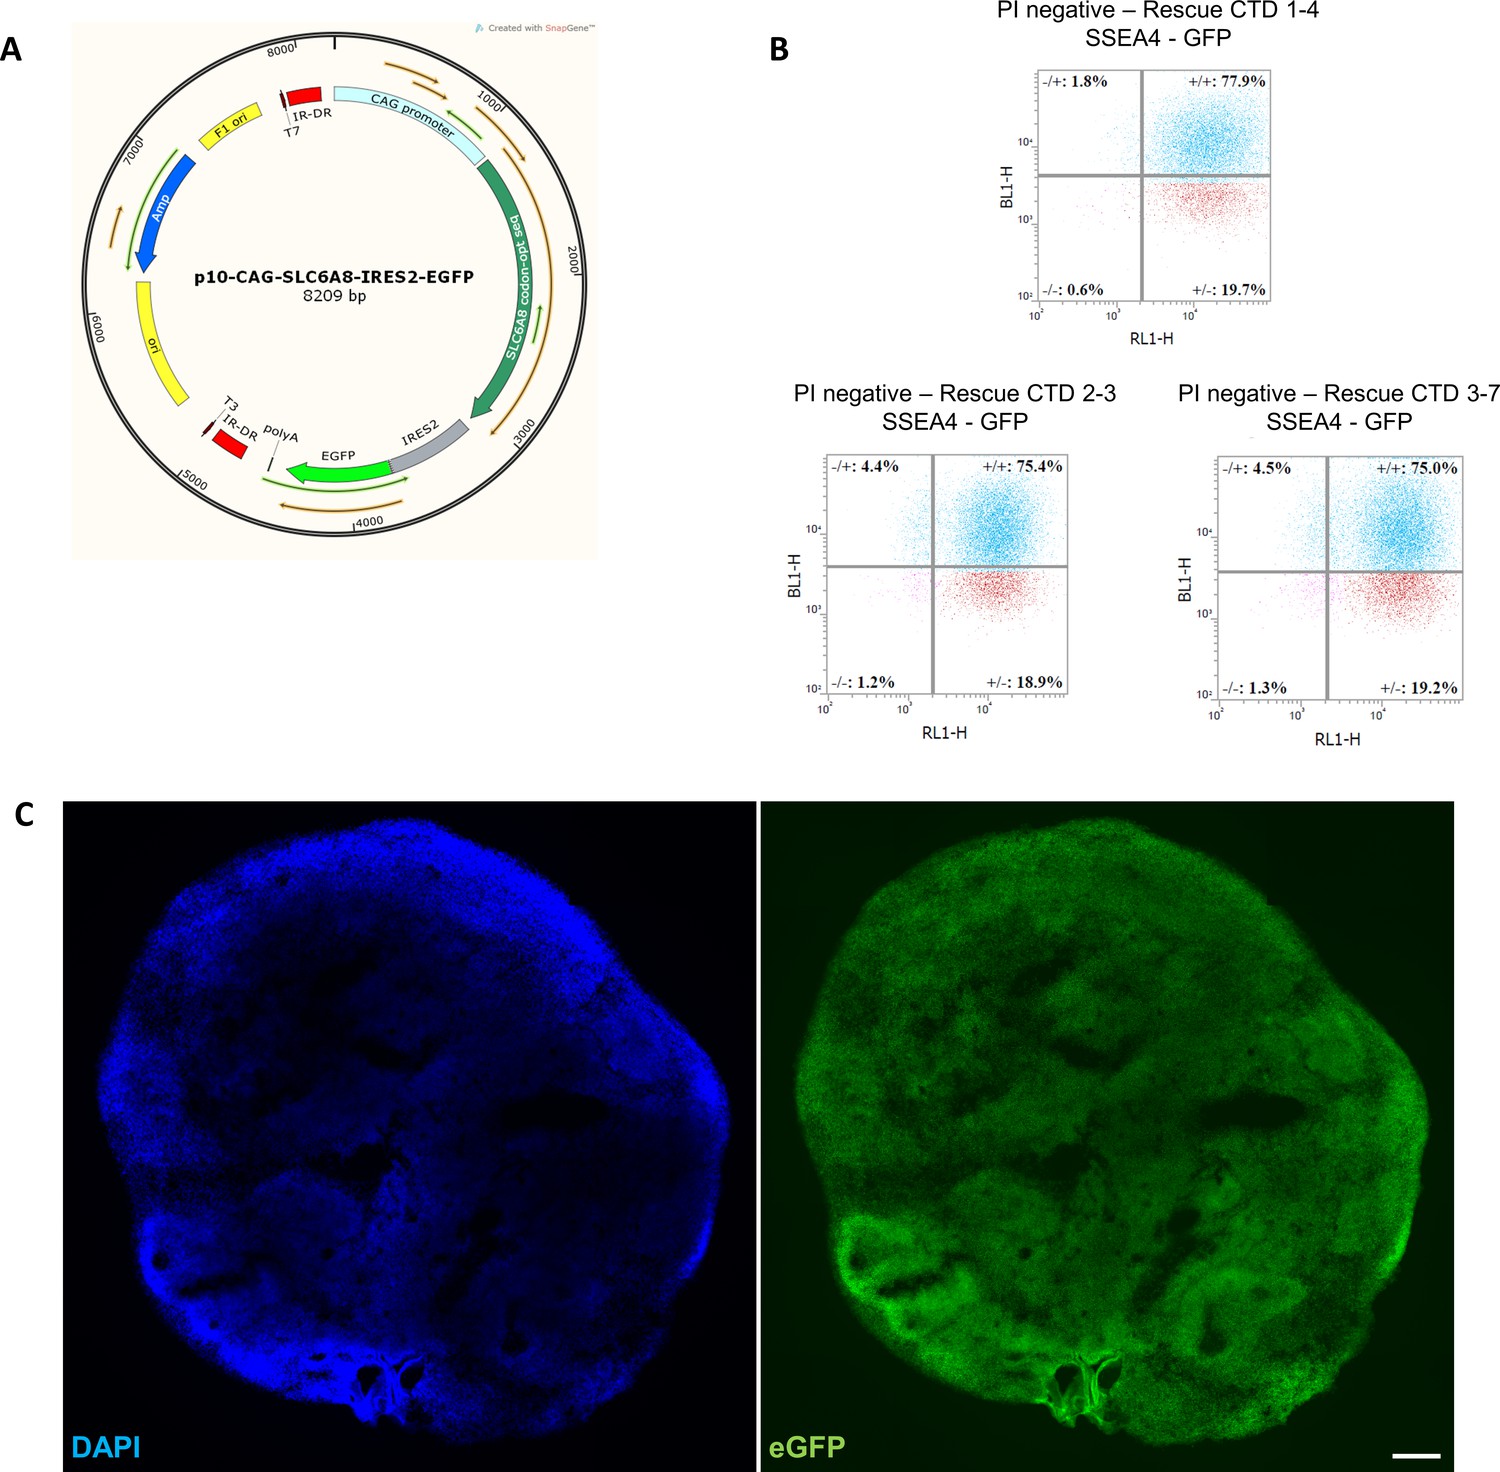
Generation of creatine transporter deficiency (CTD)-rescue iPSCs.
(A) The p10-CAG-SLC6A8-IRES2-eGFP vector used for transfection. (B) FACS analysis of transfected cells according to pluripotency marker SSEA4 (RL1-H) and green fluorescent protein (GFP) (BL1-H). (C) Representative image of a 2 month old brain organoid tissue section from CTD rescue cell line showing endogenous eGFP fluorescence. DAPI marks nuclei in blue. Scale bar: 200 µm.
Figure 1—figure supplement 3

Assessment of brain organoids variability.
Diameter of healthy BJ brain organoids obtained from three different productions.
Figure 2 with 1 supplement
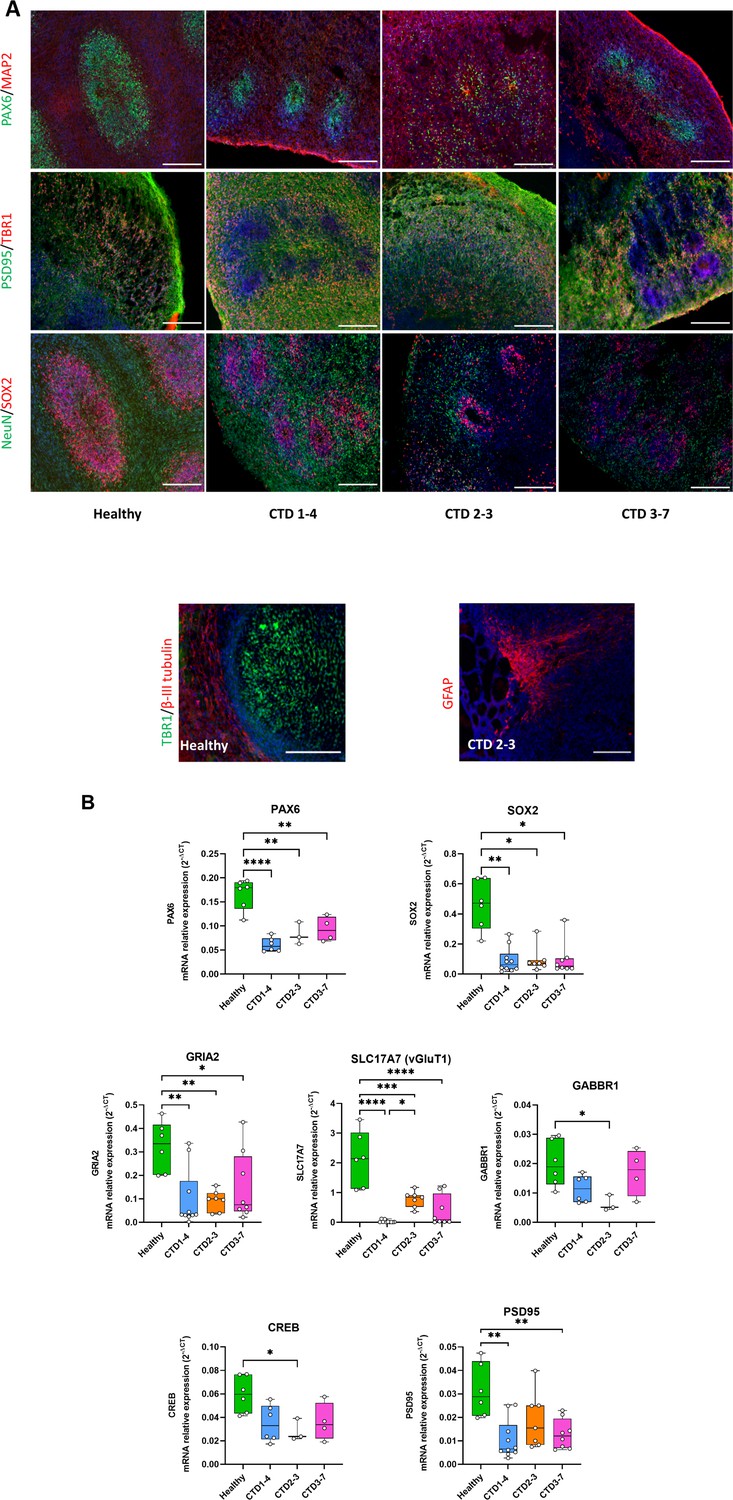
Creatine transporter deficiency (CTD) brain organoid organization and neurogenesis deficit.
(A) Representative images of 2 month old brain organoid tissue sections immunostained for PAX6 (radial glial cell and forebrain marker), MAP2 (neuronal marker), PSD95 (post-synaptic marker), TBR1 (immature neuron marker), NeuN (neuronal marker), SOX2 (radial glial cell marker), β-III tubulin (intermediate progenitor marker), GFAP (astrocyte marker). DAPI marks nuclei in blue. Scale bar: 200 µm (B) Relative mRNA expression of PAX6 and SOX2 (radial glial cell markers), GRIA2 and vGluT1 (glutamatergic markers), GABBR1 (GABAergic marker), PSD95 (post-synaptic marker) and CREB. n=3–6, one-way ANOVA, Tukey’s multiple comparison test.
Figure 2—figure supplement 1

Neurogenesis deficit in a creatine transporter deficiency (CTD) mouse model.
Relative mRNA expression of SOX2 (radial glial cell markers) in whole brains of postnatal day 0 Slc6a8-/y mice. n=8 Slc6a8+/y, 7 Slc6a8-/y mice. Data was analyzed using a two-tailed t-test on 2-(ΔΔCt) values with mean ΔCt of Slc6a8+/y mice used as the control value. t(13)=4.527, p=0.0006.
Figure 3 with 1 supplement
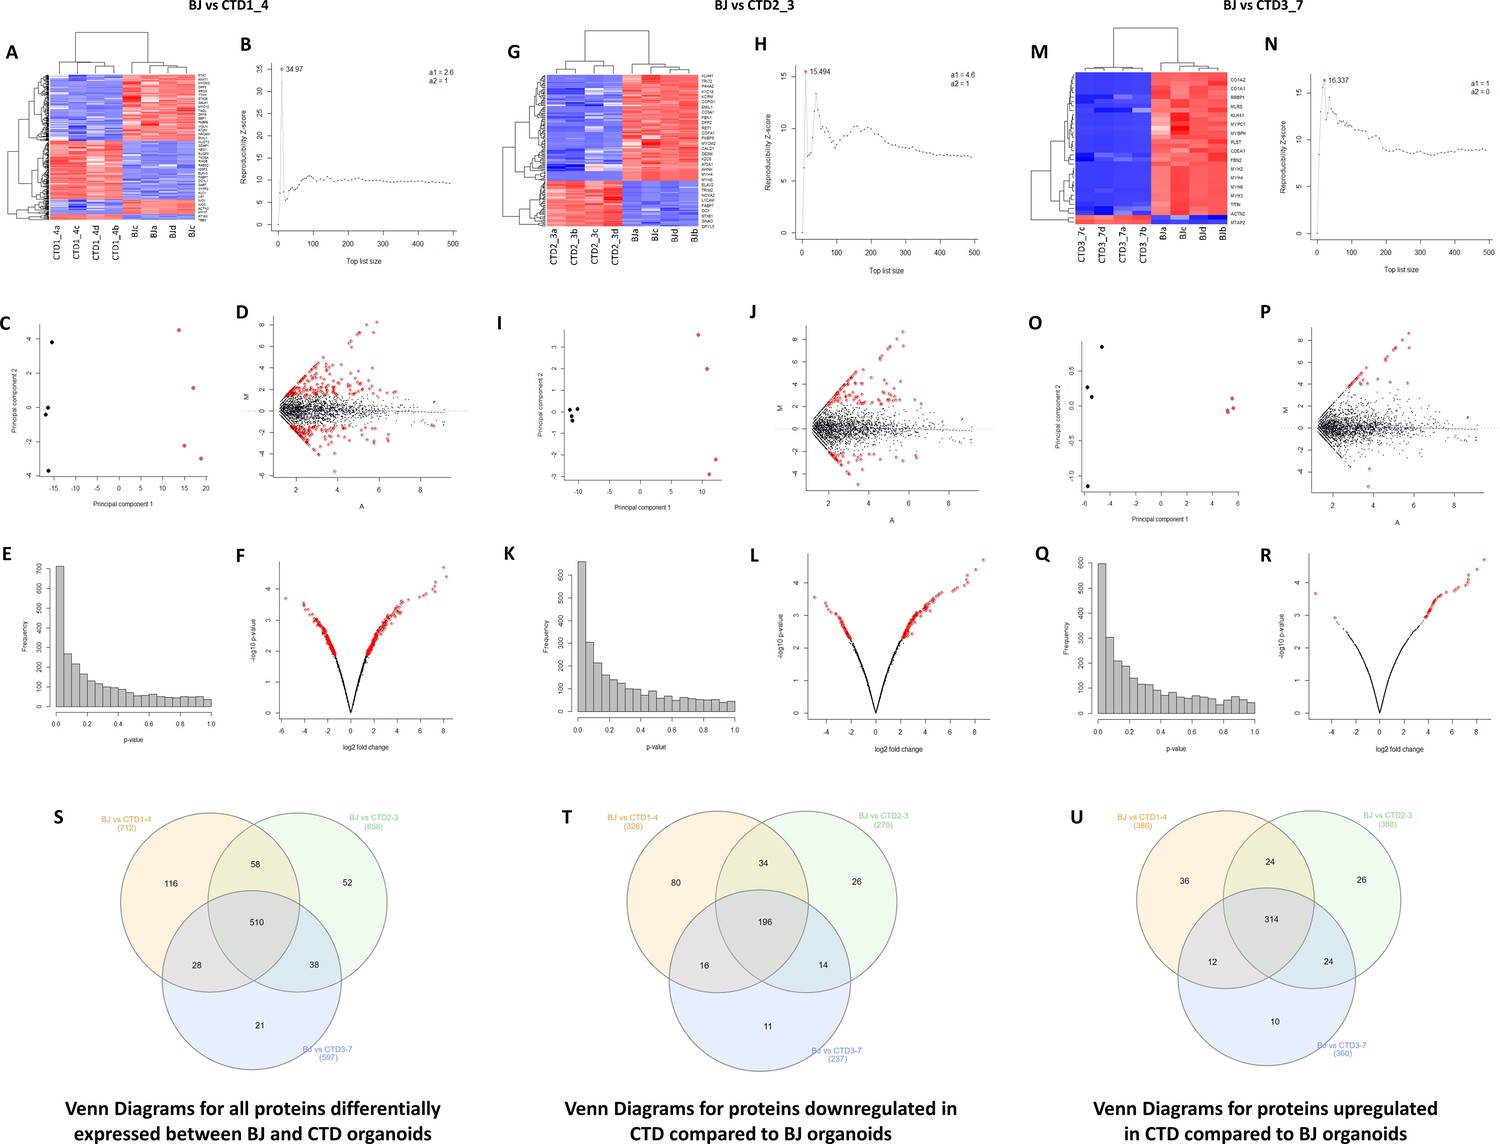
Unsupervised hierarchical clustering, reproducibility plots, principal component analysis (PCA), volcano plots, and Venn diagram showing overlap of the proteins.
(A–R) The degree and quality of the separation of the data between the various groups being compared Healthy (BJ) vs creatine transporter deficiency (CTD)-derived brain organoids (CTD1_4); Healthy (BJ) vs CTD-derived brain organoids (CTD2_3); Healthy (BJ) vs CTD-derived brain organoids (CTD3_7) was assessed using unsupervised hierarchical clustering, reproducibility plots and PCA, and the differentially expressed proteins were visualized using volcano plots. (S–U) Venn diagram showing overlap of the differentially expressed proteins between healthy and CTD-derived brain organoids identified using a modification of the R package for ROTS. (S) Venn diagrams for all proteins differentially expressed between BJ and CTD organoids. (T) Venn diagrams for proteins downregulated in CTD compared to BJ organoids. (U) Venn diagrams for proteins upregulated in CTD compared to BJ organoids.
Figure 3—figure supplement 1
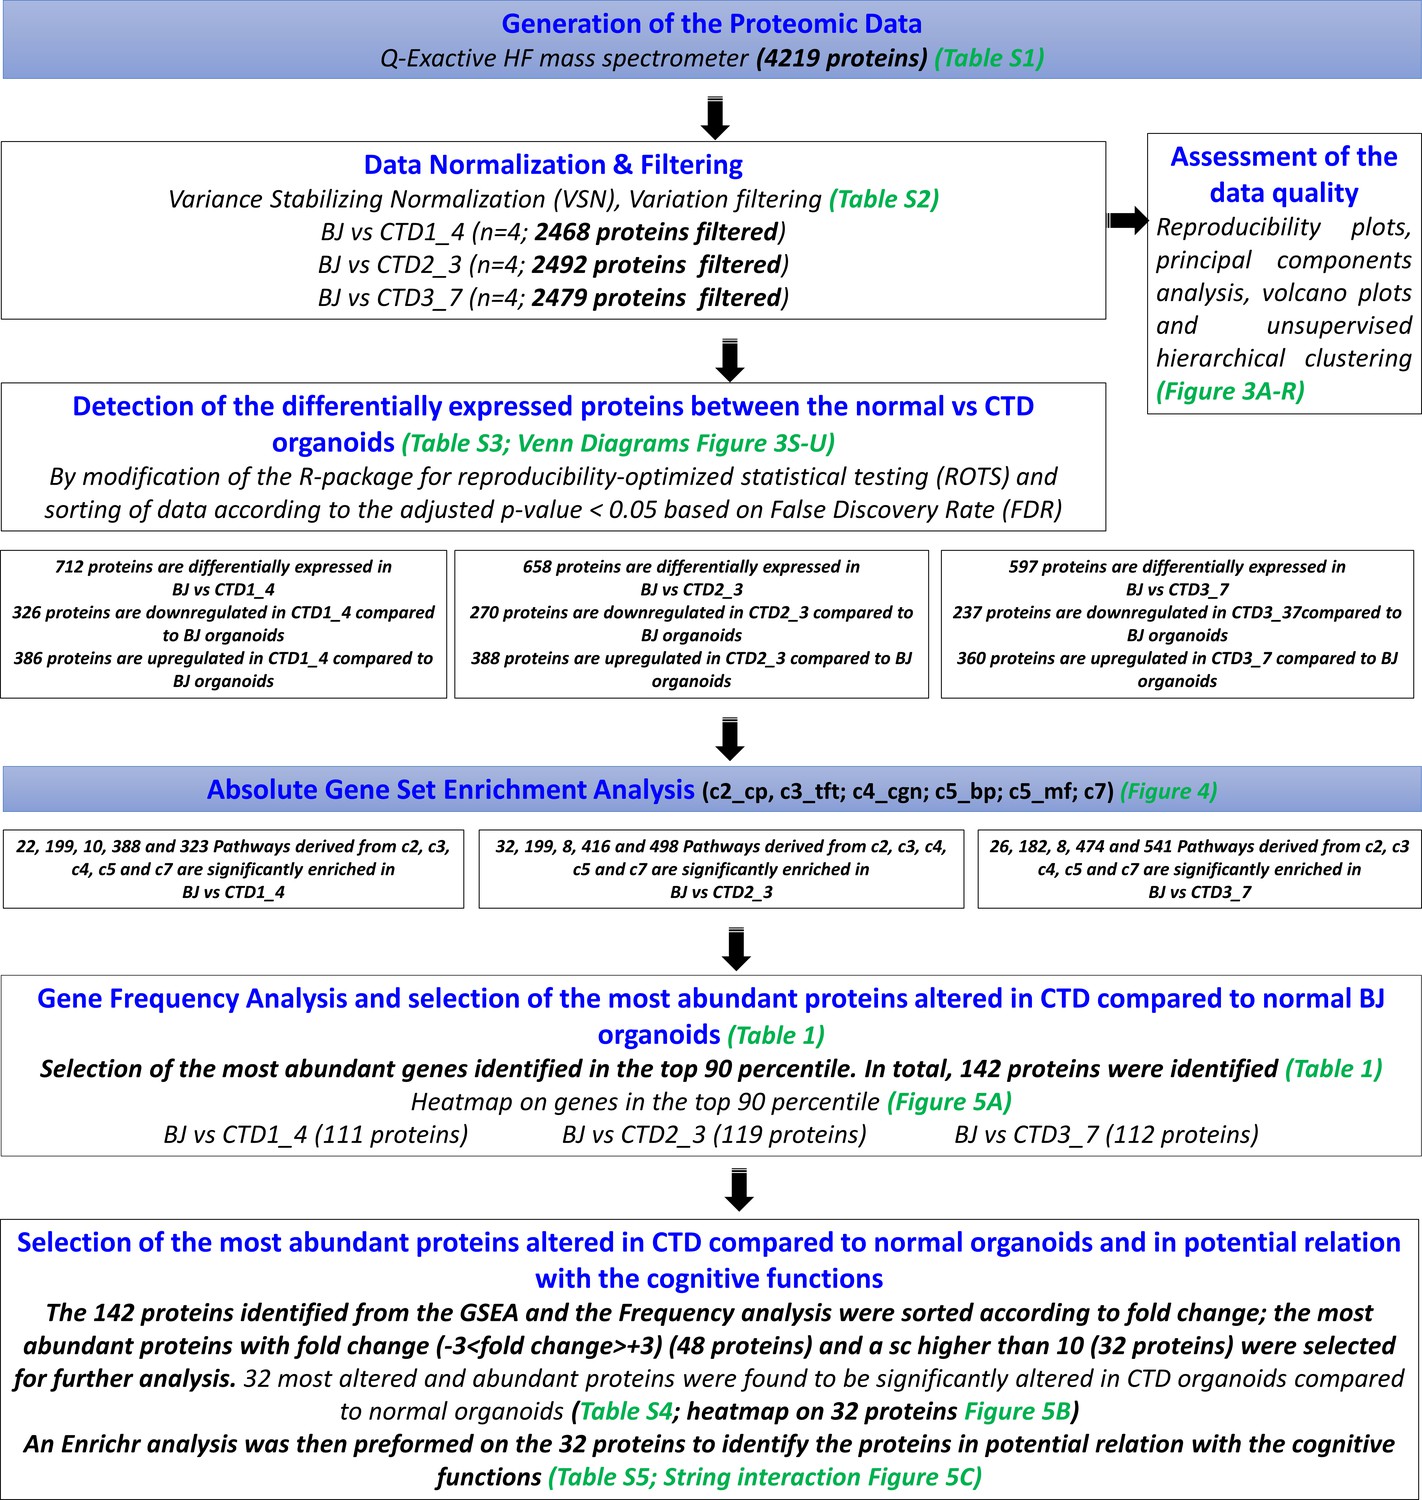
Flowchart diagram depicting the entire bioinformatics analysis workflow.
The raw data generated by MS/MS was normalized and filtered. The proteins significantly altered in the three creatine transporter deficiency (CTD)-derived cerebral organoids in comparison with healthy cerebral organoids were identified using a modification of the R package for ROTS. Absolute gene set enrichment analysis (GSEA) was performed in order to identify the enriched pathways in CTD-derived brain organoids in comparison with healthy cerebral organoids and the list of enriched genes was identified. Their recurrence or frequency in other pathways among all studied gene sets was searched. The frequency analysis identified 142 differentially expressed proteins occurring frequently across all enriched pathways. The 142 proteins identified were then subjected to a disease-related pathway analysis carried out using Enrichr followed by a frequency analysis in order to identify potential functions of the differentially expressed proteins. To further reduce the set of available proteins, the 142 proteins identified from the GSEA and the Frequency analysis were then sorted according to fold change; the most abundant proteins with fold change (–3<fold change >+3) and a sc higher than 10 were retained. 32 most altered and abundant proteins were found to be significantly altered in CTD-derived cerebral organoids compared to normal organoids.
Figure 4
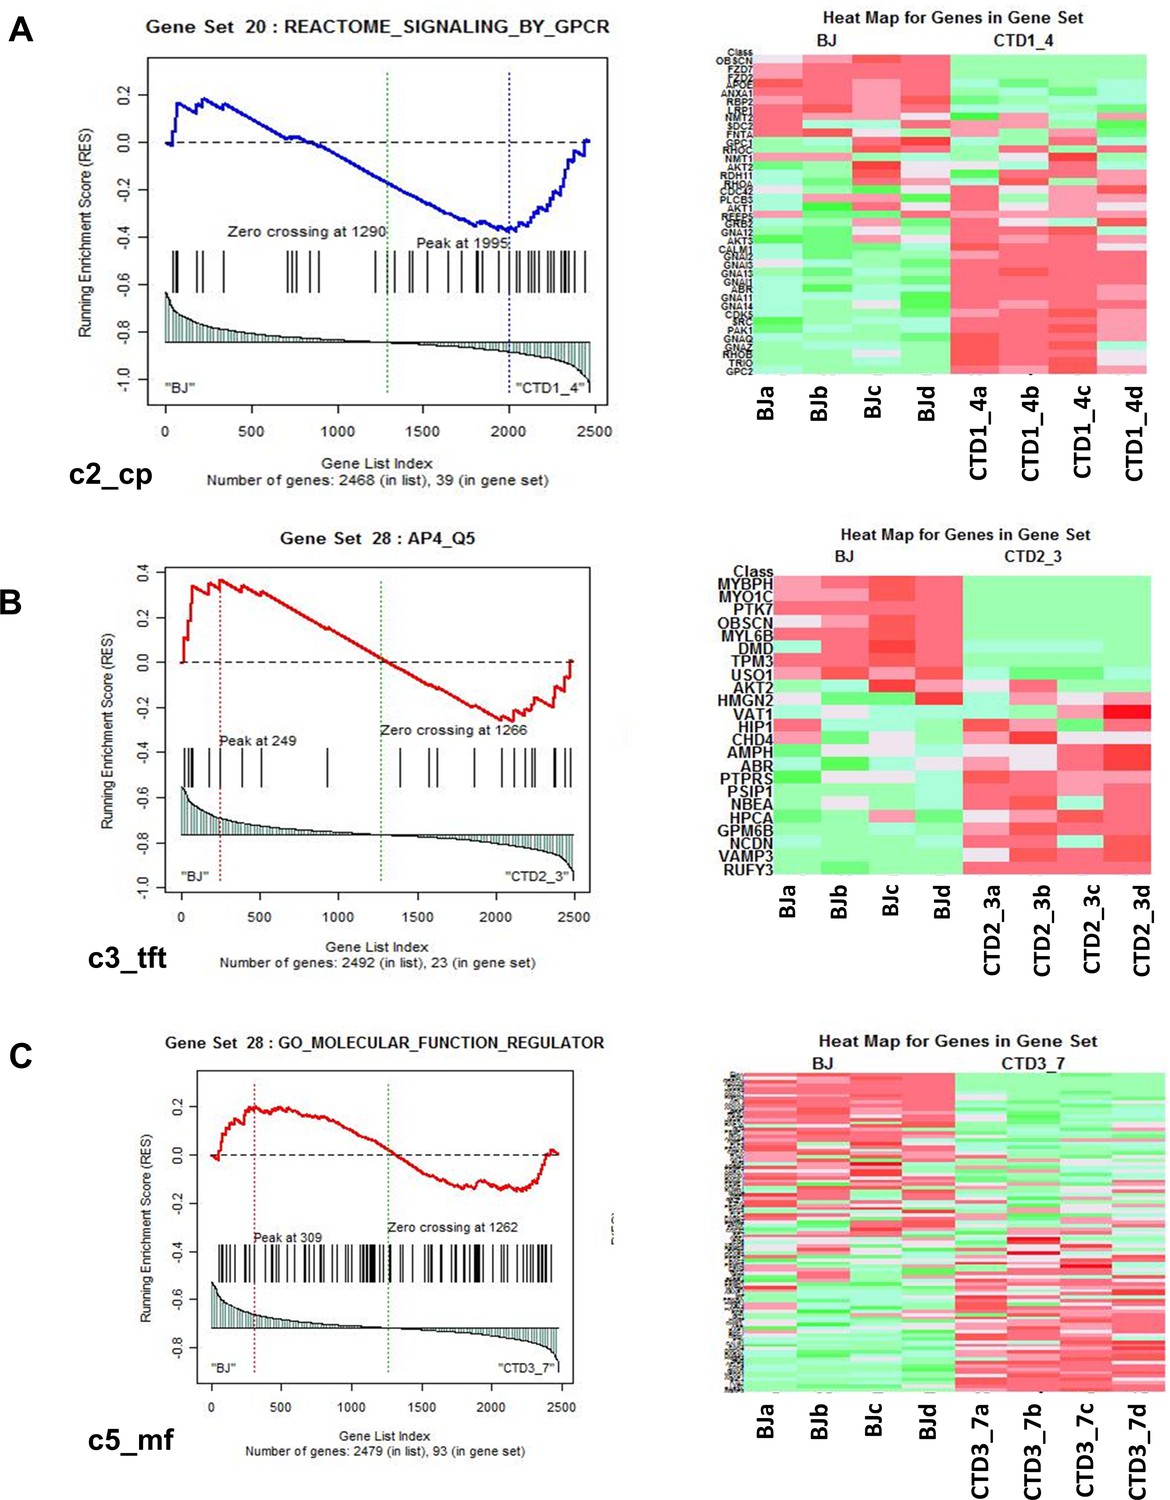
Representation of heatmaps and graphs obtained by the absolute gene set enrichment analysis (GSEA) for significant pathways with enrichment scores.
(A–C) Enrichment score and graphical representation for the GSEA for healthy vs creatine transporter deficiency (CTD)-derived brain organoids obtained across the gene sets c2_cp; c3_tft; c4_cgn; c5_bp; c5_mf; c7.
Figure 5
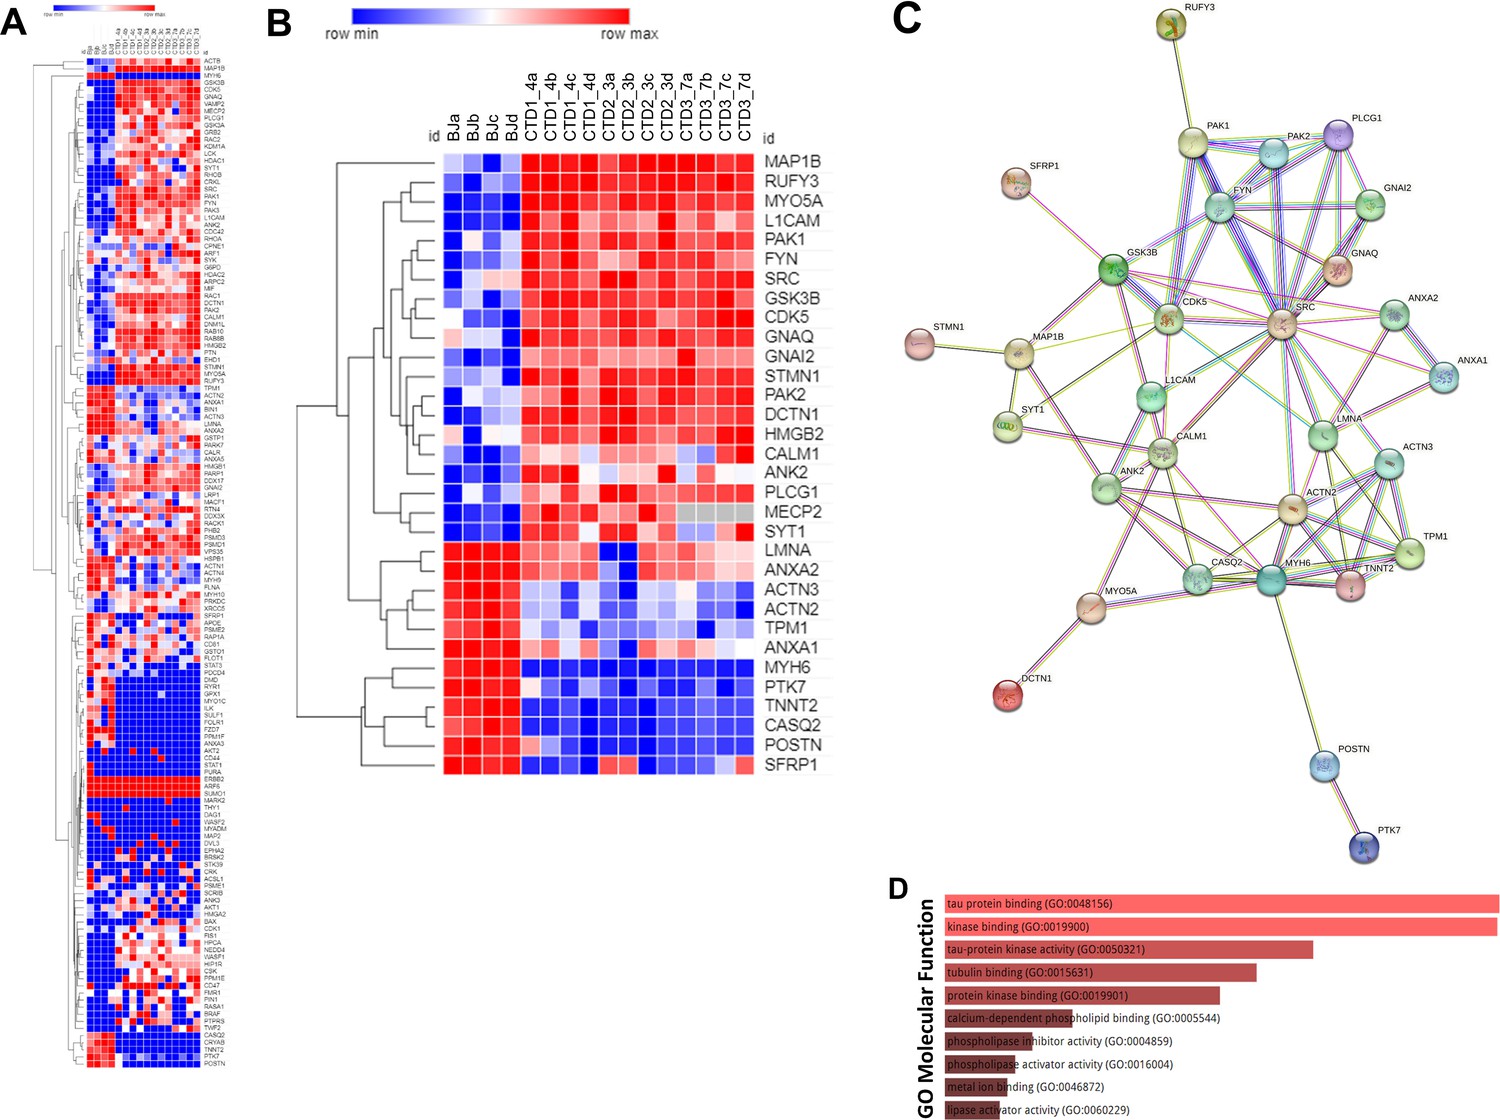
Heatmap, STRING interaction, and GO molecular functional analysis.
(A) Heatmap showing expression levels of the 142 proteins in the top 90 percentile. (B) Heatmap showing expression levels of 32 most altered and abundant proteins were found to be significantly altered in CTD-derived cerebral organoids compared to normal organoids. (C) STRING interaction of the 30 proteins selected. (D) GO Molecular Functional analysis obtained using Enrichr on the 32 proteins.
Figure 6
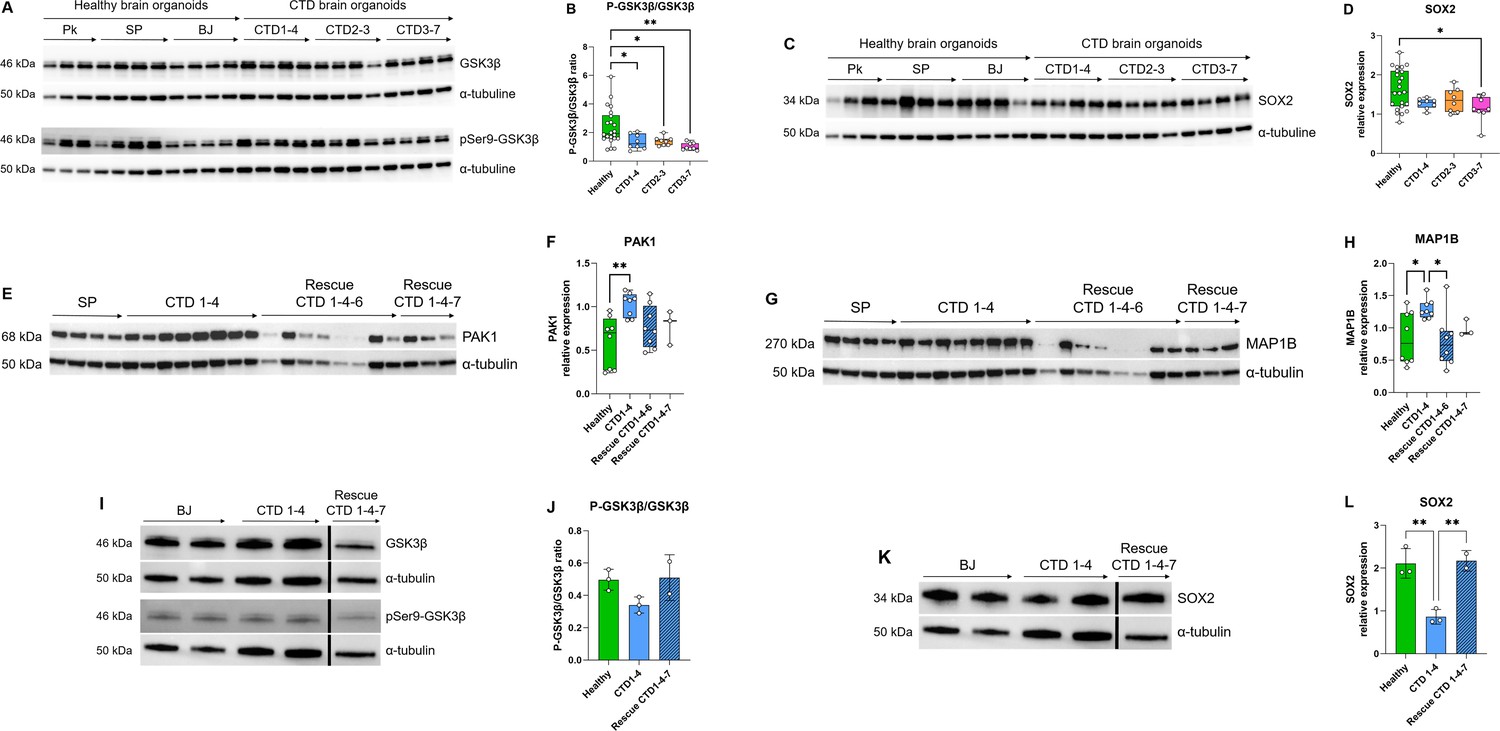
Relationship between GSK3β and neurogenesis deficit.
(A–B) Representative western blot of GSK3β and pSer9-GSK3β in creatine transporter deficiency (CTD) vs healthy brain organoids (A) and graph showing analysis of P-GSK3β/GSK3β ratio (B). n=8, one-way ANOVA, Dunnett’s multiple comparison test. (C–D) Representative western blot of SOX2 in CTD vs healthy brain organoids (C) and graph showing analysis of SOX2 relative expression (D). n=8, one-way ANOVA, Tukey’s multiple comparison test. (E–L) Representative western blot of PAK1 (E), MAP1B (G), GSK3β and pSer9-GSK3β (I), and SOX2 (K) in brain organoids obtained from CTD iPSCs and CTD-rescue iPSCs (CTD 1–4), and graphs showing analysis of PAK1 (F), MAP1B (H), P-GSK3β/GSK3β ratio (J), SOX2 (L) relative expression. n=2–8, one-way ANOVA, Dunnett’s multiple comparison test. (I and J) the lanes were run on the same gel but were noncontiguous.
-
Figure 6—source data 1
Original files of the full raw unedited blots (colorimetric and chemiluminescence images) for Figure 6A–B.
- https://cdn.elifesciences.org/articles/88459/elife-88459-fig6-data1-v1.zip
-
Figure 6—source data 2
Original files of the full raw unedited blots (colorimetric and chemiluminescence images) for Figure 6C–D.
- https://cdn.elifesciences.org/articles/88459/elife-88459-fig6-data2-v1.zip
-
Figure 6—source data 3
Original files of the full raw unedited blots (colorimetric and chemiluminescence images) for Figure 6E–H.
- https://cdn.elifesciences.org/articles/88459/elife-88459-fig6-data3-v1.zip
-
Figure 6—source data 4
Original files of the full raw unedited blots (colorimetric and chemiluminescence images) for Figure 6I–L.
- https://cdn.elifesciences.org/articles/88459/elife-88459-fig6-data4-v1.zip
-
Figure 6—source data 5
Figures with the uncropped blots with the relevant bands labeled for Figure 6.
- https://cdn.elifesciences.org/articles/88459/elife-88459-fig6-data5-v1.zip
Figure 7
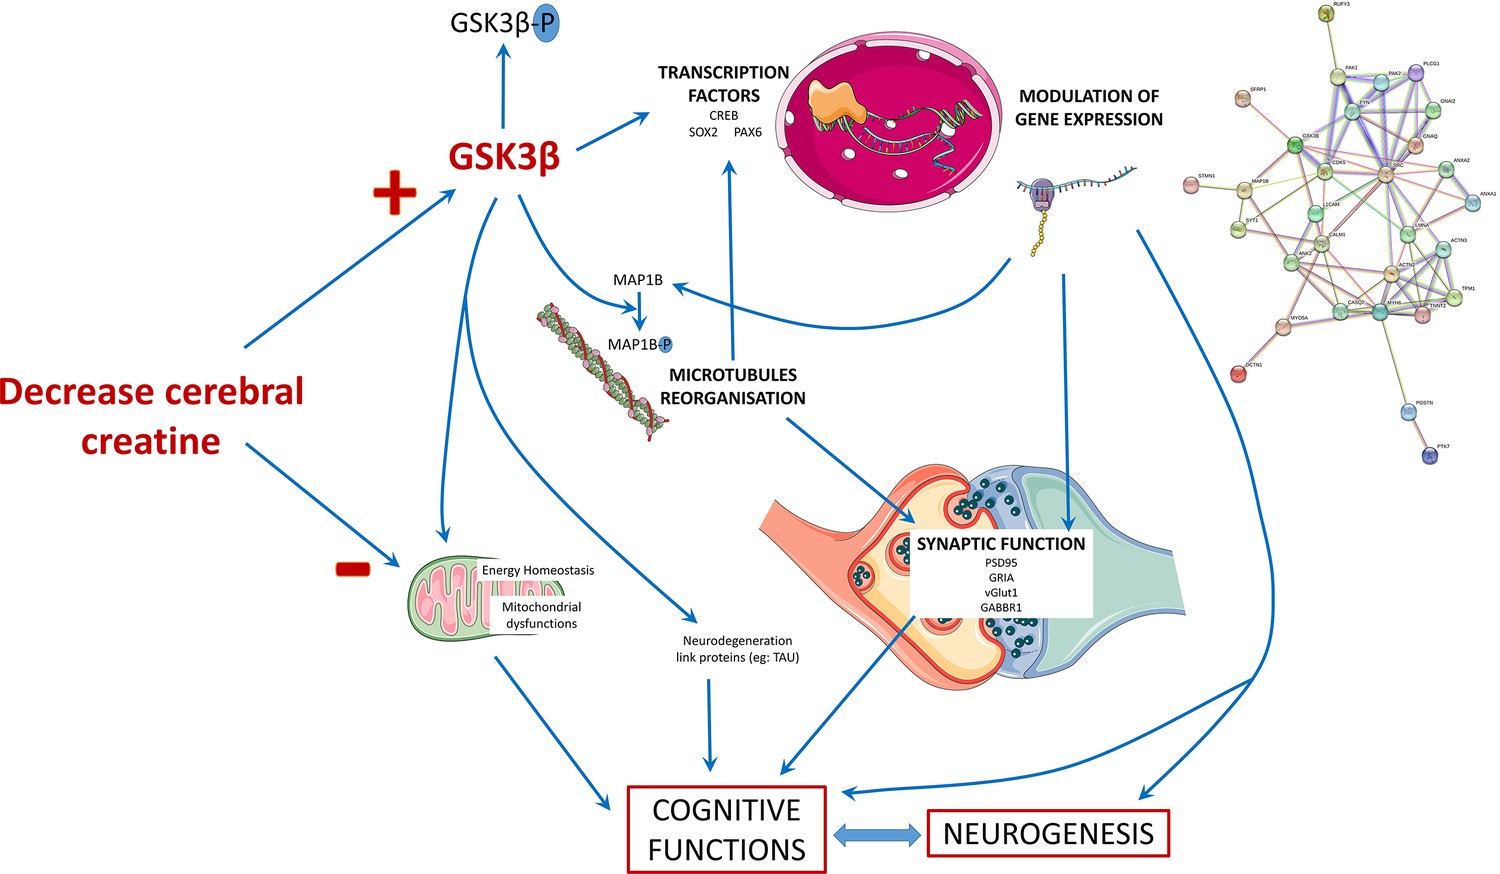
Schematic presentation of the main findings of the study.
The decrease in the cerebral creatine pool could favor the accumulation of the dephosphorylated form of GSK3β, making it more active. This kinase has many targets in the cell, including transcription factors whose activity it can modulate. This modulation will in turn modify the expression of genes, which can influence several cellular processes: the reorganization of microtubules with the regulation of MAP1B, synaptic function, and neurogenesis thus affecting the functionality of brain cells and consequently cognitive functions. The alteration of neurons could also be explained by a mitochondrial dysfunction due to the decrease of creatine levels and the modulation of GSK3β activity, which is known to regulate mitochondrial activity.
Additional files
-
Supplementary file 1
Raw proteomic Data showing the list of proteins and their spectral counts generated by High-resolution tandem mass spectrometry on the 16 biological samples generated a very large dataset comprising a total of 943,656 MS/MS spectra and the monitoring of the abundance of 4219 proteins.
- https://cdn.elifesciences.org/articles/88459/elife-88459-supp1-v1.xlsx
-
Supplementary file 2
Normalized and filtered proteomic data.
The raw proteomic data consisting of 4219 proteins were normalized using Variance Stabilizing Normalization (VSN) and filtered using an unsupervised variation filter.
- https://cdn.elifesciences.org/articles/88459/elife-88459-supp2-v1.xlsx
-
Supplementary file 3
Normalized and filtered proteomic data were sorted according to p-value (p<0.05 and logfc).
The differential expression analysis of the proteins between healthy and CTD-derived brain organoids was carried out using a modification of the R package for Reproducibility-Optimized Test Statistic (ROTS). The data was sorted according to p-value (<0.05) based on FDR ≤0.25. The blue color indicated proteins downregulated in CTD compared to BJ organoids. The red color indicates proteins upregulated in healthy (BJ) vs CTD-derived brain organoids.
- https://cdn.elifesciences.org/articles/88459/elife-88459-supp3-v1.xlsx
-
Supplementary file 4
Frequency of proteins identified by GSEA.
Absolute GSEA was carried out searching through more than 10,000 different cellular pathways obtained across well-annotated gene sets (c2_cp; c3_tft; c4_cgn; c5_bp; c5_mf; c7). The pathways identified through the GSEA were sorted according to the nominal p-value (<0.05). The list of enriched genes was then identified for each significant pathway and their recurrence in other pathways among all studied gene sets. The genes with the highest frequency across the multiple significant pathways (top 90 percentile cut-off; a total of 142 proteins) were selected for subsequent analysis.
- https://cdn.elifesciences.org/articles/88459/elife-88459-supp4-v1.xlsx
-
Supplementary file 5
List of 142 proteins sorted according to the fold change.
The 142 identified by the GSEA and frequency analysis (top 90 percentile cut-off) as differentially expressed proteins occurring frequently across all enriched pathways were sorted according to fold change; the most abundant proteins with fold change (–3<fold change >+3) (48 proteins, highlighted in yellow) and a sc higher than 10 (32 proteins, highlighted in dark yellow) were selected for further analysis. The 32 proteins selected are the following: RUFY3; MAP1B; GSK3B; PAK1; STMN1; FYN; GNAI1; MYO5A; PAK2; DCTN1; LMNA; SRC; GNAQ; CDK5; PLCG1; MECP2; ACTN3; HMGB2; SYT1; CALM1; ANXA2; L1CAM; ANK2; ACTN2; TNNT2; MYH6; ANXA1; PTK7; TPM1; SFRP1; POSTN; CASQ2.
- https://cdn.elifesciences.org/articles/88459/elife-88459-supp5-v1.xlsx
-
Supplementary file 6
Frequency of 32 proteins identified by Enrichr analysis.
An ENRICHR analysis was performed on the 32 proteins to identify the proteins in potential relation with the cognitive functions. The pathways with p-value less than 0.05 from the following libraries: (BioCarta, Elsevier_Pathway_Collection, GO_Biological_Process, GO_Molecular_Function, KEGG_Human, MSigDB_Hallmark, WikiPathways_Human). The diseases with p value less than 0.05 from the following libraries: (ClinVar, DisGeNET, Jensen_DISEASES, OMIM_Disease).
- https://cdn.elifesciences.org/articles/88459/elife-88459-supp6-v1.docx
-
Supplementary file 7
32 proteins functions and relations to creatine transporter deficiency (CTD) symptoms.
- https://cdn.elifesciences.org/articles/88459/elife-88459-supp7-v1.xlsx
-
Supplementary file 8
Primer sequences used for real-time PCR (RT-PCR) analysis.
- https://cdn.elifesciences.org/articles/88459/elife-88459-supp8-v1.xlsx
-
MDAR checklist
- https://cdn.elifesciences.org/articles/88459/elife-88459-mdarchecklist1-v1.pdf
Download links
A two-part list of links to download the article, or parts of the article, in various formats.
Downloads (link to download the article as PDF)
Open citations (links to open the citations from this article in various online reference manager services)
Cite this article (links to download the citations from this article in formats compatible with various reference manager tools)
Deciphering neuronal deficit and protein profile changes in human brain organoids from patients with creatine transporter deficiency
eLife 12:RP88459.
https://doi.org/10.7554/eLife.88459.3


