The intrinsically disordered cytoplasmic tail of a dendrite branching receptor uses two distinct mechanisms to regulate the actin cytoskeleton
- Roy J Carver Department of Biochemistry, Biophysics, and Molecular Biology, Iowa State University, United States
- Department of Chemistry and Biochemistry, Institute of Molecular Biology, University of Oregon, United States
- Department of Biology, Stanford University, United States
- Neurosciences IDP, Stanford University, United States
- Howard Hughes Medical Institute, Stanford University, United States
Figures
Figure 1 with 3 supplements
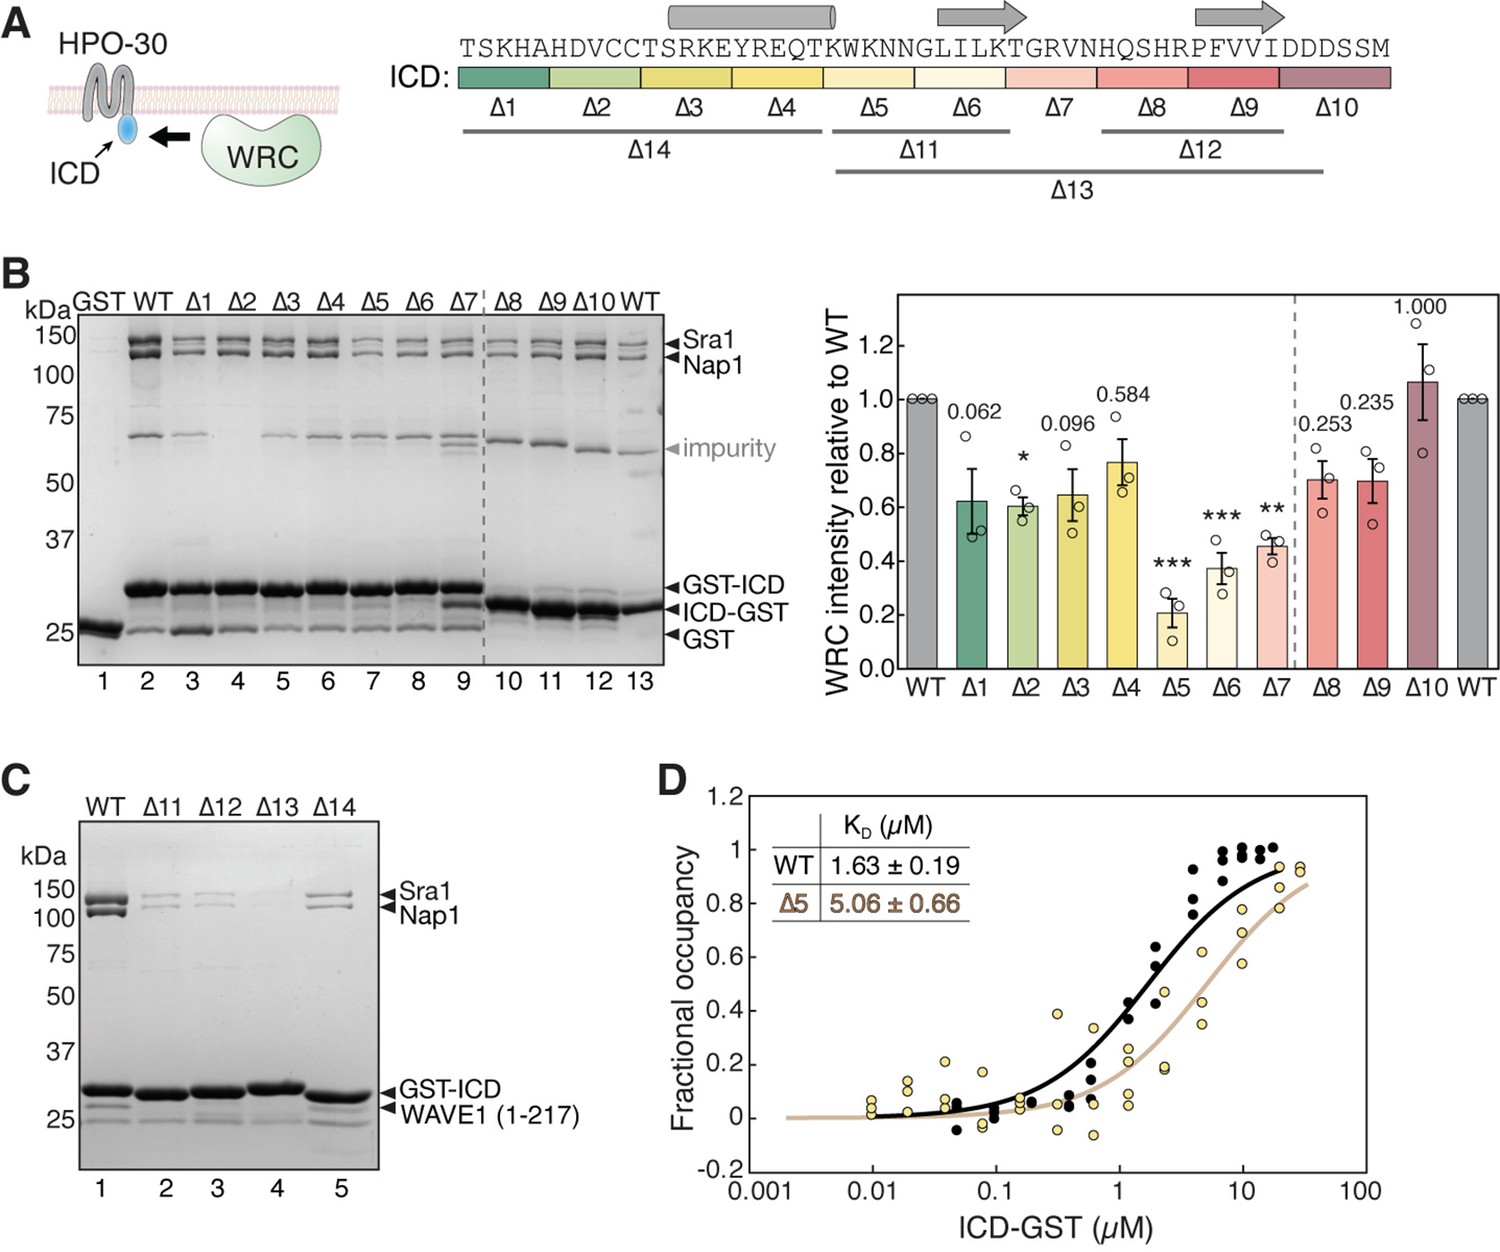
HPO-30 intracellular domain (ICD) binds to the WAVE regulatory complex (WRC) using its entire sequence.
(A) Left: Cartoon representation of HPO-30 as a four-pass transmembrane protein, with the ICD binding to the WRC. Right: Annotation of HPO-30 ICD sequence and mutants used in this study. In each mutant, the corresponding amino acids were replaced with alanines (for ∆1–10) or (GGS)n (for ∆11–14). The regions are color-coded according to the alanine mutations, and the consensus secondary structural elements from multiple secondary structure predictions are indicated above. (B) Representative Coomassie blue-stained SDS-PAGE gel (left) and quantification (right) of three independent experiments showing GST-ICD (lanes 2–9, 200 pmol) and ICD-GST (lanes 10–13, 200 pmol) pulling down WRC230∆WCA (150 pmol). Sra1/Nap1 band intensity was used to quantify the pull-down signals of WRC. Signals from GST-ICD or ICD-GST pull-downs were normalized to the corresponding wild-type (WT) ICD (lanes 2 and 13, respectively). Error bars represent standard error, *p<0.05, **p<0.005, ***p<0.001 from ANOVA with Tukey test. n = 3. (C) Coomassie blue-stained SDS-PAGE gel showing GST-ICD ∆11–14 mutants (200 pmol) pulling down WRC217∆WCA (300 pmol). (D) Fitted curves of the dissociation constant (KD) of the interaction between ICD-GST and WRC. Data were pooled from three independent repeats and globally fitted to a one-site binding model using DynaFit (n = 3). The raw gel images and unedited figure can be found in Figure 1—source data 1. The raw data for (B, right, and D) can be found in Figure 1—source data 2.
-
Figure 1—source data 1
This folder contains the unedited Figure 1 and raw gel images used in Figure 1.
- https://cdn.elifesciences.org/articles/88492/elife-88492-fig1-data1-v1.zip
-
Figure 1—source data 2
This folder contains the raw data and statistical analysis shown in Figure 1B and D.
- https://cdn.elifesciences.org/articles/88492/elife-88492-fig1-data2-v1.zip
Figure 1—figure supplement 1
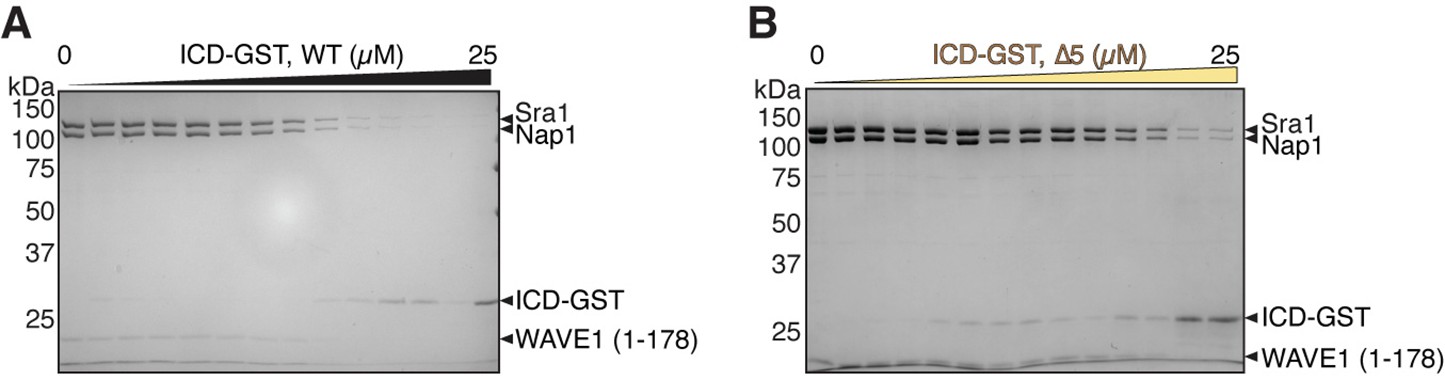
Equilibrium pull-down (EPD) assay of intracellular domain (ICD)-GST and WAVE regulatory complex (WRC).
(A–B) Representative Coomassie blue-stained SDS-PAGE EPD gels used to quantify the dissociation constants shown in Figure 1D for ICD wild-type (WT) (A) and ∆5 (B). The raw gel images and unedited figure can be found in Figure 1—figure supplement 1—source data 1.
-
Figure 1—figure supplement 1—source data 1
This folder contains the unedited Figure 1—figure supplement 1 and raw gel images used in Figure 1—figure supplement 1.
- https://cdn.elifesciences.org/articles/88492/elife-88492-fig1-figsupp1-data1-v1.zip
Figure 1—figure supplement 2
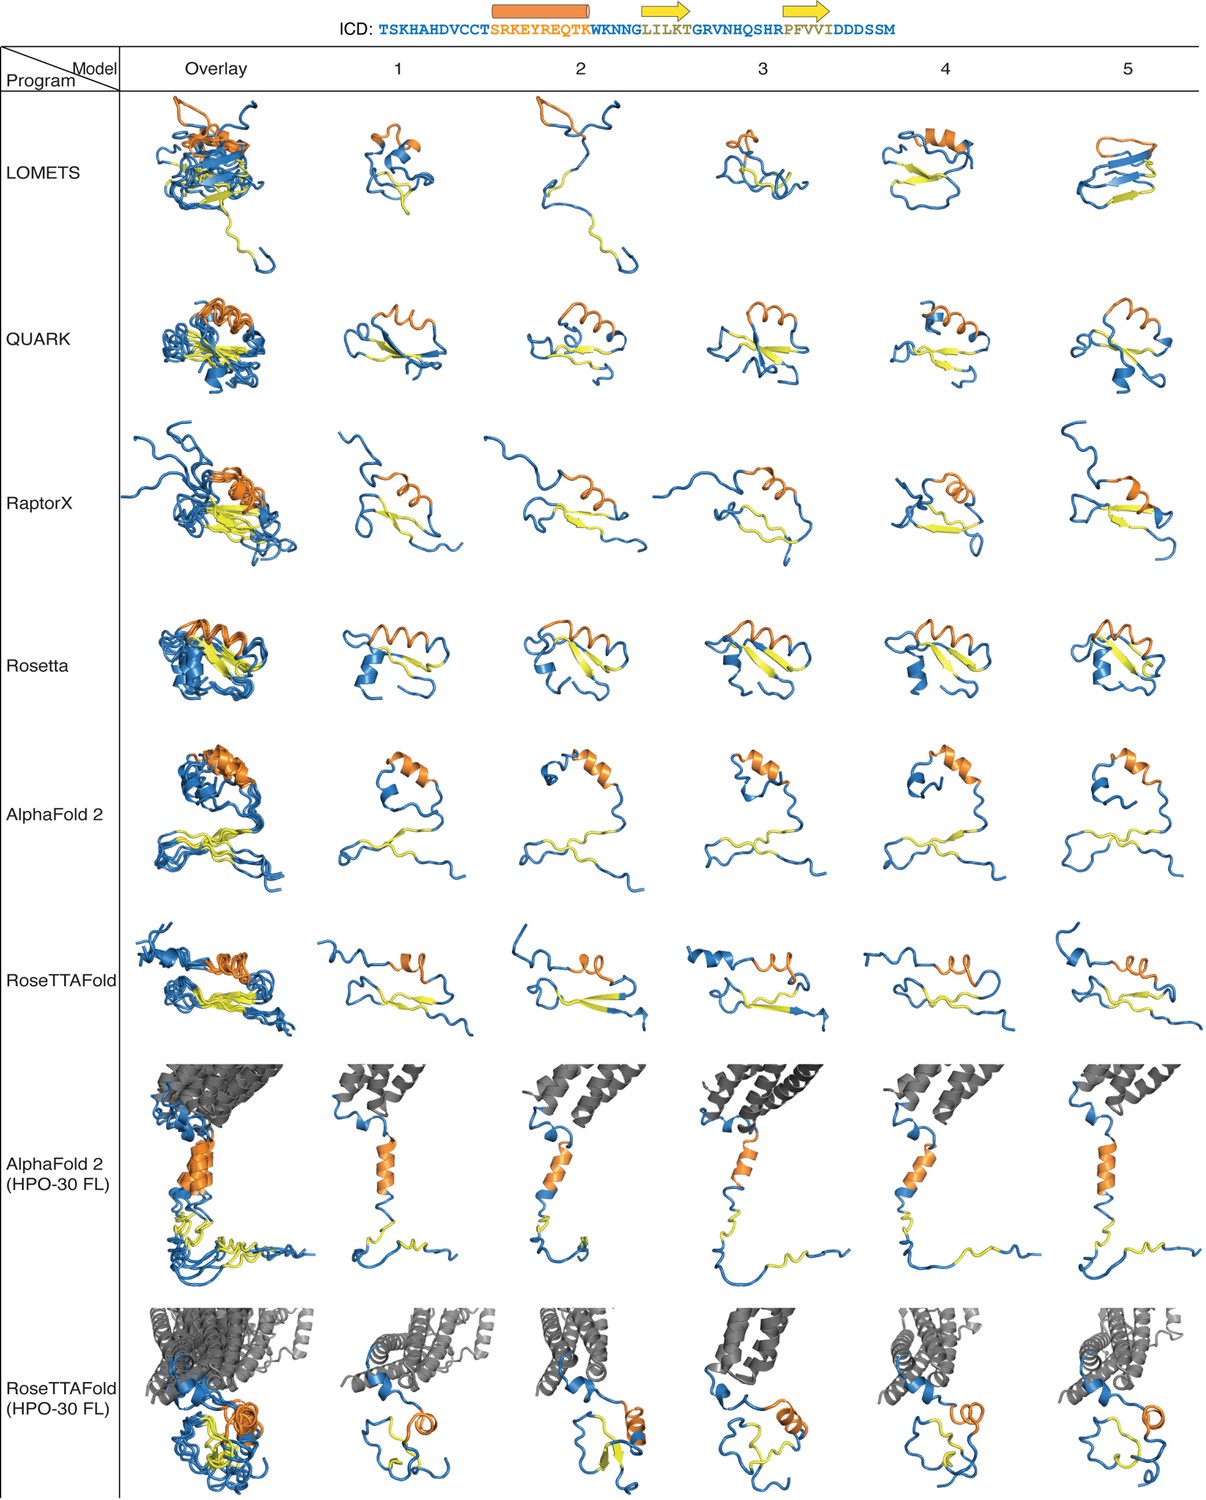
Ab initio structure prediction of HPO-30 intracellular domain (ICD).
The top five ranked structures of HPO-30 ICD predicted by the indicated programs are shown. All predicted structures are aligned in one Pymol scene file, which can be found in Figure 1—figure supplement 2—source data 1.
-
Figure 1—figure supplement 2—source data 1
This folder contains the unedited Figure 1—figure supplement 2 and a Pymol scene file containing all predicted structural models shown in Figure 1—figure supplement 2 aligned to one another.
- https://cdn.elifesciences.org/articles/88492/elife-88492-fig1-figsupp2-data1-v1.zip
Figure 1—figure supplement 3
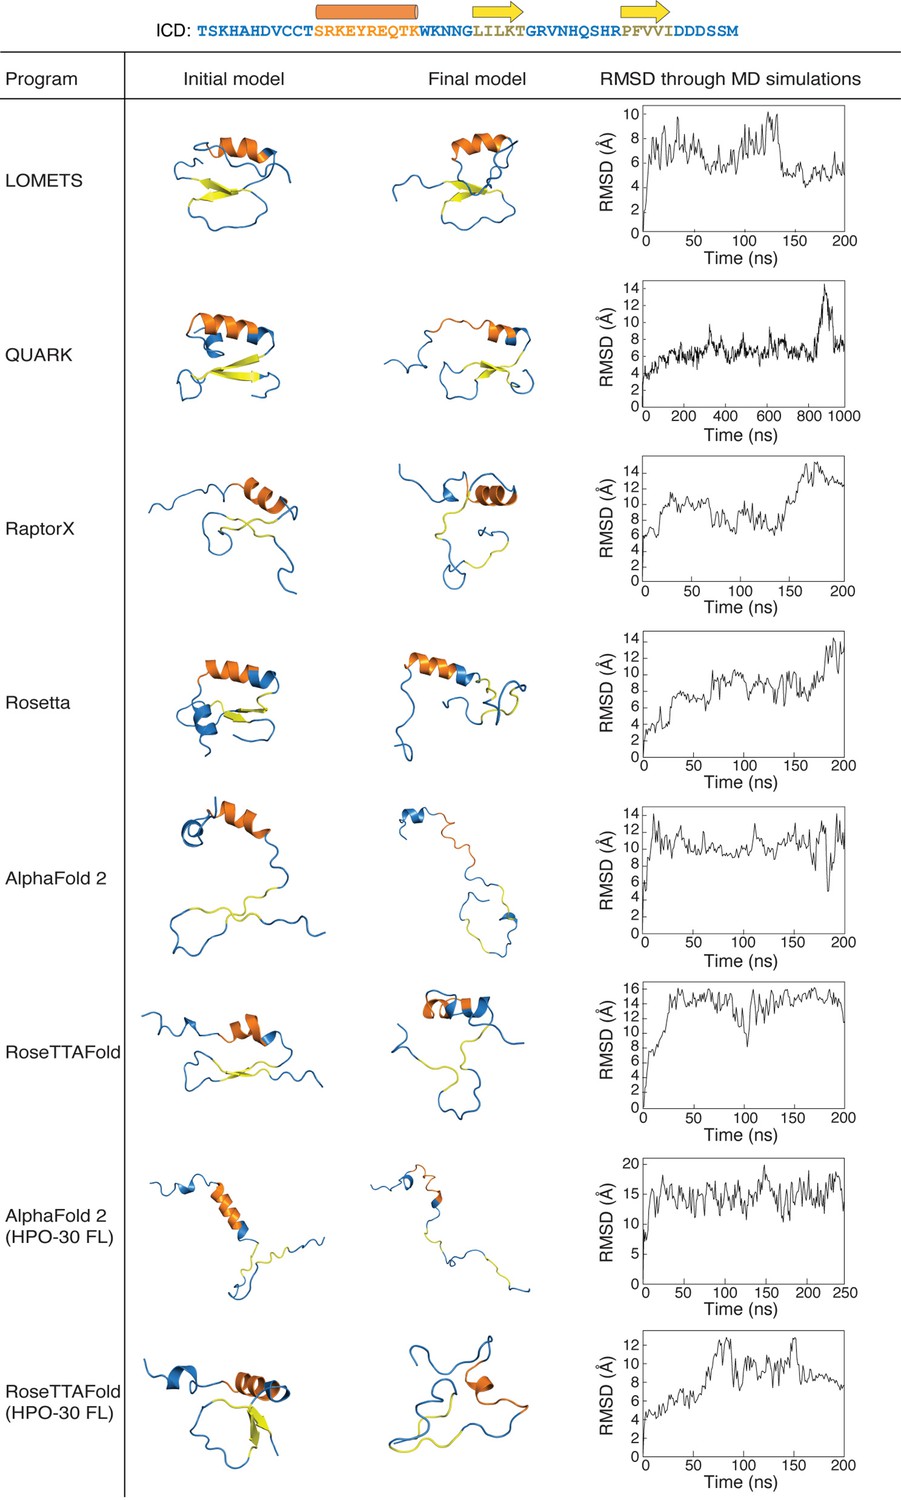
Molecular dynamics (MD) simulations of predicted intracellular domain (ICD) structures.
All-atom MD simulations were conducted for the top ranked structural models generated by indicated programs. Left: The initial structure prediction fed into the MD simulations. Middle: The final structure after the MD simulations ended. Right: Root mean square deviation (RMSD) of the backbone of the HPO-30 ICD over the course of the MD simulation, relative to the starting structure. The starting and final conformations for each predicted structure can be found in Figure 1—figure supplement 3—source data 1, along with the raw RMSD data used to generate the plots on the right.
-
Figure 1—figure supplement 3—source data 1
This folder contains the unedited Figure 1—figure supplement 3 and separate folders containing individual Pymol scenes of the starting and final conformations for all models used in molecular dynamics (MD) simulations and root mean square deviation (RMSD) values for each simulation.
- https://cdn.elifesciences.org/articles/88492/elife-88492-fig1-figsupp3-data1-v1.zip
Figure 2 with 1 supplement
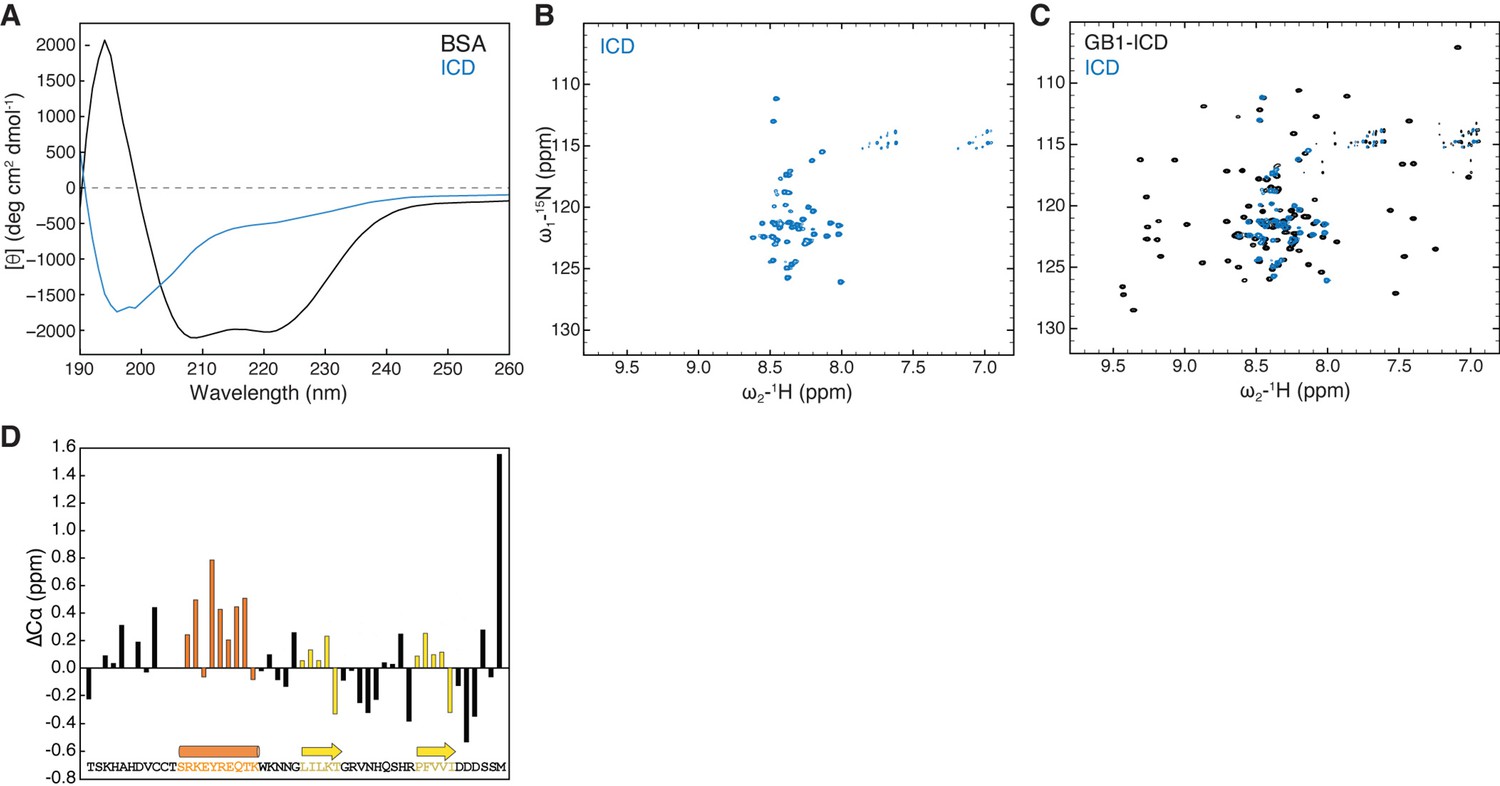
HPO-30 intracellular domain (ICD) is largely disordered but may contain secondary structural elements.
(A) CD spectrum of 2 mg/mL untagged HPO-30 ICD or bovine serum albumin (BSA) in identical buffer conditions (see Materials and methods). (B–C) 2D TROSY spectra of untagged HPO-30 ICD (B) and GB1-ICD (C) in the same buffer condition (100 mM NaCl, 10 mM HEPES pH 7.0, and 5% glycerol). (D) Secondary Cα chemical shift showing the deviation from idealized random coils of Cα chemical shifts measured for HPO-30 ICD. The raw CD data can be found in Figure 2—source data 1, the raw nuclear magnetic resonance (NMR) data in (B) and (C) can be found in Figure 2—source data 2, and the raw NMR data used to generate (D) can be found in Figure 2—source data 3.
-
Figure 2—source data 1
This folder contains the unedited Figure 2 and the raw circular dichroism (CD) spectra data shown in Figure 2A.
- https://cdn.elifesciences.org/articles/88492/elife-88492-fig2-data1-v1.zip
-
Figure 2—source data 2
This folder contains the raw 2D nuclear magnetic resonance (NMR) spectra data shown in Figure 2B/C, which can be opened by commonly used NMR software, including NMRpipe (for processing) and Sparky (for visualization).
- https://cdn.elifesciences.org/articles/88492/elife-88492-fig2-data2-v1.zip
-
Figure 2—source data 3
This folder contains the raw HNCO, HNCA, and HNCOCA nuclear magnetic resonance (NMR) spectra data used to generate the deviation plots in Figure 2D and Figure 2—figure supplement 1F/G.
These files can be opened using common NMR software, including NMRpipe (for processing) and Sparky (for visualization). This folder also contains an Excel sheet containing picked peak values and the assignments.
- https://cdn.elifesciences.org/articles/88492/elife-88492-fig2-data3-v1.zip
Figure 2—figure supplement 1
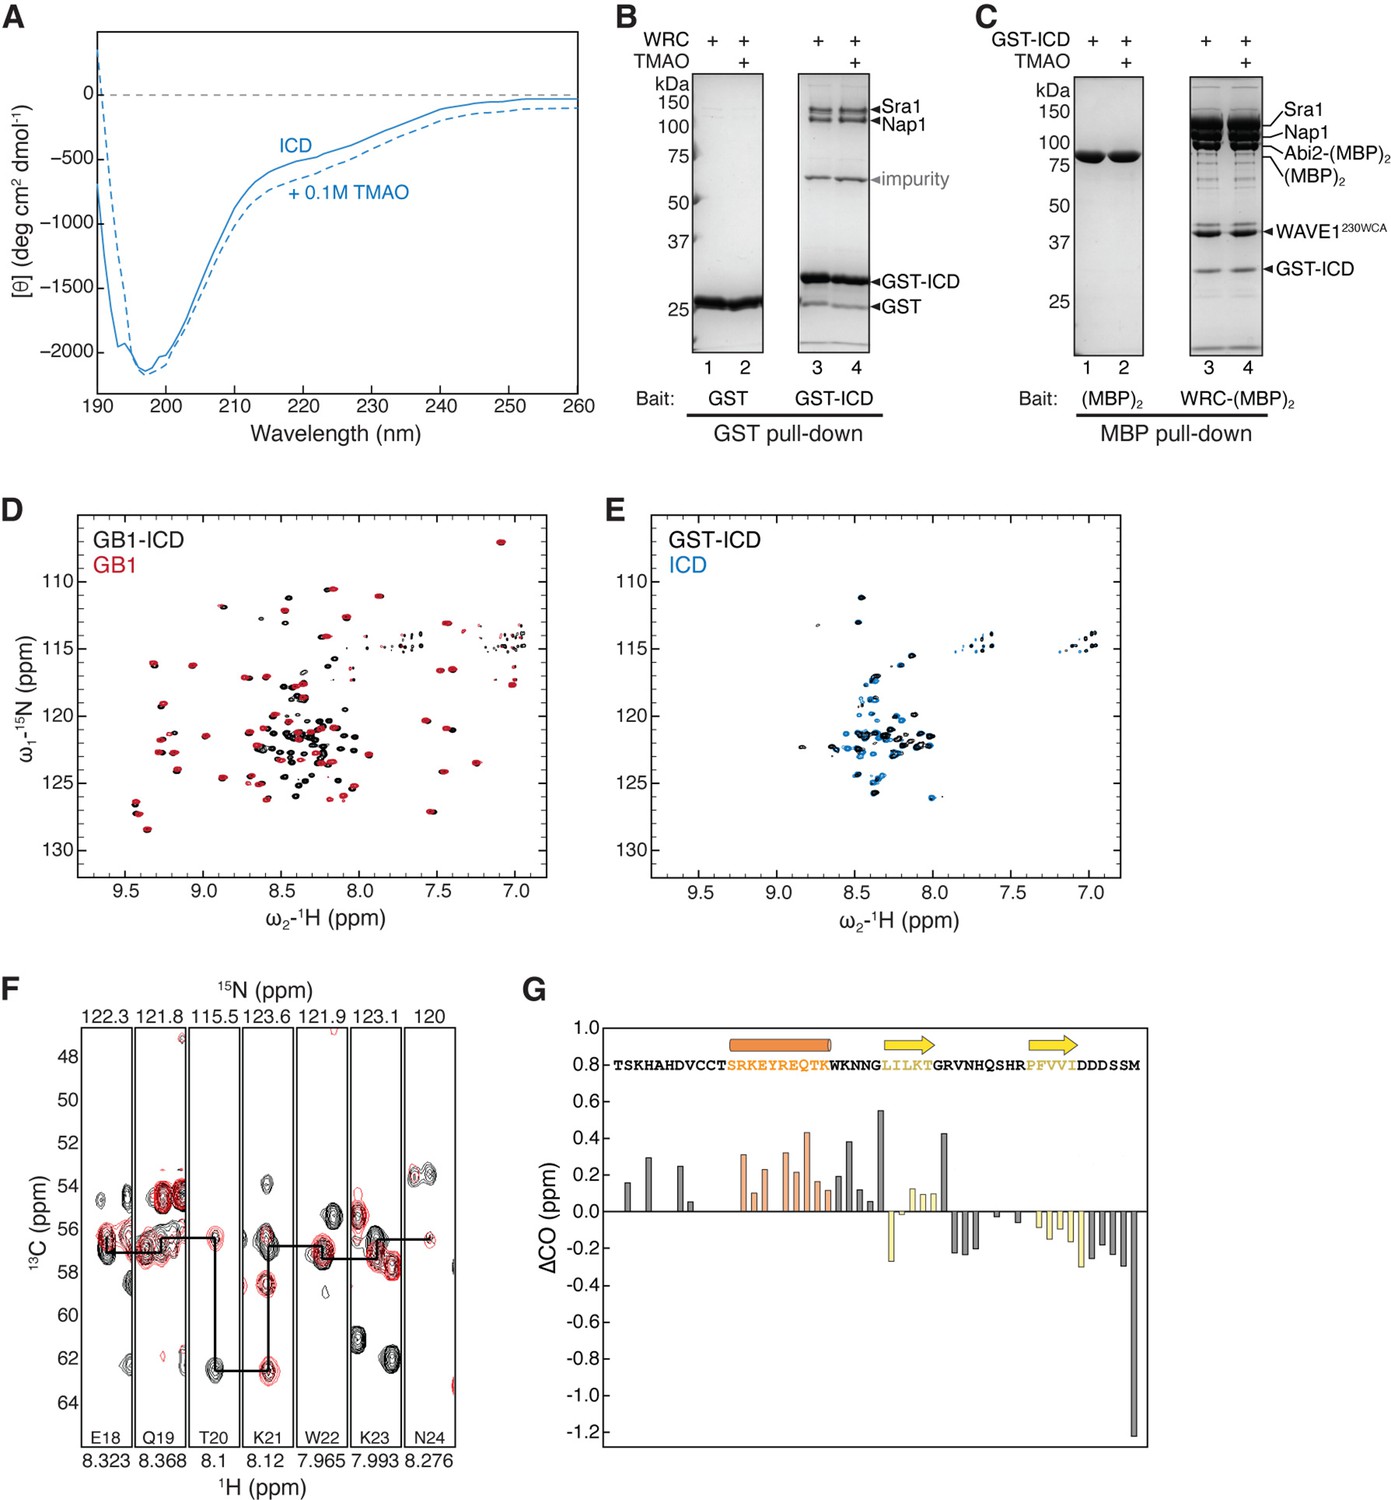
HPO-30 intracellular domain (ICD) is largely disordered.
(A) Circular dichroism (CD) spectrum of 2 mg/mL HPO-30 ICD in the absence or presence of 0.1 M trimethylamine N-oxide (TMAO). (B–C) Coomassie blue-stained SDS-PAGE gels showing GST-ICD (200 pmol) pulling down WRC230∆WCA (150 pmol) (B) or WRC:Abi2-(MBP)2 (60 pmol) pulling down GST-ICD (600 pmol) (C), with and without TMAO. (D–E) 2D TROSY spectra of the GB1 tag compared to the HPO-30 ICD (D) and GST-ICD (E) in the same buffer condition (100 mM NaCl, 10 mM HEPES pH 7.0, and 5% glycerol). (F) Representative strip plots generated in SPARKYNMR showing an overlay of the 3D HNCA and HN(CO)CA spectra (in black and red, respectively). The straight lines indicate the sequential connection between the 13Cα crosspeaks of residues (i) and (i-1). (G) Secondary CO chemical shift showing the deviation from idealized random coils of CO chemical shifts measured for HPO-30 ICD. The raw CD data can be found in Figure 2—figure supplement 1—source data 1, the raw gel images and unedited figure can be found in Figure 2—figure supplement 1—source data 2, the raw nuclear magnetic resonance (NMR) data in (D, E) can be found in Figure 2—figure supplement 1—source data 3, and the raw NMR data used to generate (F, G) can be found in Figure 2—source data 3.
-
Figure 2—figure supplement 1—source data 1
This folder contains the raw circular dichroism (CD) spectra data shown in Figure 2—figure supplement 1A.
- https://cdn.elifesciences.org/articles/88492/elife-88492-fig2-figsupp1-data1-v1.zip
-
Figure 2—figure supplement 1—source data 2
This folder contains the unedited Figure 2—figure supplement 1 and raw gel images used in Figure 2—figure supplement 1.
- https://cdn.elifesciences.org/articles/88492/elife-88492-fig2-figsupp1-data2-v1.zip
-
Figure 2—figure supplement 1—source data 3
This folder contains the raw nuclear magnetic resonance (NMR) spectra data shown in Figure 2—figure supplement 1D/E, which can be opened by commonly used NMR software, including NMRpipe (for processing) and Sparky (for visualization).
- https://cdn.elifesciences.org/articles/88492/elife-88492-fig2-figsupp1-data3-v1.zip
Figure 3 with 2 supplements
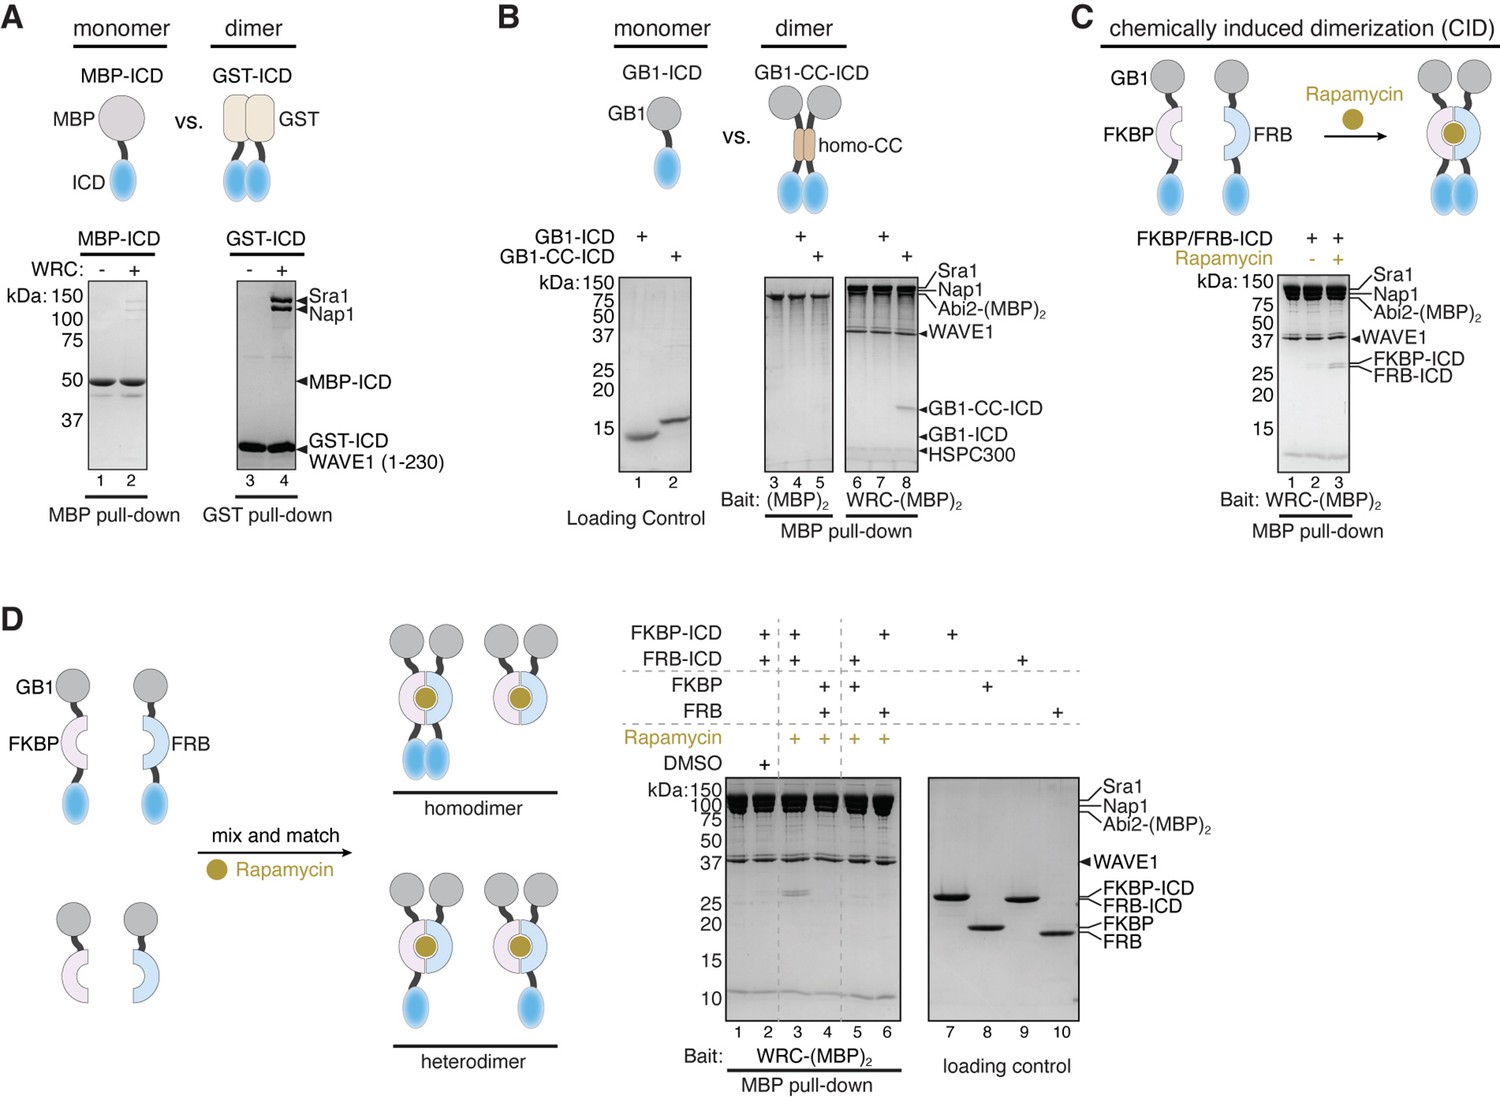
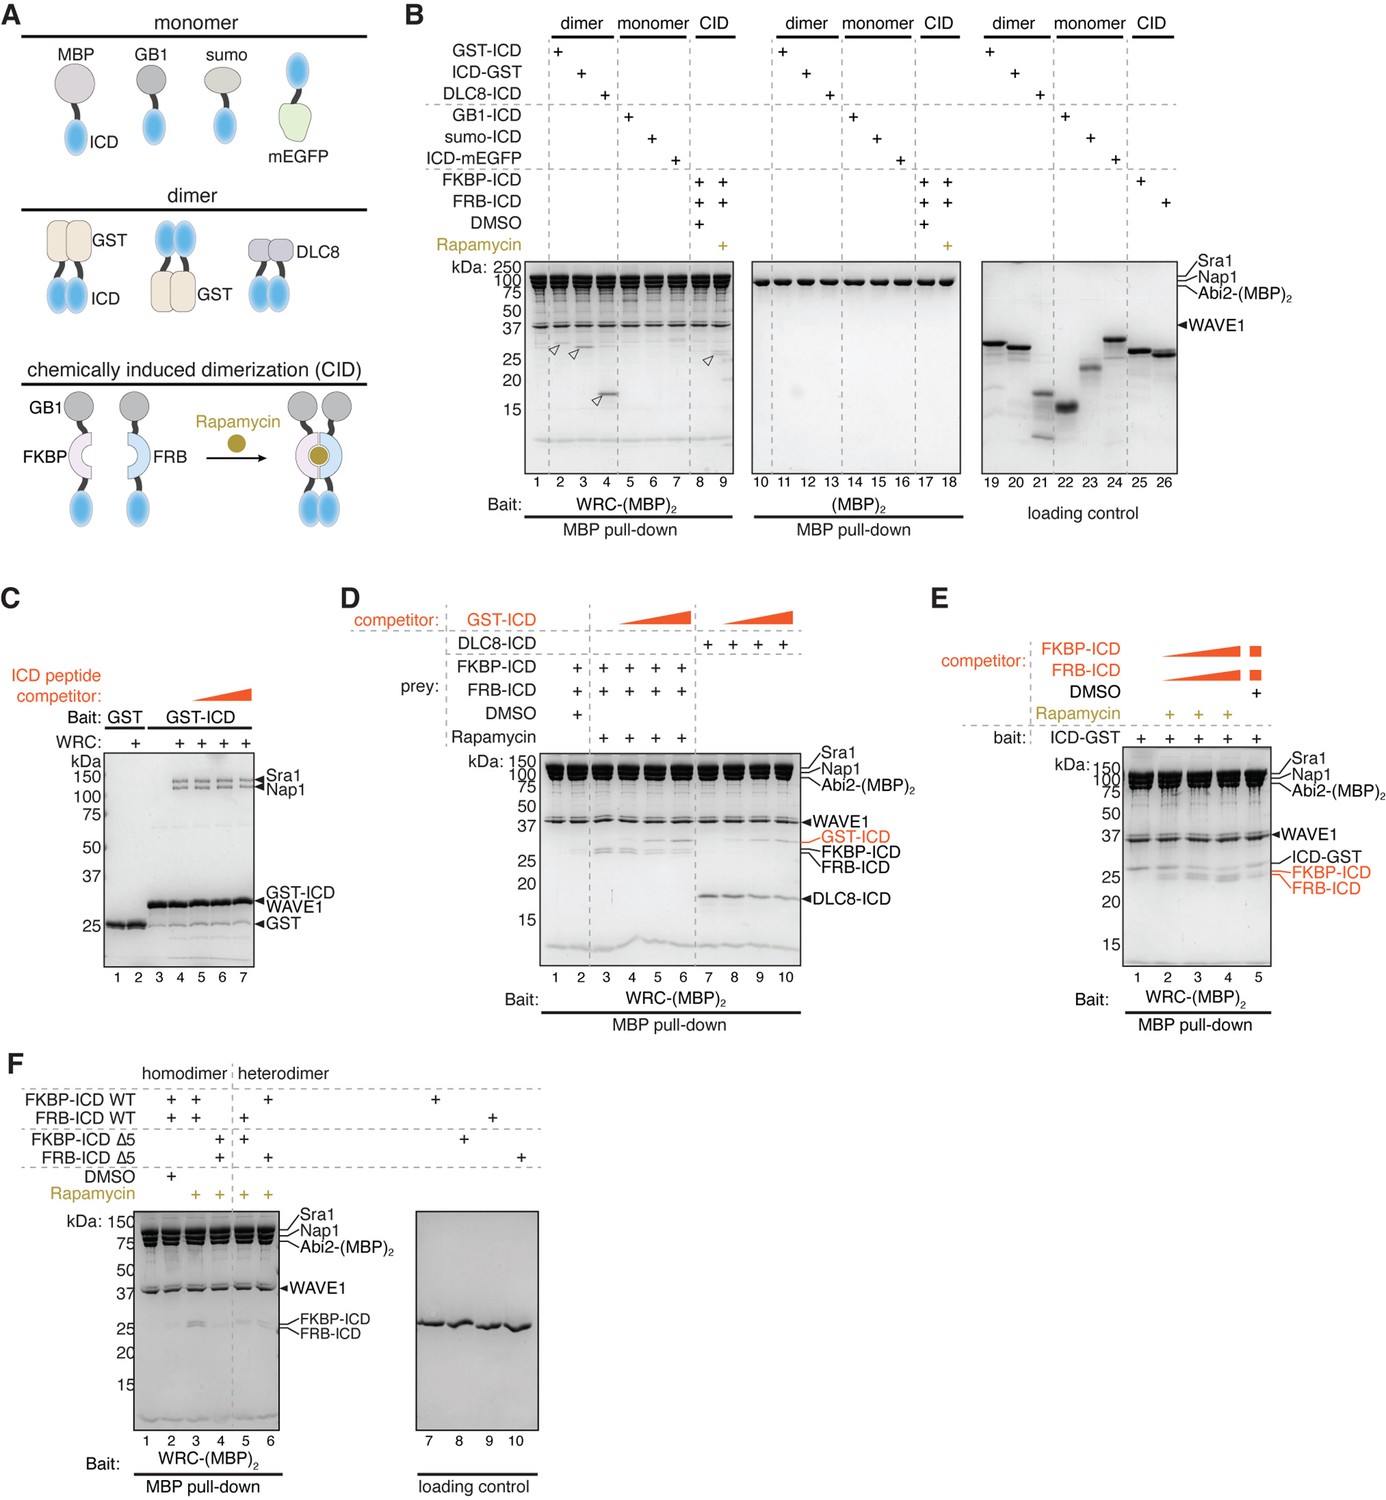
Dimerization tags enhance HPO-30 intracellular domain (ICD) binding to the WAVE regulatory complex (WRC).
(A–C) Top: Schematic of monomeric and dimeric HPO-30 ICD constructs used in pull-downs. Bottom: Coomassie blue-stained SDS-PAGE gels showing (A) MBP-ICD or GST-ICD (200 pmol) pulling down WRC230∆WCA (200 pmol), (B) WRC:Abi2-(MBP)2 (60 pmol) pulling down GB1-ICD or GB1-CC-ICD (600 pmol), and (C) WRC:Abi2-(MBP)2 (60 pmol) pulling down FKBP/FRB-ICD in the absence or presence of rapamycin. Where it is noted, 5 µM rapamycin (or equal volume of DMSO as a negative control) was used to induce dimerization. For clarity, GB1-FKBP-ICD and GB1-FRB-ICD were referred to as FKBP-ICD and FRB-ICD, respectively. (D) Schematic of the assembly of homo- and heterodimers of HPO-30 ICD (left) and Coomassie blue-stained SDS-PAGE gels (right) showing WRC:Abi2-(MBP)2 (60 pmol) pulling down indicated homo- and heterodimers. In homo- and heterodimers, 1200 pmol of wild-type (WT) ICD monomeric unit was included to ensure the total number of WT ICD molecules remained the same. The raw gel images and unedited figure can be found in Figure 3—source data 1.
-
Figure 3—source data 1
This folder contains the unedited Figure 3 and raw gel images used in Figure 3.
- https://cdn.elifesciences.org/articles/88492/elife-88492-fig3-data1-v1.zip
Figure 3—figure supplement 1
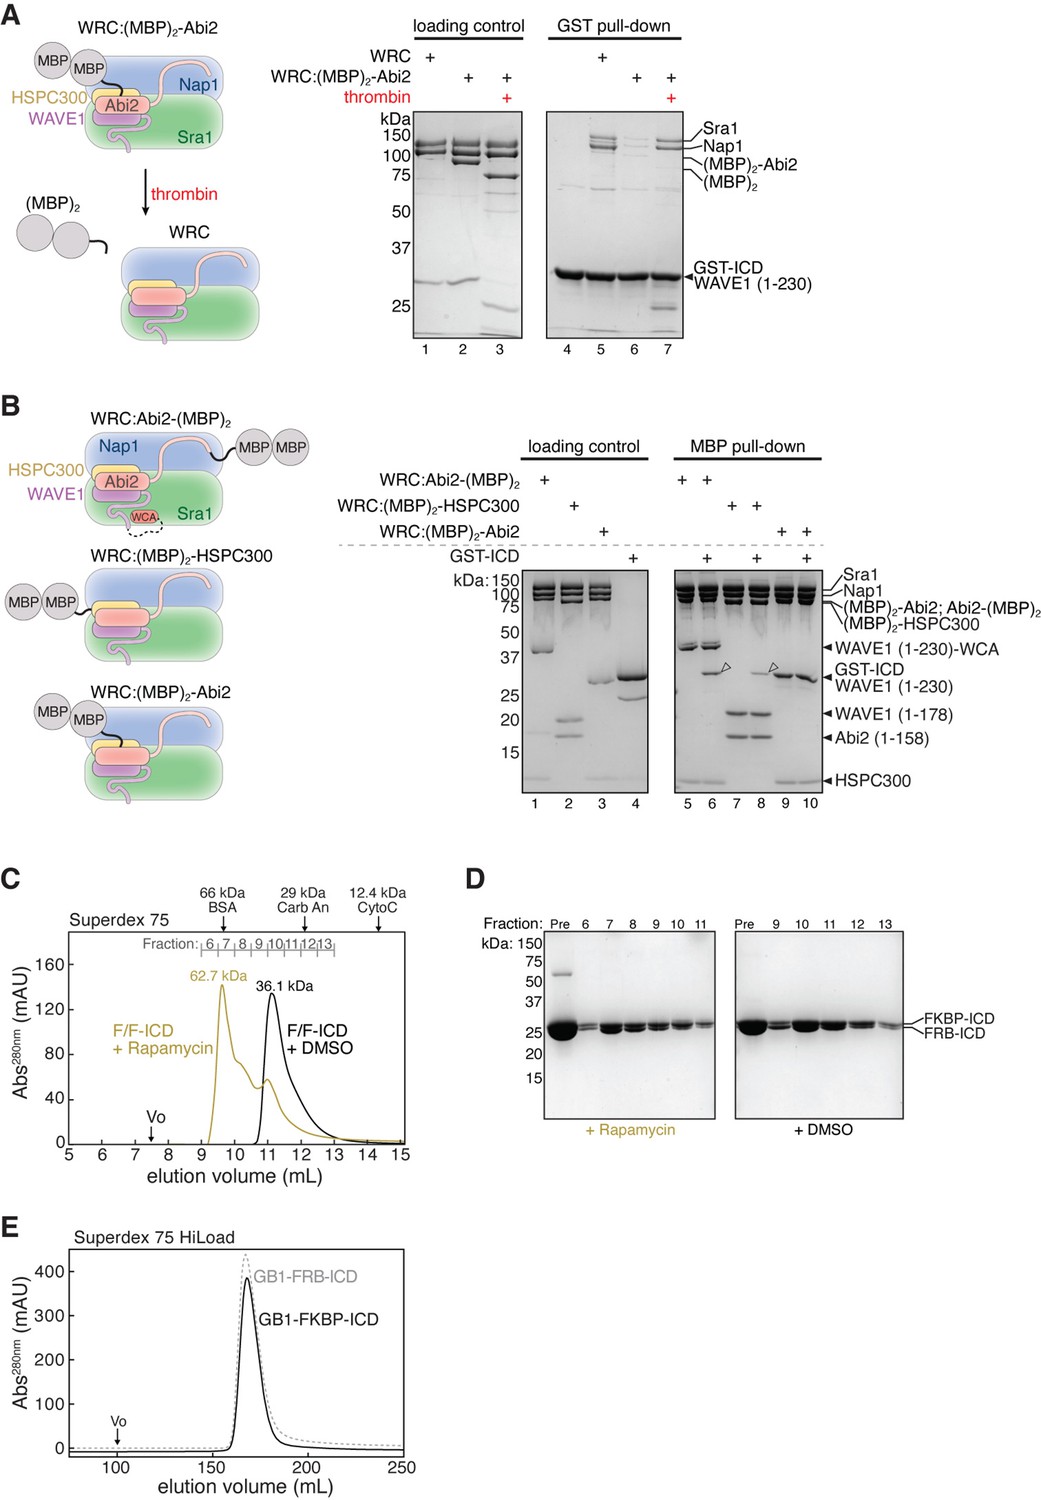
Protein quality control for dimerization experiments.
(A) Schematic of removing (MBP)2 tag from WRC:(MBP)2-Abi2 by thrombin cleavage (left) and Coomassie blue-stained SDS-PAGE gels (right) comparing GST-intracellular domain (ICD) (200 pmol) pulling down WRC:(MBP)2-Abi2 (150 pmol) before or after removal of the (MBP)2 tag. (B) Schematic of (MBP)2-tagged WRC constructs (left) and Coomassie blue-stained SDS-PAGE gels showing indicated (MBP)2-tagged WRC (60 pmol) pulling down GST-ICD (600 pmol). Open arrowheads indicated pull-down signals. (C) Gel filtration chromatograms of equimolar GB1-FKBP-ICD and GB1-FRB-ICD in the presence or absence of 5 µM rapamycin (or equal volume of DMSO). Molecular weights determined from a standard curve (see Materials and methods) are indicated above the chromatogram. (D) Coomassie blue-stained SDS-PAGE gels of the indicated gel filtration fractions from (C). (E) Gel filtration chromatograms of individual GB1-FKBP-ICD and GB1-FRB-ICD proteins. The raw gel images and unedited figure can be found in Figure 3—figure supplement 1—source data 1. The raw chromatogram data used to generate the curves in (C, E) can be found in Figure 3—figure supplement 1—source data 2 .
-
Figure 3—figure supplement 1—source data 1
This folder contains the unedited Figure 3—figure supplement 1 and raw gel images used in Figure 3—figure supplement 1.
- https://cdn.elifesciences.org/articles/88492/elife-88492-fig3-figsupp1-data1-v1.zip
-
Figure 3—figure supplement 1—source data 2
This folder contains the raw gel filtration chromatogram data shown in Figure 3—figure supplement 1C/E.
- https://cdn.elifesciences.org/articles/88492/elife-88492-fig3-figsupp1-data2-v1.zip
Figure 3—figure supplement 2
HPO-30 intracellular domain (ICD) binding to WAVE regulatory complex (WRC) requires dimerization tags.
(A) Schematic of monomeric and dimeric HPO-30 ICD constructs used in pull-downs. (B) Coomassie blue-stained SDS-PAGE gels showing WRC:Abi2-(MBP)2 or (MBP)2 (60 pmol) pulling down various monomeric and dimeric HPO-30 ICD (600 pmol) constructs indicated in (A). Where it is noted, 5 µM rapamycin (vs. equal volume of DMSO as a negative control) was used to induce dimerization. Open arrowheads indicate pull-down signals. For clarity, GB1-FKBP-ICD and GB1-FRB-ICD were referred to as FKBP-ICD and FRB-ICD, respectively. (C) Coomassie blue-stained SDS-PAGE gel showing GST-ICD (200 pmol) pulling down WRC230∆WCA (150 pmol) in the presence of a chemically synthesized HPO-30 ICD peptide as a competitor (18–100 nmol). (D) Coomassie blue-stained SDS-PAGE gels showing WRC-(MBP)2 (60 pmol) pulling down different dimeric HPO-30 ICD (600 pmol) in the presence of GST-ICD as a competitor (600–6000 pmol). (E) Coomassie blue-stained SDS-PAGE gel showing WRC-(MBP)2 (60 pmol) pulling down ICD-GST (600 pmol) in the presence of FKBP/FRB-ICD as a competitor (600–6000 pmol). (F) Coomassie blue-stained SDS-PAGE gels showing WRC:Abi2-(MBP)2 (60 pmol) pulling down different combinations of homo- and heterodimers of wild-type (WT) and ∆5 HPO-30 ICD. In homo- and heterodimers, 1200 pmol of WT ICD monomeric unit was included to ensure the total number of WT ICD molecules remained the same. The raw gel images and unedited figure can be found in Figure 3—figure supplement 2—source data 1.
-
Figure 3—figure supplement 2—source data 1
This folder contains the unedited Figure 3—figure supplement 2 and raw gel images used in Figure 3—figure supplement 2.
- https://cdn.elifesciences.org/articles/88492/elife-88492-fig3-figsupp2-data1-v1.zip
Figure 4 with 3 supplements
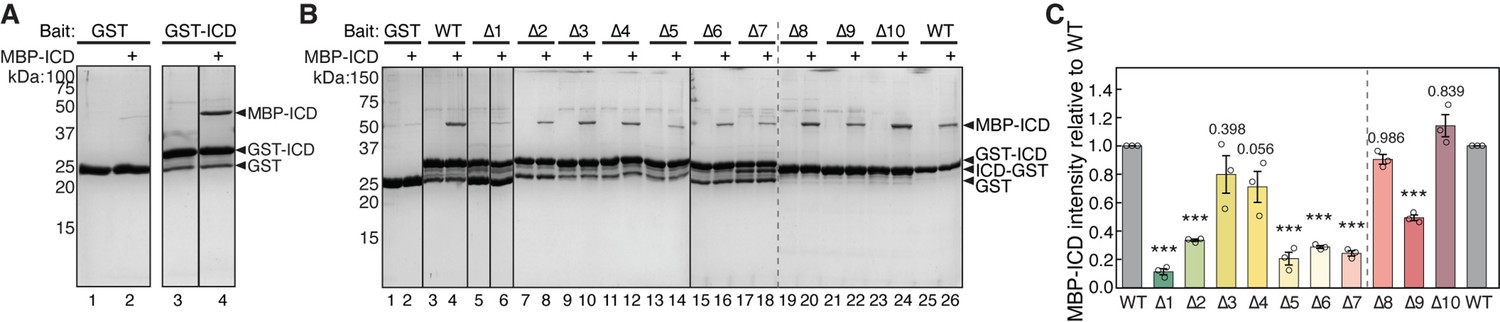
HPO-30 intracellular domain (ICD) can self-associate.
(A) Coomassie blue-stained SDS-PAGE gels showing GST-ICD (300 pmol) pulling down MBP-ICD (6000 pmol). (B) Representative Coomassie blue-stained SDS-PAGE gels of three independent experiments showing GST-ICD alanine mutations (shown in Figure 1A) (300 pmol) pulling down MBP-ICD (6000 pmol). (C) Quantification of (B). The MBP-ICD band intensity was used to quantify the pull-down signal. Signals from GST-ICD or ICD-GST pull-downs were normalized to corresponding wild-type (WT) ICD (lanes 4 and 26, respectively). Error bars represent standard error, *p<0.05, **p<0.005, ***p<0.001 from ANOVA on ranks. n = 3. The raw gel images and unedited figure can be found in Figure 4—source data 1. The raw data for (C) can be found in Figure 4—source data 2.
-
Figure 4—source data 1
This folder contains the unedited Figure 4 and raw gel images used in Figure 4.
- https://cdn.elifesciences.org/articles/88492/elife-88492-fig4-data1-v1.zip
-
Figure 4—source data 2
This folder contains the raw data and statistical analysis shown in Figure 4C.
- https://cdn.elifesciences.org/articles/88492/elife-88492-fig4-data2-v1.zip
Figure 4—figure supplement 1
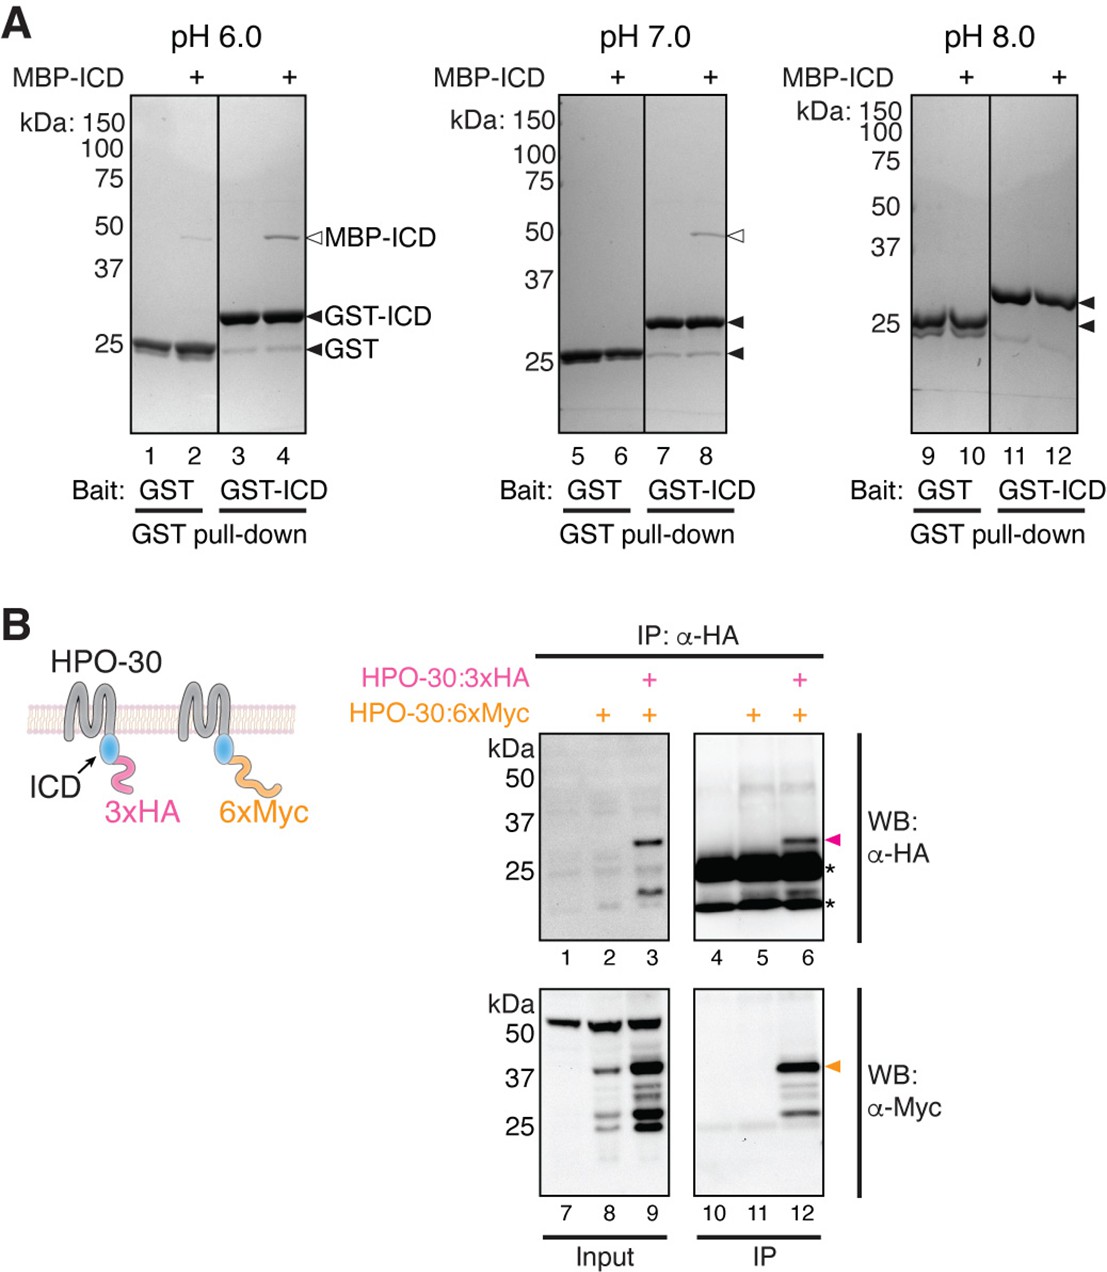
HPO-30 intracellular domain (ICD) can interact with itself.
(A) Coomassie blue-stained SDS-PAGE gels showing GST-ICD (300 pmol) pulling down MBP-ICD (6000 pmol) at pH 6.0 (left), pH 7.0 (middle), and pH 8.0 (right). (B) Schematic of full-length HPO-30 constructs co-expressed in Drosophila S2 cells (left) and western blot images (right) showing co-immunoprecipitation of 3xHA-tagged HPO-30 (pink arrowhead) with 6xMyc-tagged HPO-30 (orange arrowhead). Asterisks indicate light and heavy chain of antibody. The raw gel images and unedited figure can be found in Figure 4—figure supplement 1—source data 1.
-
Figure 4—figure supplement 1—source data 1
This folder contains the unedited Figure 4—figure supplement 1 and raw gel images used in Figure 4—figure supplement 1.
- https://cdn.elifesciences.org/articles/88492/elife-88492-fig4-figsupp1-data1-v1.zip
Figure 4—figure supplement 2
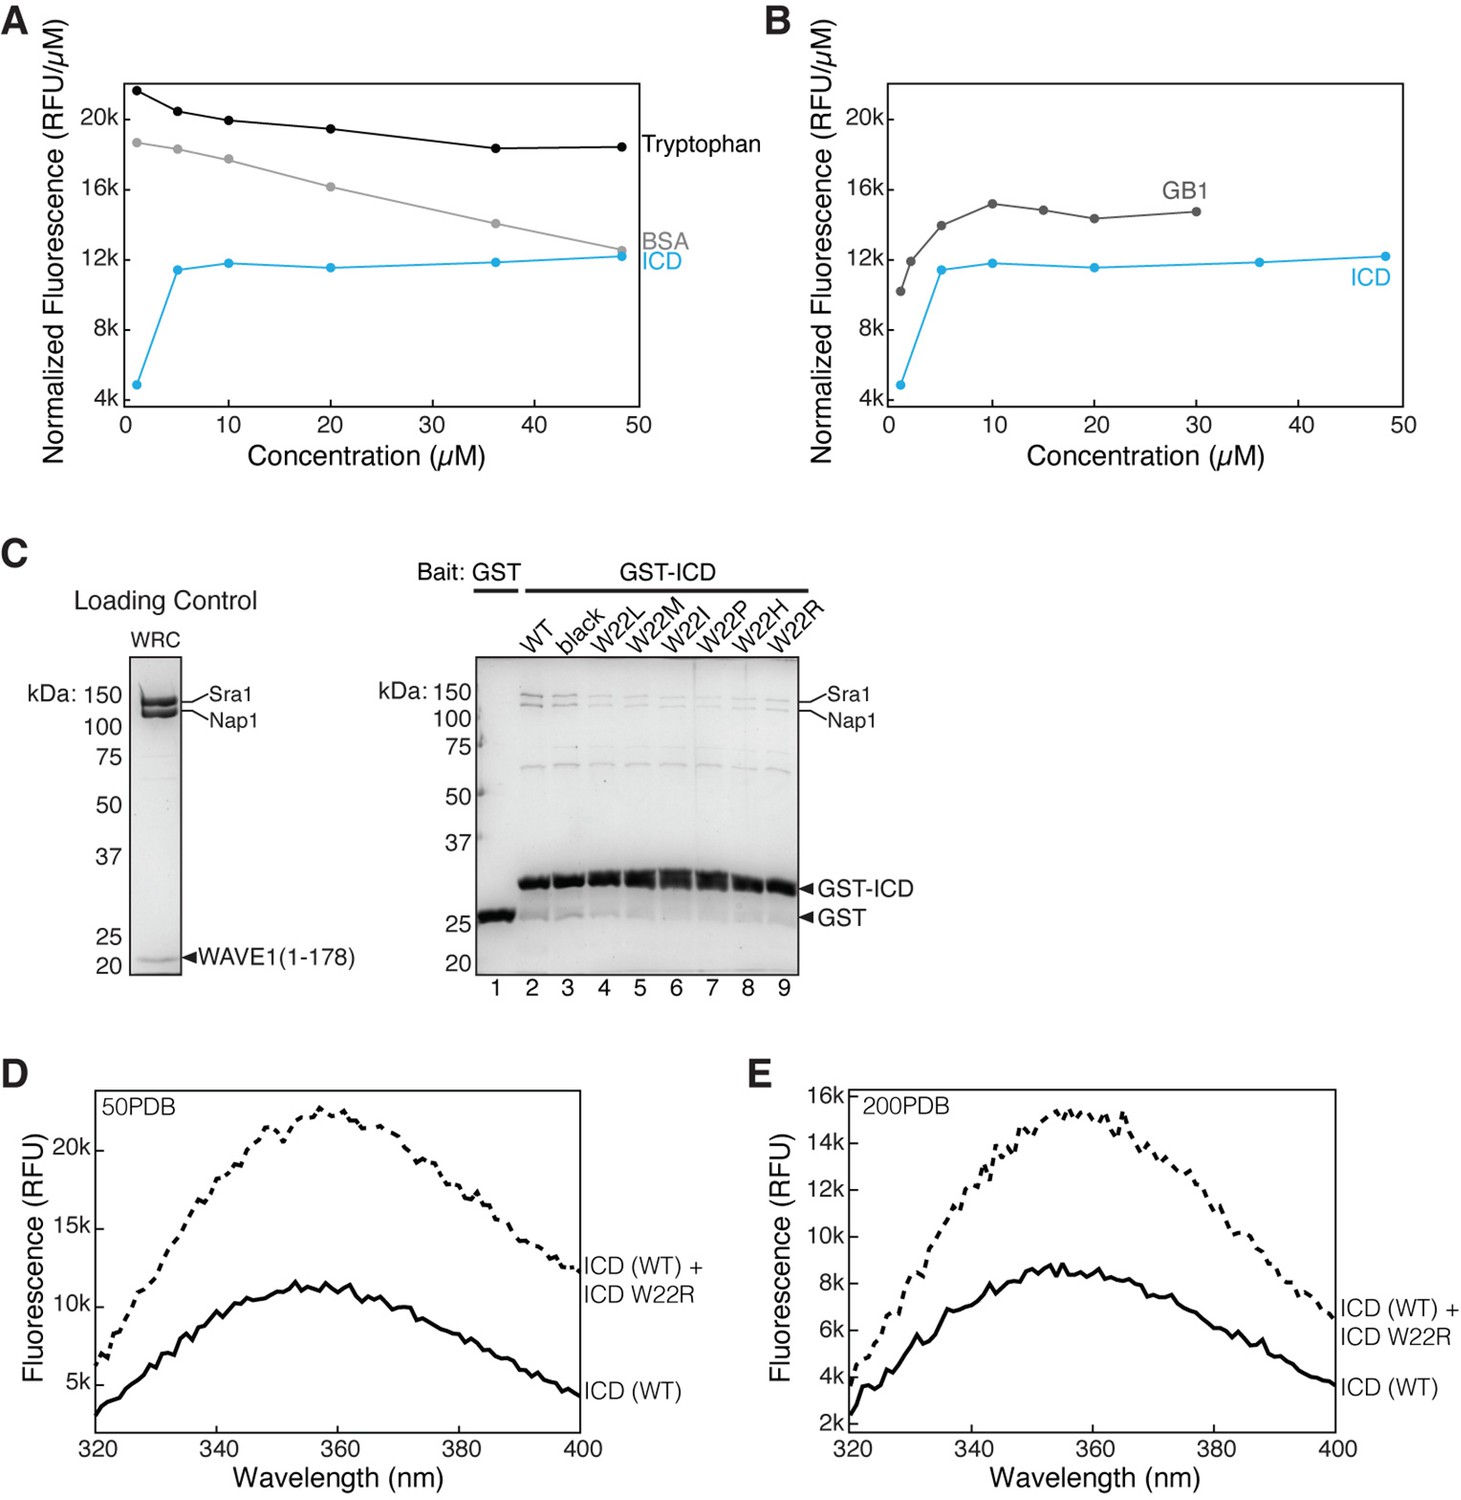
Tryptophan fluorescence cannot be used to monitor the self-association of HPO-30 intracellular domain (ICD).
(A) Normalized intrinsic tryptophan fluorescence of free tryptophan (black), bovine serum albumin (BSA) (gray), and ICD (blue) at different concentrations. (B) Normalized intrinsic tryptophan fluorescence of GB1 tag (gray) and ICD (blue) at different concentrations. Note that the ICD curve is identical for both (A) and (B). ICD Trp fluorescence increases in the same manner as GB1, suggesting that the increase is not due to dimerization. (C) Coomassie blue-stained SDS-PAGE gels showing GST-ICD wild-type (WT) and various tryptophan mutants (W22X) (200 pmol) pulling down WRC178 (200 pmol). (D–E) Raw intrinsic tryptophan fluorescence curves of ICD WT (solid line) and ICD WT+250 µM ICD ‘black’ (dashed lines) at 50 mM NaCl (D) and 200 mM NaCl (E). The increase in Trp fluorescence seen after addition of HPO-30 ‘black’ ICD is not abolished in high salt conditions, suggesting it is non-specific to ICD-ICD dimerization. The raw gel images and unedited figure can be found in Figure 4—figure supplement 2—source data 1. The raw data used in (A, B, D, E) can be found in Figure 4—figure supplement 2—source data 2.
-
Figure 4—figure supplement 2—source data 1
This folder contains the unedited Figure 4—figure supplement 2 and raw gel images used in Figure 4—figure supplement 2.
- https://cdn.elifesciences.org/articles/88492/elife-88492-fig4-figsupp2-data1-v1.zip
-
Figure 4—figure supplement 2—source data 2
This folder contains the raw data used in Figure 4—figure supplement 2A, B, D, and E.
- https://cdn.elifesciences.org/articles/88492/elife-88492-fig4-figsupp2-data2-v1.zip
Figure 4—figure supplement 3
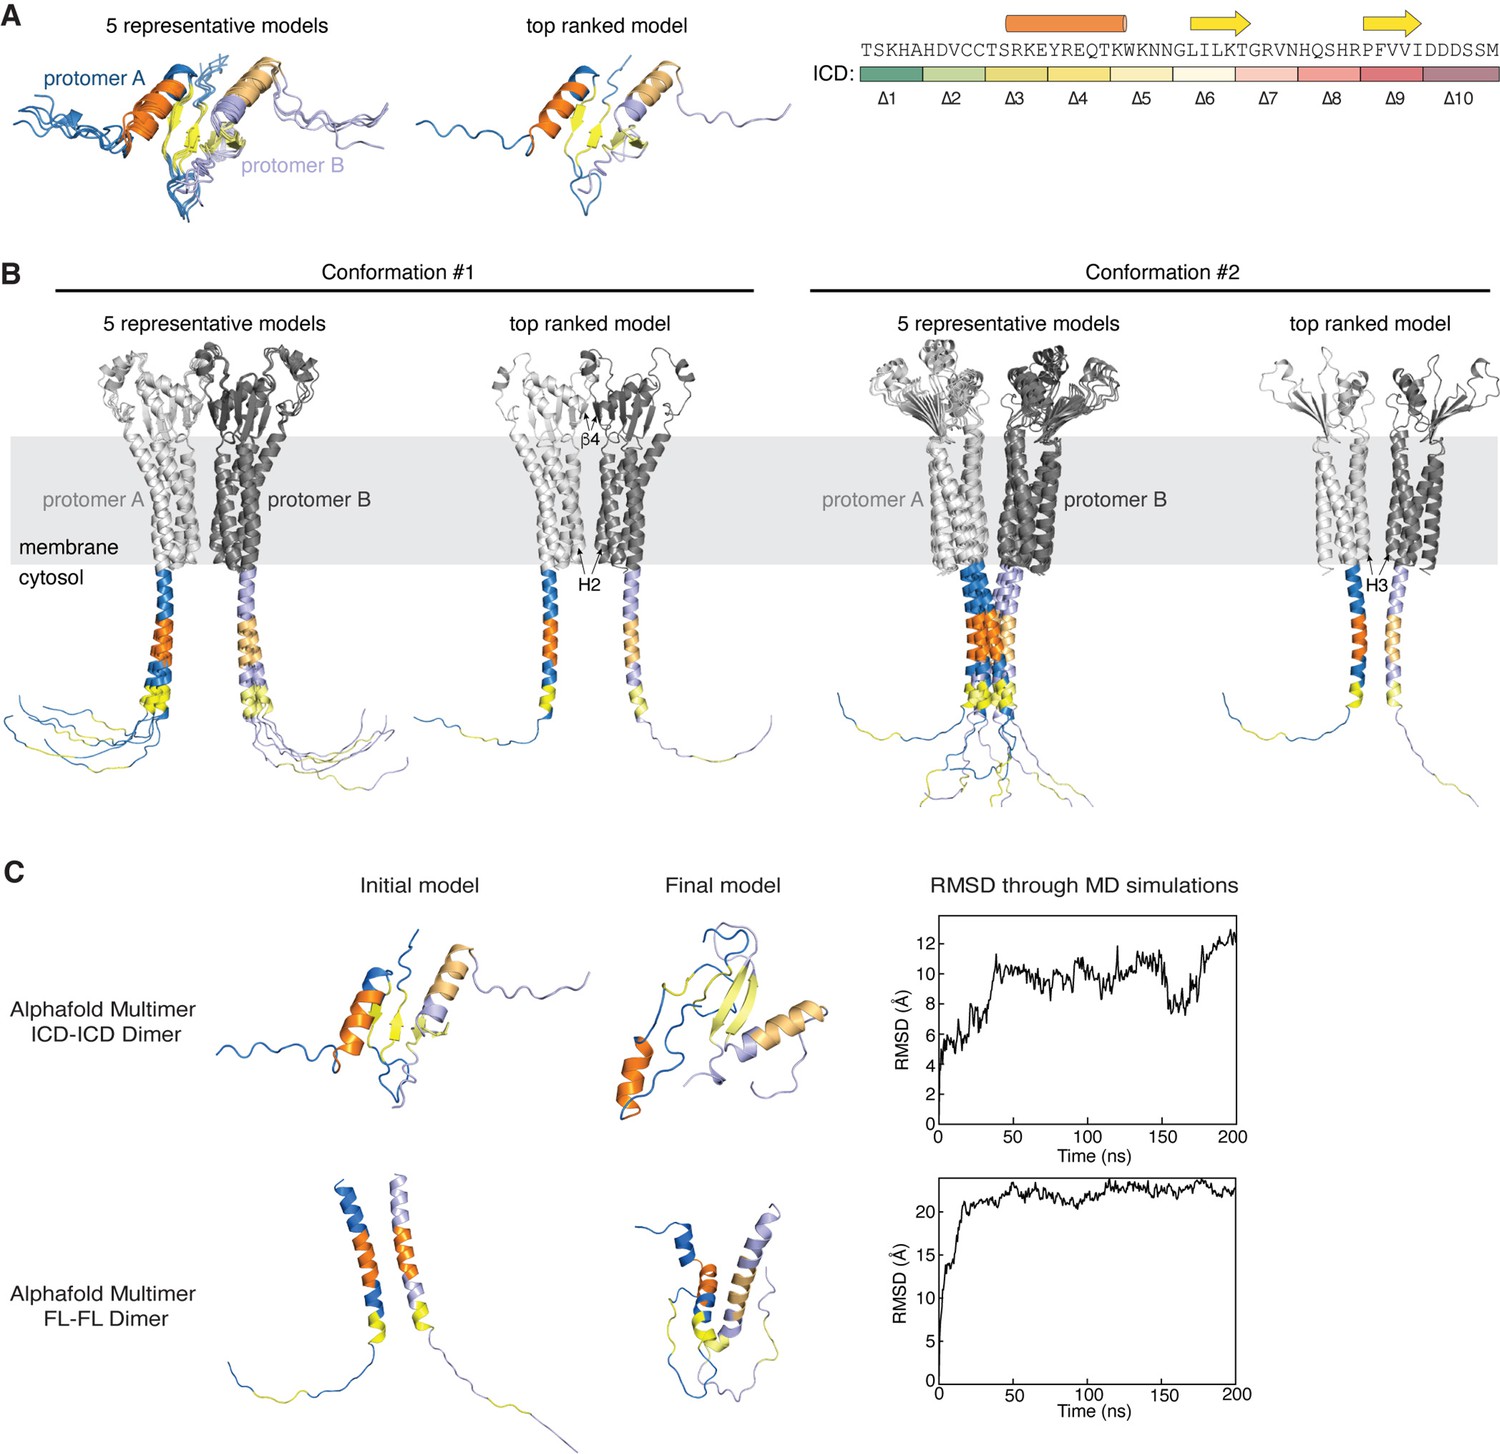
Structural predictions of HPO-30 intracellular domain (ICD) self-association.
(A) AlphaFold Multimer predictions of the isolated HPO-30 ICD dimer. Protomer A secondary structure is colored using the same scheme shown on the top right, while protomer B is shown in lighter colors. (B) Two distinct dimer conformations of the full-length HPO-30 predicted by AlphaFold Multimer. (C) Molecular dynamics (MD) simulations of the predicted ICD dimers using an amber-99sb-ILDN force field. Left: The initial structure prediction fed into the MD simulations. Middle: The final structure after the MD simulations ended. Right: Root mean square deviation (RMSD) of the backbone of the HPO-30 ICD over the course of the MD simulation, relative to the starting structure. The structural predictions in (A, B) can be found in Figure 4—figure supplement 3—source data 1. The starting and final conformations for each predicted structure can be found in Figure 4—figure supplement 3—source data 2, along with the raw RMSD data used to generate the plots on the right.
-
Figure 4—figure supplement 3—source data 1
This folder contains the unedited Figure 4—figure supplement 3 and two Pymol scene files containing all predicted structural models shown in Figure 4—figure supplement 3 aligned to one another.
- https://cdn.elifesciences.org/articles/88492/elife-88492-fig4-figsupp3-data1-v1.zip
-
Figure 4—figure supplement 3—source data 2
This folder contains individual Pymol scene files of the starting and final conformations for all models used in molecular dynamics (MD) simulations and root mean square deviation (RMSD) values for each simulation.
- https://cdn.elifesciences.org/articles/88492/elife-88492-fig4-figsupp3-data2-v1.zip
Figure 5 with 1 supplement
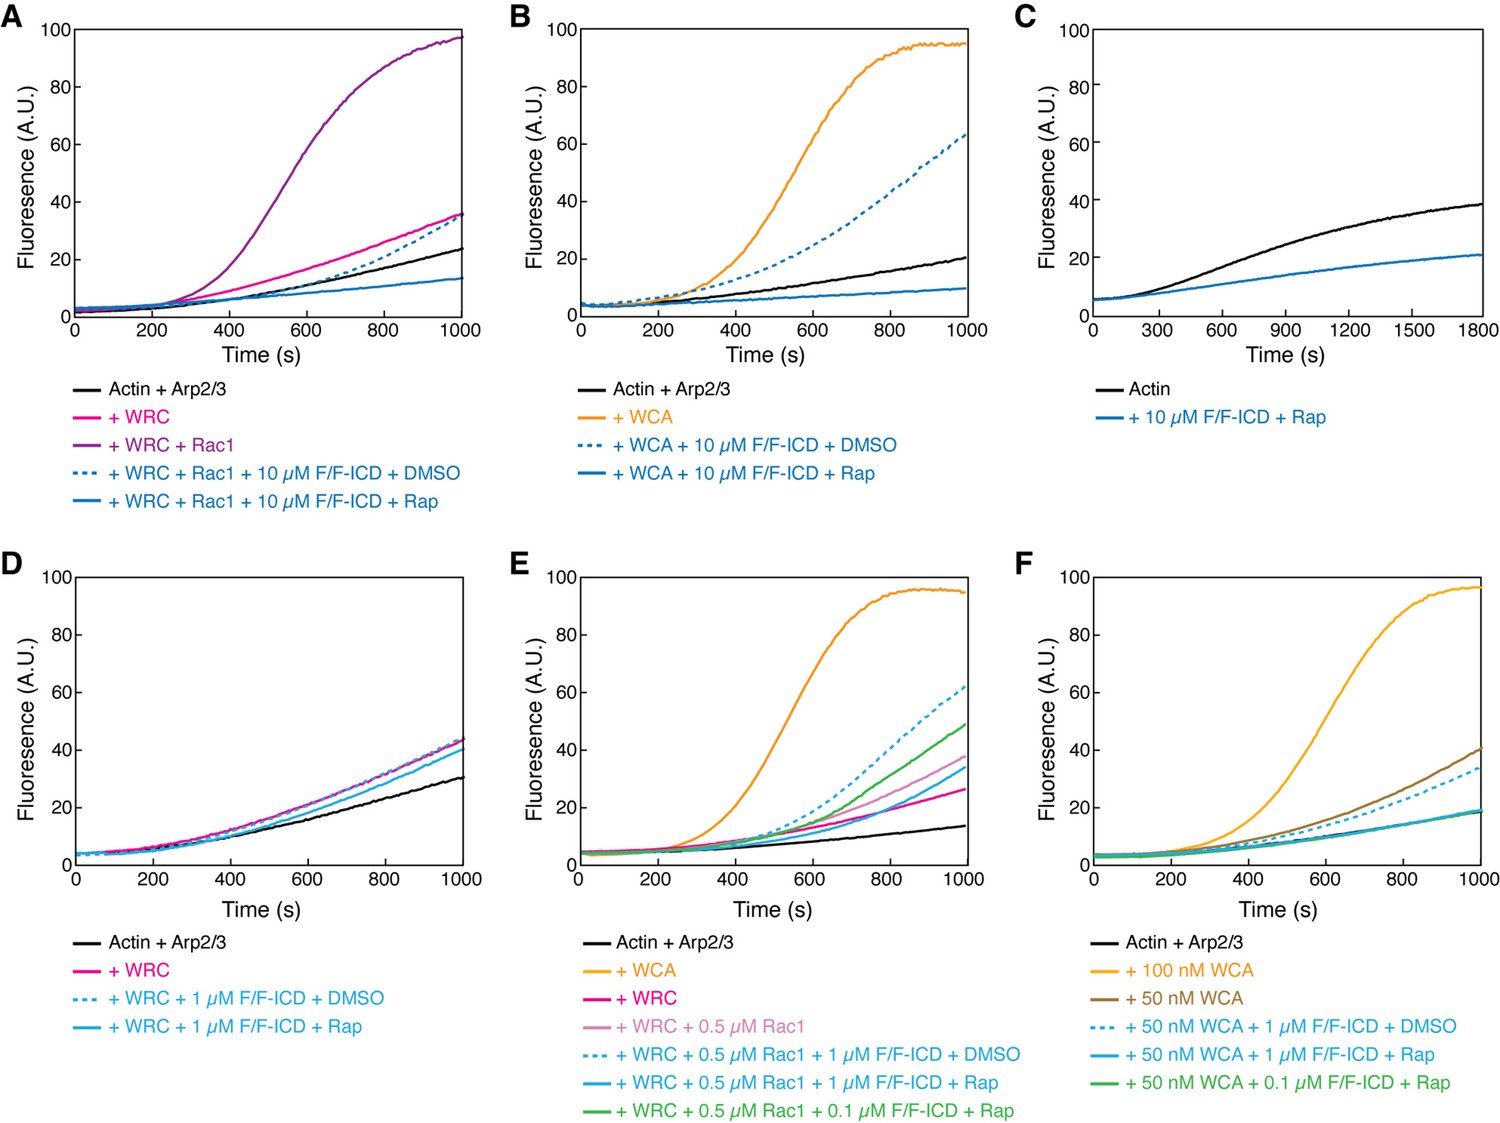
HPO-30 intracellular domain (ICD) inhibits actin polymerization but promotes Rac1-WAVE regulatory complex (WRC) activation.
(A–F) Pyrene-actin polymerization assays of indicated conditions. Reactions contain 2 µM actin (10% pyrene-labeled) (A–B, D–F), 10 nM Arp2/3 complex, 100 nM WRC230WCA or isolated WCA, Rac1QP, indicated concentrations of equimolar GB1-FKBP-ICD and GB1-FRB-ICD, and 5 µM rapamycin or equal volume of DMSO. (C) contains 4 µM actin (5% pyrene-labeled), indicated concentration of equimolar GB1-FKBP-ICD and GB1-FRB-ICD, and 5 µM rapamycin. The raw data used to generate these curves can be found in Figure 5—source data 1.
-
Figure 5—source data 1
This folder contains the unedited Figure 5 and the raw pyrene-actin polymerization data shown in Figure 5A–F.
- https://cdn.elifesciences.org/articles/88492/elife-88492-fig5-data1-v1.zip
Figure 5—figure supplement 1
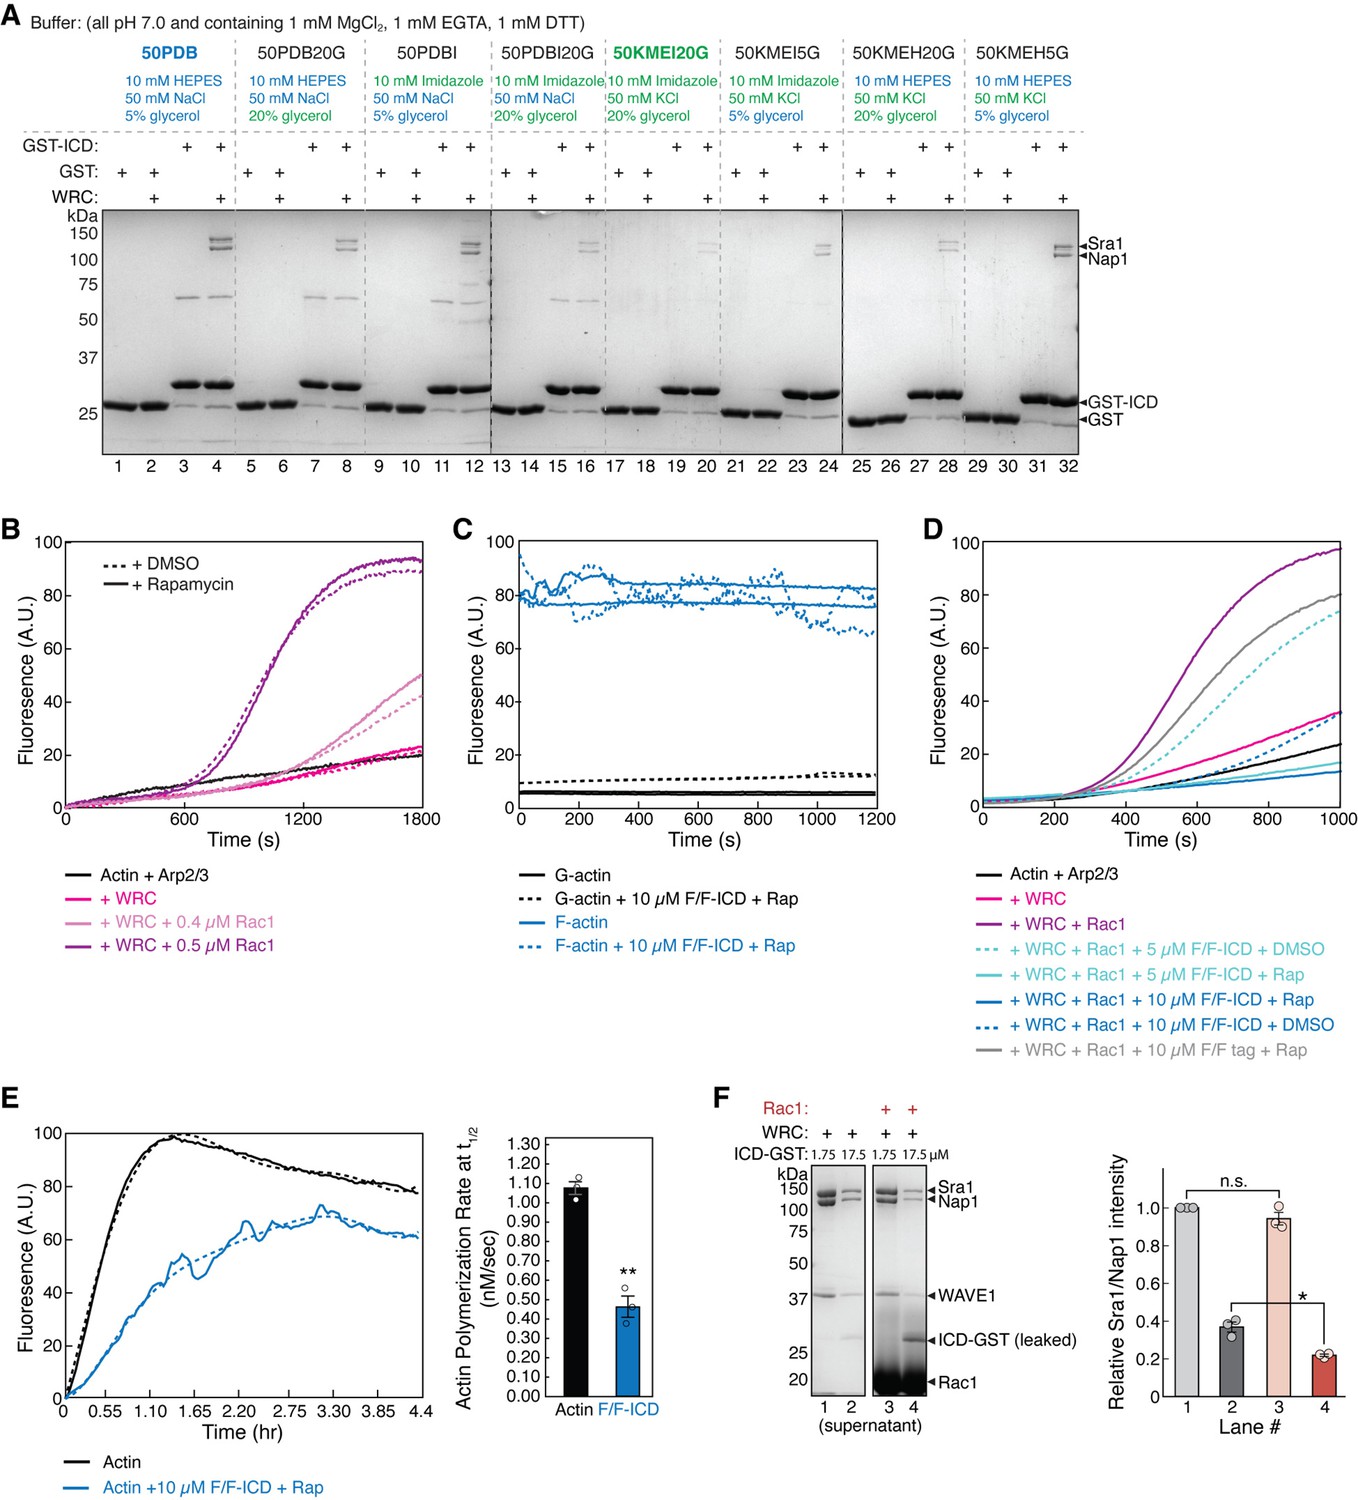
HPO-30 intracellular domain (ICD) inhibits actin polymerization.
(A) Coomassie blue-stained SDS-PAGE gels showing GST-ICD (200 pmol) pulling down WRC230∆WCA (150 pmol) in indicated buffer conditions, with 50 PDB being the buffer used in the majority of pull-down reactions herein and 50KMEI20G being the buffer commonly used in pyrene-actin polymerization assays in previous studies of the WAVE regulatory complex (WRC). All buffers contained 1 mM DTT and 0.05% Triton X-100. (B) Pyrene-actin polymerization assays showing rapamycin and DMSO did not affect WRC activity. Reactions contain 4 µM actin (5% pyrene-labeled), 10 nM Arp2/3 complex, 100 nM WRC230WCA, Rac1QP, and 5 µM rapamycin or equal volume of DMSO. (C) Fluorescence profiles of 4 µM actin (5% pyrene-labeled) in the monomeric or polymerized state, with and without dimerized GB1-FKBP-ICD/GB1-FRB-ICD. Reactions include 5 µM rapamycin. (D) Pyrene-actin polymerization assays of indicated conditions. Reactions contain 2 µM actin (10% pyrene-labeled), 10 nM Arp2/3 complex, 100 nM WRC230WCA, Rac1QP, indicated concentrations of equimolar GB1-FKBP-ICD and GB1-FRB-ICD, and 5 µM rapamycin or equal volume of DMSO. Note that part of these data are also shown Figure 5A. (E) Left: Long-term pyrene-actin polymerization assays, containing 4 µM actin (5% pyrene-labeled), indicated concentration of equimolar GB1-FKBP-ICD and GB1-FRB-ICD, and 5 µM rapamycin. Solid lines represent the actual data and dashed lines represent a fitted curve, using a sixth-order polynomial fit from Excel, in order to derive reaction rate. Right: Quantification of the actin polymerization rate from (E) at t1/2. Error bars represent standard error, ** p<.01 from Student’s paired t-test. n = 3. (F) Coomassie blue-stained SDS-PAGE gels (left) and quantification from three independent repeats (right) showing the equilibrium pull-down of WRC230WCA by two concentrations of ICD-GST in the presence or absence of 40 µM Rac1QP. Error bars represent standard error, *p<0.05, from Student’s paired t-test. n = 3. The raw gel images and unedited figure can be found in Figure 5—figure supplement 1—source data 1. The raw data used to generate the plots in (B, C, D, E, F, right) can be found in Figure 5—figure supplement 1—source data 2.
-
Figure 5—figure supplement 1—source data 1
This folder contains the unedited Figure 5—figure supplement 1 and raw gel images used in Figure 5—figure supplement 1.
- https://cdn.elifesciences.org/articles/88492/elife-88492-fig5-figsupp1-data1-v1.zip
-
Figure 5—figure supplement 1—source data 2
This folder contains the raw pyrene-actin polymerization data shown in Figure 5—figure supplement 1B–F and the gel quantification data shown in Figure 5—figure supplement 1F, right.
- https://cdn.elifesciences.org/articles/88492/elife-88492-fig5-figsupp1-data2-v1.zip
Figure 6 with 6 supplements
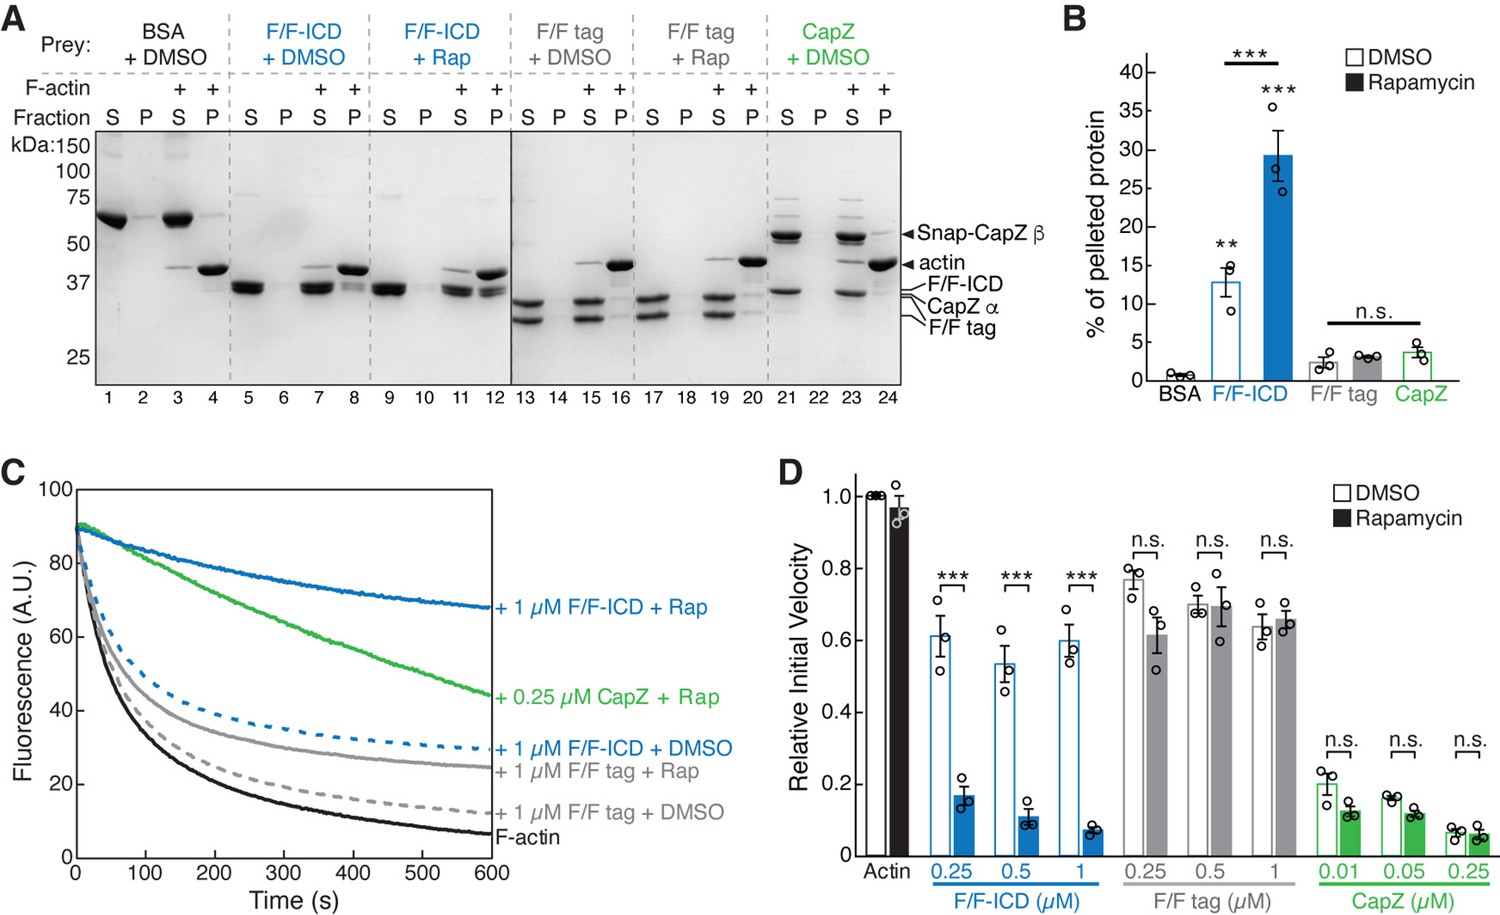
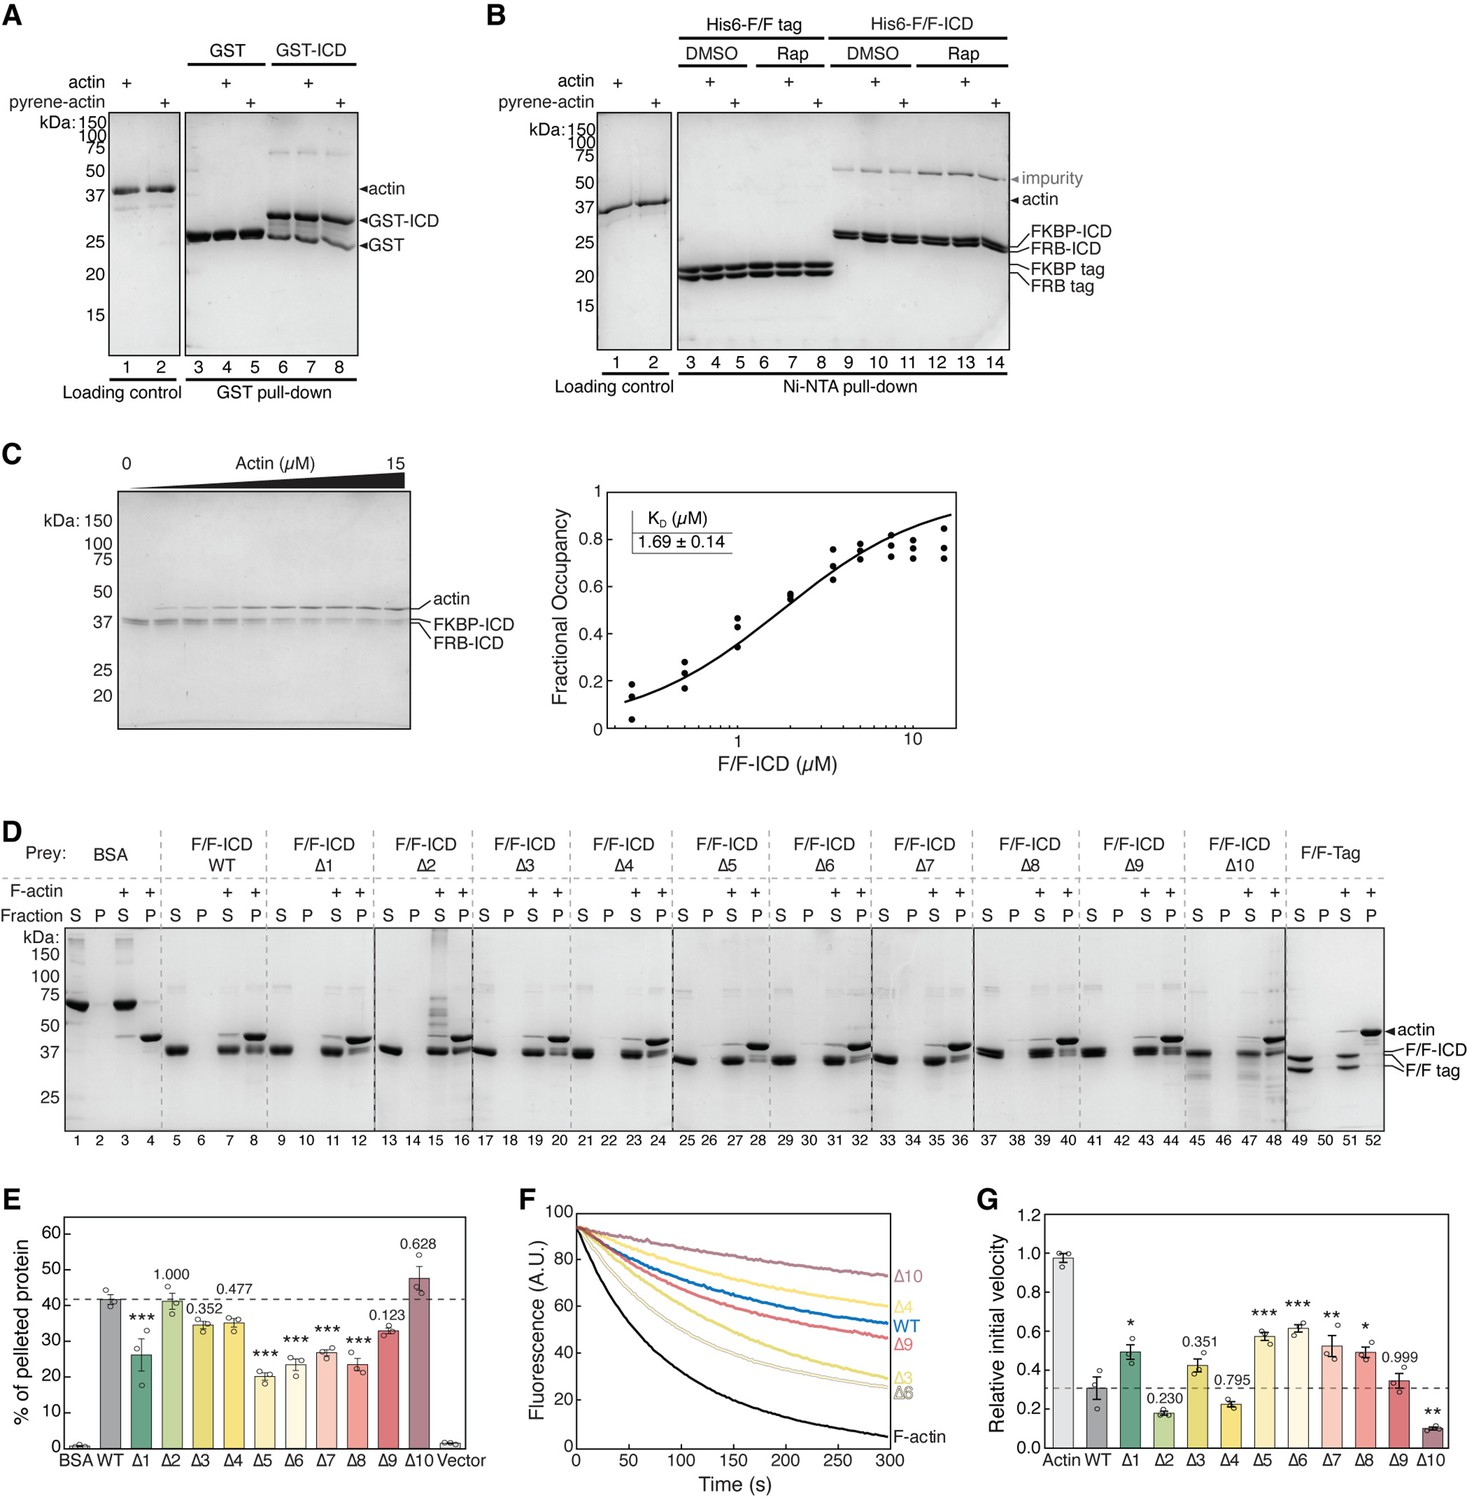
HPO-30 intracellular domain (ICD) binds to F-actin and inhibits actin depolymerization.
(A) Representative Coomassie blue-stained SDS-PAGE gels showing F-actin co-pelleting assays of indicated F/F-ICD and CapZ in the presence or absence of 5 µM rapamycin (or equal volume of DMSO). S: supernatant, P: pellet. (B) Quantification of (A) from three independent repeats, showing percentage of proteins in the pellet. Bars represent standard error, **p<0.005, ***p<0.001, ANOVA with Tukey test. n = 3. (C) Representative F-actin depolymerization assay fluorescence curves of indicated conditions. Each reaction contained 5 µM pre-polymerized actin (70% pyrene labeled), diluted 20-fold into depolymerization buffer containing indicated proteins in the presence or absence of 5 µM rapamycin (or equal volume of DMSO). (D) Quantification of the initial velocity of fluorescence curves shown in (C). Initial velocity was normalized to F-actin alone in the presence of DMSO. Error bars represent standard error, n=3 independent repeats, ***p<0.001, ANOVA with Tukey test. n = 3. The raw gel images and unedited figure can be found in Figure 6—source data 1. The raw data used to create (B, C, D) can be found in Figure 6—source data 2.
-
Figure 6—source data 1
This folder contains the unedited Figure 6 and raw gel images used in Figure 6.
- https://cdn.elifesciences.org/articles/88492/elife-88492-fig6-data1-v1.zip
-
Figure 6—source data 2
This folder contains the raw data and statistical analysis shown in Figure 6B, C, and D.
- https://cdn.elifesciences.org/articles/88492/elife-88492-fig6-data2-v1.zip
Figure 6—figure supplement 1
HPO-30 intracellular domain (ICD) binds to F-actin, but not G-actin, and inhibits F-actin depolymerization.
(A–B) Coomassie blue-stained SDS-PAGE gels showing GST-ICD (200 pmol) (A) or His6-F/F-ICD (300 pmol) (B) pulling down actin or pyrene-labeled actin (500 pmol) in G-buffer (2 mM Tris-HCl pH 8, 0.5 mM DTT, 0.2 mM ATP, 0.1 mM CaCl2, 1 mM NaN3), in the presence of 5 µM rapamycin (or equal volume of DMSO). (C) Representative Coomassie blue-stained SDS-PAGE gel (left) and quantification (right) of three independent actin pelleting assays to determine the dissociation constant of actin binding. Data were pooled from three independent repeats and fitted to a one-site binding model using DynaFit. n = 3. (D) Representative Coomassie blue-stained SDS-PAGE gels of actin pelleting assays using SNAP-FKBP-ICD and SNAP-FRB-ICD alanine scan mutants (as shown in Figure 1A) from three independent experiments. Both FKBP and FRB contained the same alanine scan mutation. (E) Quantification of (D) from three independent repeats, showing percentage of protein in the pellet. Bars represent standard error, ***p<0.001, ANOVA with Tukey test. n = 3. (F) Representative F-actin depolymerization assay fluorescence curves of indicated conditions from three independent experiments. Each reaction contained 5 µM pre-polymerized actin (70% pyrene labeled), diluted 20-fold into depolymerization buffer containing 200 nM of the indicated proteins in the presence of 5 µM rapamycin. Assays were performed using all 10 SNAP-FKBP-ICD and SNAP-FRB-ICD alanine scan mutants (as shown in Figure 1A). Only several selected curves are shown here for clarity. Both FKBP and FRB contained the same alanine scan mutation. (G) Quantification of the initial velocity of F-actin depolymerization assays. Initial velocity was normalized to F-actin alone in the presence of rapamycin. Error bars represent standard error, n=3 independent repeats, *p<0.05, **p<0.005, ***p<0.001, ANOVA with Tukey test. n = 3. The raw gel images and unedited figure can be found in Figure 6—figure supplement 1—source data 1. The raw data used to create (C, right, E, F, G) can be found in Figure 6—figure supplement 1—source data 2.
-
Figure 6—figure supplement 1—source data 1
This folder contains the unedited Figure 6—figure supplement 1 and raw gel images used in Figure 6—figure supplement 1.
- https://cdn.elifesciences.org/articles/88492/elife-88492-fig6-figsupp1-data1-v1.zip
-
Figure 6—figure supplement 1—source data 2
This folder contains the raw data and statistical analysis shown in Figure 6—figure supplement 1C, E, F, G.
- https://cdn.elifesciences.org/articles/88492/elife-88492-fig6-figsupp1-data2-v1.zip
Figure 6—video 1
CapZ capping event example 1.
Related to Figure 6A, top. Time lapse of SNAPAF488-CapZ (green) bound to the end of actin filaments (red) obtained by single-molecule total internal reflection fluorescence (smTIRF) microscopy. Video length of 1200 frames at 120 frames per second. The filament in the top left corner is the one showcased in Figure 6A, top.
Figure 6—video 2
CapZ capping event example 2.
Related to Figure 6A, top. Time lapse of SNAPAF488-CapZ (green) bound to the end of an actin filament (red) obtained by single-molecule total internal reflection fluorescence (smTIRF) microscopy. Video length of 1800 frames at 120 frames per second.
Figure 6—video 3
HPO-30 intracellular domain (ICD) side binding event example 1.
Related to Figure 6A, bottom. SNAPAF546-F/F-ICD (cyan) bound to the side of an actin filament (red) obtained by single-molecule total internal reflection fluorescence (smTIRF) microscopy. Video length of 1000 frames at 100 frames per second.
Figure 6—video 4
HPO-30 intracellular domain (ICD) side binding event example 2.
Related to Figure 6A, bottom. SNAPAF546-F/F-ICD (cyan) bound to the side of an actin filament (red) obtained by single-molecule total internal reflection fluorescence (smTIRF) microscopy. Video length of 350 frames at 35 frames per second.
Figure 6—video 5
Actin elongation rate comparison.
Related to Figure 6C. Representative single-molecule total internal reflection fluorescence (smTIRF) time lapses used to quantify the elongation rate of actin filaments. Video shows a random selection of actin filaments from each condition tested. Video length of 15 min and 181 frames was compressed to 9 s.
Figure 7 with 2 supplements
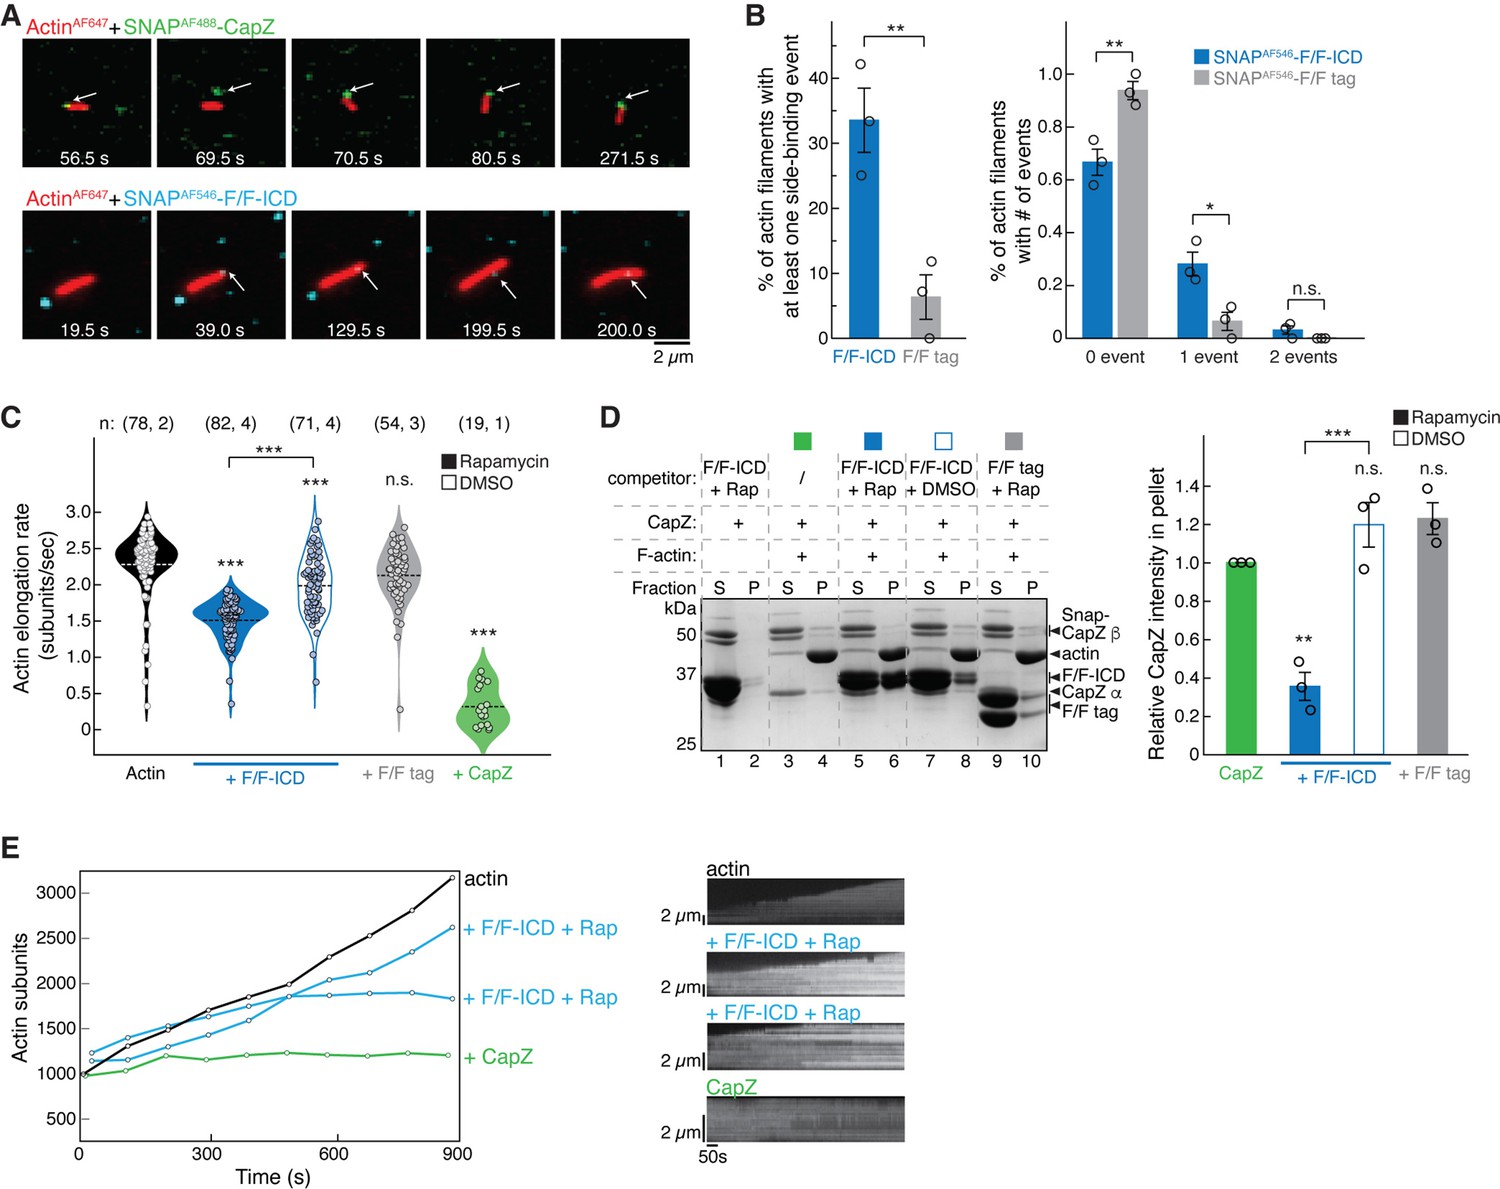
HPO-30 intracellular domain (ICD) binds both the side and barbed end of actin filaments and slows polymerization.
(A) Examples of time lapse images from single-molecule total internal reflection fluorescence (smTIRF) experiments. Top: A capping event of SNAPAF488-CapZ (green, 5 nM) and actinAF647 (red). Bottom: A side binding event of SNAPAF546-F/F-ICD (cyan, 15 nM) and actinAF647 (red). Note that in smTIRF time lapses, sometimes a lag was observed between signals at the two channels. For example, in the top row, the filament and SNAPAF488-CapZ puncta were displaced at 69.5 s, but aligned again at 70.5 s. The lagging was due to image acquisition conditions, where, to prevent photobleaching of AF647, images in the 640 nm channel for actinAF647 were taken every 20 acquisitions of the 488 nm channel for SNAPAF488-CapZ (see Materials and methods). (B) Quantification of the frequency of side binding events from smTIRF imaging. Left: Comparison of overall side binding events. Right: Comparison of the percentage of filaments with 0, 1, and 2 events. Data were from three independent repeats, at least 15 filaments per video. Bars represent standard error. *p<0.05, **p<0.01, Student’s paired t-test. n = 3. (C) Violin plot of the elongation rate of actin filaments measured by smTIRF imaging. Total number of filaments pooled from the number of independent repeats for each sample are indicated in the paratheses on top of each column, respectively. ***p<0.001, ANOVA with Tukey test. (D) Representative Coomassie blue-stained SDS-PAGE gel (left) and quantification of pelleted CapZ from three independent repeats (right) showing F-actin (2 µM) co-pelleting with CapZ (0.6 µM), with the indicated F/F-ICD or F/F tag as a competitor (5 µM) in the presence or absence of 5 µM rapamycin (or equivalent volume DMSO). S: supernatant, P: pellet. Bars represent standard error, **p<0.01, ***p<0.001, ANOVA with Tukey test. n = 3. (E) Left: Representative traces of actin filament length determined manually from individual frames. Filaments were chosen that were the closest to the average rate of elongation, with one additional filament for the ICD reactions with a reduced elongation rate. Right: Kymographs of the filaments displayed on the left. The unedited figure and raw gel images can be found in Figure 7—source data 1, the raw data used to create (B, C, D, right, E, left) can be found in Figure 7—source data 2, and the kymographs can be found in Figure 7—source data 3.
-
Figure 7—source data 1
This folder contains the unedited Figure 7 and raw gel images used in Figure 7.
- https://cdn.elifesciences.org/articles/88492/elife-88492-fig7-data1-v1.zip
-
Figure 7—source data 2
This folder contains the raw data and statistical analysis shown in Figure 7B–E.
- https://cdn.elifesciences.org/articles/88492/elife-88492-fig7-data2-v1.zip
-
Figure 7—source data 3
This folder contains the kymographs for Figure 7E.
- https://cdn.elifesciences.org/articles/88492/elife-88492-fig7-data3-v1.zip
Figure 7—figure supplement 1
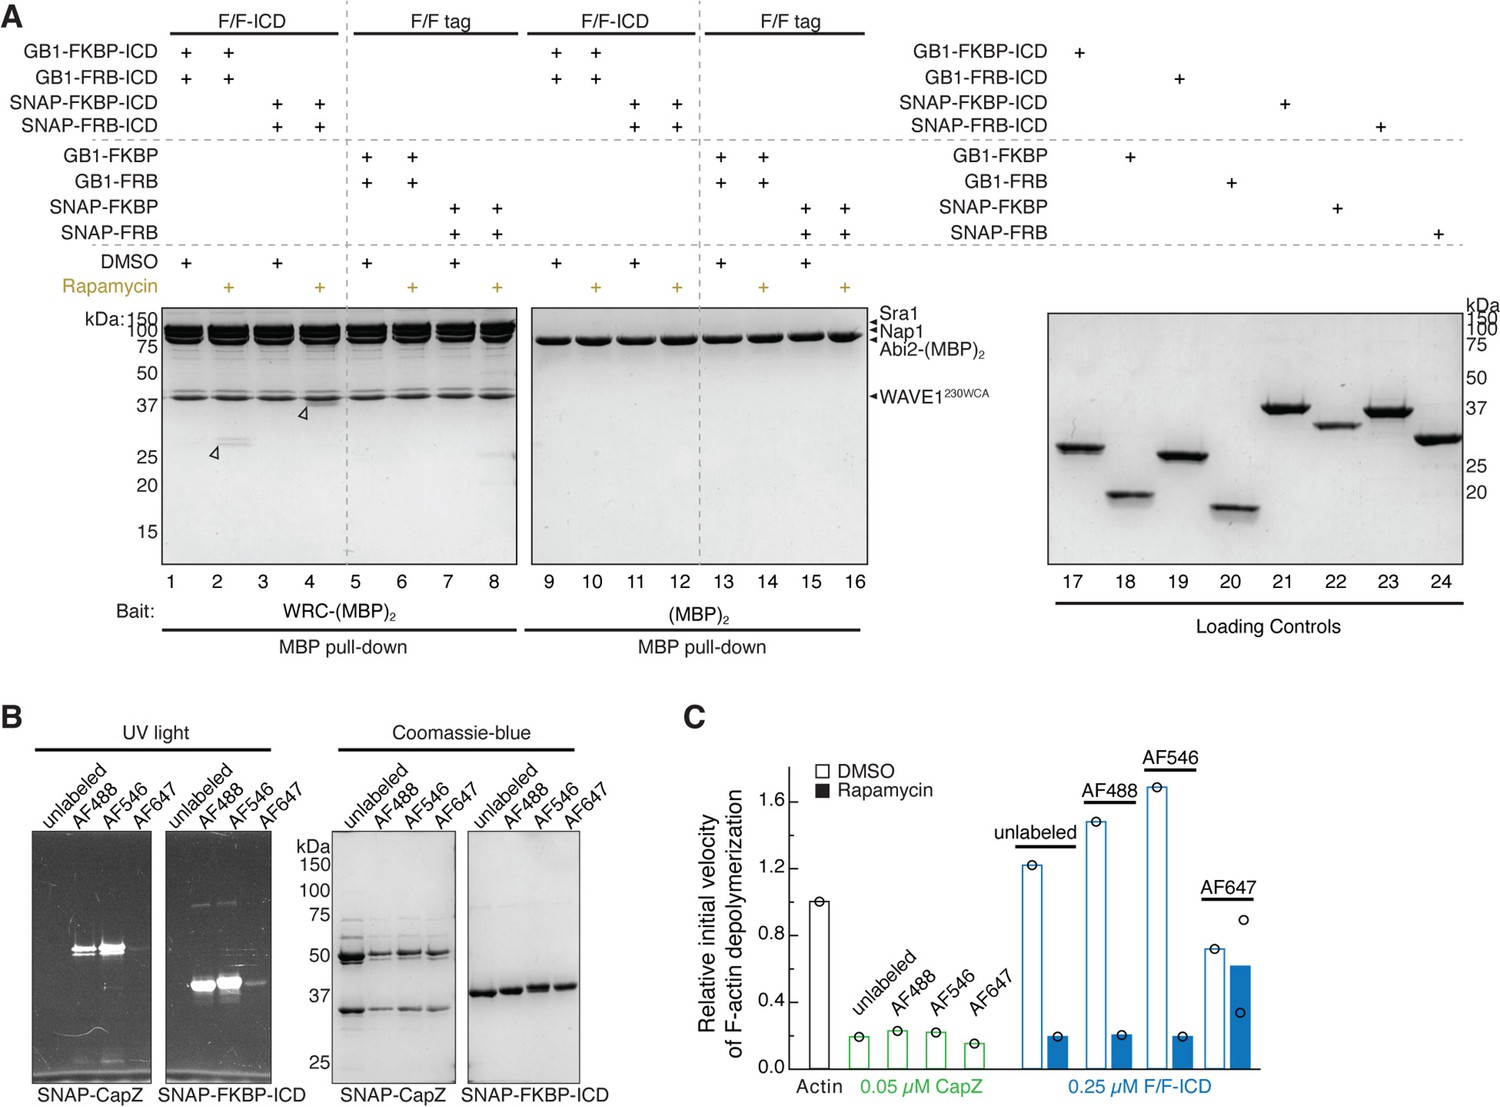
SNAP tag and fluorophore labeling did not affect HPO-30 intracellular domain (ICD) function.
(A) Coomassie blue-stained SDS-PAGE gel showing WRC:Abi2-(MBP)2 (60 pmol) pulling down GB1-tagged vs. SNAP-tagged HPO-30 ICD (600 pmol) in the presence or absence of 5 µM rapamycin. (B) SDS-PAGE gels of SNAP-tag labeling of CapZ, FKBP-ICD, and FKBP tag with indicated SNAP-Surface Alexa Fluor dyes. Left: UV light with Alexa 488 filter. Right: Coomassie blue stain. (C) Relative initial velocities from actin depolymerization assays of SNAP-Alexa-labeled proteins, in conditions identical to Figure 6C and D. The unedited figure and raw gel images can be found in Figure 7—figure supplement 1—source data 1. The raw data used to create (C) can be found in Figure 7—figure supplement 1—source data 2.
-
Figure 7—figure supplement 1—source data 1
This folder contains the unedited Figure 7—figure supplement 1 and raw gel images used in Figure 7—figure supplement 1.
- https://cdn.elifesciences.org/articles/88492/elife-88492-fig7-figsupp1-data1-v1.zip
-
Figure 7—figure supplement 1—source data 2
This folder contains the raw data shown in Figure 7—figure supplement 1C.
- https://cdn.elifesciences.org/articles/88492/elife-88492-fig7-figsupp1-data2-v1.zip
Figure 7—figure supplement 2
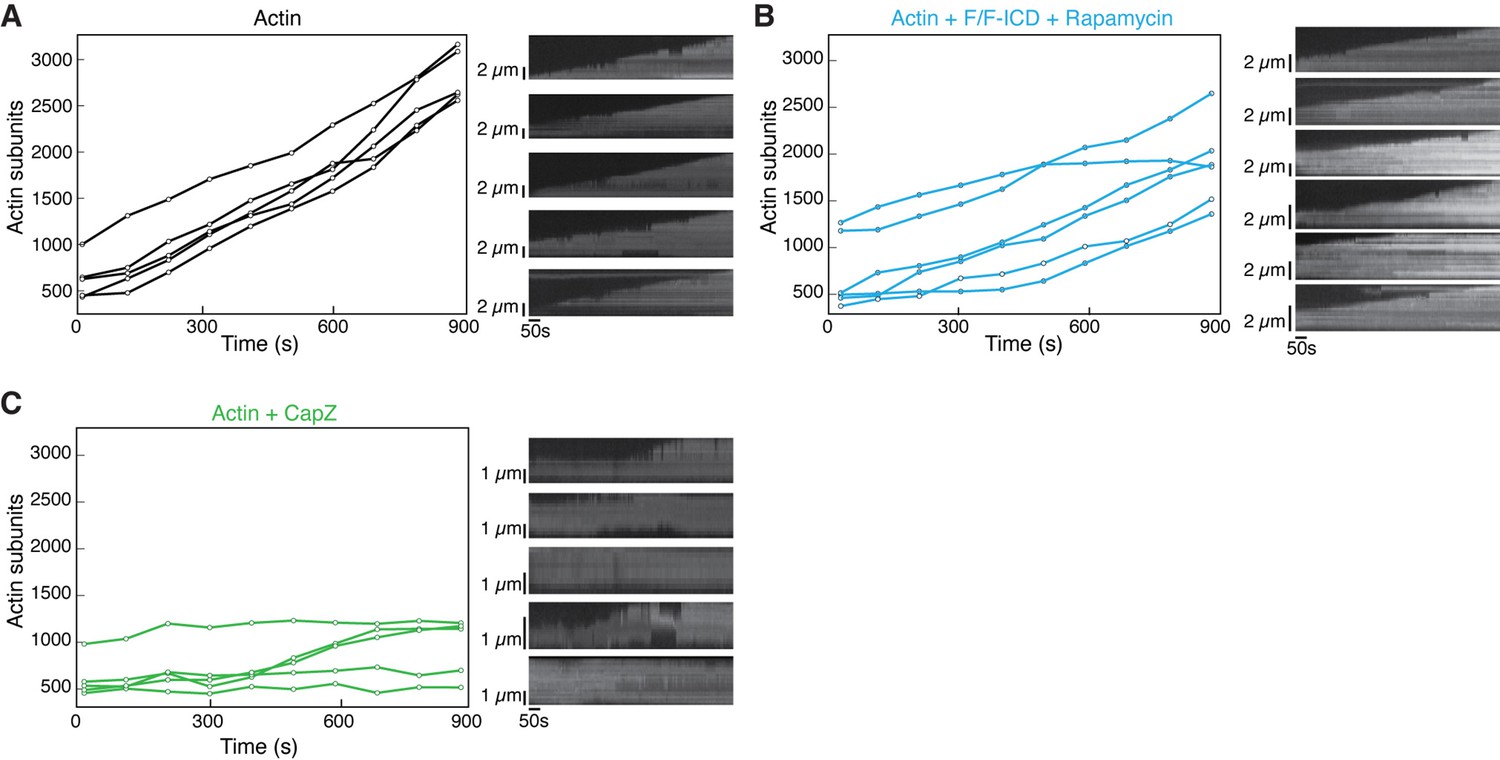
HPO-30 intracellular domain (ICD) affects actin polymerization rate.
(A–C) Left: Representative traces of actin filament length determined manually from individual frames. Displayed are filaments that were the closest to the average rate of elongation. Right: Kymographs of the filaments displayed on the left. The source data for (A, B, C, left) can be found in Figure 7—figure supplement 2—source data 1. The kymographs can be found in Figure 7—figure supplement 2—source data 2.
-
Figure 7—figure supplement 2—source data 1
This folder contains the raw data shown in Figure 7—figure supplement 2.
- https://cdn.elifesciences.org/articles/88492/elife-88492-fig7-figsupp2-data1-v1.zip
-
Figure 7—figure supplement 2—source data 2
This folder contains the kymographs shown in Figure 7—figure supplement 2.
- https://cdn.elifesciences.org/articles/88492/elife-88492-fig7-figsupp2-data2-v1.zip
Figure 8
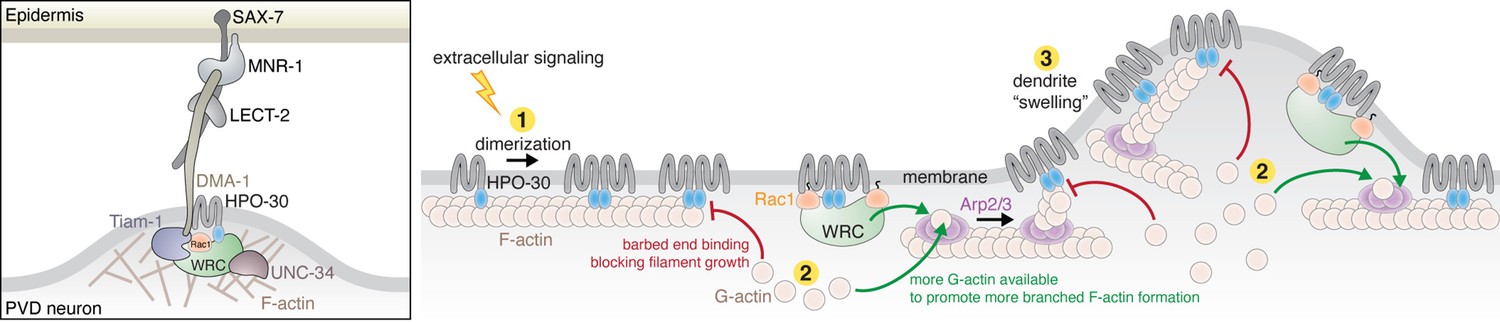
HPO-30 intracellular domain (ICD) integrates two distinct mechanisms to regulate actin dynamics during dendrite branching.
Left: In C. elegans PVD neurons, a variety of molecules work together with the HPO-30/DMA-1 co-receptor to link extracellular signals to the intracellular actin network critical for driving dendrite branching. Right: Model of how HPO-30 ICD modulates actin dynamics. In (1), HPO-30 on the dendrite membrane undergoes dimerization (or oligomerization). Both monomeric and dimeric forms of HPO-30 ICD can bind to the side of actin filaments, but only the dimeric ICD can bind to the fast-growing barbed end. In (2), dimeric ICD binding to the barbed end acts as a capping protein, which stops long filament growth and helps reserve G-actin for the Arp2/3 complex to produce short, branched actin filaments. In (2), dimeric ICD can also interact with the WAVE regulatory complex (WRC). This recruits the WRC to the membrane and simultaneously promotes WRC activation by Rac1, which in turn stimulates Arp2/3 to produce branched actin filaments. In (3), the dual actions of HPO-30 ICD facilitate the formation of branched actin networks, which can help generate the ‘swelling’ of dendrite observed in previous studies (Shi et al., 2021), an important indicator of the outgrowth of a new dendrite branch.
Additional files
-
Supplementary file 1
Amino acid sequences of recombinant proteins used in this study.
- https://cdn.elifesciences.org/articles/88492/elife-88492-supp1-v1.docx
-
MDAR checklist
- https://cdn.elifesciences.org/articles/88492/elife-88492-mdarchecklist1-v1.docx
Download links
A two-part list of links to download the article, or parts of the article, in various formats.
Downloads (link to download the article as PDF)
Open citations (links to open the citations from this article in various online reference manager services)
Cite this article (links to download the citations from this article in formats compatible with various reference manager tools)
The intrinsically disordered cytoplasmic tail of a dendrite branching receptor uses two distinct mechanisms to regulate the actin cytoskeleton
eLife 12:e88492.
https://doi.org/10.7554/eLife.88492


