Metabolic and neurobehavioral disturbances induced by purine recycling deficiency in Drosophila
- Genes Circuits Rhythms and Neuropathology, Brain Plasticity Unit, CNRS, ESPCI Paris, PSL Research University, France
- Metabolomic and Proteomic Biochemistry Laboratory, Necker-Enfants Malades Hospital and Paris Cité University, France
- Integrated Physiology of the Brain Arousal Systems (WAKING), Lyon Neuroscience Research Centre, INSERM/CNRS/UCBL1, France
- Dipartimento di Scienze Agroalimentari, Ambientali e Animali, University of Udine, Italy
- UMR “Ecology and Dynamics of Anthropogenic Systems” (EDYSAN), CNRS, Université de Picardie Jules Verne, France
- Laboratory of Metabolic Diseases, Cliniques Universitaires Saint-Luc, Université catholique de Louvain, Belgium
Figures
Figure 1 with 6 supplements
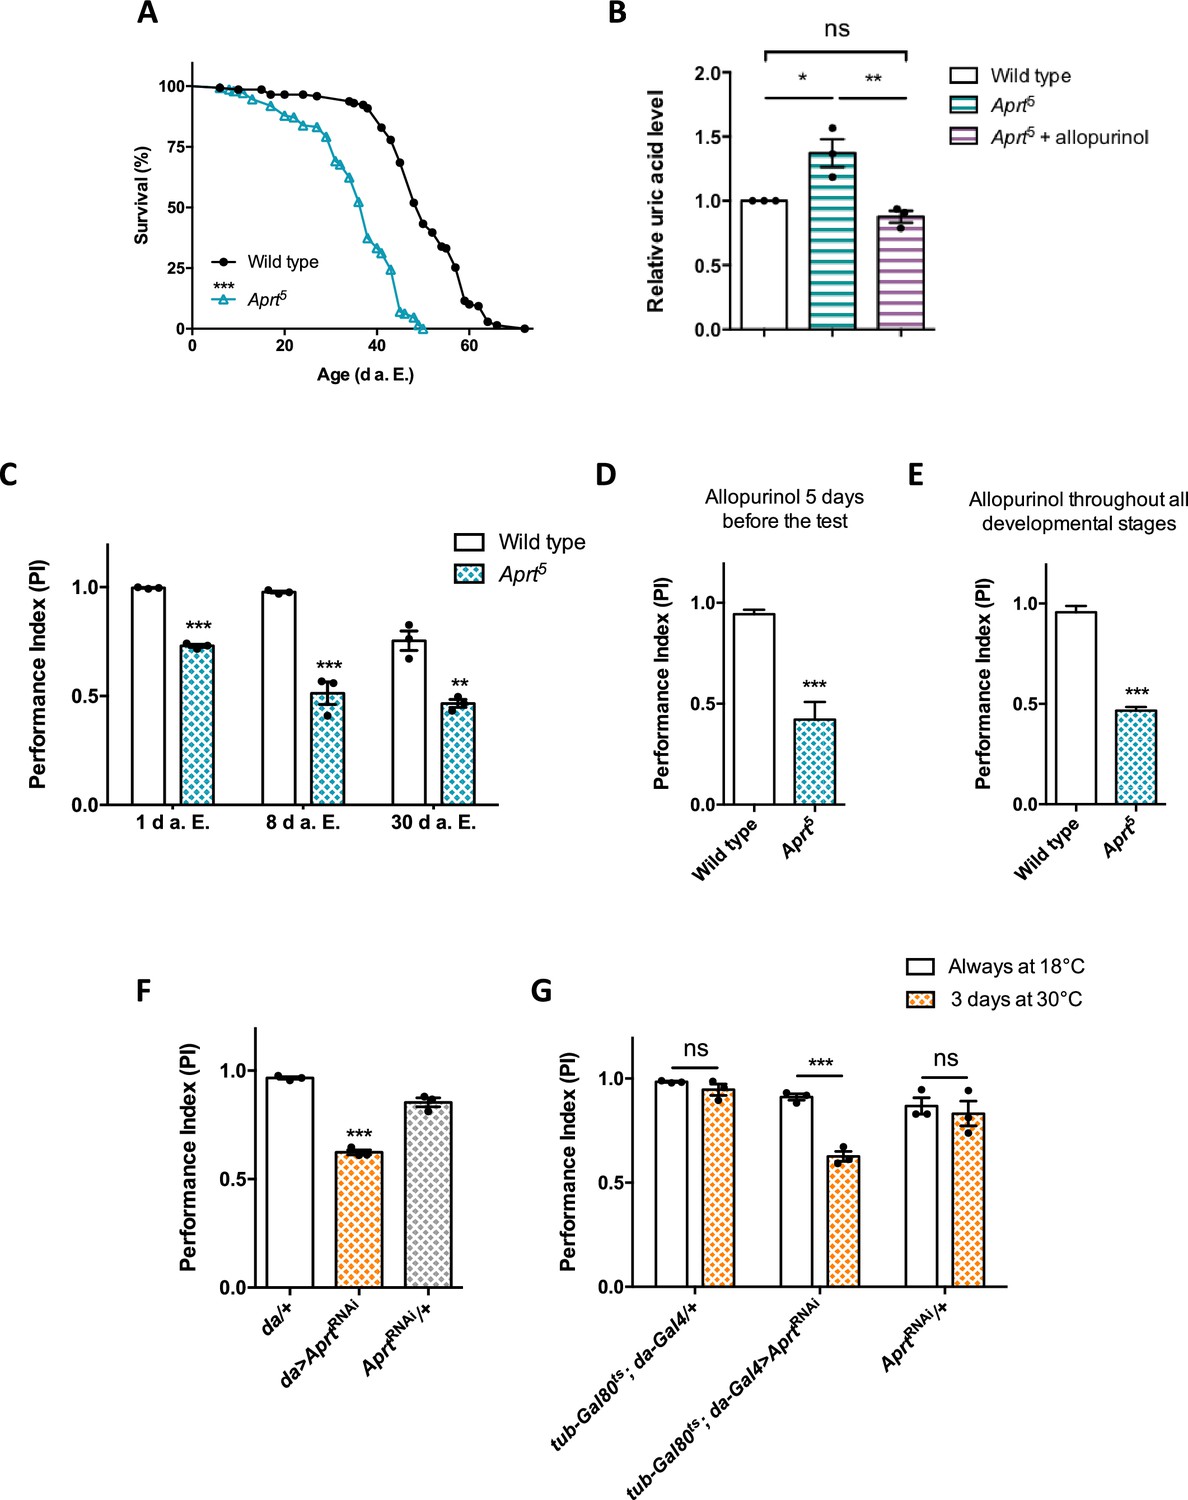
Aprt deficiency shortens lifespan and induces metabolic and neurobehavioral defects.
(A) Aprt5 mutant flies have a reduced lifespan compared to wild-type flies (median lifespan: 38 and 50 d, respectively). Three independent experiments were performed on 150 males per genotype with similar results and a representative experiment is shown. Log-rank test (***p<0.001). (B) HPLC profiles on head extracts revealed an increase in uric acid levels in Aprt5 mutant flies. Administration of 100 μg/ml allopurinol for 5 d before the test rescued uric acid levels. Mean of three independent experiments performed on 40 flies per genotype. One-way ANOVA with Tukey’s post hoc test for multiple comparisons (*p<0.05; **p<0.01; ns: not significant). (C–E) Effect on climbing ability. (C) Aprt5 mutants shows early defects in the startle-induced negative geotaxis (SING) paradigm that monitors locomotor reactivity and climbing performance. This deficit was already obvious at 1 day after eclosion (d a.E.) and further decreased up to 8 d a.E., after which it did not change significantly up to 30 d a.E. Mean of three independent experiments performed on 50 flies per genotype. Unpaired Student’s t-test (**p<0.01; ***p<0.001). (D, E) Administration of allopurinol does not rescue the motricity defects of Aprt-deficient mutants. Feeding the Aprt5 mutants with allopurinol (100 μg/ml) either in adults 5 d before the test (D) or throughout all developmental stages (E) did not alter the defects observed in SING behavior. Results of one experiment performed on 50 flies per genotype at 10 d a. E. Unpaired Student’s t-test (***p<0.001). (F) Downregulating Aprt by RNAi in all cells (da>AprtRNAi) also led to an early impairment in climbing responses in the SING assay at 10 d a.E. compared to the driver (da/+) and effector (AprtRNAi/+) only controls. Mean of three independent experiments performed on 50 flies per genotype. One-way ANOVA with Tukey’s post hoc test for multiple comparisons (***p<0.001). (G) Adult-specific inactivation of Aprt (tub-Gal80ts; da-Gal4>AprtRNAi) decreased startle-induced climbing abilities in the SING paradigm, suggesting that the locomotor impairment induced by Aprt deficiency is not caused by a developmental effect. Flies were raised at permissive temperature (18°C) in which Gal80ts suppressed Gal4-controlled AprtRNAi expression and were shifted from 18 to 30°C for 3 d before the test (between 7 and 10 d a.E.) to activate transgene expression. Mean of three independent experiments performed on 50 flies per genotype. Two-way ANOVA with Sidak’s post hoc test for multiple comparisons (***p<0.001; ns: not significant).
-
Figure 1—source data 1
Source data for Figure 1A–G.
- https://cdn.elifesciences.org/articles/88510/elife-88510-fig1-data1-v1.xlsx
Figure 1—figure supplement 1

Comparison of purine metabolism pathways in Drosophila and humans.
(A) Schematic diagram of the purine biosynthesis and degradation pathways in Drosophila melanogaster, based on sequence homology with the human genes. (B) Percent sequence similarity between human and Drosophila homologs of purine metabolism enzymes. Note the lack of urate oxidase (UO, step 20) in humans due to a primate-specific loss of this gene, and the fact that Drosophila does not have a homolog of human HGPRT (step 13). However, the APRT enzyme has been conserved (step 12), suggesting that it is the only recycling enzyme of the purine salvage pathway in Drosophila.
Figure 1—figure supplement 2
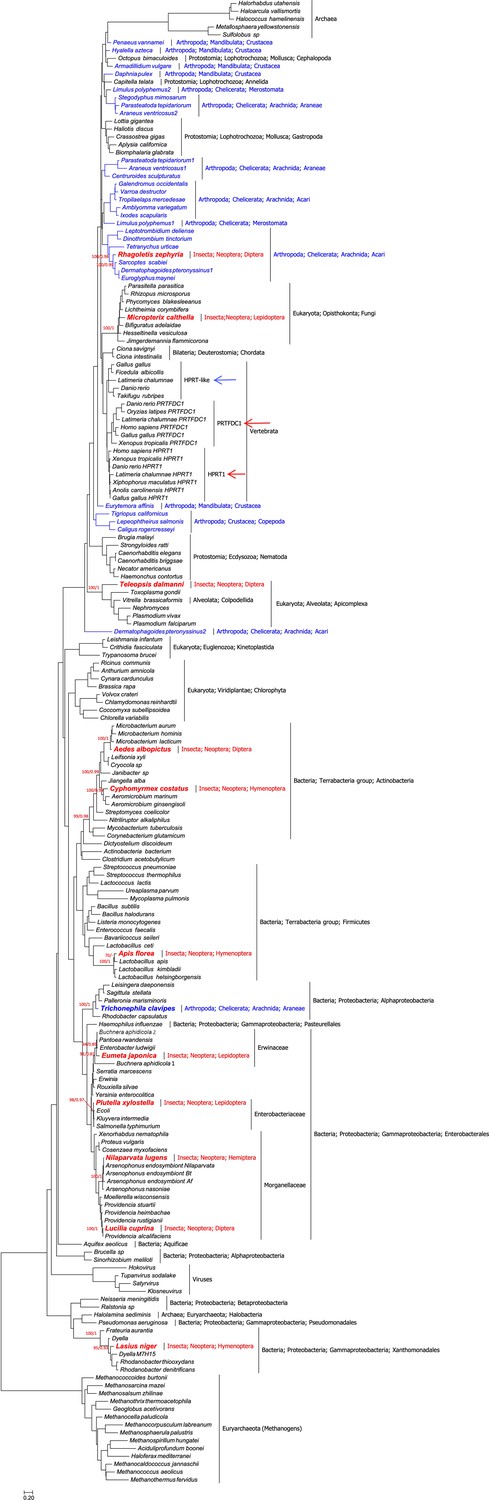
Urooted maximum likelihood phylogeny of hypoxanthine-guanine phosphoribosyltransferase (HGPRT) proteins (189 taxa, 130 sites).
Phylogenetic analyses show that (a) HGPRT proteins are ancient,as they are present in bacteria and archaea. (b) Two paralogs (HPRT1 and PRTFDC1) are found in human and vertebrates (red arrows). An additional protein (HGPRT-like) is found in other vertebrates (blue arrow). (c) Of special interest for our study is that HGPRT proteins are very rare in Insects and, in particular, are absent in Drosophilidae, with one possible exception (see main text and Figure 1—figure supplement 3). Indeed, this preliminary phylogenetic analysis shows that insect HGPRT proteins cluster mainly with bacteria (but also with fungi, apicomplexa, and acari). This strongly suggests that all the 11 HGPRT proteins found to date in Insecta (in bold red font) were very likely acquired by horizontal gene transfer. (d) The potential horizontal gene transfer event in the spider Trichonephila clavipes, which clusters with Alphaprotoebacteria, is highlighted in bold blue font. All other arthropod sequences are shown in blue font. Branch-support values, only given at relevant nodes, are UFBoot/Bayesian Posterior Probabilities. The scalebar indicates the estimated number of substitutions per site.
Figure 1—figure supplement 3

Urooted maximum likelihood phylogeny of HPRT proteins (20 taxa, 177 sites).
The dataset comprises 17 relevant taxa used in Figure 1—figure supplement 2, together with the HGPRT proteins of Drosophila immigrans, Serratia ureilytica, and Serratia entomophila. The D. immigrans sequence (red underline) clusters with the gammaproteobacterial genus Serratia. This can be interpreted either as a contamination of the sequenced sample (D. immigrans and S. marcescens proteins are 100% identical) or a very recent horizontal gene transfer event. The potential horizontal gene transfer events in Plutella xylostella and Eumata japonica (also shown in Figure 1—figure supplement 2) are also highlighted (red underline) as well as that of the arachnid Trichonephila clavipes (blue underline). Branch-support values are aLRT (SH-like). The scalebar indicates the estimated number of substitutions per site.
Figure 1—figure supplement 4

Lack of Aprt enzymatic activity in the Aprt5 mutant.
Aprt activity was assayed on whole adult fly extracts, showing that it is strongly reduced in heterozygous Aprt5/+ mutants, and absent in homozygous Aprt5 flies, compared to the wild-type. The fact that it is decreased more than twofold in heterozygous flies may suggest a dominant negative effect of the mutation. Two independent determinations were performed on 20 whole flies per genotype. One-way ANOVA with Dunnett’s post hoc test for multiple comparisons (***p<0.001).
-
Figure 1—figure supplement 4—source data 1
Source data for Figure 1—figure supplement 4.
- https://cdn.elifesciences.org/articles/88510/elife-88510-fig1-figsupp4-data1-v1.xlsx
Figure 1—figure supplement 5
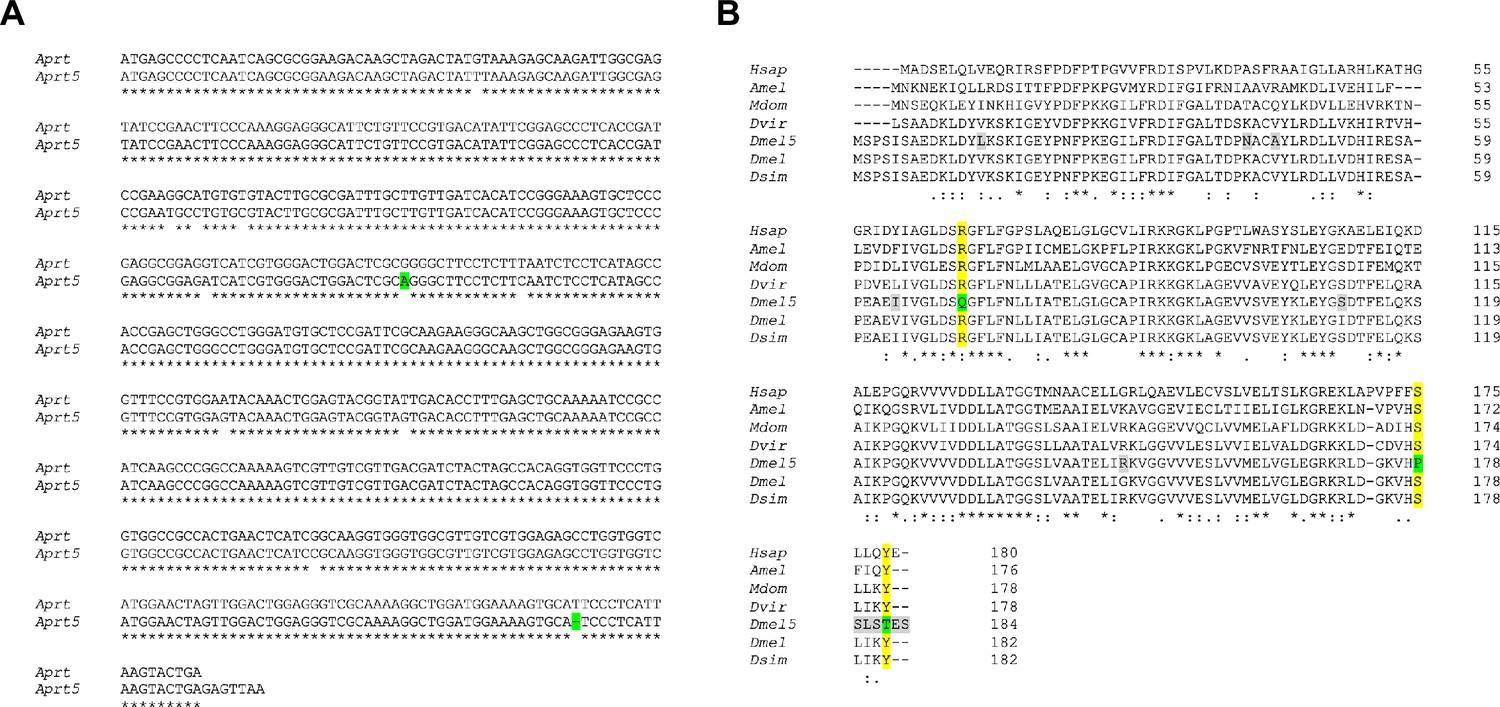
Alignment of wild-type and mutant Aprt cDNAs and predicted protein sequences.
(A) Nucleotide sequence alignment of the coding regions in Drosophila Aprt and Aprt5 cDNAs. A base substitution and a deletion that are responsible for the three prominent mutations in the Aprt5 protein (see in B) are highlighted in green.(B) Alignment of human and insect Aprt proteins. The residues modified in Drosophila Aprt5 (Dmel5) compared to Drosophila wild-type Aprt (Dmel) are highlighted in gray when they correspond to a variable residue in different sequences, and in green when they alter amino acid residues that were highly conserved throughout evolution. The R71Q, S178P, and Y182T mutations change three residues (highlighted in yellow) that were conserved in Aprt sequences from Drosophila to humans. These mutations are therefore likely to be responsible for the loss of enzymatic activity in Aprt5. Hsap: Homo sapiens; Amel: Apis mellifica; Mdom: Musca domestica; Dvir: Drosophila virilis; Dmel5: Drosophila melanogaster Aprt5; Dmel: Drosophila melanogaster wild-type Aprt; Dsim: Drosophila simulans. The nucleotide and amino acid sequences were retrieved from FlyBase and GenBank, except for Drosophila mutant Aprt5, which was sequenced in this work. The alignments were performed using MUSCLE (https://www.ebi.ac.uk/Tools/msa/muscle/) and Clustal Omega (https://www.ebi.ac.uk/Tools/msa/clustalo/) multiple sequence alignment tools.
Figure 1—figure supplement 6

Startle-induced negative geotaxis (SING) behavior of hemizygous Aprt mutant flies.
Df(3L)ED4284 and Df(3L)BSC365 are deficiencies located in 62B4-B12 and 62B7-D3, respectively, that removes Aprt and several neighbor genes. Hemizygous Aprt5 flies, in which the mutation was placed over these deficiencies, showed an early locomotor decline in the SING assay at 10 d a.E., similarly to homozygous Aprt5 flies. Results of 3–4 independent experiments performed on 50 flies per genotype. One-way ANOVA with Dunnett’s post hoc test for multiple comparisons (**p<0.01).
-
Figure 1—figure supplement 6—source data 1
Source data for Figure 1—figure supplement 6.
- https://cdn.elifesciences.org/articles/88510/elife-88510-fig1-figsupp6-data1-v1.xlsx
Figure 2 with 2 supplements
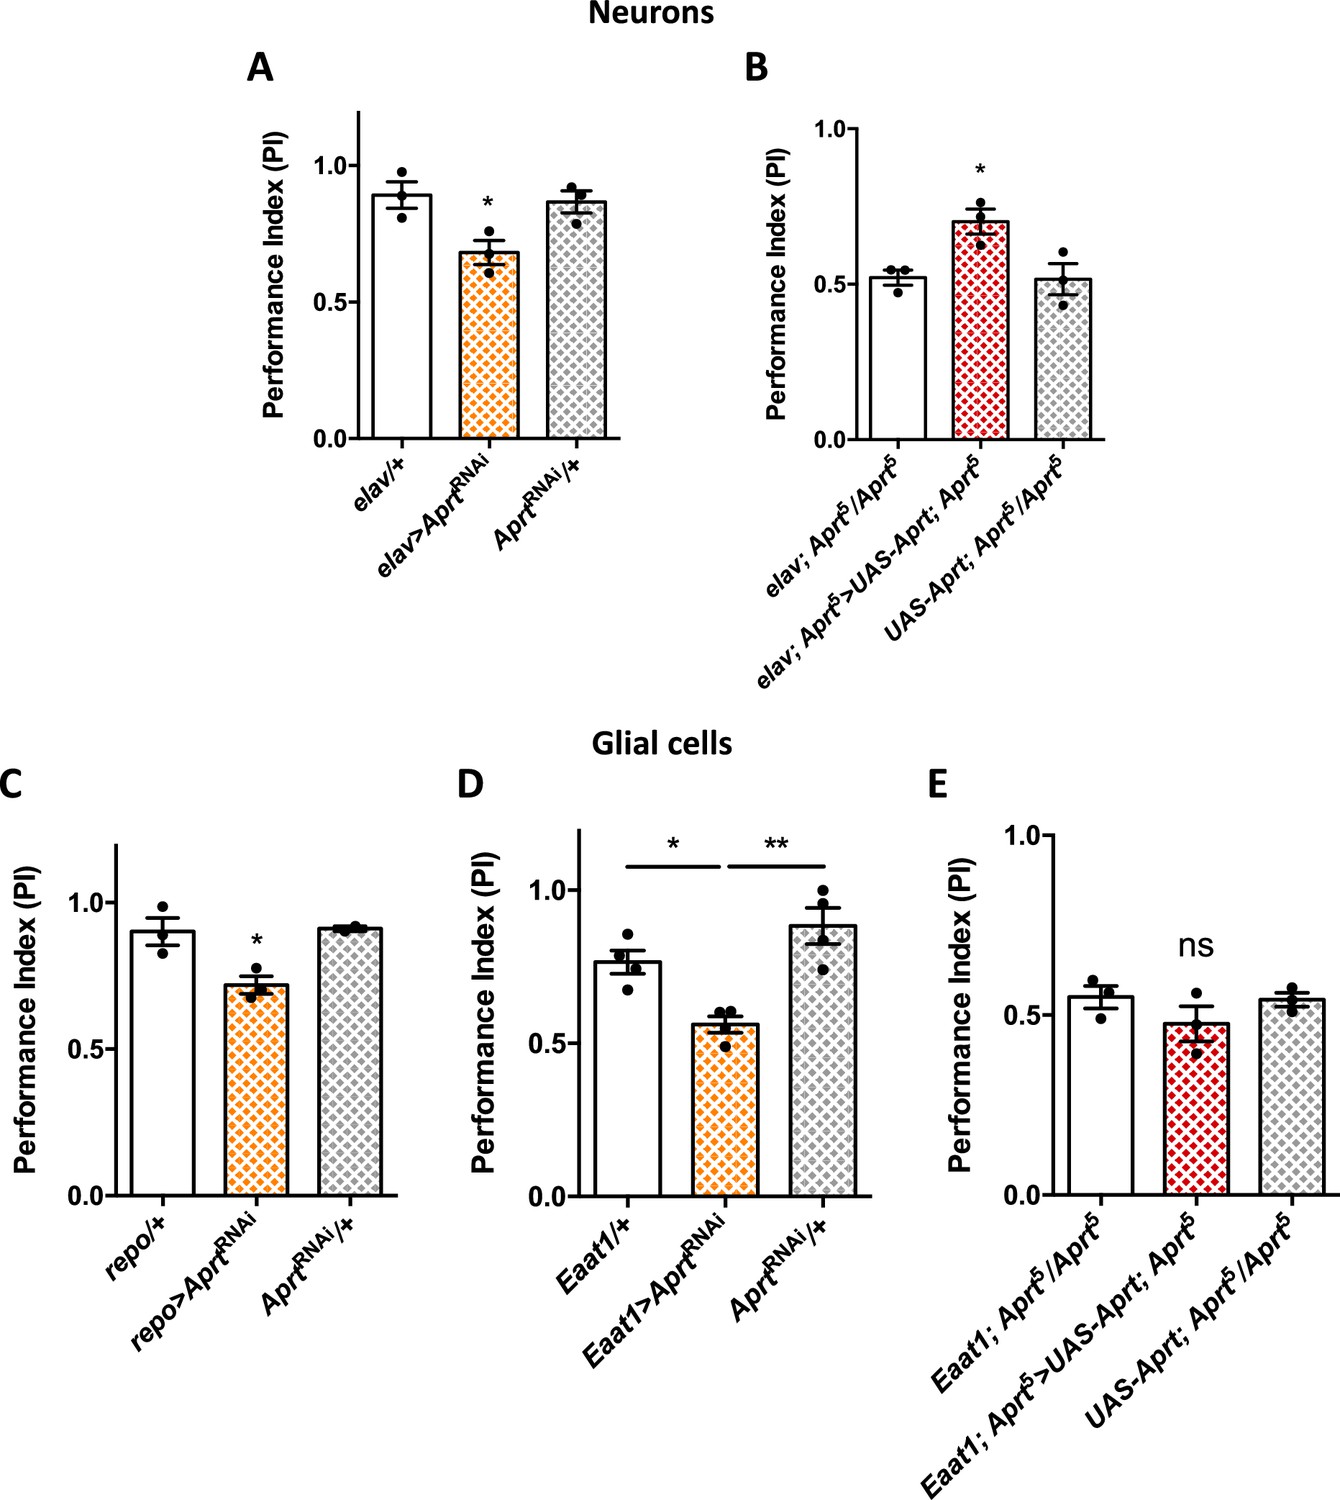
Aprt knockdown in neurons or glial cells disrupts startle-induced locomotion in Drosophila.
(A) AprtRNAi expression in all neurons with elav-Gal4 decreased startle-induced negative geotaxis (SING) performance in 10-day-old flies. (B) Pan-neuronal expression of Drosophila Aprt with the UAS-Gal4 system partially rescued the locomotor response of Aprt5 mutants. (C, D) Downregulation of Aprt expression in all glia with repo-Gal4 (C) or in glial cell that express the glutamate transporter Eaat1 with Eaat1-Gal4 (D) also altered SING performances. (E) Aprt re-expression in glial cells with Eaat1-Gal4 driver did not rescue the climbing response of Aprt5 mutants. Results of three or four independent experiments performed on 50 flies per genotype at 10 days after eclosion (d a.E.). One-way ANOVA with Tukey’s post hoc test for multiple comparisons (*p<0.05; **p<0.01; ns: not significant).
-
Figure 2—source data 1
Source data for Figure 2A–E.
- https://cdn.elifesciences.org/articles/88510/elife-88510-fig2-data1-v1.xlsx
Figure 2—figure supplement 1

Transgenic expression of Drosophila Aprt.
(A) A UAS-Aprt line was generated to allow for Aprt expression in specific cells. Upon ubiquitous expression with the da-Gal4 driver (da>Aprt), Aprt mRNA level was found to be increased 18 times in adult heads compared to the driver (da/+) and effector (Aprt/+) controls. One-way ANOVA with Tukey’s post hoc test for multiple comparisons (***p<0.001). (B) Aprt activity was also increased as much as 80 times in whole body extracts of the da>Aprt flies compared to the two controls. Results of one experiment performed on 20–30 male heads for RNA extraction and 20 whole flies for Aprt activity.
-
Figure 2—figure supplement 1—source data 1
Source data for Figure 2—figure supplement 1.
- https://cdn.elifesciences.org/articles/88510/elife-88510-fig2-figsupp1-data1-v1.xlsx
Figure 2—figure supplement 2

Downregulation of Aprt expression in the ensheathing glia does not alter locomotor performances.
Aprt downregulation targeted to the ensheathing glial cells using MZ0709-Gal4 (A) or NP6520-Gal4 (B) did not impair startle-induced climbing of the flies at 10 days after eclosion (d a.E.). Results of three independent experiments performed on 50 flies per genotype, One-way ANOVA with Tukey’s post hoc test for multiple comparisons, ns: not significant.
-
Figure 2—figure supplement 2—source data 1
Source data for Figure 2—figure supplement 2.
- https://cdn.elifesciences.org/articles/88510/elife-88510-fig2-figsupp2-data1-v1.xlsx
Figure 3
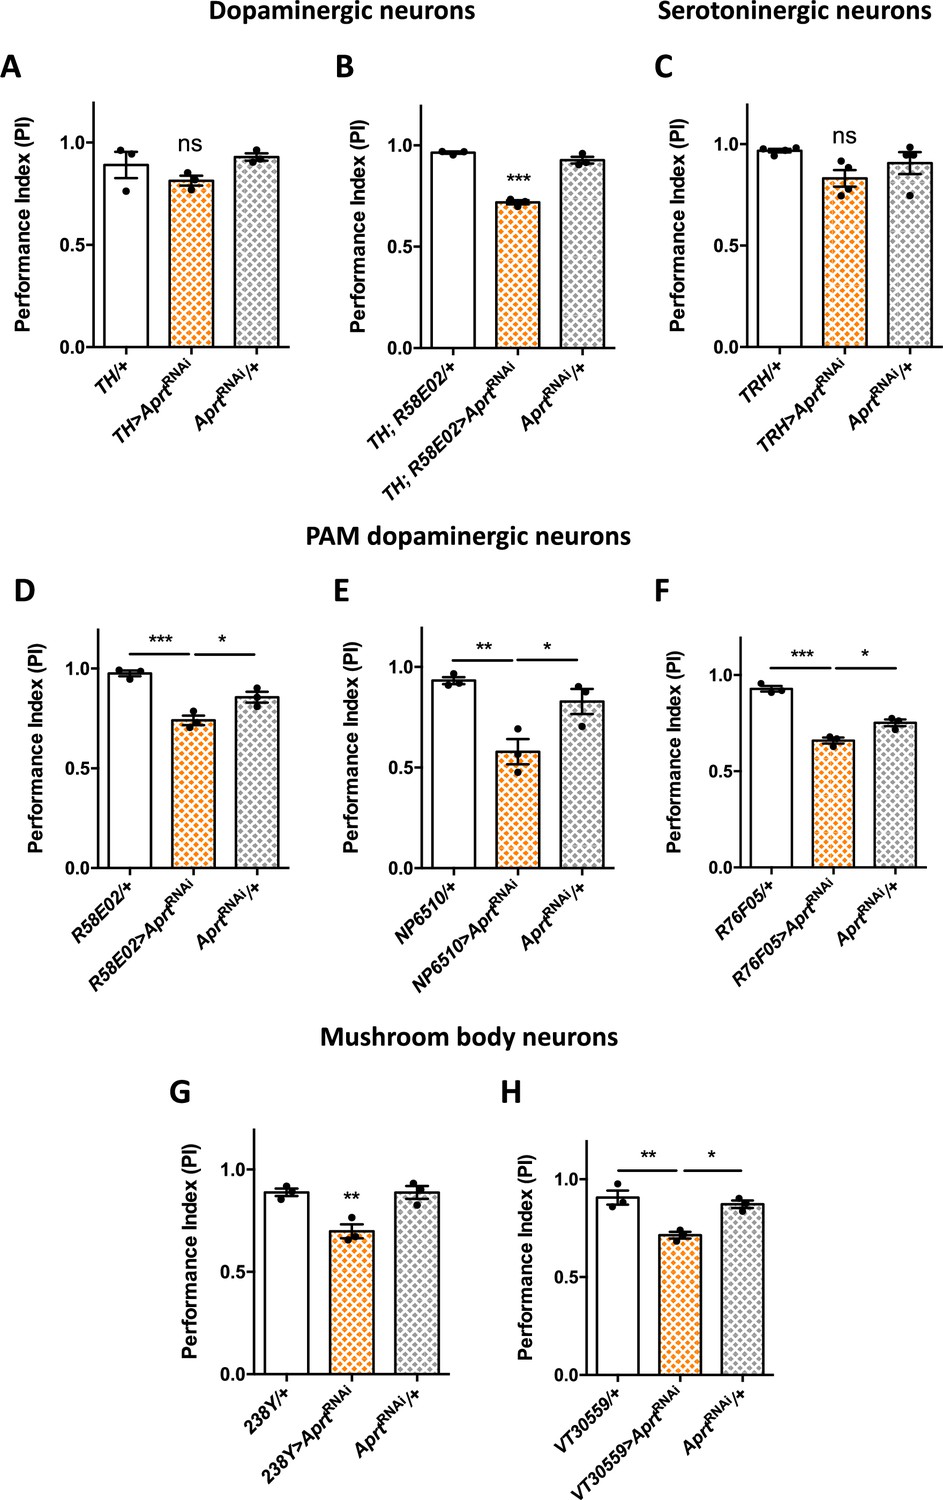
Aprt downregulation in dopamine (DA) neurons of the protocerebral anterior medial (PAM) cluster and in mushroom body neurons impairs startle-induced locomotion.
(A) RNAi-mediated Aprt inactivation in brain DA neurons except a large part of the PAM cluster with the TH-Gal4 driver did not lead to locomotor defects in the startle-induced negative geotaxis (SING) assay. (B) In contrast, Aprt knockdown in all dopaminergic neurons including the PAM cluster with the TH-Gal4, R58E02-Gal4 double-driver led to a decrease in SING performance. (C) Aprt downregulation in serotonergic neurons with TRH-Gal4 did not alter startle-induced climbing response of the flies. (D–F) Aprt knockdown selectively in DA neurons of the PAM cluster using either R58E02-Gal4 (D), NP6510-Gal4 (E), or R76F05-Gal4 (F) significantly decreased climbing performance. (G, H) Aprt knockdown in all the mushroom body intrinsic neurons (Kenyon cells) with 238Y-Gal4 (G) or VT30559-Gal4 (H) also led to a decrease in SING performance. Results of three or four independent experiments performed on 50 flies per genotype at 10 days after eclosion (d a.E.). One-way ANOVA with Tukey’s post hoc test for multiple comparisons (*p<0.05; **p<0.01; ***p<0.001; ns: not significant).
-
Figure 3—source data 1
Source data for Figure 3A–H.
- https://cdn.elifesciences.org/articles/88510/elife-88510-fig3-data1-v1.xlsx
Figure 4 with 4 supplements
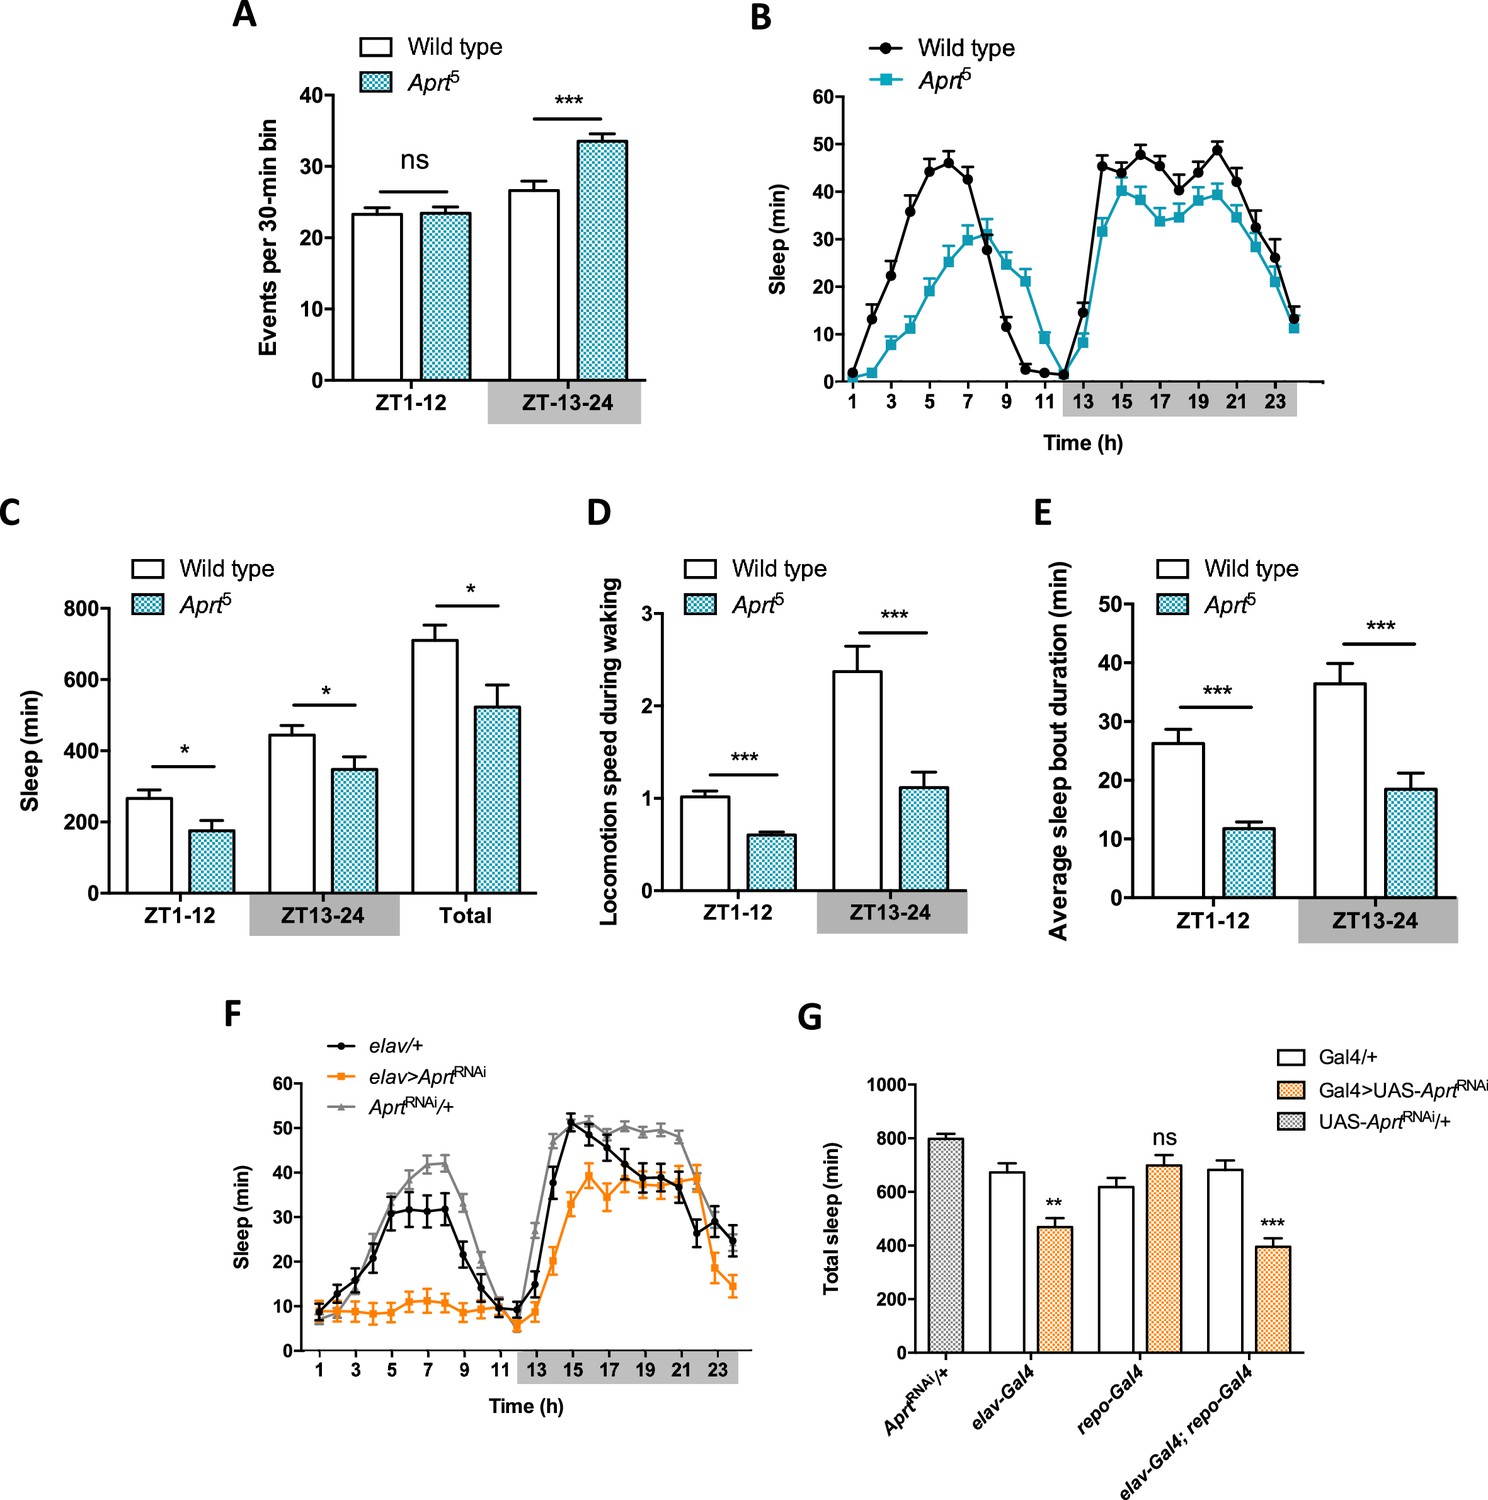
Aprt-deficient flies sleep less and walk slower than wild-type flies.
(A) Quantification of total spontaneous locomotor activity during day and night over five light-dark (LD) cycles. Aprt5 mutants show no difference in spontaneous locomotion with wild-type flies during the day but a higher activity at night. Three independent experiments were performed on 32 flies per genotype and mean ± SEM was plotted. Unpaired Student’s t-test (***p<0.001; ns: not significant). (B) Sleep pattern during a typical 24 hr LD cycle showing that the total amount of sleep is smaller during day and night in Aprt5 mutants compared to wild-type flies. (C) Quantification of day (ZT1-12), night (ZT13-24), and total sleep in Aprt5 mutants. ZT, zeitgeber. (D) Locomotion speed during waking is reduced in Aprt5 mutants. (E) The average sleep bout duration is also decreased, indicating that Aprt5 mutants have a difficulty to maintain sleep. (F) Sleep pattern of elav>AprtRNAi flies, showing that knockdown of Aprt in all neurons led to sleep reduction during the night, similarly to the mutant condition, and an even more profound sleep defect during the day. (G) Quantification of total amount of sleep when Aprt was downregulated in all neurons (elav-Gal4), all glial cells (repo-Gal4), and both neurons and glial cells (elav-Gal4; repo-Gal4). Except for glia only, the resulting effect was a significant sleep reduction. For sleep and locomotion speed, means ± SEM were plotted. Unpaired Student’s t-test (C–E) and one-way ANOVA with Tukey’s post hoc test for multiple comparisons (G) (*p<0.05; **p<0.01; ***p<0.001; ns: not significant).
-
Figure 4—source data 1
Source data for Figure 4A–G.
- https://cdn.elifesciences.org/articles/88510/elife-88510-fig4-data1-v1.xlsx
Figure 4—figure supplement 1
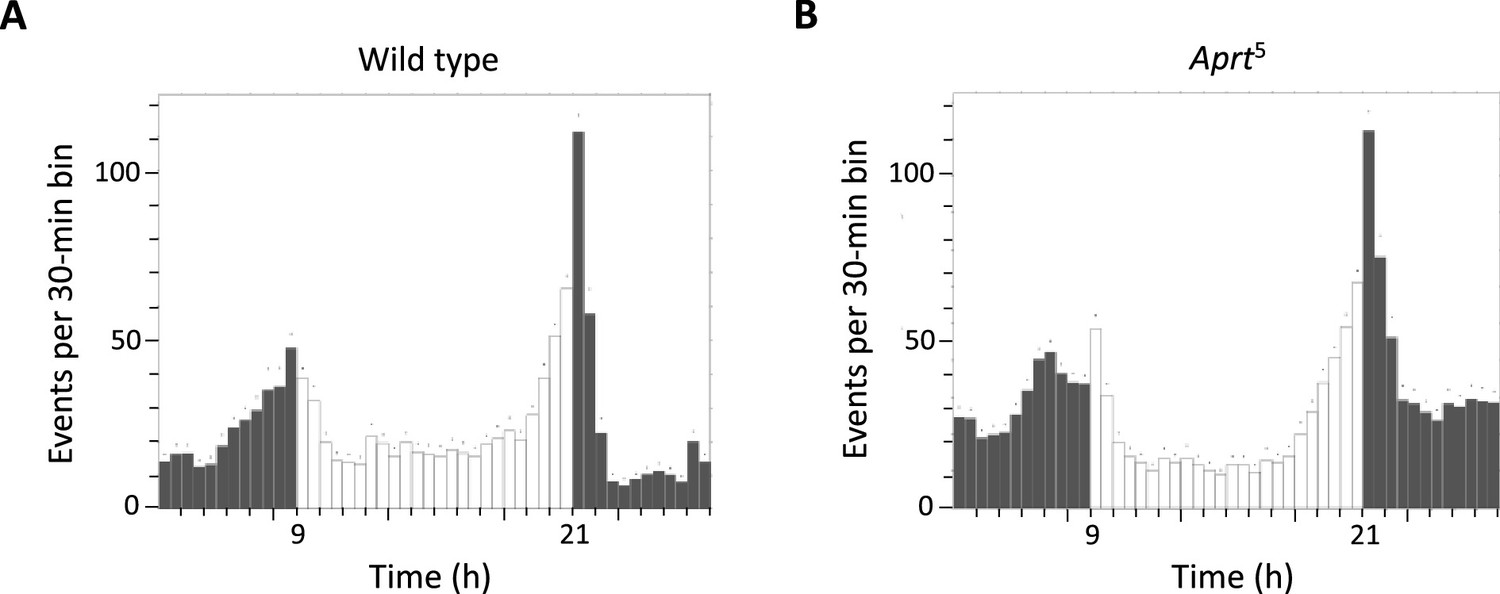
Daily locomotor activity profiles of wild-type and Aprt5 mutant flies.
Actograms showing activity profiles during a 12 hr:12 hr light-dark (LD) cycles from wild-type (A) and Aprt5 (B) male flies at 8 days after eclosion (d a.E.). Aprt deficiency does not seem to alter circadian activity.
Figure 4—figure supplement 2

Sensitivity of resting flies to mild mechanical stimulation.
Wild-type and Aprt5 mutant flies display similarly decreasing responses to stimulations following periods of immobility exceeding 5 min, confirming the standard criteria for sleep. Flies were exposed to a brief (1 s duration) and mild vibration stimulus once every hour during 2 d. Mann–Whitney U test (*p<0.05; **p<0.01; ***p<0.001).
-
Figure 4—figure supplement 2—source data 1
Source data for Figure 4—figure supplement 2.
- https://cdn.elifesciences.org/articles/88510/elife-88510-fig4-figsupp2-data1-v1.xlsx
Figure 4—figure supplement 3
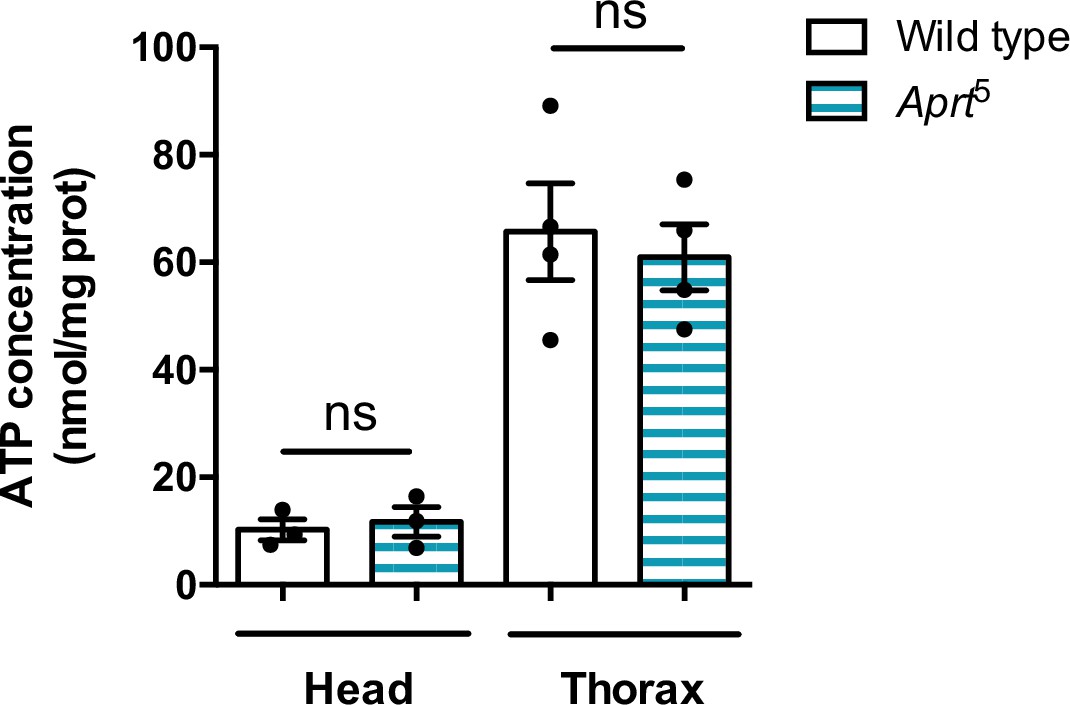
ATP levels are not altered in head and thorax of Aprt5 flies compared to the wild-type.
ATP was measured by a bioluminescence assay. Mean of three or four independent experiments performed on 30 heads or five thoraces per genotype. Unpaired Student’s t-test,ns: not significant.
-
Figure 4—figure supplement 3—source data 1
Source data for Figure 4—figure supplement 3.
- https://cdn.elifesciences.org/articles/88510/elife-88510-fig4-figsupp3-data1-v1.xlsx
Figure 4—figure supplement 4

Sleep patterns of flies with cell-specific Aprt deficiency.
(A) Sleep pattern of repo>AprtRNAi flies, showing that knockdown of Aprt in all glial cells did not induce any sleep defect. (B) In contrast, knocking down Aprt in all neurons and glial cells (elav; repo>AprtRNAi) led to sleep reduction during both day and night, as with pan-neuronal elav-Gal4 driver alone (shown in Figure 4F). (C, D) Quantification of sleep amount during day (C) and night (D) when Aprt was knocked down in all neurons (elav-Gal4), all glial cells (repo-Gal4), and both neurons and glial cells (elav-Gal4; repo-Gal4). Sleep reduction was observed when Aprt was downregulated in neurons but not in glial cells, and sleep was not significantly more affected when the double driver for neurons and glial cells was used, compared to the pan-neuronal driver alone. One-way ANOVA with Tukey’s post hoc test for multiple comparisons (*p<0.05; ***p<0.001; ns: not significant).
-
Figure 4—figure supplement 4—source data 1
Source data for Figure 4—figure supplement 4.
- https://cdn.elifesciences.org/articles/88510/elife-88510-fig4-figsupp4-data1-v1.xlsx
Figure 5

Aprt deficiency increases dopamine (DA) synthesis and content in the Drosophila brain.
(A) Representative confocal projections of tyrosine hydroxylase (TH)-immunostained whole-mount adult brains from wild-type flies and Aprt5 mutants. MB: mushroom body. Scale bars: 100 μm. (B) Quantification of TH immunofluorescence intensity normalized to the controls in the entire brain. 4–6 brains were dissected per experiment and genotype, and 6 independent experiments were performed (**p<0.01). (C) Representative confocal projections of DA immunostaining in whole-mount adult brains of wild-type and Aprt5 mutants. Scale bars: 100 μm. (D) Quantification of DA immunofluorescence intensity over the entire brain showed a slight increase in DA content in Aprt5 mutants compared to wild-type controls. Six brains were dissected per experiment and genotype, and three independent experiments were performed. Unpaired Student’s t-test (**p<0.01). (E) mRNA levels of TH neuronal form DTH1 are increased in Aprt5 mutant heads compared to wild-type flies. Results of six independent RT-qPCR experiments carried out on 3–4 different RNA extractions from 20 to 30 male heads per genotype. Unpaired Student’s t-test (**p<0.01). (F) Conversely, overexpressing Aprt in all cells with the da-Gal4 driver (da>Aprt) reduced mRNA level of DTH1 in heads compared to the driver (da/+) and effector (Aprt/+) controls. Mean of three independent experiments performed on three different RNA extractions from 20 to 30 male fly heads. One-way ANOVA with Tukey’s post hoc test for multiple comparisons (*p<0.05, **p<0.01). (G) Representative western blot of wild-type and Aprt5 mutant head extracts probed with anti-TH and anti-actin beta antibodies. (H) Quantification of DTH1 protein levels in adult wild-type and Aprt5 mutant heads by western blots showed an increase in DTH1 protein level (60 kDa) in Aprt5 mutants. Actin (Act5C, 42 kDa) was used as a loading control. Results are the mean of four determinations in two independent experiments. Unpaired Student’s t-test (**p<0.01).
-
Figure 5—source data 1
Source data for Figure 5A–F and H.
- https://cdn.elifesciences.org/articles/88510/elife-88510-fig5-data1-v1.xlsx
-
Figure 5—source data 2
Original files for the western blot analysis of Figure 5G.
- https://cdn.elifesciences.org/articles/88510/elife-88510-fig5-data2-v1.zip
-
Figure 5—source data 3
Original files for the western blot analysis of Figure 5G with relevant bands and samples labeled.
- https://cdn.elifesciences.org/articles/88510/elife-88510-fig5-data3-v1.zip
Figure 6

Relations between Aprt and molecular components of adenosinergic signaling.
(A, B) Impacts of the lack of Aprt activity on the adenosinergic system. (A) Adenosine level was measured in whole flies or heads of Aprt5 flies by ultra performance liquid chromatography (UPLC). Compared to wild-type flies, adenosine level was significantly reduced in the mutants. Results of three independent experiments performed with five males per genotype in triplicates and two independent experiments with 30 heads per genotype in triplicates. Two-way ANOVA with Sidak’s post hoc test for multiple comparisons (*p<0.05; **p<0.01). (B) Aprt5 mutation did not affect AdoR expression but induced a marked increase in adenosine transporter Ent2 mRNA abundance. 3–6 different RNA extractions were performed on 20–30 male heads. Results of 3–6 independent experiments. Two-way ANOVA with Sidak’s post hoc test for multiple comparisons (***p<0.001; ns: not significant). (C) Null AdoRKGex mutants showed decreased Aprt expression (left panel) and a stronger decrease in Aprt activity (right panel). Four independent RNA extractions were carried out on 20–30 male heads and four independent real-time PCR determinations were done per RNA sample. For Aprt activity, three independent determinations were performed on 20 whole flies per genotype. Unpaired Student’s t-test (***p<0.001).
-
Figure 6—source data 1
Source data for Figure 6A–C.
- https://cdn.elifesciences.org/articles/88510/elife-88510-fig6-data1-v1.xlsx
Figure 7 with 5 supplements
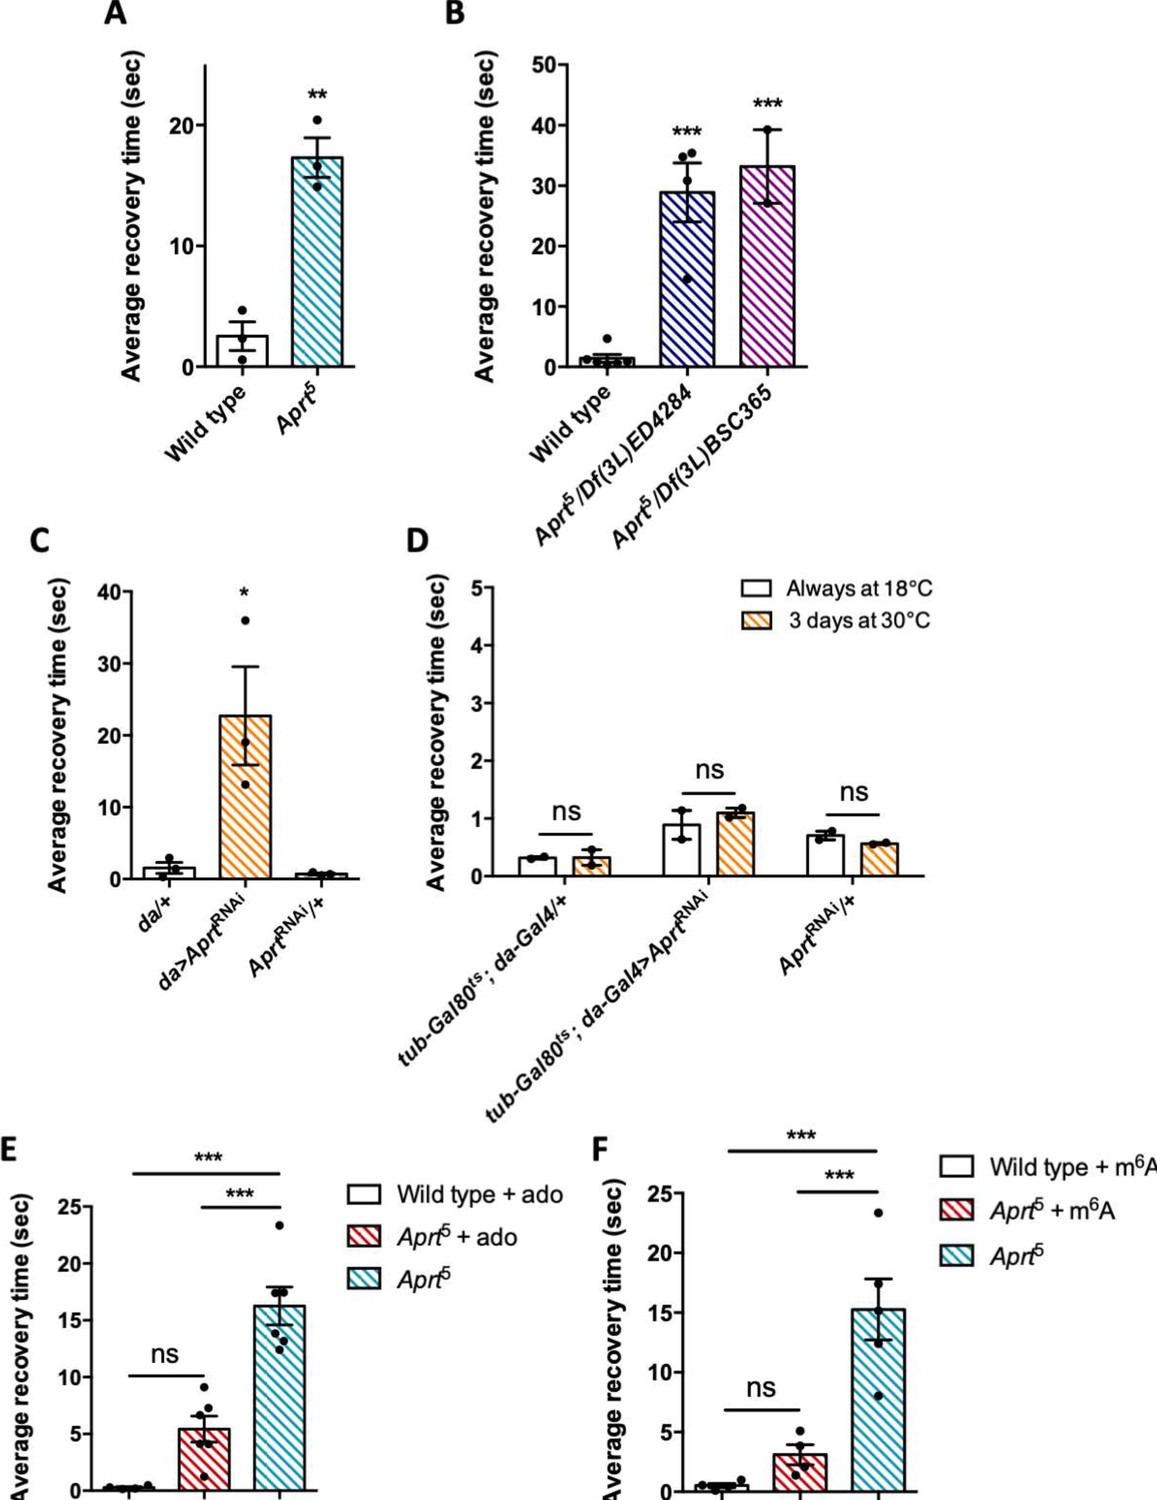
Aprt deficiency triggers a seizure-like phenotype.
(A) At 30 days after eclosion (d a.E.), Aprt5 mutants need a much longer time than wild-type flies to recover from a strong mechanical shock, showing a bang-sensitive (BS) paralysis comparable to tonic-clonic seizure. Results of three independent experiments performed on 50 flies per genotype. Unpaired Student’s t-test; **p<0.01. (B) At 30 d a. E., hemizygous Aprt5 mutants also showed a marked BS phenotype. Results of 2–4 independent experiments performed on 50 flies per genotype. One-way ANOVA with Dunnett’s post hoc test for multiple comparisons (***p<0.001). (C) RNAi-mediated downregulation of Aprt in all cells (da>AprtRNAi) also led to BS phenotype in adults at 30 d a.E., but not with the driver and effector controls. Results of three independent experiments performed on 50 flies per genotype. One-way ANOVA with Tukey’s post hoc test for multiple comparisons (*p<0.05). (D) Aprt knockdown by RNAi during the adult stage for 3 d before the test was not sufficient to induce bang sensitivity, suggesting that this phenotype could be caused by a developmental defect or a longer downregulation of Aprt. Results of two independent experiments performed on 50 flies per genotype. Two-way ANOVA with Sidak’s post hoc test for multiple comparisons; ns: not significant. (E, F) The BS phenotype of 30-day-old Aprt5 mutants was rescued by feeding either 500 µM adenosine (ado) (E) or 500 µM N6-methyladenosine (m6A) (F) during all developmental stages plus 5 d before the test. Results of four or six independent experiments performed on 50 flies per genotype. One-way ANOVA with Tukey’s post hoc test for multiple comparisons (***p<0.001, ns: not significant).
-
Figure 7—source data 1
Source data for Figure 7A–F.
- https://cdn.elifesciences.org/articles/88510/elife-88510-fig7-data1-v1.xlsx
Figure 7—figure supplement 1

Aprt knockdown selectively in neurons, glia, or muscle cells did not induce bang sensitivity.
(A–C) Downregulation of Aprt by RNAi either in all neurons (A), all glial cells (B), or all muscles (C) did not induce a seizure phenotype, in contrast to the effects of ubiquitous downregulation. Results of two independent experiments performed on 50 flies per genotype at 30 days after eclosion (d a.E.). One-way ANOVA with Tukey’s post hoc test for multiple comparisons; ns: not significant.
-
Figure 7—figure supplement 1—source data 1
Source data for Figure 7—figure supplement 1.
- https://cdn.elifesciences.org/articles/88510/elife-88510-fig7-figsupp1-data1-v1.xlsx
Figure 7—figure supplement 2

Administration of allopurinol does not rescue the bang sensitivity phenotype of Aprt-deficient mutants.
Feeding the Aprt5 mutants with allopurinol at the same concentration used for uric acid normalization (100 μg/ml) either in adults 5 d before the test (A) or throughout all developmental stages (B) did not prevent the bang sensitivity of these flies. Results of one experiment performed on 50 flies per genotype at 30 days after eclosion (d a.E.). Unpaired Student’s t-test (**p<0.01; ***p<0.001).
-
Figure 7—figure supplement 2—source data 1
Source data for Figure 7—figure supplement 2.
- https://cdn.elifesciences.org/articles/88510/elife-88510-fig7-figsupp2-data1-v1.xlsx
Figure 7—figure supplement 3
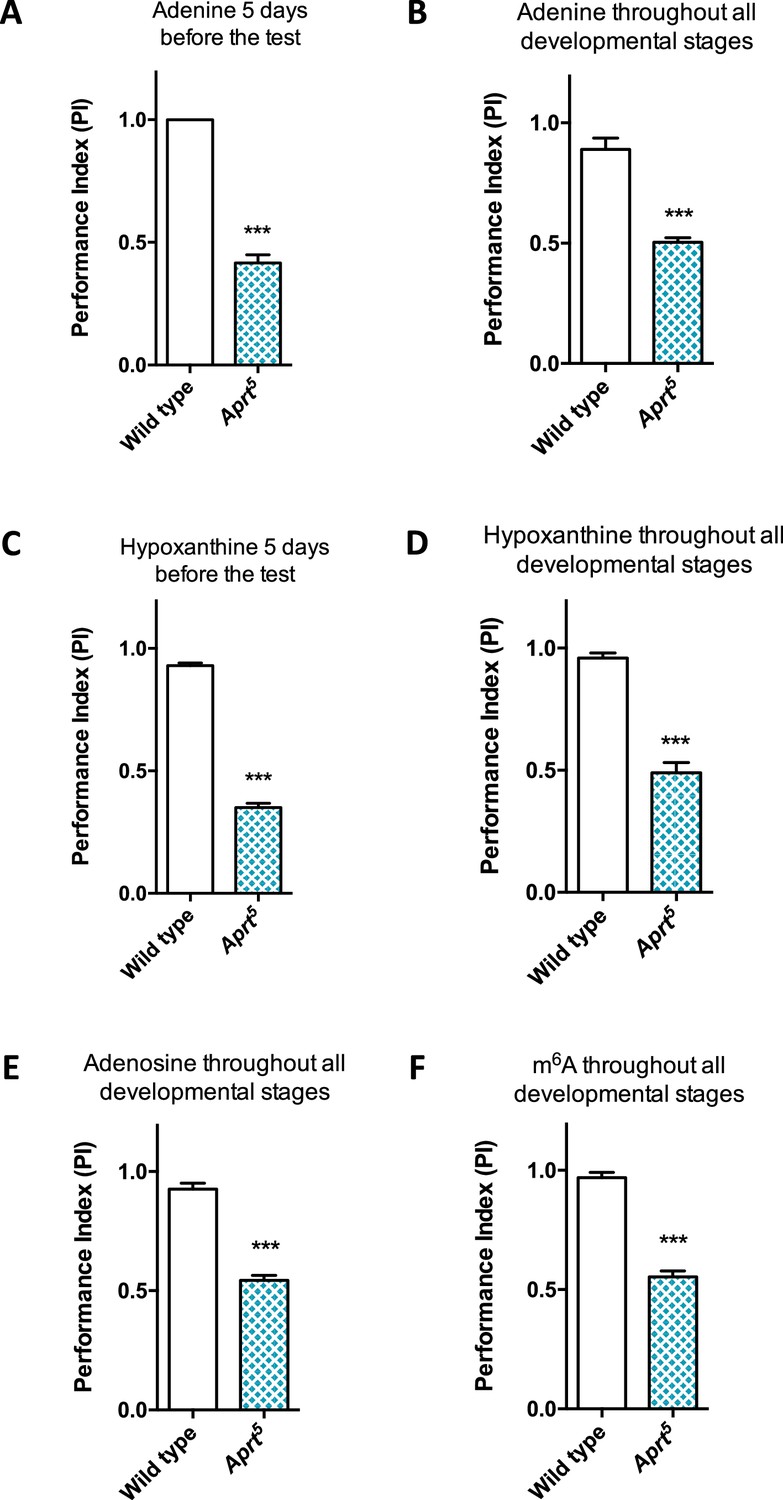
Administration of various purine compounds does not rescue the motricity defects of Aprt-deficient mutants.
(A–D) Feeding the Aprt5 mutant flies with adenine (A, B) or hypoxanthine (C, D) at 100 μM, either in adults 5 d before the test (A, C) or throughout all developmental stages plus 5 d before the test (B, D) did not rescue startle-induced negative geotaxis (SING) behavior defects. (E, F) Feeding the Aprt5 mutants with adenosine (E) or N6-methyladenosine (m6A) (F) at 500 μM throughout all developmental stages plus 5 d before the test did not rescue SING behavior defects. Results of one experiment performed on 50 flies per genotype at 10 days after eclosion (d a.E.). Unpaired Student’s t-test (***p<0.001).
-
Figure 7—figure supplement 3—source data 1
Source data for Figure 7—figure supplement 3.
- https://cdn.elifesciences.org/articles/88510/elife-88510-fig7-figsupp3-data1-v1.xlsx
Figure 7—video 1
Bang sensitivity phenotype of Aprt-deficient flies: wild-type flies.
Wild-type Canton S flies (CS) are not paralyzed and recover rapidly after 10 s vortexing.
Figure 7—video 2
Bang sensitivity phenotype of Aprt-deficient flies: Aprt5 mutant flies.
In contrast, Aprt5 mutant flies (APRT) show seizure-like behavior and paralysis, and they recover slowly after such mechanical stimulation.
Figure 8
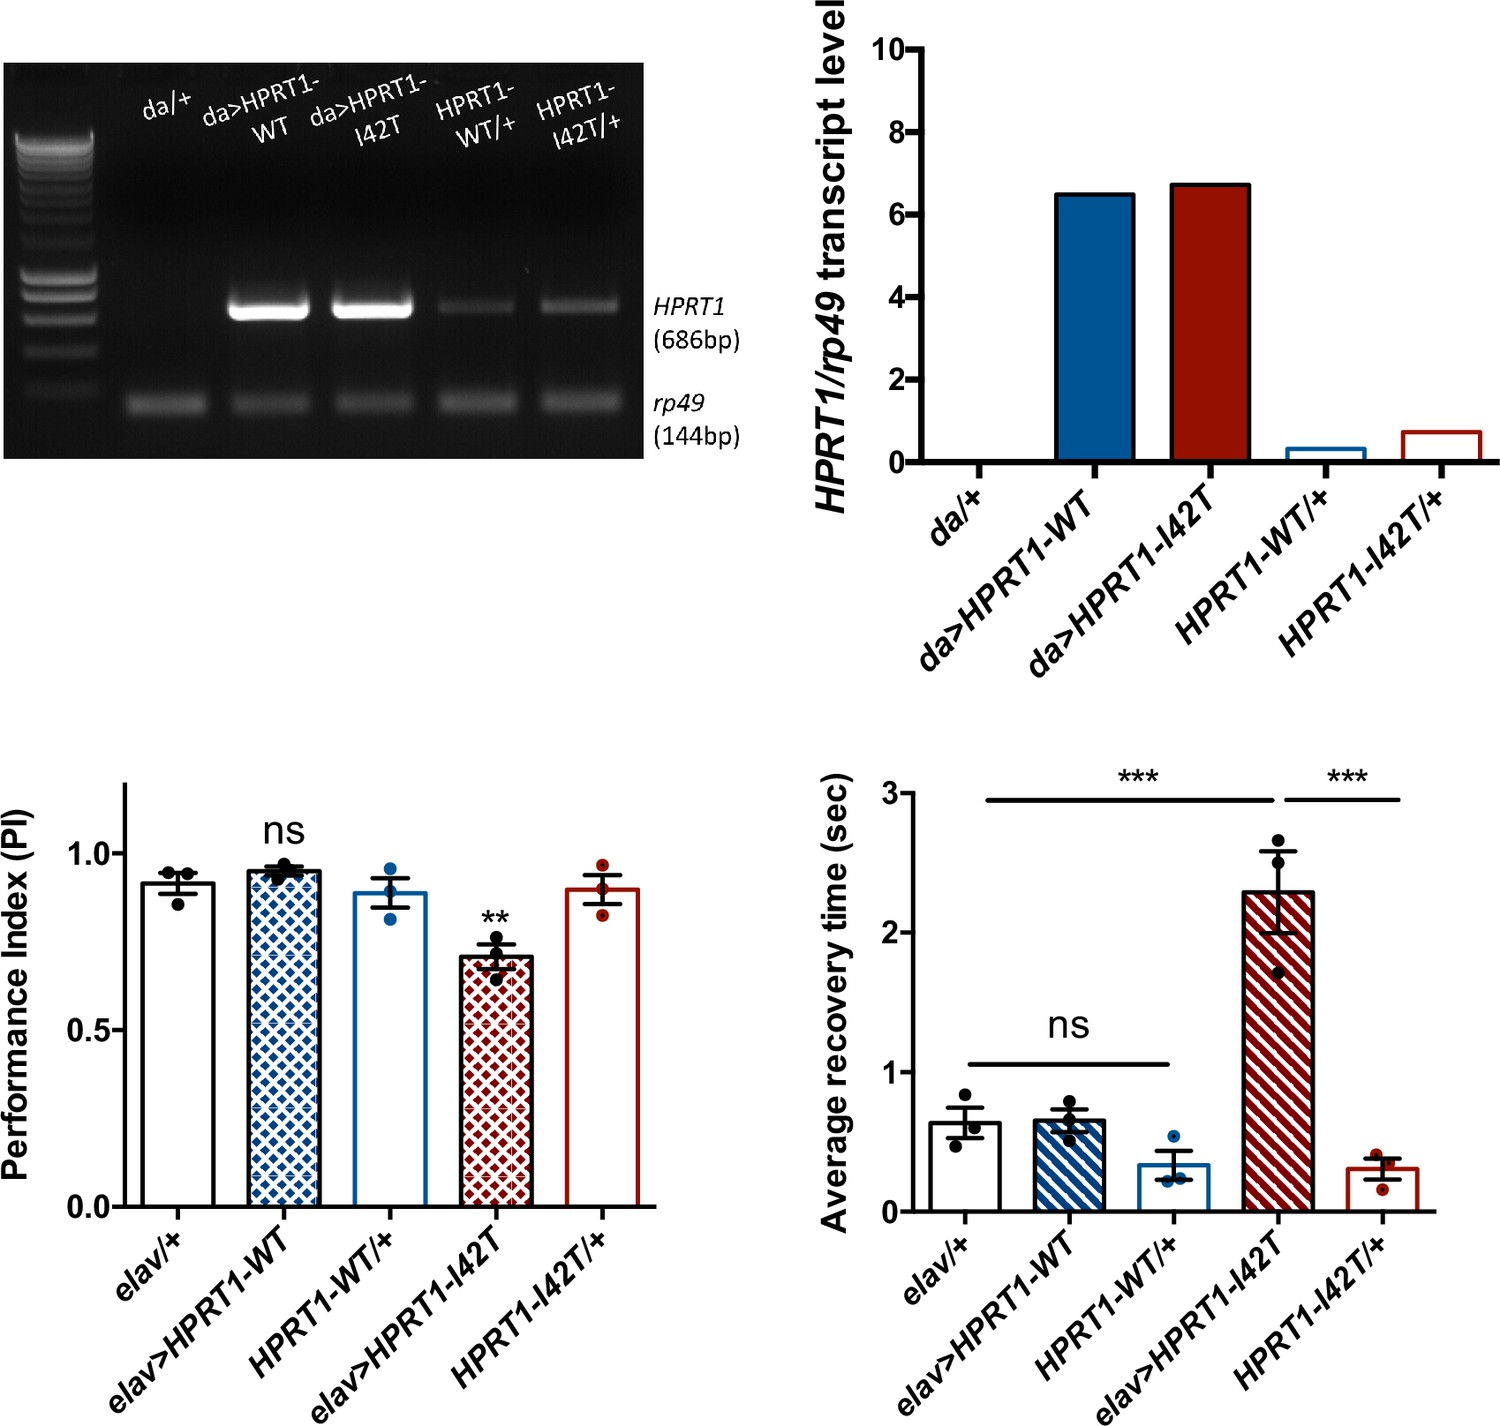
Expression of a pathogenic mutant isoform of human hypoxanthine-guanine phosphoribosyltransferase (HGPRT) induces neurobehavioral defects in flies.
(A, B) Ubiquitous expression of human HPRT1with da-Gal4. (A) Amplification of human HPRT1 transcripts detected by RT-PCR in head extracts of da>HPRT1 WT and da>HPRT1-I42T flies. A band with lower intensity was also detected in the effector controls (UAS-HPRT1-WT/+ and UAS-HPRT1-I42T/+), and not in the driver control (da/+), which indicates a small amount of driver-independent transgene expression. (B) Quantification of the previous experiment. (C, D) Expression of the Lesch–Nyhan disease (LND)-associated I42T isoform in all neurons (elav>HPRT1-I42T), but not of the wild-type form (elav>HPRT1-WT), induced an early SING defect at 15 d a.E. (C) and a BS phenotype at 30 d a.E. (D), compared to the driver (elav/+) and effector (UAS-HPRT1-I42T/+) only controls. Results of three independent experiments performed on 50 flies per genotype. One-way ANOVA with Tukey’s post hoc test for multiple comparisons (**p<0.01; ***p<0.001; ns: not significant).
-
Figure 8—source data 1
Original file for the DNA gel electrophoresis of Figure 8A.
- https://cdn.elifesciences.org/articles/88510/elife-88510-fig8-data1-v1.zip
-
Figure 8—source data 2
Original file for the DNA gel electrophoresis of Figure 8A with relevant bands and samples labeled.
- https://cdn.elifesciences.org/articles/88510/elife-88510-fig8-data2-v1.zip
-
Figure 8—source data 3
Source data for Figure 8B–D.
- https://cdn.elifesciences.org/articles/88510/elife-88510-fig8-data3-v1.xlsx
Author response image 1

Tables
Table 1
Aprt activity in wild-type and Aprt-deficient flies.
| Genotypes | Sex | Aprt activity (nmol/min/mg prot) |
|---|---|---|
| Wild type | Males | 1.32 ± 0.17 |
| Females | 2.77 ± 0.27 | |
| Aprt5/Aprt5 | Males and females | 0.04 ± 0.02 |
| Aprt5/Df(3L)ED4284 | Males | 0.02 ± 0.01 |
| da/+ | Males | 2.78 ± 0.41 |
| da>AprtRNAi | Males | 0.10 ± 0.01 |
| AprtRNAi/+ | Males | 2.16 ± 0.37 |
-
Table 1—source data 1
Source data for Table 1.
- https://cdn.elifesciences.org/articles/88510/elife-88510-table1-data1-v1.xlsx
Table 2
Hypoxanthine-guanine phosphoribosyltransferase (HGPRT) activity in transgenic flies expressing the wild-type or a Lesch–Nyhan disease (LND)-associated mutant form of human HPRT1.
| Genotypes | HGPRT activity (nmol/min/mg) |
|---|---|
| da/+ | 0 |
| da>HPRT1-WT | 13.88 ± 3.75 |
| da>HPRT1-I42T | 2.70 ± 1.44 |
| HPRT1-WT/+ | 0 |
| HPRT1-I42T/+ | 0 |
-
Table 2—source data 1
Source data for Table 2.
- https://cdn.elifesciences.org/articles/88510/elife-88510-table2-data1-v1.xlsx
Additional files
Download links
A two-part list of links to download the article, or parts of the article, in various formats.
Downloads (link to download the article as PDF)
Open citations (links to open the citations from this article in various online reference manager services)
Cite this article (links to download the citations from this article in formats compatible with various reference manager tools)
Metabolic and neurobehavioral disturbances induced by purine recycling deficiency in Drosophila
eLife 12:RP88510.
https://doi.org/10.7554/eLife.88510.3


