BATF relieves hepatic steatosis by inhibiting PD1 and promoting energy metabolism
- Institute of Digestive Disease, Guangxi Academy of Medical Sciences, the People's Hospital of Guangxi Zhuang Autonomous Region, China
- College of Animal Science and Technology, Guangxi University, China
- School of Pharmacy, Mongolian National University of Medical Sciences, Mongolia
Figures
Figure 1 with 1 supplement
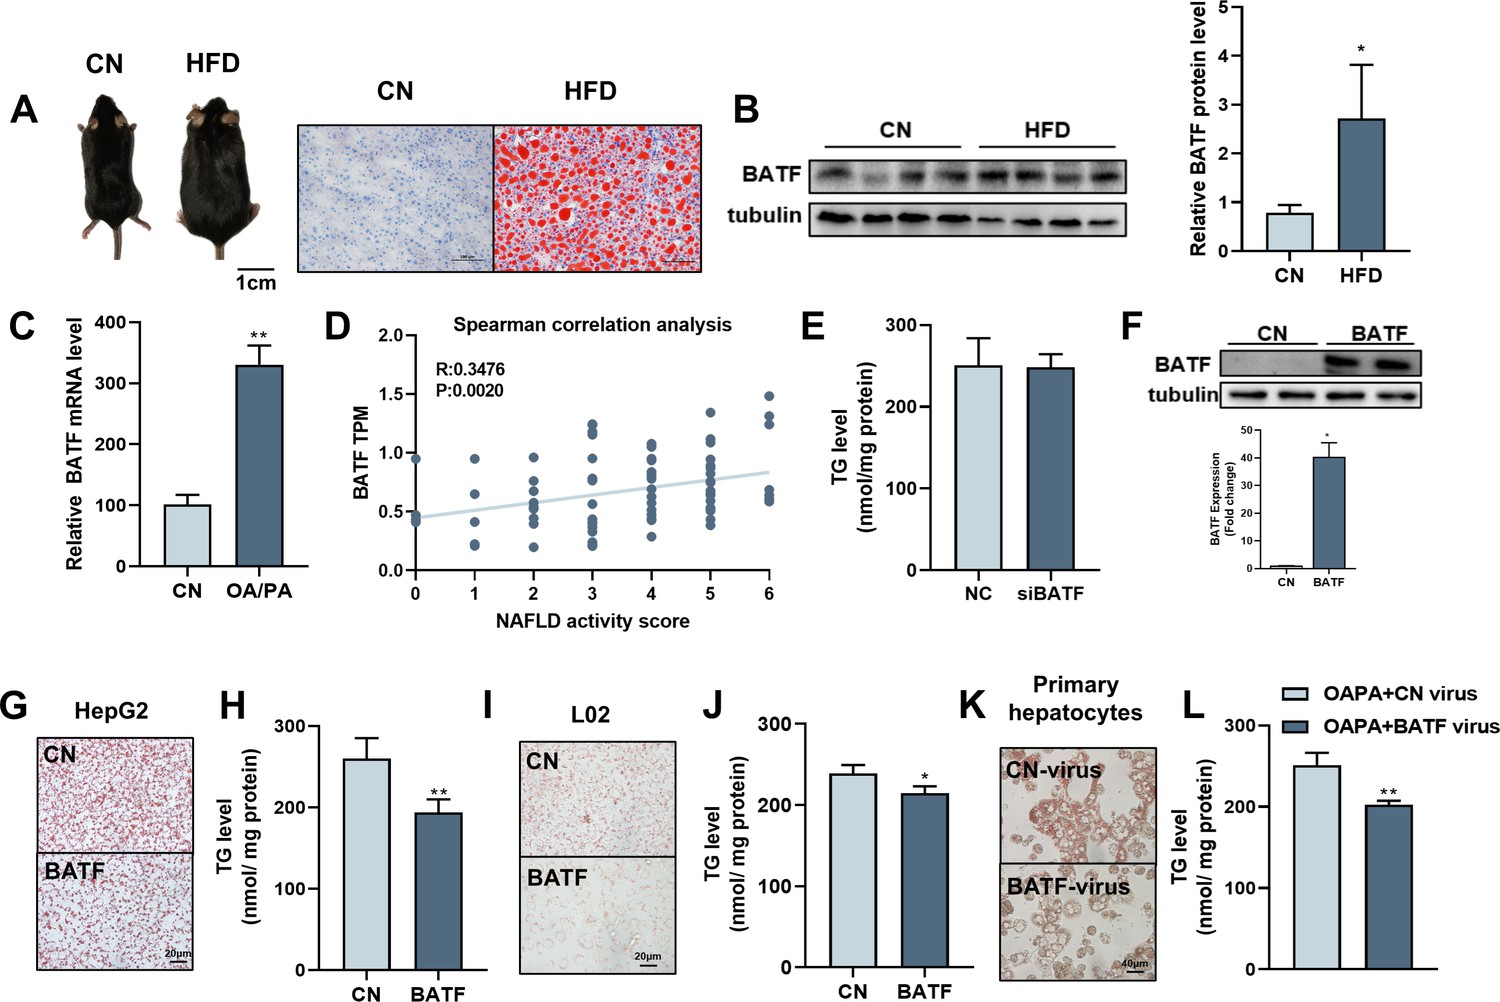
Effects of BATF on lipid deposition in hepatocytes under high-fat diet.
(A) The mice and liver Oil red O staining in normal diet group (CN) and high-fat diet group (HFD). Bar, 1 cm (left panel) and 100 μm (right panel). (B) The protein expression of BATF in liver tissues (n=4). (C) The mRNA expression of BATF in liver tissues (n=5). (D) Spearman correlation Analysis between TPM of BATF and NAFLD Patients with Different Degrees (n=4–18). (E) Triglyceride content (n=5). (F) Detection of BATF overexpression in HepG2 (n=2). (G) Oil red O staining of HepG2 cells with OA/PA when BATF was overexpressed and (H) triglyceride content (n=4). (I) Oil red O staining of L02 cells with OA/PA when BATF was overexpressed and (J) triglyceride content (n=3). (K) Oil red O staining of primary hepatocytes with OA/PA when BATF was overexpressed and (L) triglyceride content (n=3). The data are expressed as mean ± SD. *p<0.05, **p<0.01.
-
Figure 1—source data 1
Effects of BATF on lipid deposition in hepatocytes under high-fat diet.
- https://cdn.elifesciences.org/articles/88521/elife-88521-fig1-data1-v1.zip
Figure 1—figure supplement 1
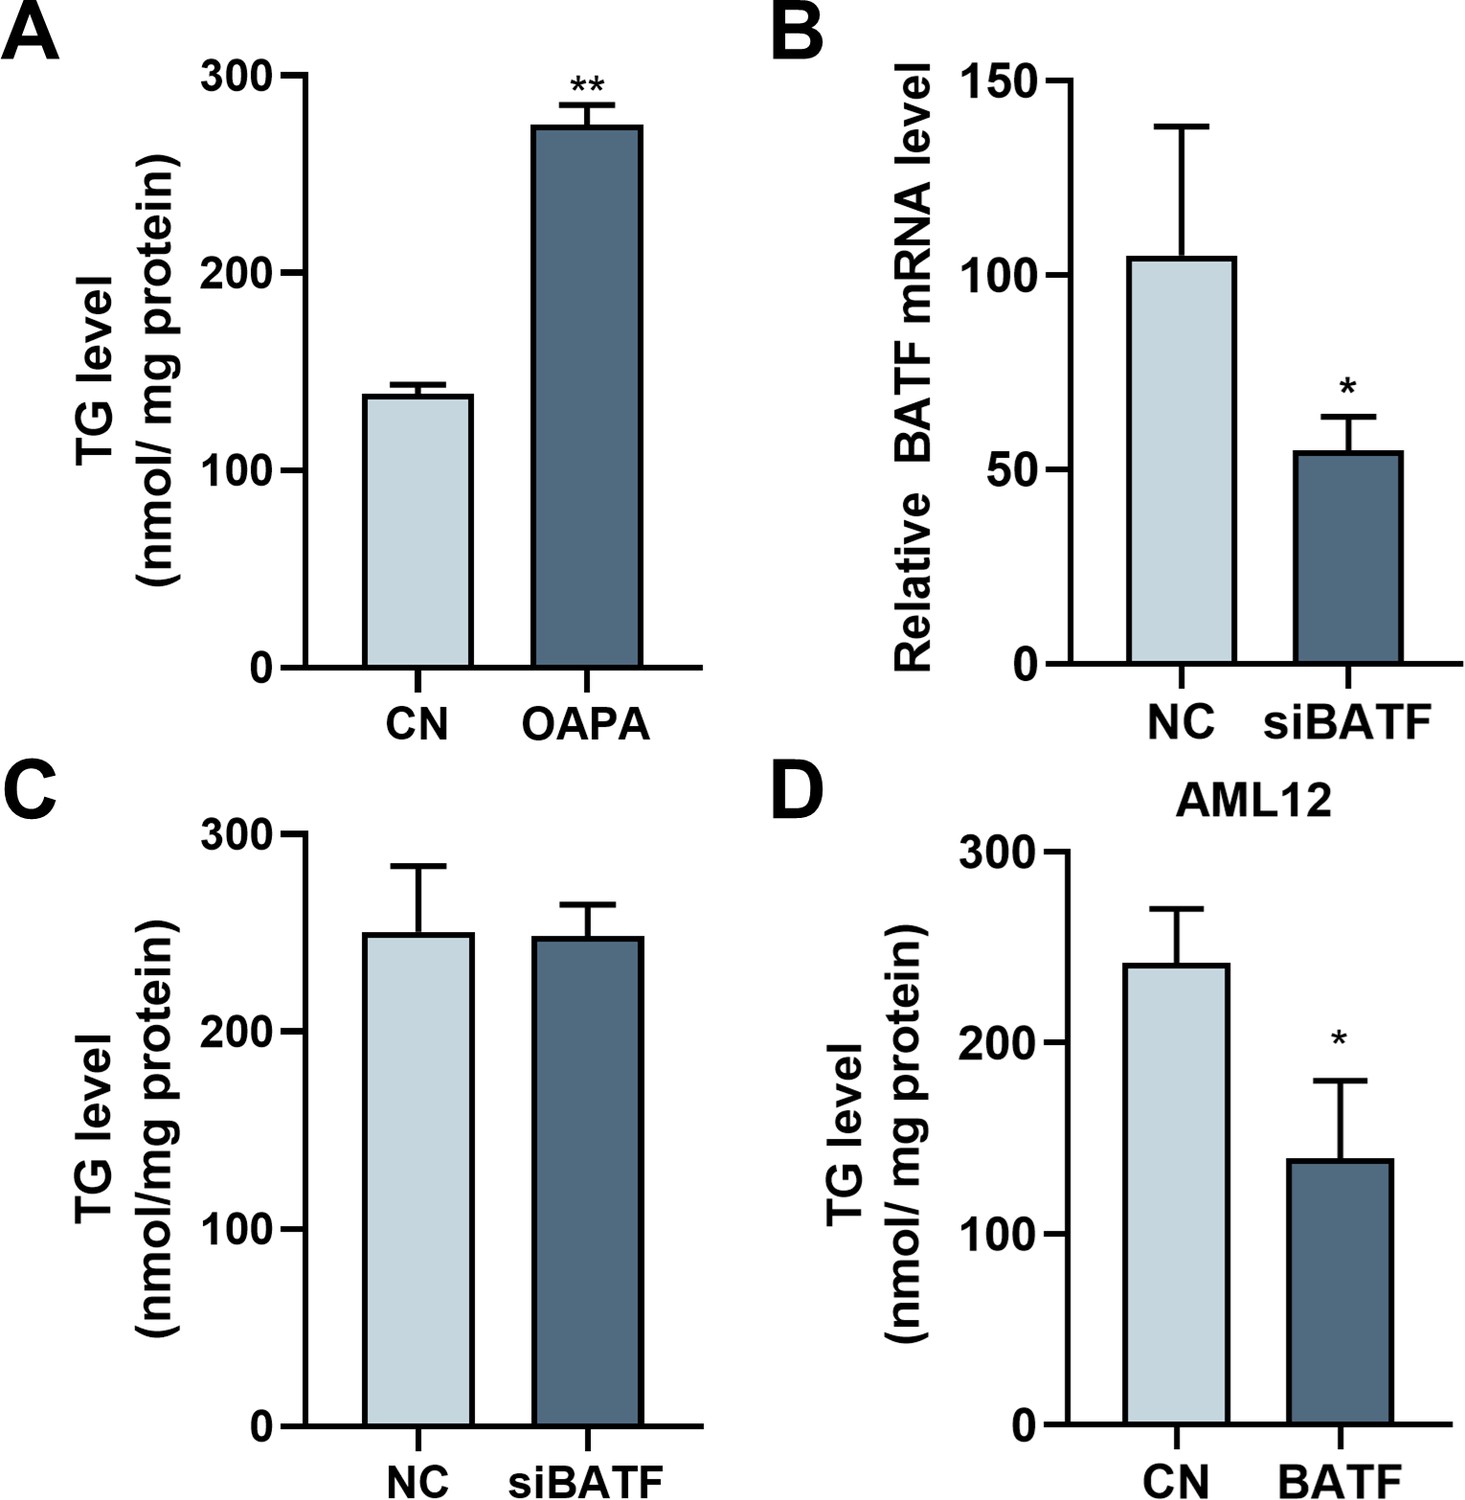
Effects of BATF on lipid levels in hepatocytes.
(A) Triglyceride content with OA/PA (n=3). (B) BATF mRNA levels. NC, negative control group; siBATF, BATF inhibition group, (n=3). (C) Triglyceride content with OA/PA treatment, (n=5). (D) Triglyceride content with OA/PA when BATF was overexpressed, (n=3). The data are expressed as mean ± SD. *p<0.05, **p<0.01.
-
Figure 1—figure supplement 1—source data 1
Effects of BATF on lipid levels in hepatocytes.
- https://cdn.elifesciences.org/articles/88521/elife-88521-fig1-figsupp1-data1-v1.zip
Figure 2 with 1 supplement
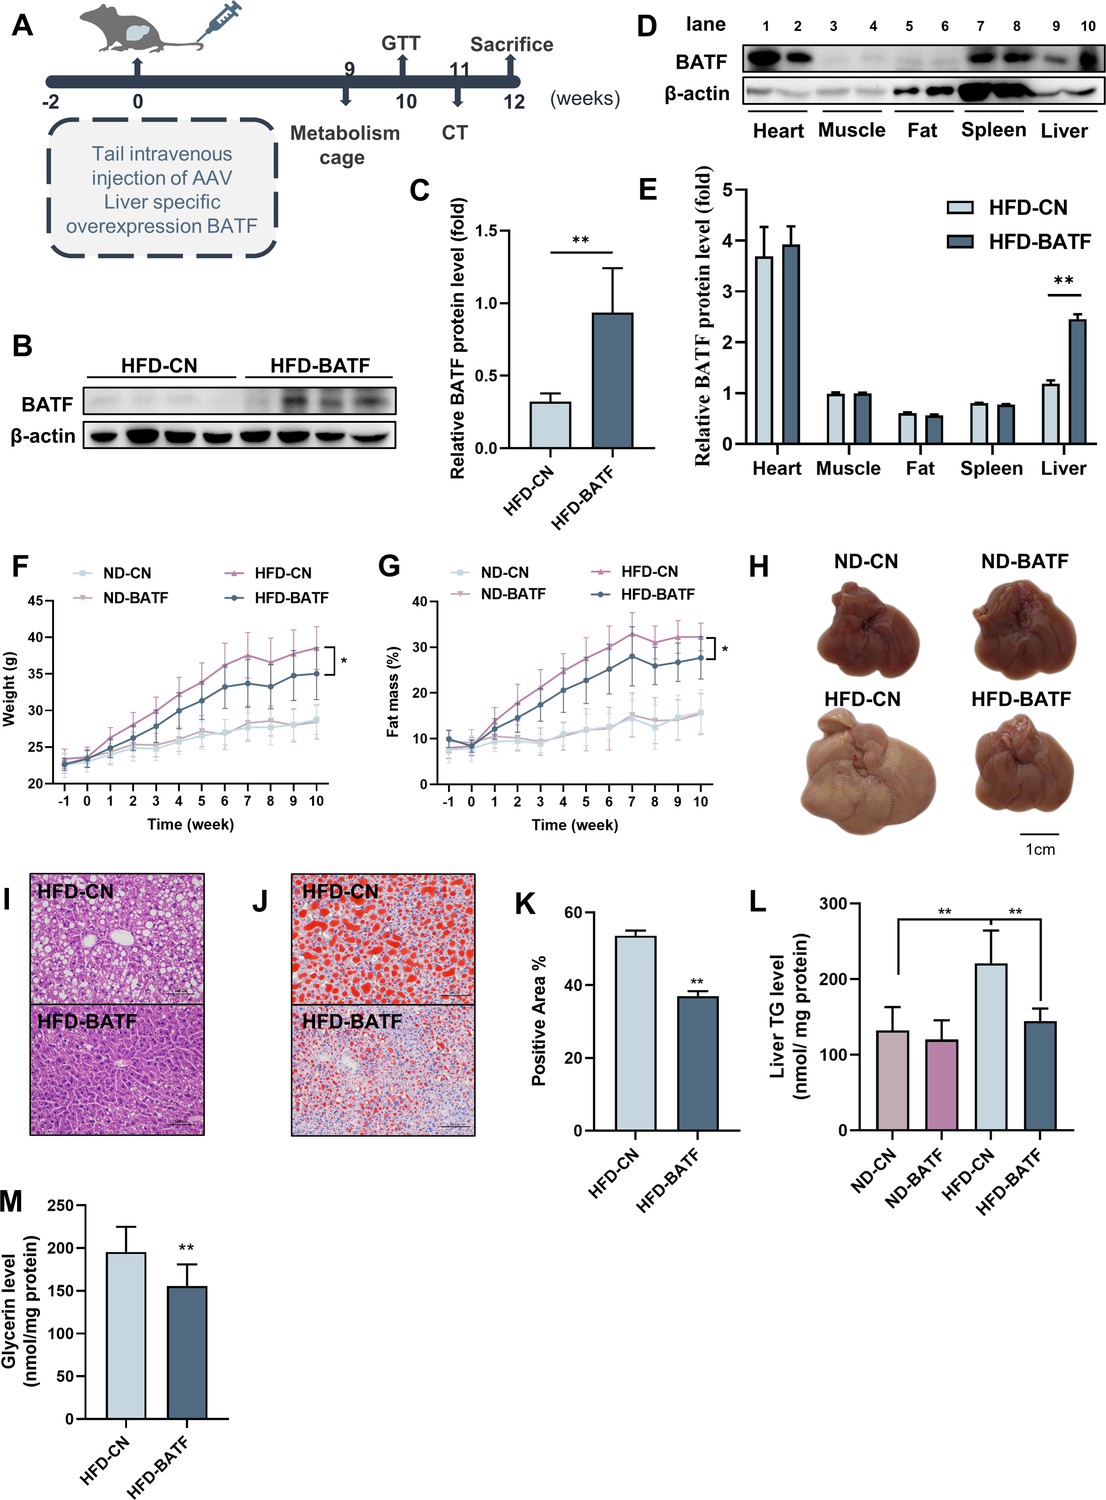
Effects of BATF on hepatic fat deposition in mice.
(A) Experimental designs illustration of mice. (B) Expression of BATF protein in liver (n=4). (C) Densitometric quantification of the blotting. (D) Expression of BATF protein in various tissues of HFD-CN mice HBAAV/8-ZsGreen, WB in lane1, 3, 5, 7, 9 and HFD-BATF mice HBAAV2/8-CMV-m-BATF-3×flag-ZsGreen, WB in lane 2, 4, 6, 8, 10. (E) Densitometric quantification of the blotting. (F) Mice bodyweight (n=8–10). (G) Mice fat ratio (n=8–10). (H) Mice liver. Bar, 1 cm. (I) HE staining of mice liver sections. Bar, 100 μm. (J) (K) Oil red O staining of mice liver sections and quantitative analysis. Bar, 100 μm (n=3). (L) Liver triglyceride levels (n=8–10). (M) Liver total Glycerin levels (n=8–10).
-
Figure 2—source data 1
Effects of BATF on hepatic fat deposition in mice.
- https://cdn.elifesciences.org/articles/88521/elife-88521-fig2-data1-v1.zip
Figure 2—figure supplement 1
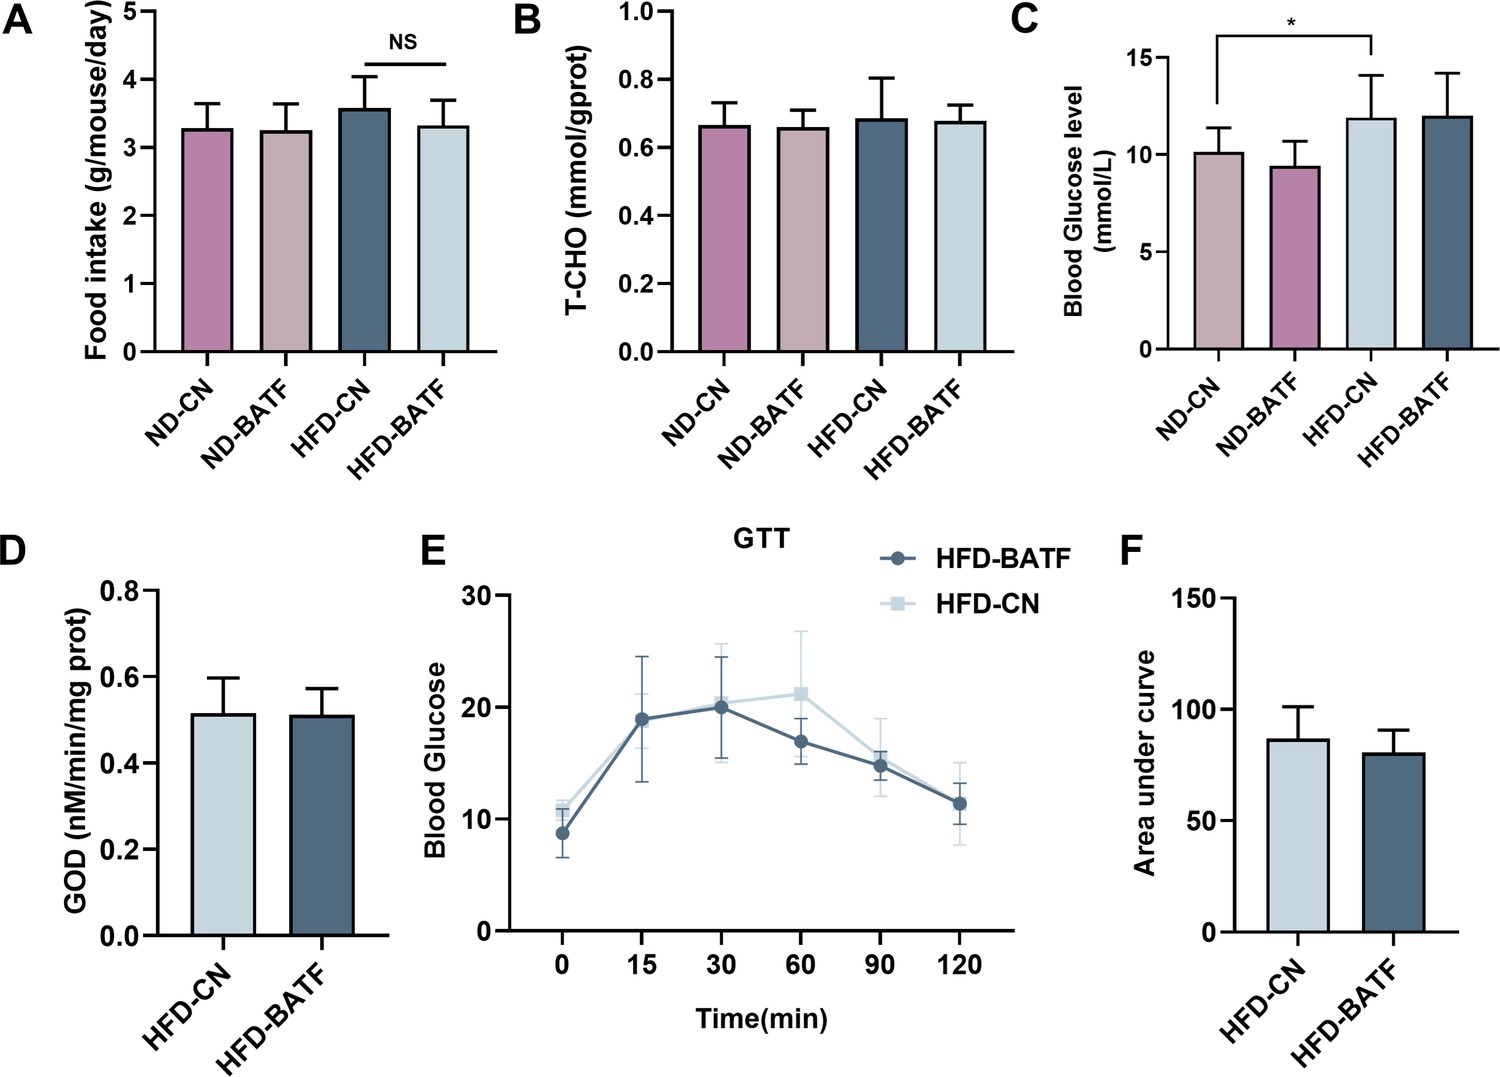
The effect of BATF on metabolic indicators in mice.
(A) Average daily feed intake (n=7). (B) Liver total cholesterol levels (n=8–10). (C) Fasting blood glucose level in mice (n=8–10). (D) Liver glucose oxidase activity. (E) Glucose tolerance test and (F) quantitative analysis (n=5–6). The data are expressed as mean ± SD. *p<0.05, **p<0.01.
-
Figure 2—figure supplement 1—source data 1
The effect of BATF on metabolic indicators in mice.
- https://cdn.elifesciences.org/articles/88521/elife-88521-fig2-figsupp1-data1-v1.zip
Figure 3
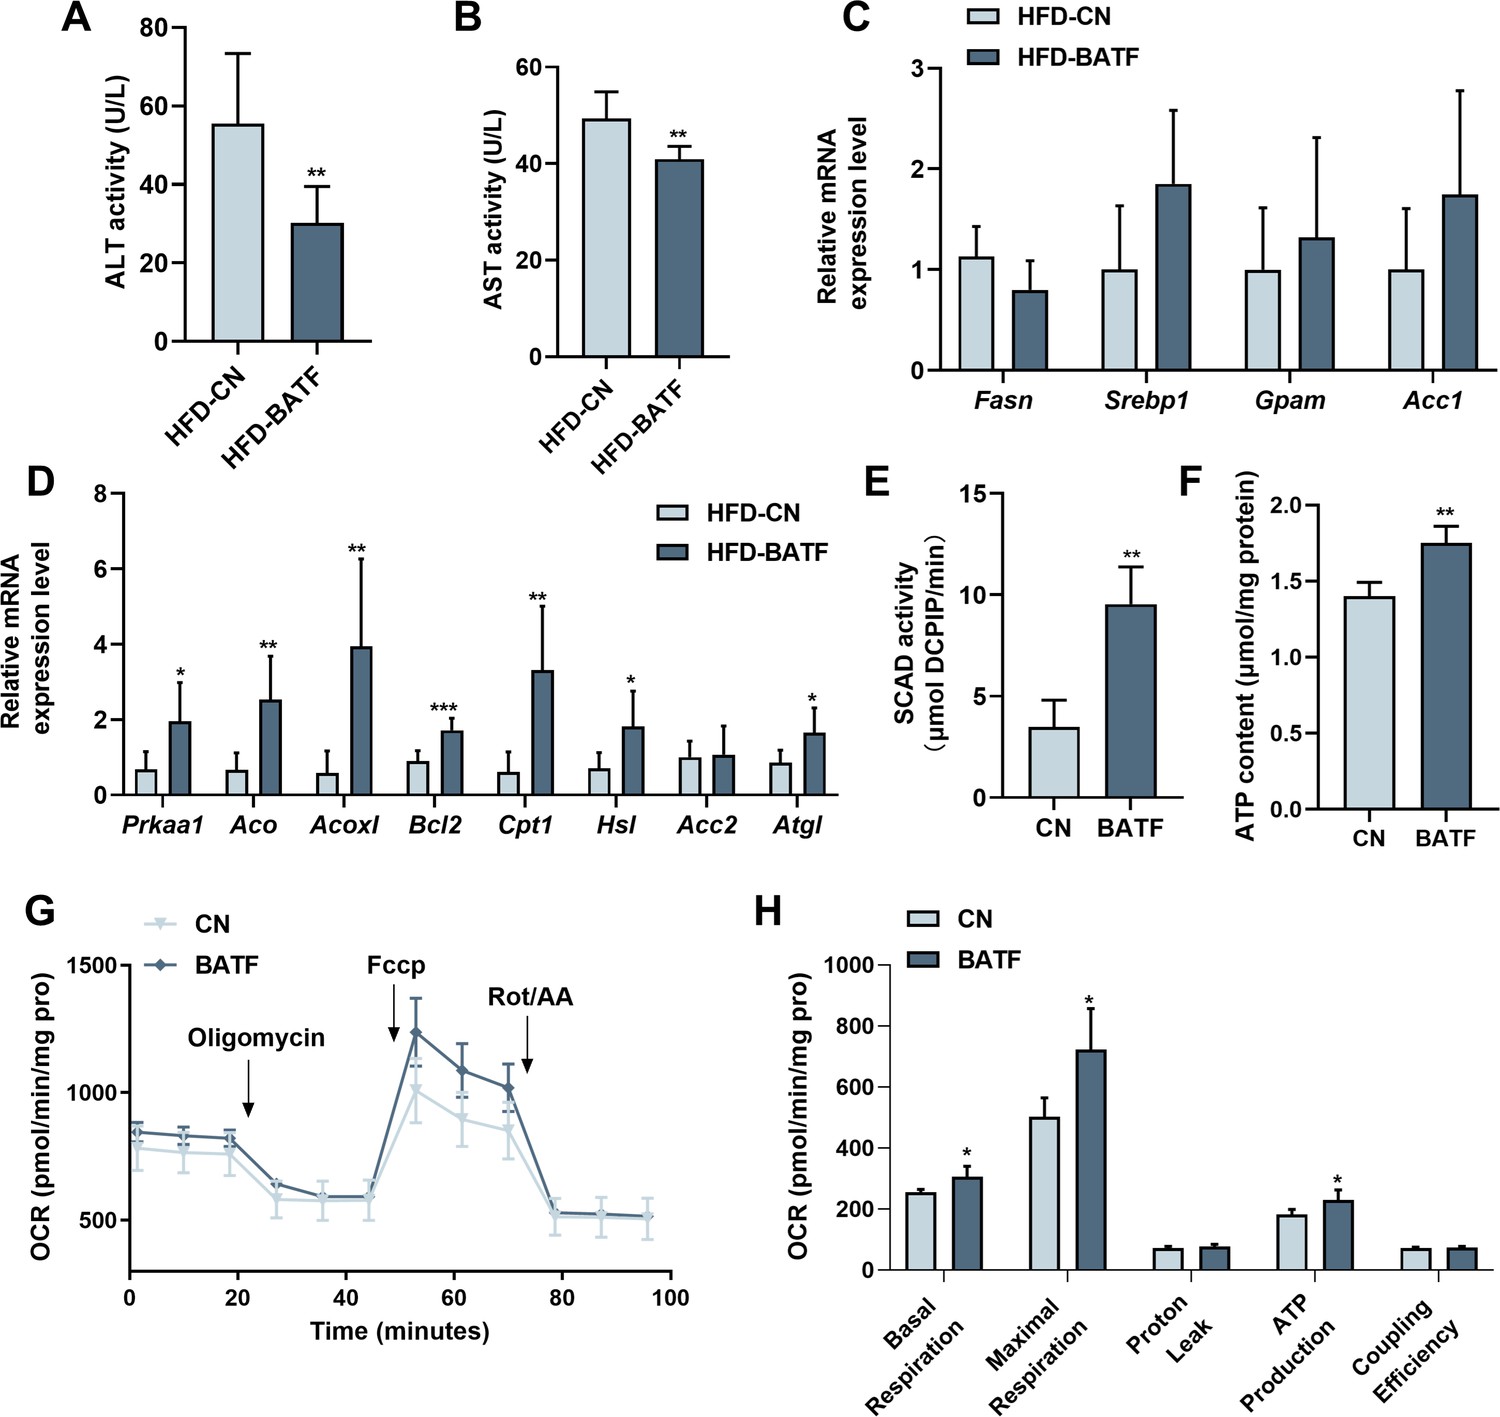
BATF boosts lipid breakdown and energy metabolism in mice livers.
(A) ALT activity in mice liver (n=8). (B) AST activity in mice liver (n=7). (C) The Fasn, Srebp1, Gpam, Acc1 mRNA expression level in mice liver (n=6–8). (D) The AMPKα1, Aco, Acox1, Bcl2, Cpt1, Hsl, Acc2, Atgl mRNA expression level in mice liver (n=6–7). (E) SCAD activity in HepG2 cells with OA/PA treatment (n=4). (F) ATP content in HepG2 cells with OA/PA treatment (n=4). (G) Oxygen consumption rate (OCR). (H) Basal respiration, maximal respiration, proton leak and coupling efficiency. The data are expressed as mean ± SD. *p<0.05, **p<0.01.
-
Figure 3—source data 1
BATF boosts lipid breakdown and energy metabolism in mice livers.
- https://cdn.elifesciences.org/articles/88521/elife-88521-fig3-data1-v1.zip
Figure 4
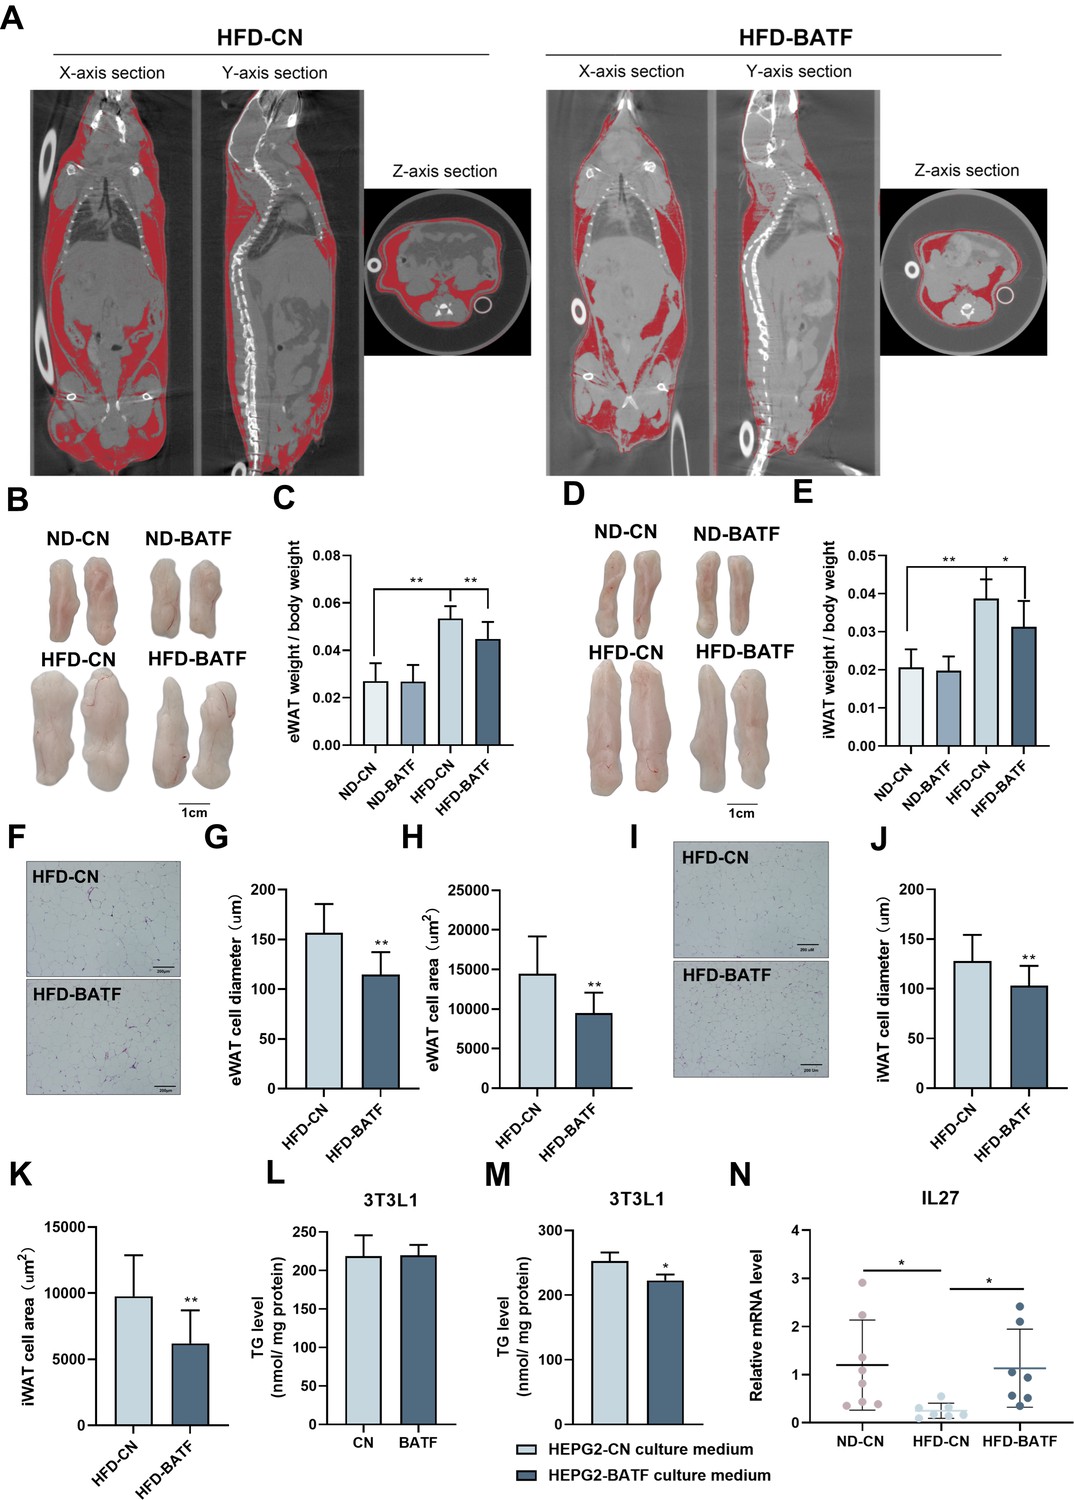
BATF alleviates HFD-induced adipocyte hypertrophy in mice.
(A) CT images of fat axial view. (B) eWAT of mice. Bar, 1 cm. (C) eWAT weight / bodyweight (n=9–10). (D) iWAT of mice. Bar, 1 cm. (E) eWAT weight / bodyweight (n=9–10). (F) HE staining of eWAT, (G) adipocyte diameter and (H) cell area. Bar, 200 μm. (I) HE staining of iWAT, (J) adipocyte diameter and (K) cell area. Bar, 200 μm. (L) Triglyceride content of undifferentiated 3T3L1 cells (n=5). (M) Triglyceride content of differentiated 3T3L1 cells (n=3–4). (N) The mRNA expression of IL27 in liver tissues (n=5). The data are expressed as mean ± SD. *p<0.05, **p<0.01.
-
Figure 4—source data 1
BATF alleviates HFD-induced adipocyte hypertrophy in mice.
- https://cdn.elifesciences.org/articles/88521/elife-88521-fig4-data1-v1.zip
Figure 5
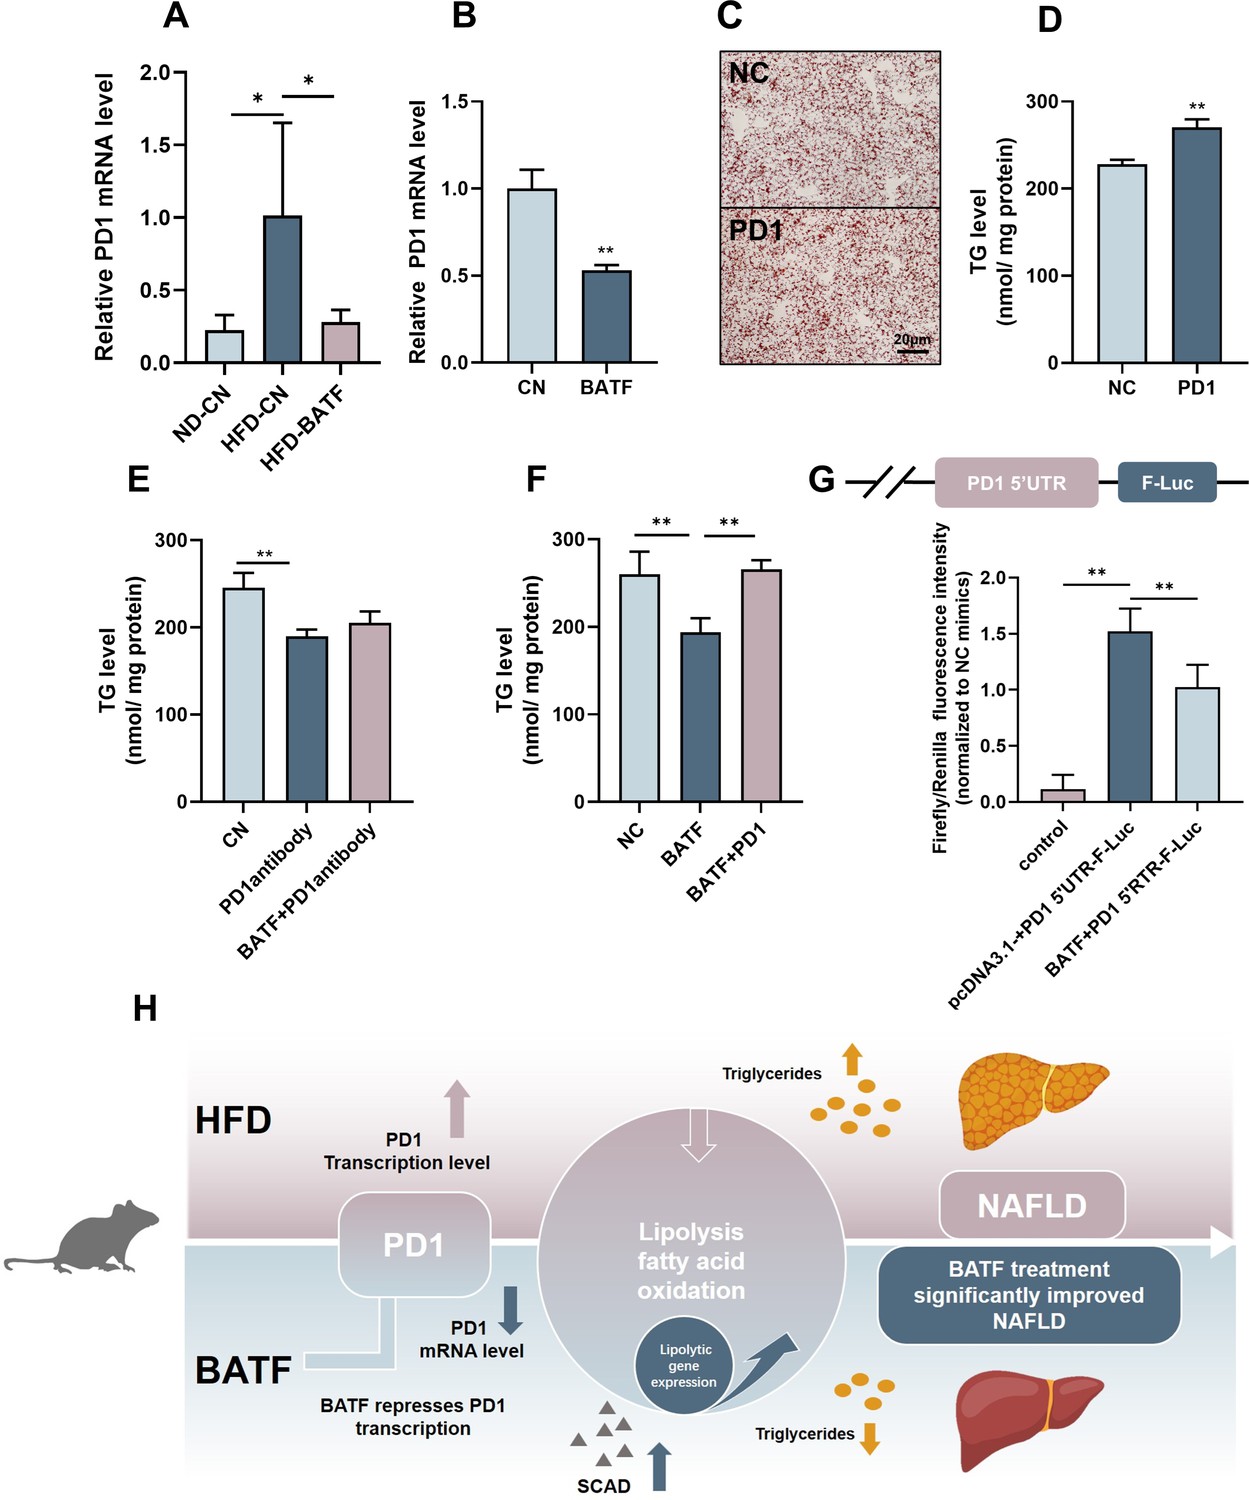
BATF alleviates hepatocyte lipid accumulation by inhibiting PD1.
(A) The mRNA expression of PD1 in liver tissues (n=3). (B) The mRNA expression of PD1 in HepG2 cells (n=3). (C) Oil red O staining of HepG2 cells, Bar, 20 μm, (n=3). (D), (E), (F) Triglyceride content with OA/PA (n≥3). (G) Dual luciferase assay on Hepa1-6 cells cotransfected with firefly luciferase constructs containing the PD1 promoter, Renilla luciferase vector pRL-TK and pcDNA3.1(-) or pcDNA3.1(-)-BATF, (n≥3). (H) The Mechanism diagram of BATF alleviates hepatocyte lipid accumulation by PD1. The data are expressed as mean ± SD. *p<0.05, **p<0.01.
-
Figure 5—source data 1
BATF alleviates hepatocyte lipid accumulation by inhibiting PD1.
- https://cdn.elifesciences.org/articles/88521/elife-88521-fig5-data1-v1.zip
Figure 6
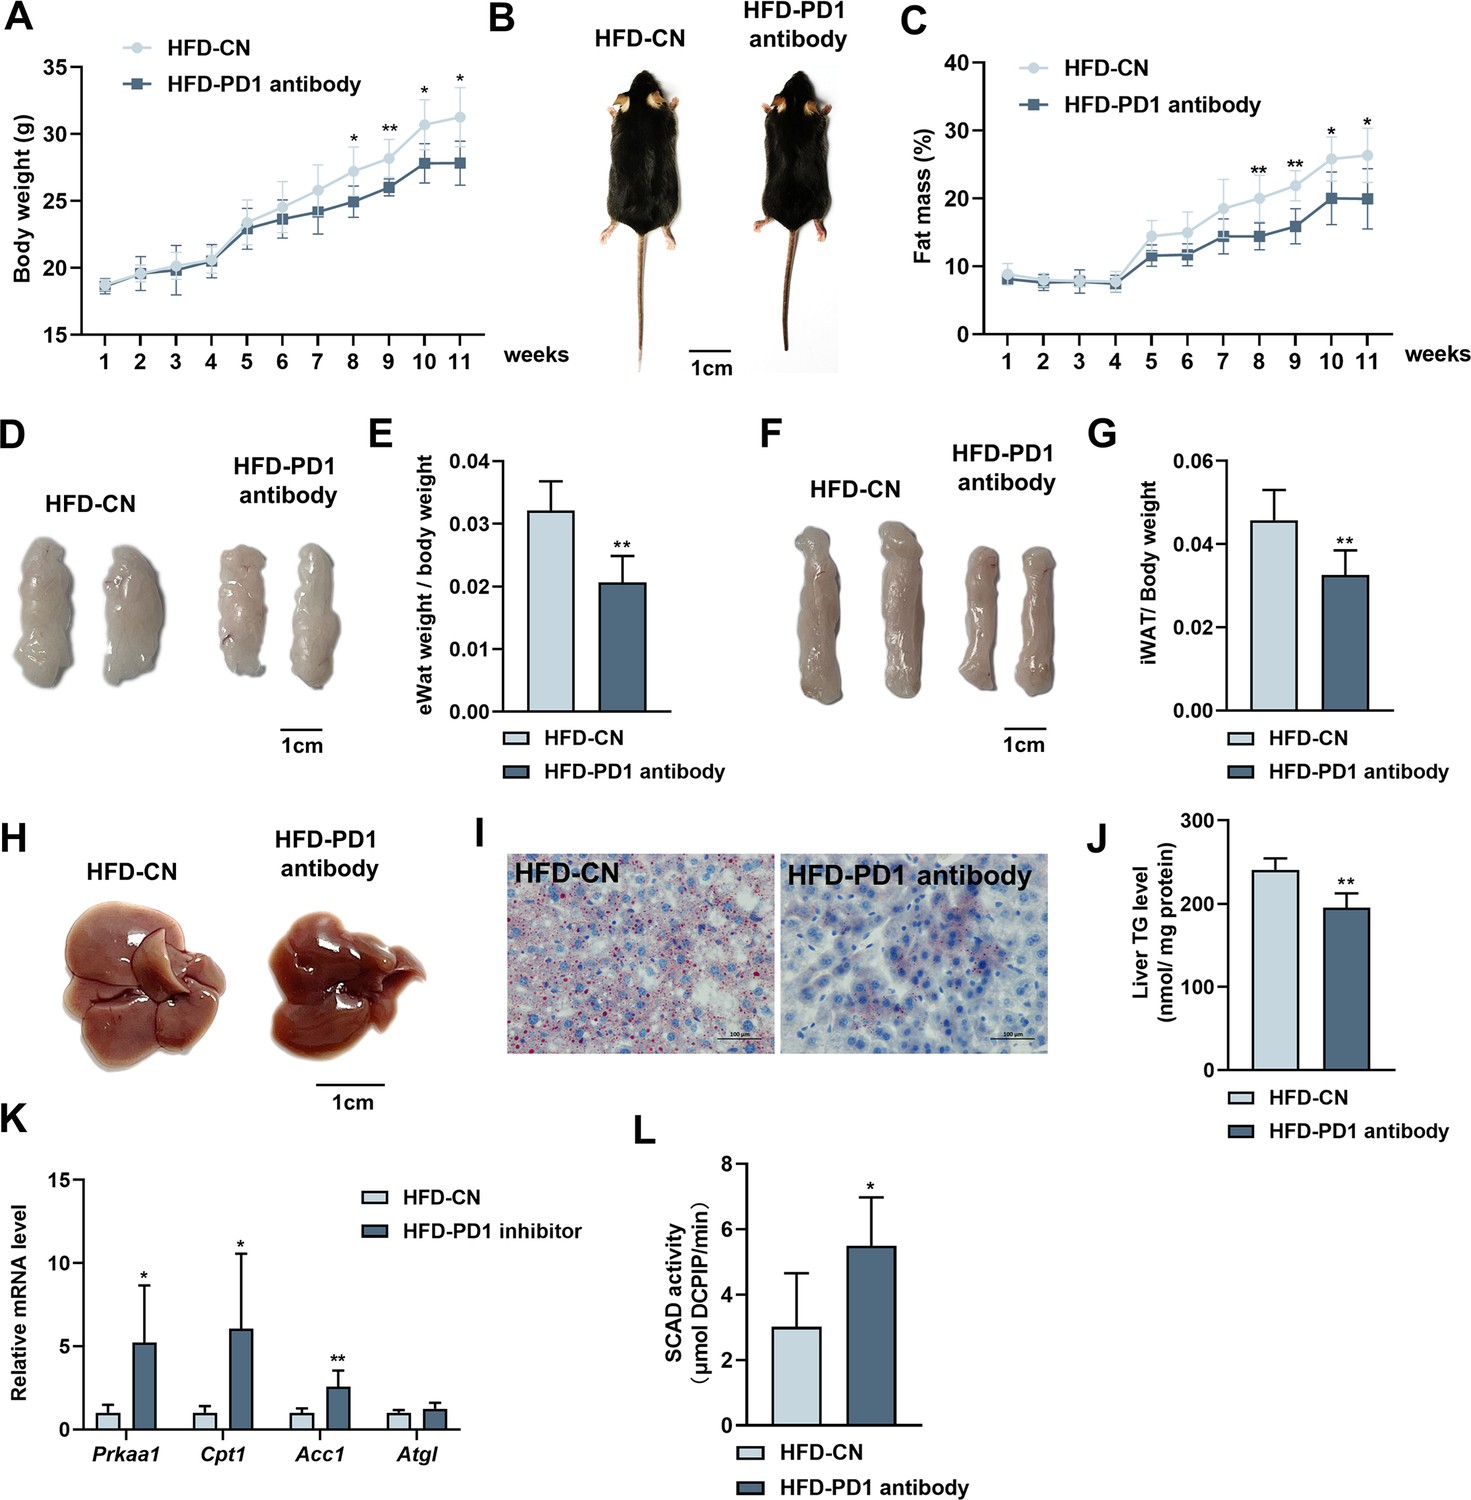
Effects of PD1 antibody on liver lipid metabolism in HFD mice.
(A) Mice bodyweight (n≥5). (B) The mice were injected with IgG or PD1 antibody under HFD (n≥5). (C) Mice fat ratio (n≥5). (D) eWAT of mice. Bar, 1 cm. (E) eWAT weight / bodyweight (n≥5). (F) iWAT of mice. Bar, 1 cm. (G) eWAT weight / bodyweight (n≥5). (H) The liver of mice. (I) HE staining of mice liver sections. Bar, 100 μm. (J) Liver triglyceride (TG) levels. (K) The AMPKα1, Cpt1, Acca, Atgl mRNA expression level in mice liver (n≥5). (L) SCAD activity in liver of mice (n=5). The data are expressed as mean ± SD. *p<0.05, **p<0.01.
-
Figure 6—source data 1
Effects of PD1 antibody on liver lipid metabolism in HFD mice.
- https://cdn.elifesciences.org/articles/88521/elife-88521-fig6-data1-v1.zip
Author response image 1

The expression level of BATF in clumster of cells in the liver.
Author response image 2
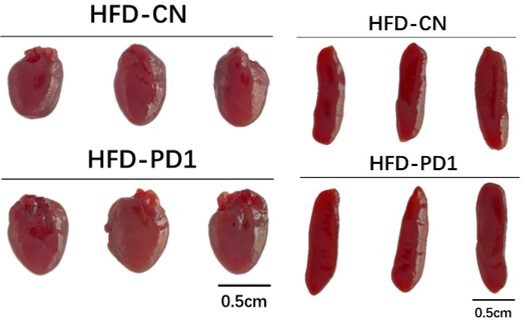
The images of the heart and spleen of mice.
Tables
Key resources table
| Reagent type (species) or resource | Designation | Source or reference | Identifiers | Additional information |
|---|---|---|---|---|
| Gene (Mice) | BATF | GenBank | NM_016767.2 | |
| Strain, strain background (Mus musculus) | C57BL/6 J (Wild type) | Guangxi Medical University | male | |
| Cell line (Human) | HepG2 (hepatocellular carcinoma, youth) | ATCC | ATCC number: HB-8065 | |
| Cell line (Human) | L02 (Normal, fetal liver) | YUCHI Biology | ||
| Cell line (Mus musculus) | Hepa1-6 (Hepatoma) | ATCC | ATCC number: CRL-1830 | |
| Cell line (Mus musculus) | AML12 (Normal, 3-month-old) | ATCC | ATCC number: CRL-2254 | |
| Cell line (Human) | HEK293T (Normal, Kidney) | ATCC | ATCC number: ACS-4500 | |
| Cell line (Mus musculus) | 3T3L1 (Embryo) | ATCC | ATCC number: CL-173 | |
| Transfected construct (Mus musculus) | HBAAV/8-ZsGreen | packaged by HANBIO | ||
| Transfected construct (Mus musculus) | HBAAV2/8-CMV-m-BATF-3×flag-ZsGreen | packaged by HANBIO | Adeno-associated virus construct to transfect and express the BATF. | |
| Biological sample (Mus musculus) | primary hepatocytes | This paper | Materials and methods: Primary hepatocyte isolation and AAV infection | Freshly isolated from C57BL/6 J |
| Antibody | BATF (D7C5) (Rabbit monoclonal) | Cell signaling technology | Cat# 8638 | WB (1:1000) |
| Antibody | Anti-beta Actin (Rabbit polyclonal) | Servicebio | Cat# GB11001 | WB (1:1000) |
| Antibody | Peroxidase AffiniPure Goat Anti-Rabbit IgG (H+L) (Rabbit Polyclonal) | Jackson ImmunoResearch | Cat# 111-035-003 | WB (1:2000) |
| Recombinant DNA reagent | pcDNA3.1(-)-Mice BATF | This paper | Cell culture and transfection | |
| Recombinant DNA reagent | pcDNA3.1(-)-Mice PD1 | This paper | Cell culture and transfection | |
| Recombinant DNA reagent | pMSCV-PIG-BATF | This paper | Retroviral transduction | |
| Recombinant DNA reagent | pUMVC | Add gene | Plasmid #8449 | |
| Recombinant DNA reagent | pCMV-VSV-G | Add gene | Plasmid # 8454 | |
| Recombinant DNA reagent | pGL3-PD1 vector | This paper | Luciferase assay for promoter activity analysis | |
| Recombinant DNA reagent | pRL-TK | Beyotime Biotechnology | D2760 | |
| Sequence-based reagent | siRNA: BATF RNAi | synthesized from Sangon Biotech | ||
| Commercial assay or kit | Triglyceride assay kit | Nanjing Jiancheng Bioengineering Institute | Cat# A110-1-1 | |
| Commercial assay or kit | Total cholesterol | Nanjing Jiancheng Bioengineering Institute | Cat# A111-1-1 | |
| Commercial assay or kit | Tissue SCAD assay kit | Gen Med | Cat# GMS 50119.2.1 | |
| Commercial assay or kit | Alanine transaminase (ALT) | Nanjing Jiancheng Bioengineering Institute | Cat# C009-2-1 | |
| Commercial assay or kit | Aspartate aminotransferase (AST) | Nanjing Jiancheng Bioengineering Institute | Cat# C010-2-1 | |
| Commercial assay or kit | Cellular ATP content | Beyotime Biotechnology | Cat# S0026 | |
| Commercial assay or kit | RNA Reverse Transcription System | Promega | Cat# A3500 | |
| Commercial assay or kit | ClonExpress II One Step Cloning Kit | Vazyme | Cat# C112-01/02 | |
| Commercial assay or kit | Dual-Lumi II Luciferase Reporter gene Assay kit | Beyotime Biotechnology | Cat# PG089S | |
| Commercial assay or kit | Cellular ATP content | Beyotime Biotechnology | Cat# S0026 | |
| Chemical compound, drug | High-fat-diet (HFD) | Trophic Animal Feed High-tech Co. Ltd | TP2330055M | standar: D12492 |
| Chemical compound, drug | Normal diet (ND) | Trophic Animal Feed High-tech Co. Ltd | TP2330055MC | standar: AIN93 |
| Chemical compound, drug | Oleic acid (OA) | Sigma-Aldrich | Cat# O1383 | |
| Chemical compound, drug | Palmitic acid (PA) | Sigma-Aldrich | Cat# P0500 | |
| Software, algorithm | Image J | National Institutes of Health | https://Imagej.nih.gov/ij/ | |
| Software, algorithm | Adobe Photoshop CS6 | Adobe | https://www.adobe.com/cn | |
| Software, algorithm | GraphPad Prism 8.0.1 | GraphPad | https://www.graphpad.com/ | |
| Other | InVivoPlus anti-mouse PD1 (CD279) (Mouse RMP1-14) | Bio X Cell | Cat# BP0146 | Intraperitoneal injection: 200 μg/mouse |
| Other | Rat IgG-Isotype Control (Rat monoclonal) | abcam | Cat# ab37361 | Intraperitoneal injection: 200 μg/mouse |
Additional files
Download links
A two-part list of links to download the article, or parts of the article, in various formats.
Downloads (link to download the article as PDF)
Open citations (links to open the citations from this article in various online reference manager services)
Cite this article (links to download the citations from this article in formats compatible with various reference manager tools)
BATF relieves hepatic steatosis by inhibiting PD1 and promoting energy metabolism
eLife 12:RP88521.
https://doi.org/10.7554/eLife.88521.3


