SNAP25 disease mutations change the energy landscape for synaptic exocytosis due to aberrant SNARE interactions
- Department of Neuroscience, University of Copenhagen, Denmark
- Heidelberg University Biochemistry Center, Germany
- Department of Physics, University of Helsinki, Finland
Figures
Figure 1
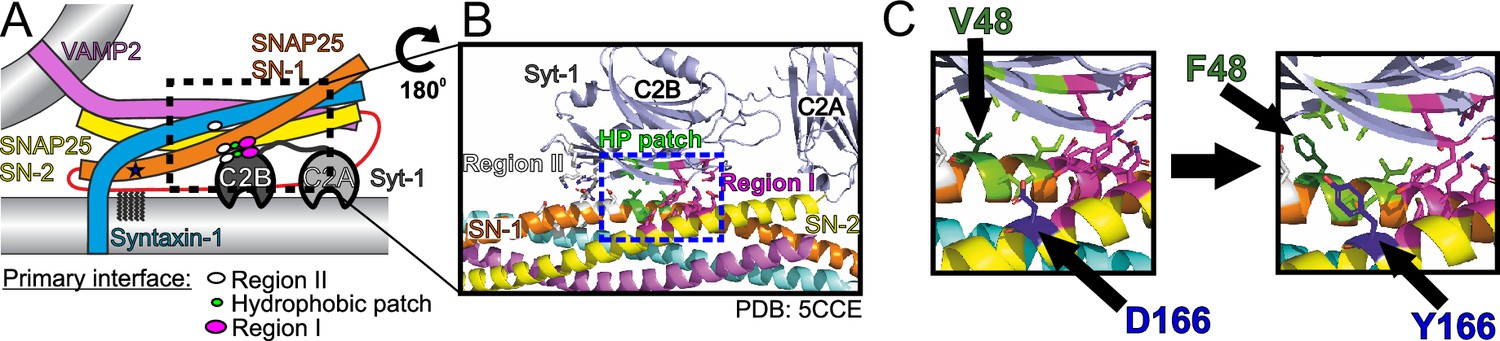
Localization of three pathogenic mutations in SNAP25.
(A) Schematic of the neuronal SNARE complex interacting with C2B domain of synaptotagmin-1 (Syt1; not to scale) via the primary interface. Position of the I67N mutation in the first SNARE domain of SNAP25 is depicted by an asterisk. (B) Interaction site of the C2B domain of Syt1 and SNAP25. Syt1 interacts with SNAP25 both electrostatically (regions I and II) and within the hydrophobic patch (HP patch) (Zhou et al., 2015). (C) Position of the disease-linked mutations V48F (hydrophobic patch) and D166Y (region I) in the SNARE complex.
Figure 2
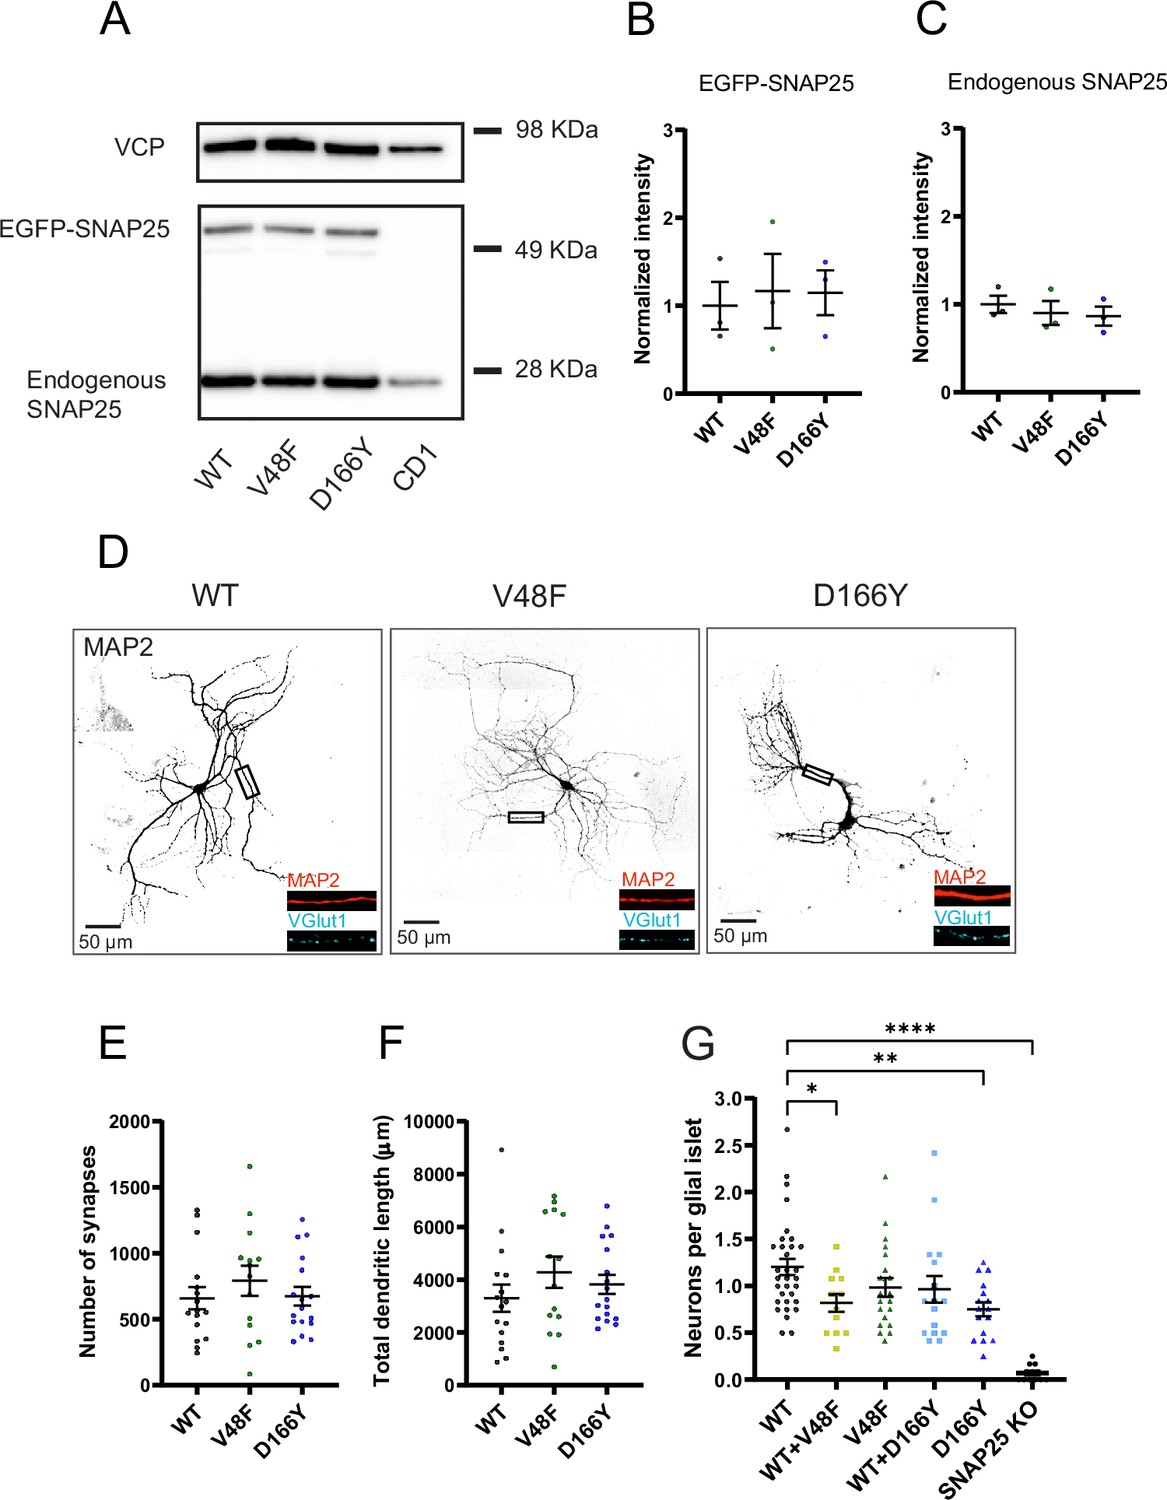
Pathogenic SNAP25 mutations compromise neuronal viability, but not synaptogenesis.
(A) SNAP25b V48F and D166Y mutations are similarly expressed as the wildtype (WT) SNAP25b protein. EGFP-SNAP25b was overexpressed in neurons from CD1 (WT) mice; both endogenous and overexpressed SNAP25 are shown. Valosin-containing protein (VCP) was used as loading control. Quantification of EGFP-SNAP25b (B) and endogenous SNAP25 (C) from Western blots (as in A). Displayed are the intensity of EGFP-SNAP25b or endogenous SNAP25 bands, divided by the intensity of VCP bands, normalized to the WT situation (n = 3 independent experiments). The expression level of mutants was indistinguishable from expressed WT protein (analysis of variance, ANOVA). (D) Representative images of control (WT) and mutant (V48F, D166Y) hippocampal neurons stained by dendritic (MAP2) and synaptic (VGlut1) markers. Displayed is MAP2 staining, representing the cell morphology, in inserts MAP2 staining is depicted in red and VGlut staining in cyan. The scale bar represents 50 µm. (E) Number of synapses per neuron in WT and mutant cells. (F) Total dendritic length of WT and mutant neurons. (G) Cell viability represented as the number of neurons per glia island. ****p < 0.0001, **p < 0.01, *p < 0.05, Brown–Forsythe ANOVA test with Dunnett’s multiple comparisons test.
-
Figure 2—source data 1
Excel file containing quantitative data.
- https://cdn.elifesciences.org/articles/88619/elife-88619-fig2-data1-v2.zip
-
Figure 2—source data 2
Original files for the Western blot analysis in Figures 2A and 10A (anti-SNAP25 and anti-VCP).
- https://cdn.elifesciences.org/articles/88619/elife-88619-fig2-data2-v2.zip
-
Figure 2—source data 3
PDF containing Figure 2A and 10A, and original scans of the Western blots with highlighted bands and sample labels.
- https://cdn.elifesciences.org/articles/88619/elife-88619-fig2-data3-v2.zip
Figure 3
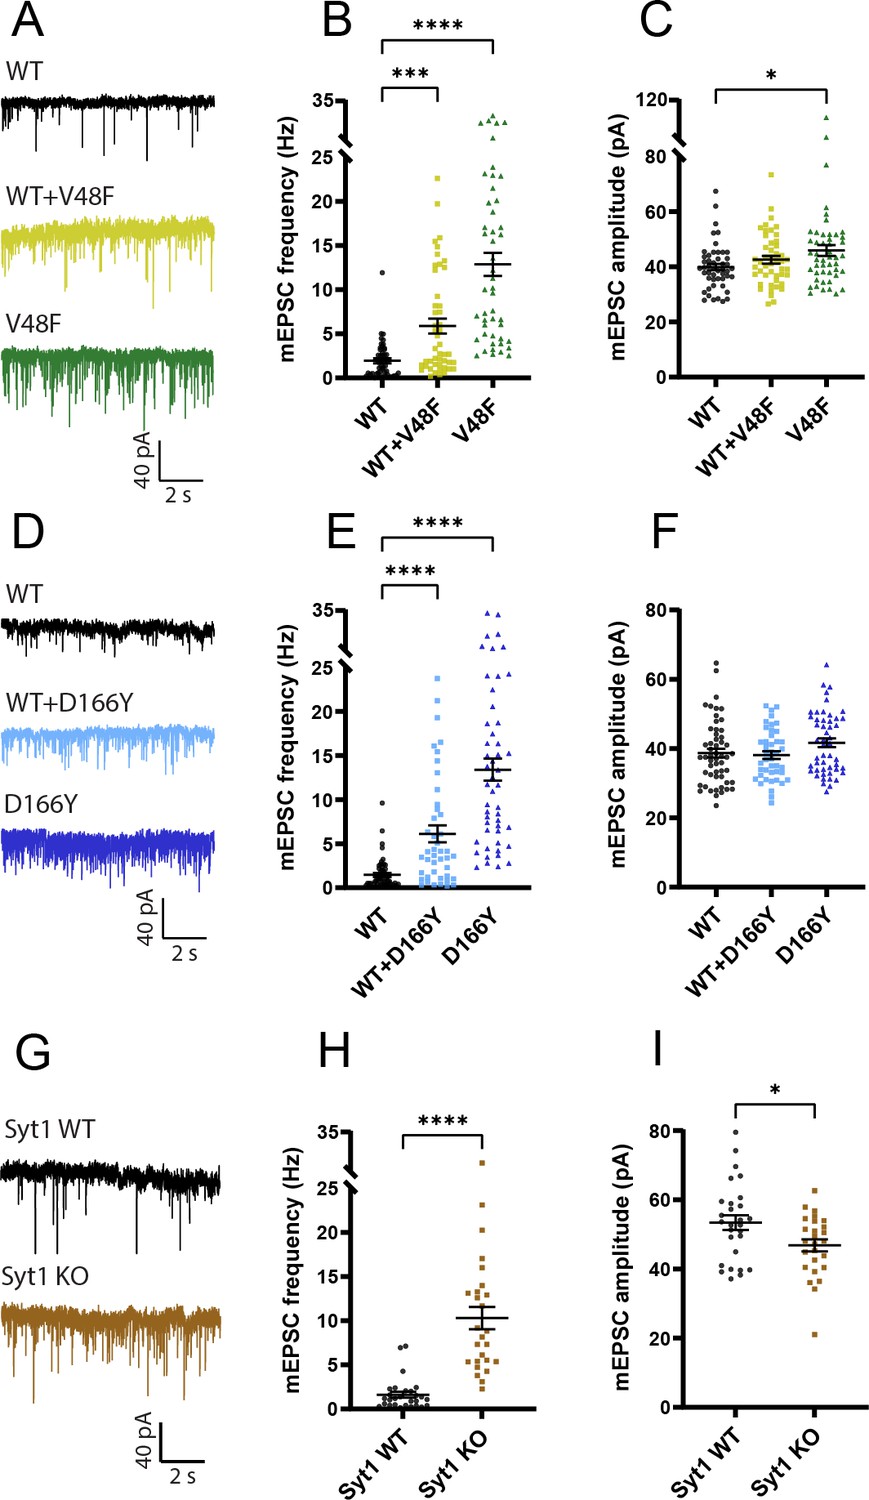
V48F and D166Y mutations increase mEPSC frequency.
(A, D, G) Example traces of mEPSC release for wildtype (WT), mutant, and 1:1 co-expression of WT and mutant SNAP25b, or (G) Syt1 WT and knockout (KO). (B, E) The mEPSC frequencies were increased in both V48F and D166Y mutants and co-expressed conditions (V48F: n = 49, 47, 48 for WT, co-expressed, and mutant conditions, respectively; D166Y: n = 54, 43, 50). ****p < 0.0001, ***p < 0.001, Brown–Forsythe analysis of variance (ANOVA) test with Dunnett’s multiple comparisons test. (C, F) mEPSC amplitudes were on average increased by the V48F and D166Y mutations; this was significant for the V48F. *p <0 .05, ANOVA with Dunnett’s multiple comparison test. (H, I) Syt1 WT and KO data (Syt1: n = 28, 26 for the WT and KO condition). The mEPSC frequencies and amplitudes were increased and decreased in the KO, respectively. ****p < 0.0001, Welch’s t-test, *p < 0.05, unpaired t-test.
-
Figure 3—source data 1
Excel file containing quantitative data.
- https://cdn.elifesciences.org/articles/88619/elife-88619-fig3-data1-v2.zip
Figure 4 with 2 supplements

V48F and D166Y mutations reduce the amplitude of the eEPSC.
(A, E, I) Example evoked excitatory postsynaptic currents (eEPSC) for wildtype (WT), SNAP25b mutants, and co-expressed WT/mutants, or (I) Syt1 WT and knockout (KO). (B, F, J) eEPSC amplitude was decreased by both SNAP25b mutations (V48F: n = 50, 50, 45 for WT, co-expressed, and mutant conditions, respectively; D166Y: n = 56, 35, 44) and by Syt1 KO (Syt1: n = 19, 26 for the WT and KO condition). SNAP25b mutations: ****p < 0.0001, **p < 0.01, Brown–Forsythe analysis of variance (ANOVA) test with Dunnett’s multiple comparisons test; Syt1: ****p < 0.0001, Welch’s t-test. (C, G, K) Overall evoked charge after a single depolarization (V48F: n = 50, 45, 50 for WT, mutant, and co-expressed conditions, respectively; D166Y: 56, 44, 35; Syt1: 19, 20 for WT and KO). SNAP25b: *p < 0.05, Brown–Forsythe ANOVA with Dunnett’s multiple comparison test; Syt1: ****p < 0.0001, Welch’s t-test. (D, H, L) Fractional contribution of the synchronous release component to the overall charge (V48F: n = 50, 50, 45 for WT, co-expressed, and mutant conditions, respectively; D166Y: 56, 35, 44; Syt1: 19, 20 for WT and KO). SNAP25b: ****p < 0.0001, ***p < 0.001, Brown–Forsythe ANOVA (V48F) or standard ANOVA (D166Y) with Dunnett’s multiple comparisons test; Syt1: ****p < 0.0001, Welch’s t-test.
-
Figure 4—source data 1
Excel file containing quantitative data.
- https://cdn.elifesciences.org/articles/88619/elife-88619-fig4-data1-v2.zip
Figure 4—figure supplement 1
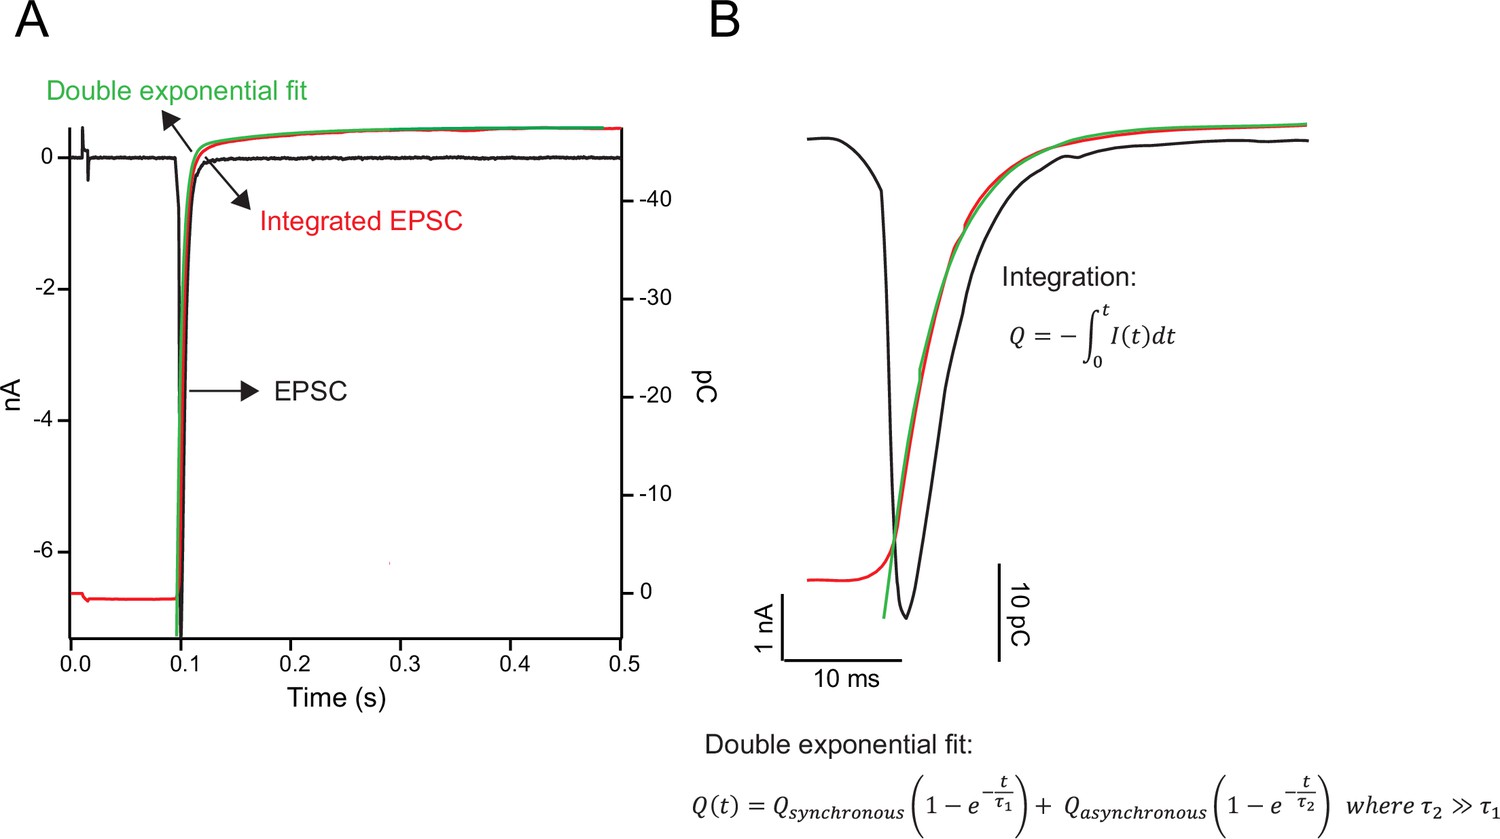
Kinetic parameters of evoked EPSCs.
(A) eEPSC (black trace), and integrated eEPSC (after multiplication with −1, red trace) with double exponential fit (green trace). (B) Zoom-in of eEPSC (black trace), and integrated eEPSC (after multiplication with −1, red trace) with double exponential fit (green trace). Equations for integration and double exponential function used for fit are given.
Figure 4—figure supplement 2

Kinetic parameters of eEPSCs.
(A, E, I) Synchronous release components (A), V48F: n = 50, 50, 45 for wildtype (WT), co-expressed, and mutant conditions, respectively; E, D166Y: n = 56, 35, 44; I, Syt1: 19, 20 for WT and knockout [KO]. (A) *p < 0.05, Welch’s analysis of variance (ANOVA) with Dunnett’s multiple comparison test, (E) ***p < 0.001, Brown–Forsythe ANOVA with Dunnett’s multiple comparison test, (I) ****p < 0.0001, Welch’s unpaired t-test. (B, F, J) Asynchronous release components. (B) **p < 0.01; *p < 0.05, Brown–Forsythe ANOVA with Dunnett’s multiple comparison test. (C, G, K) Fast time constants. (C): ****p < 0.0001; **p < 0.01, Brown–Forsythe ANOVA with Dunnett’s multiple comparison test, G: ****p < 0.0001, Brown–Forsythe ANOVA with Dunnett’s multiple comparison test, K: ****p < 0.0001, Welch’s unpaired t-test. (D, H, L) Slow time constants. Source Data containing quantitative data are found in the Source Data files for Figure 4.
Figure 5
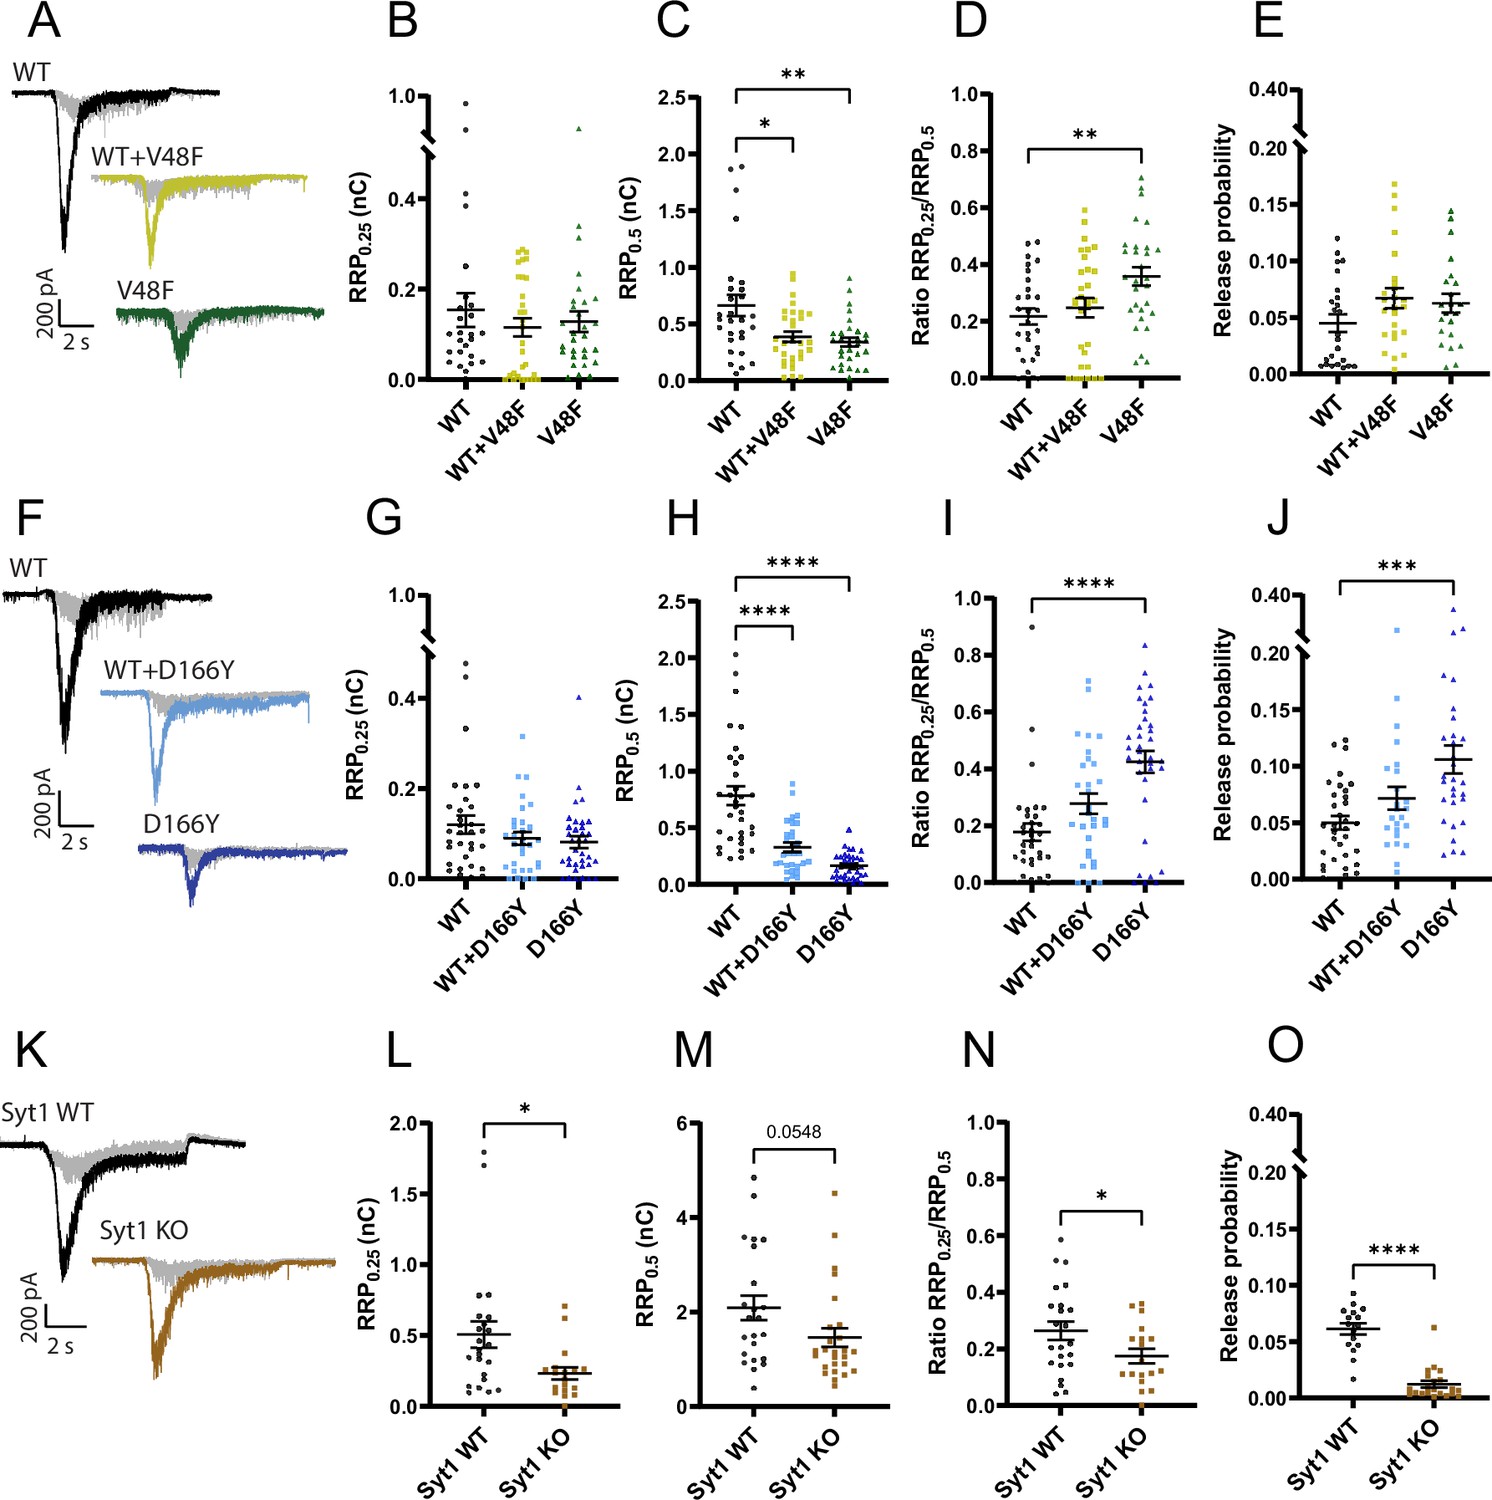
The apparent energy barrier for vesicle fusion is lowered by V48F and D166Y, but not by removing Syt1.
(A, F, K) Example traces for the wildtype (WT), mutant, and co-expressed condition. Each cell was stimulated by 0.25 M (in gray) and 0.5 M sucrose (in black or color). (B, G, L) The charge released by 0.25 M sucrose (V48F: n = 28, 30, 29 for WT, co-expressed, and mutant conditions, respectively; D166Y: n = 33, 30, 35; Syt1: n = 23, 18 for WT and knockout [KO]). Syt1: p < 0.05, Welch’s t-test. (C, H, M) The charge released by 0.5 M sucrose (V48F: n = 28, 30, 29 for WT, co-expressed, and mutant conditions, respectively; D166Y: n = 33, 30, 35; Syt1: n = 23, 26 for WT and KO). SNAP25b: ****p < 0.0001, **p < 0.01, *p < 0.05, Brown–Forsythe analysis of variance (ANOVA) with Dunnett’s multiple comparisons test; Syt1: p = 0.0548, unpaired t-test. (D, I, N) The ratio of 0.25 and 0.5 M sucrose pool (V48F: n = 28, 30, 29 for WT, co-expressed, and mutant conditions, respectively; D166Y: n = 33, 30, 35; Syt1: n = 23, 18 for WT and KO). SNAP25b: ****p < 0.0001, **p < 0.01, ANOVA with Dunnett’s multiple comparisons test; Syt1: *p < 0.05, unpaired t-test. (E, J, O) Release probability calculated by dividing the charge of an eEPSC with the 0.5 M sucrose pool (V48F: n = 24, 25, 22 for WT, co-expressed, and mutant conditions, respectively; D166Y: n = 33, 24, 30; Syt1, n = 16, 21 for WT and KO). SNAP25b: ***p < 0.001, ANOVA with Dunnett’s multiple comparisons test; Syt1: ****p < 0.0001, unpaired t-test.
-
Figure 5—source data 1
Quantitative data.
- https://cdn.elifesciences.org/articles/88619/elife-88619-fig5-data1-v2.zip
Figure 6 with 1 supplement
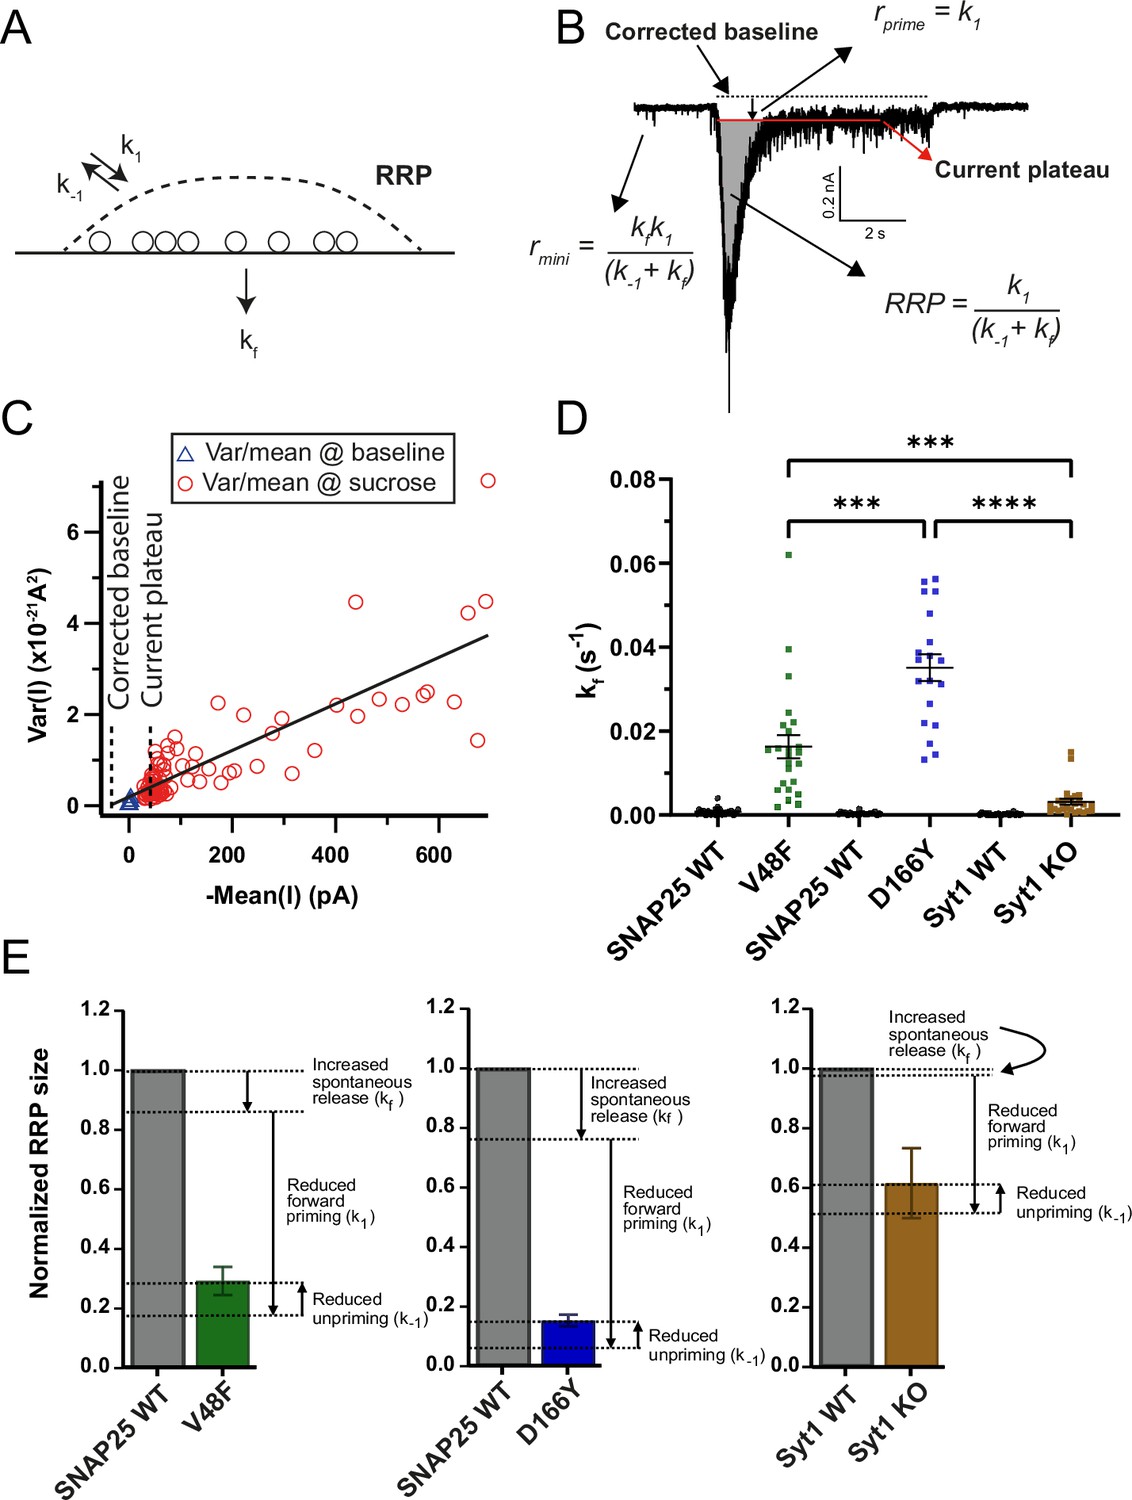
Dissection of the readily releasable pool (RRP) reduction in V48F and D166Y mutations.
(A) One-pool model of the RRP. k1 is the rate of priming (units vesicles/s), k−1 is the rate of depriming (s−1), and kf is the rate of fusion (s−1). (B) Estimation of the three parameters from the response to 0.5 M sucrose and a measurement of the spontaneous release rate. (C) Variance-mean analysis in 50-ms intervals during the sucrose application allows determination of the corrected baseline by back-extrapolation of a regression line to the variance of the baseline. (D) Normalized mEPSC frequency (kf) for V48F, D166Y, and Syt1 knockout (KO) (V48F: n = 23, 24 for wildtype [WT] and mutant conditions, respectively; D166Y: n = 19, 19; Syt1: n = 23, 26). Brown–Forsythe analysis of variance (ANOVA) test with Dunnett’s multiple comparison test, testing the three mutant conditions against each other. ****p < 0.0001, ***p < 0.001. (E) Normalized RRP size for WT and mutant conditions, with indications of the effect of the mutant-induced changes in k1, k−1, and kf on the RRP size.
-
Figure 6—source data 1
Excel file containing quantitative data.
- https://cdn.elifesciences.org/articles/88619/elife-88619-fig6-data1-v2.zip
Figure 6—figure supplement 1
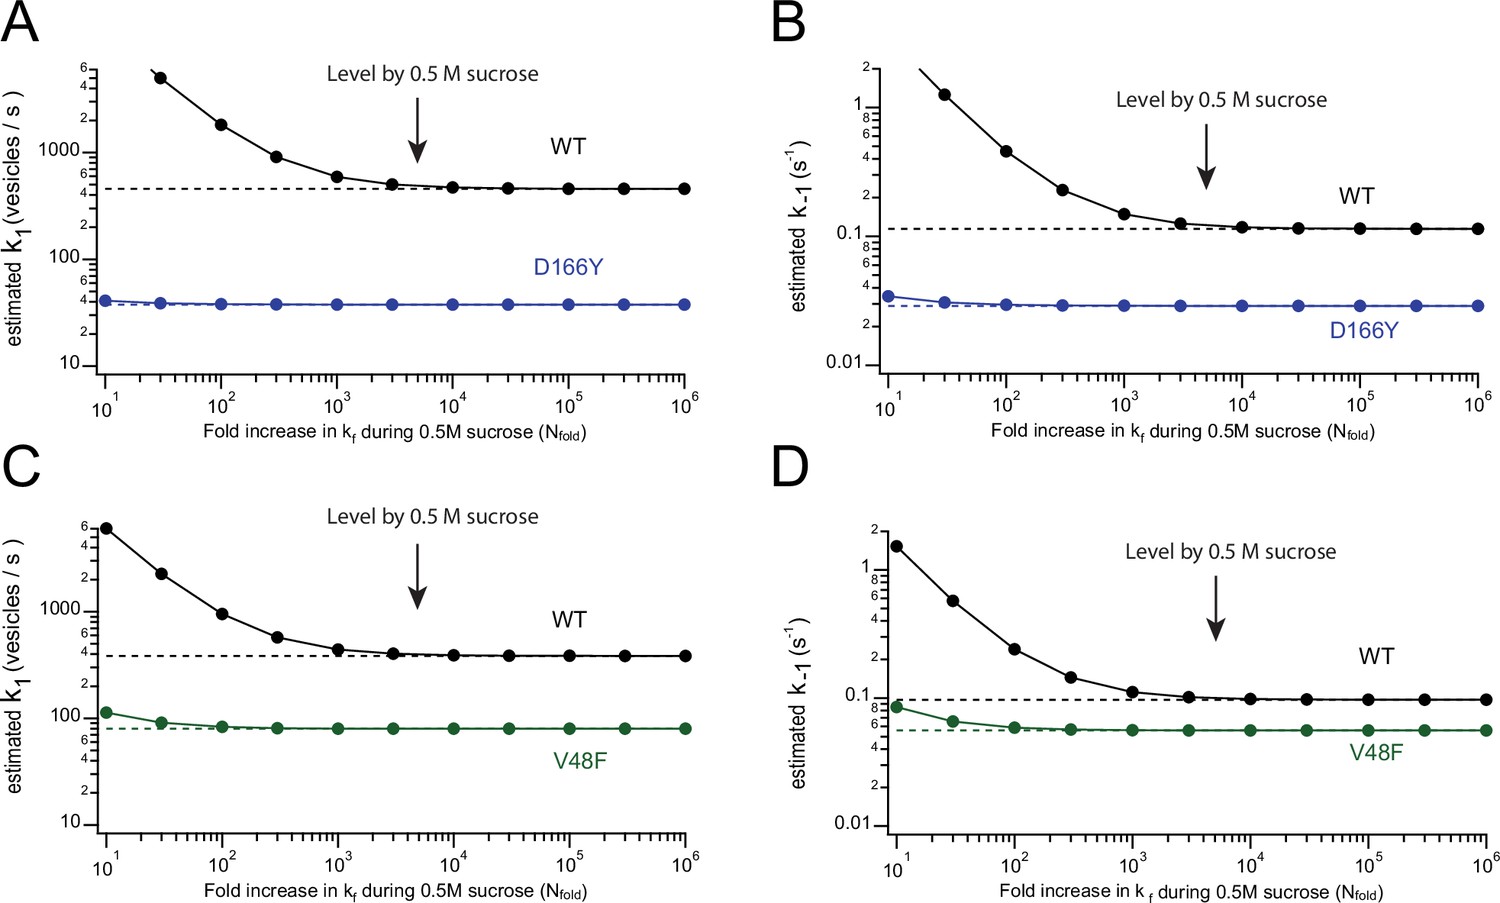
Effect of sucrose stimulation on estimates of k1 and k−1.
The figure shows the effect of the fold-increase in fusion rate (N) induced by sucrose (abscissa) on the estimates of k1 (A, C) or k−1 (B, D) using Equations 3 and 4, Equation 5b and the values estimated for D166Y (A, B), V48F (C, D), and wildtype (WT) (Table 1). Previous data showed that 0.5 M sucrose increases the fusion rate by a factor ~5000 (Schotten et al., 2015). The plots show that the estimates in Table 1 are not strongly affected by small changes in the effect of sucrose upon kf.
Figure 7 with 2 supplements
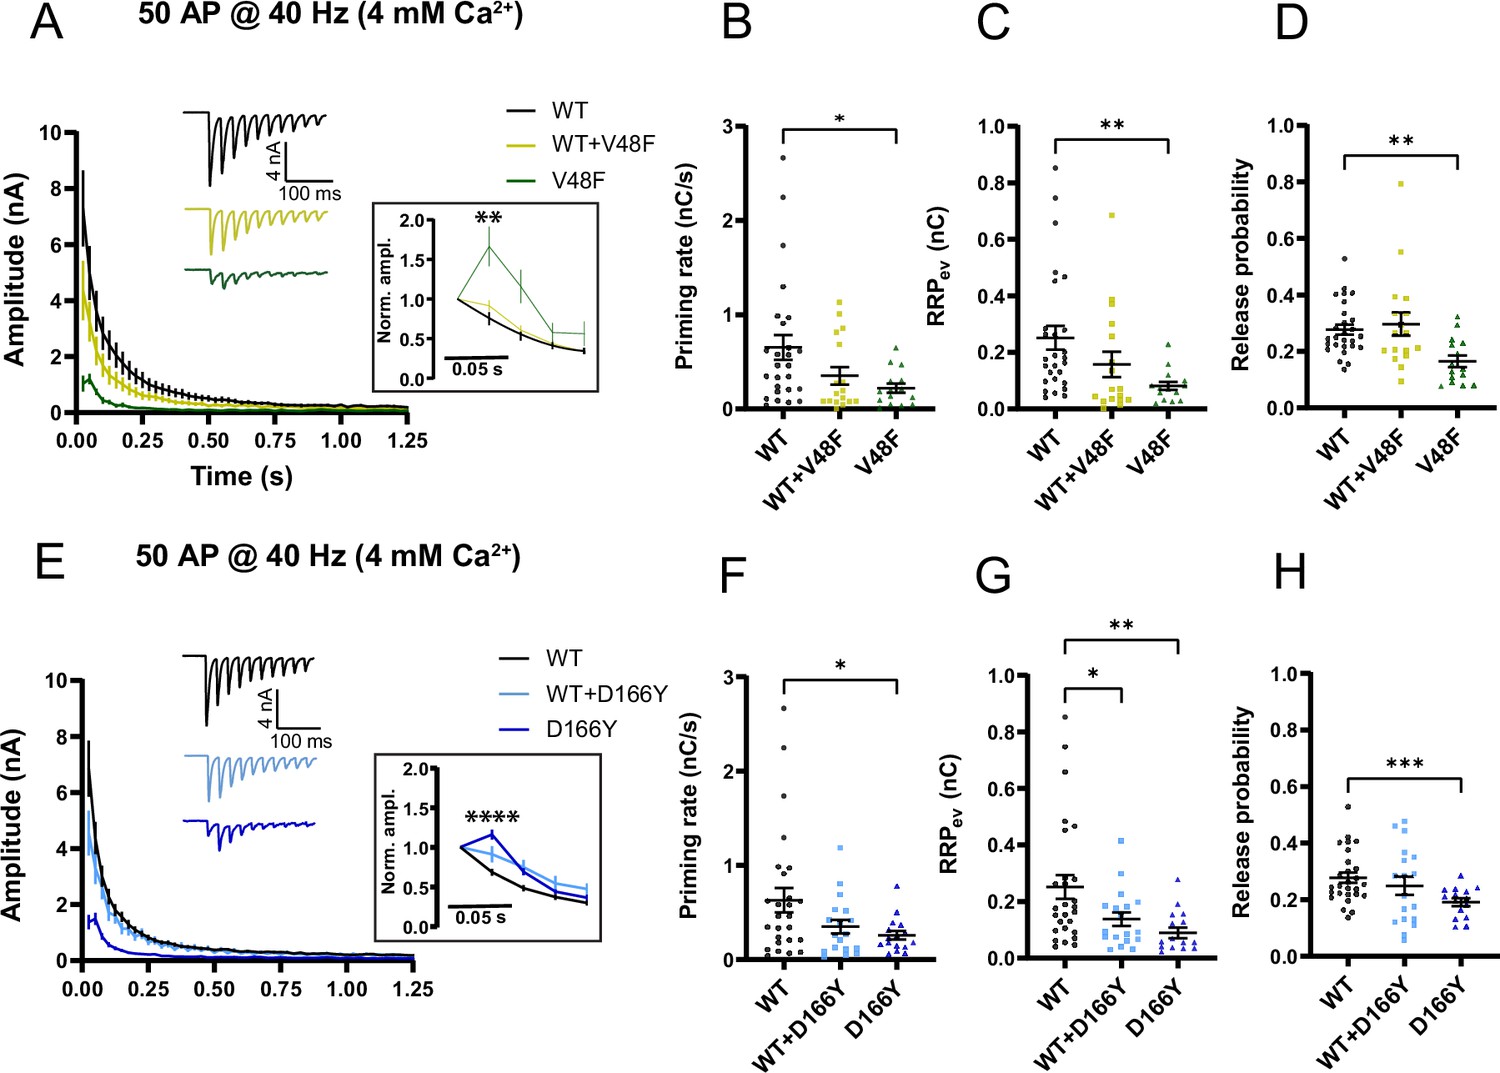
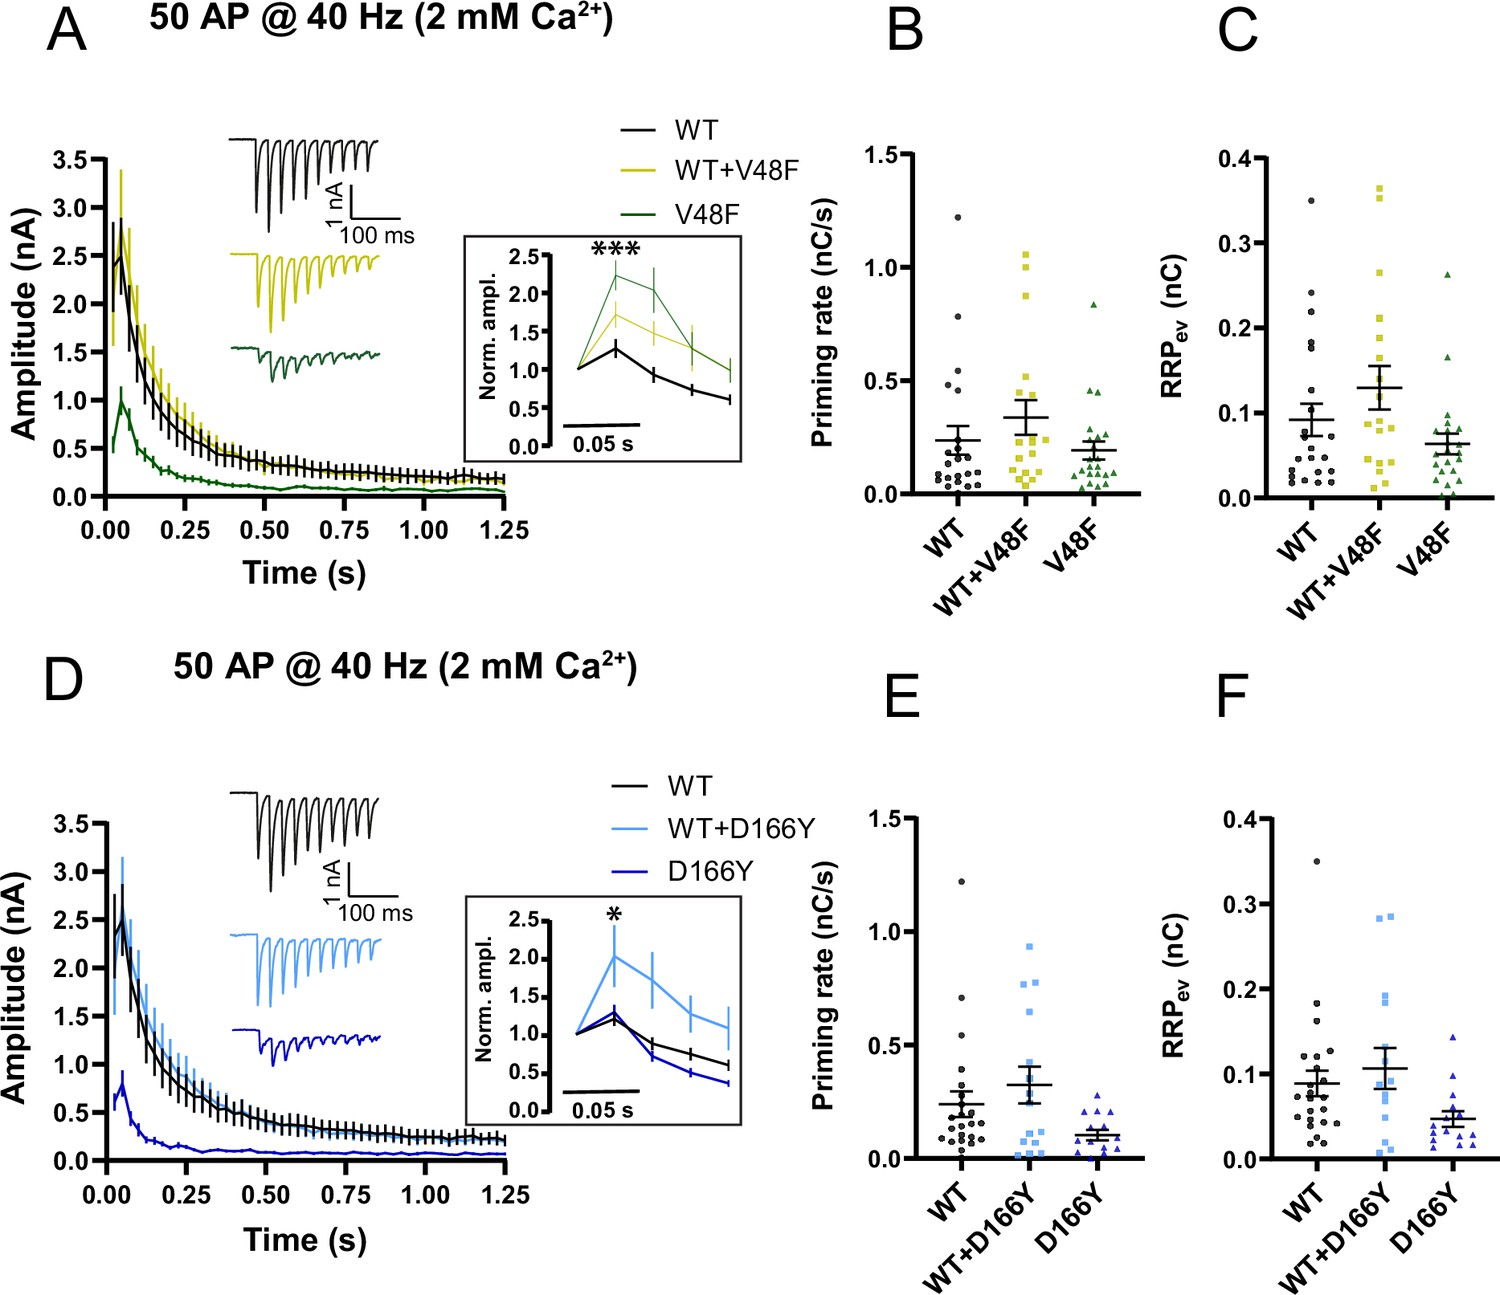
SNAP25 V48F and D166Y mutations change short-term plasticity toward facilitation.
(A, E) eEPSCs in response to 50 APs at 40 Hz recorded in 4 mM extracellular Ca2+ (V48F: 27, 17, 15 for wildtype [WT], co-expressed, and mutant conditions, respectively; D166Y: 27, 18, 16). Inserts: Normalized eEPSC amplitudes demonstrating facilitation of mutant conditions. ****p < 0.0001; **p < 0.01, Brown–Forsythe analysis of variance (ANOVA) with Dunnett’s multiple comparison test. (B, F) Priming rate calculated as the slope of a linear fit to the cumulative evoked charges during the last part of stimulation (V48F: 27, 17, 15 for WT, co-expressed, and mutant conditions, respectively; D166Y: 27, 18, 16). *p < 0.05, ANOVA (V48F) or Brown–Forsythe ANOVA (D166Y) with Dunnett’s multiple comparisons test. (C, G) Readily releasable pool (RRP) calculated by back-extrapolation of a linear fit to the cumulative evoked charges during the last part of stimulation (V48F: 27, 17, 15 for WT, co-expressed, and mutant conditions, respectively; D166Y: 27, 18, 16). **p < 0.01, *p < 0.05, ANOVA (V48F), or Brown–Forsythe ANOVA (D166Y) with Dunnett’s multiple comparisons test. (D, H) Release probability calculated as the charge of the first evoked response divided by the RRP obtained by back-extrapolation (V48F: 27, 17, 15 for WT, co-expressed, and mutant conditions, respectively; D166Y: 27, 18, 16). ***p < 0.001; **p < 0.01, ANOVA (V48F), or Brown–Forsythe ANOVA (D166Y) with Dunnett’s multiple comparisons test.
-
Figure 7—source data 1
Excel file containing quantitative data.
- https://cdn.elifesciences.org/articles/88619/elife-88619-fig7-data1-v2.zip
Figure 7—figure supplement 1
Train stimulations of V48F and D166Y in 2 mM Ca2+.
(A, D) eEPSCs in response to 50 APs at 40 Hz recorded in 2 mM extracellular Ca2+ (V48F: 25, 18, 24 for wildtype [WT], co-expressed, and mutant conditions, respectively; D166Y: 23, 15, 15). Inserts: Normalized eEPSC amplitudes of first ten stimulations. *p < 0.05, ***p < 0.001, one-way analysis of variance (ANOVA) with Dunnett’s multiple comparison test. (B, E) Priming rate calculated by as the slope of a linear fit to the cumulative evoked charges during the last part of stimulation (V48F: 24, 18, 24 for WT, co-expressed, and mutant conditions, respectively; D166Y: 23, 15, 15). (C, F) Readily releasable pool (RRP) calculated by back-extrapolation of a linear fit to the cumulative evoked charges during the last part of stimulation (V48F: 24, 18, 24 for WT, co-expressed, and mutant conditions, respectively; D166Y: 23, 15, 15).
-
Figure 7—figure supplement 1—source data 1
Excel file containing quantitative data.
- https://cdn.elifesciences.org/articles/88619/elife-88619-fig7-figsupp1-data1-v2.zip
Figure 7—figure supplement 2
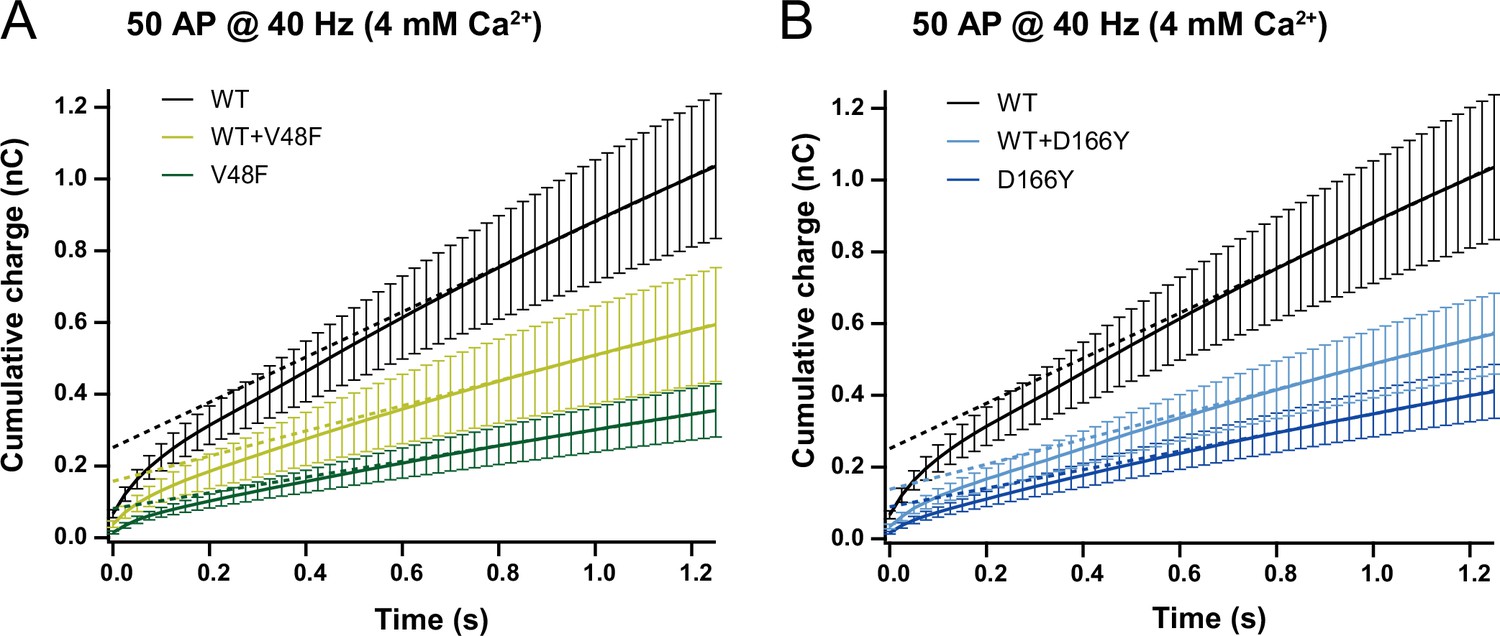
Cumulative charges of V48F and D166Y trains in 4 mM Ca2+.
(A, B) Cumulative charges obtained by integrating eEPSCs during 40 Hz trains. The slope of the linear part of the curve reports on the priming rate, which is reduced by the mutations. The back-extrapolation of the linear fit to zero time reports on the RRPev, the part of the readily releasable pool (RRP) which APs draw on, which is also reduced by mutation (V48F: n = 27, 17, 15 for wildtype [WT], co-expressed, and mutant conditions, respectively; D166Y: 27, 18, 16).
Figure 8
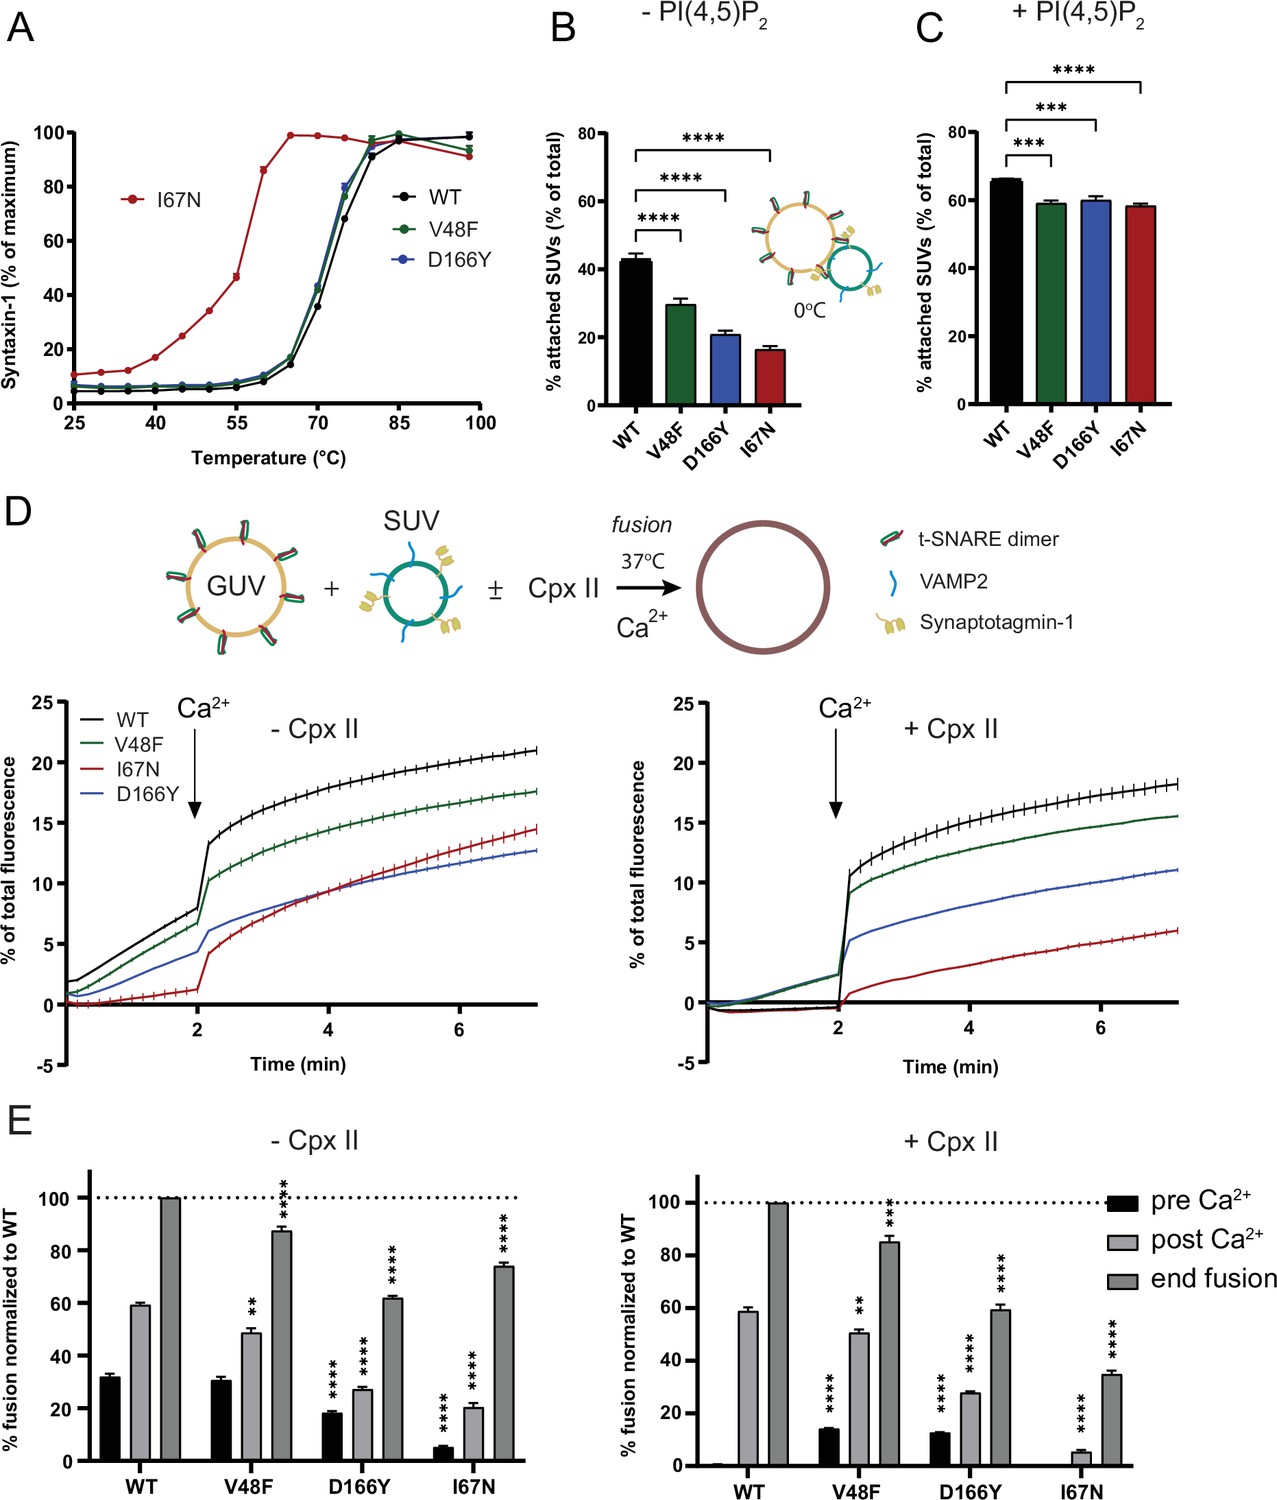
Pathogenic SNAP25 mutations affect synaptotagmin-1 interaction and fusion rates in vitro.
(A) In the presence of SDS, SNAP25b I67N containing v-/t-SNARE complexes were more sensitive to temperature-dependent dissociation. Shown are mean ± standard error of the mean (SEM; n = 3) for SNARE complexes including SNAP25b wildtype (WT) and the I67N, V48F, and D166Y mutations. (B, C) In vitro Syt1/VAMP2 small unilamellar vesicles (SUVs) docking to t-SNARE giant unilamellar vesicles (GUVs) was significantly reduced by SNAP25b V48F, I67N, and D166Y mutants either in absence (B) or presence (C) of PI(4,5)P2. Fusion was blocked by performing the assay on ice. ****p < 0.0001; ***p < 0.001, analysis of variance (ANOVA) with Dunnett’s multiple comparison test. (D, E) In vitro lipid mixing assays of VAMP/Syt1 SUVs with t-SNARE GUVs containing SNAP25b V48F, I67N, or D166Y mutants showed impaired membrane fusion in the absence (left) or presence (right) of complexin-II. Fusion clamping in the presence of complexin was selectively reduced by V48F and D166Y. Bar diagrams show lipid mixing just before (pre) and after (post) Ca2+ addition and at the end of the reaction. Shown is mean ± SEM (n = 3). ****p < 0.0001; **p < 0.01, ANOVA with Dunnett’s multiple comparisons test, comparing each mutation to the corresponding WT condition.
-
Figure 8—source data 1
Excel file containing quantitative data.
- https://cdn.elifesciences.org/articles/88619/elife-88619-fig8-data1-v2.zip
Figure 9 with 2 supplements

The D166Y mutation increases binding to its SNARE partners.
(A–C) In vitro lipid mixing assays of VAMP/Syt1 small unilamellar vesicles (SUVs) with syntaxin-1A giant unilamellar vesicles (GUVs) in the presence of soluble SNAP25b. V48F and D166Y mutants showed impaired fusion clamping in the absence (left) or presence (right) of complexin-II; I67N (red) showed impaired Ca2+-independent and Ca2+-triggered fusion. Bar diagrams show lipid mixing just before (pre) and after (post) Ca2+ addition and at the end of the reaction. Mean ± standard error of the mean (SEM; n = 3). ****p < 0.0001; ***p < 0.001; **p < 0.01; *p < 0.05, analysis of variance (ANOVA) with Dunnett’s multiple comparisons test, comparing each mutation to the corresponding wildtype (WT) condition. (D) SNAP25b D166Y showed enhanced interactions with SUVs carrying reconstituted syntaxin-1A (Stx-1), VAMP2, Syt1/VAMP2, or an SUV mixture containing Syntaxin-1A and VAMP2/Syt1 in co-flotation assays, whereas V48F displayed weaker increases in interactions with SUVs containing syntaxin-1A, or Syt1/VAMP2. Shown is mean ± SEM on a logarithmic scale. ***p < 0.001, **p < 0.01, *p < 0.05, two-tailed one-sample t-test comparing to 1.
-
Figure 9—source data 1
Excel file containing quantitative data.
- https://cdn.elifesciences.org/articles/88619/elife-88619-fig9-data1-v2.zip
Figure 9—figure supplement 1
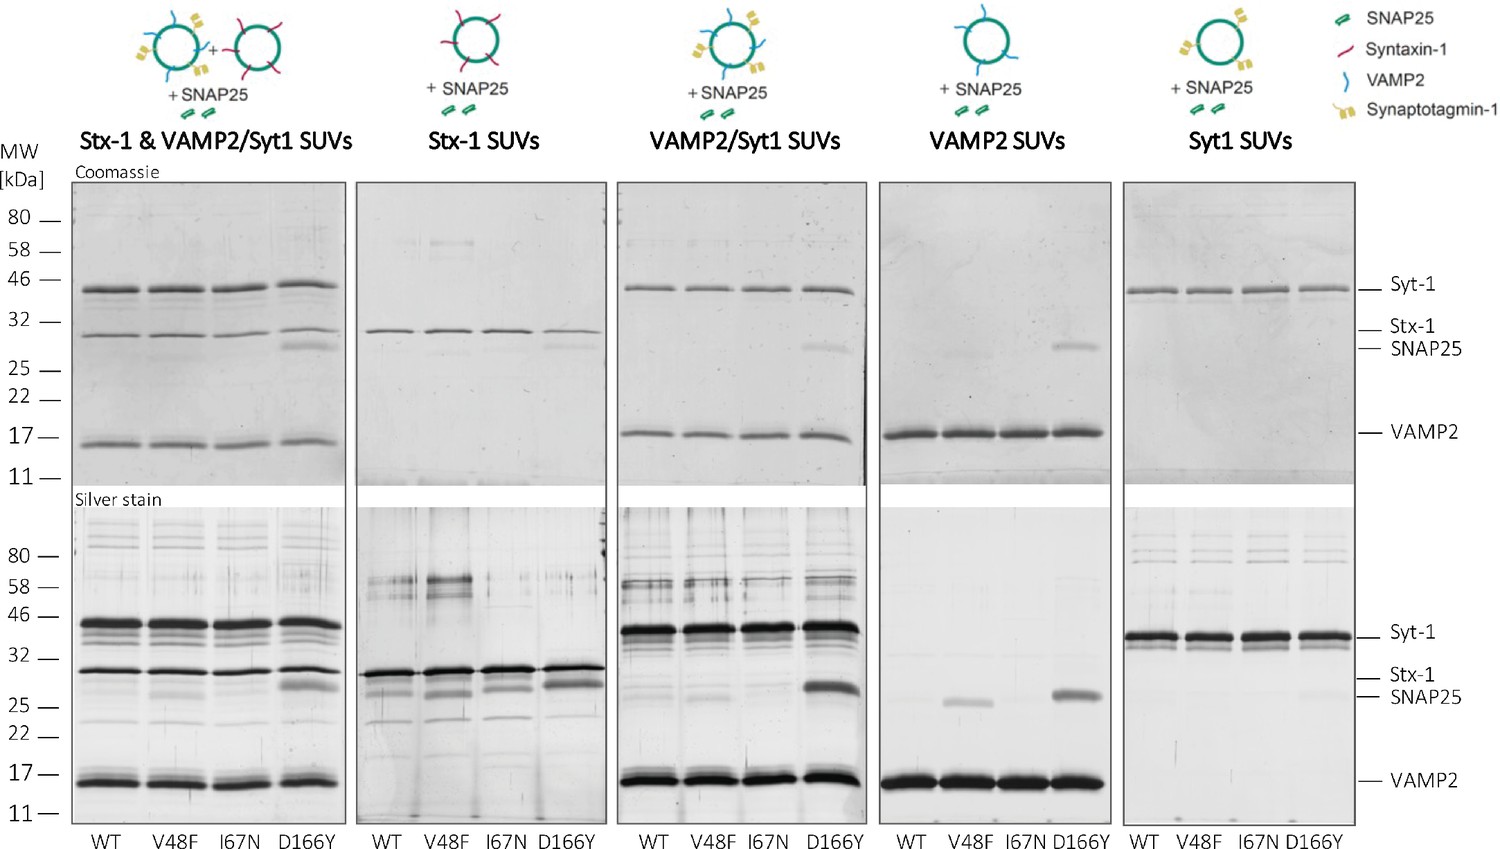
Floatation assay.
Example Coomassie and silver stained gels demonstrating binding of SNAP25b wildtype (WT) and mutants to different populations of small unilamellar vesicles (SUVs): Syntaxin-1 (Stx-1) and VAMP2/Syt1, Syntaxin-1 (Stx-1), VAMP2/Syt1, VAMP2, or Syt1 SUVs. Note increased binding of D166Y and V48F to most SUV populations, strongest for D166Y (quantified data in Figure 9D).
-
Figure 9—figure supplement 1—source data 1
Original files for the analysis by Coomassie and silver stained gels.
- https://cdn.elifesciences.org/articles/88619/elife-88619-fig9-figsupp1-data1-v2.zip
-
Figure 9—figure supplement 1—source data 2
PDF containing original pictures of gels with highlighted bands and sample labels.
- https://cdn.elifesciences.org/articles/88619/elife-88619-fig9-figsupp1-data2-v2.zip
Figure 9—figure supplement 2
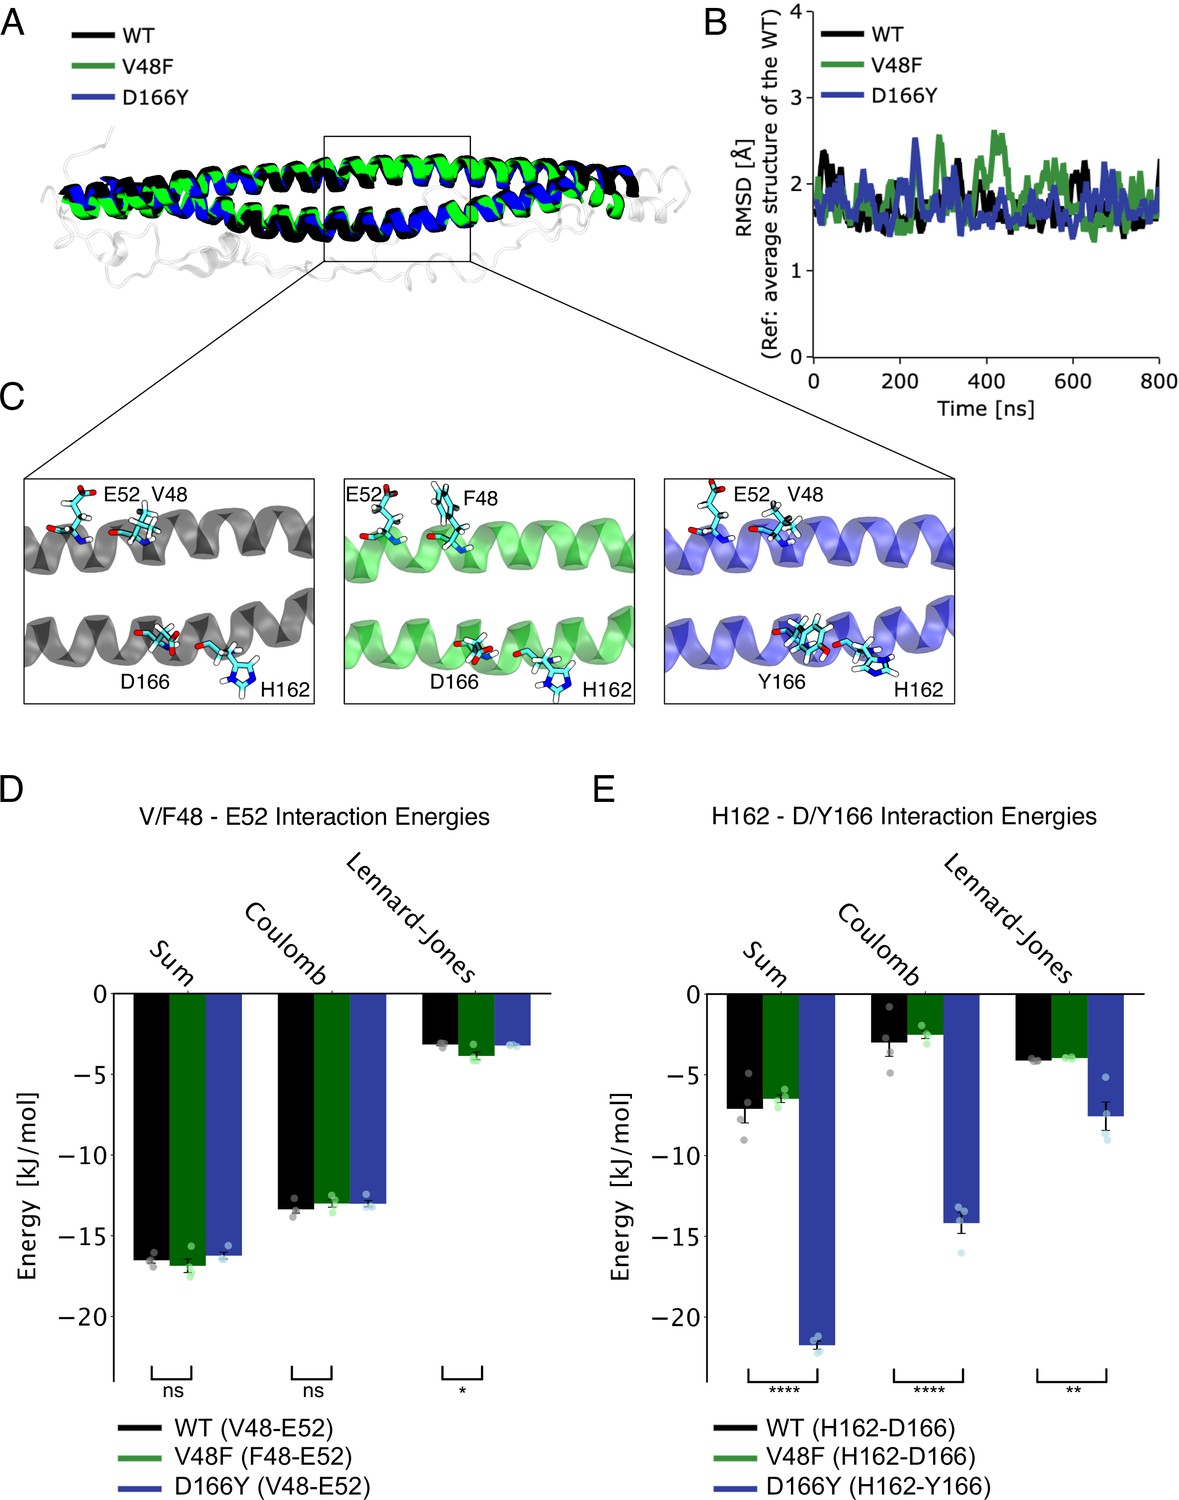
Molecular dynamics simulations of mutants.
(A) Alignment of helices across the three systems (wildtype [WT], V48F, and D166Y) reveals close correspondence. The structures displayed represent the most prevalent configurations from the dominant cluster observed during simulations. (B) Stability evaluation (Root Mean Square Deviation, RMSD) of the two helices across the three systems relative to WT’s average structure during their simulations. (C) A detailed view of the region displaying residue pairs 48–52 and 162–166 on the structures. (D, E) Computed electrostatic (Coulomb) and van der Waals (Lennard–Jonson, LJ) interactions for residue pairs 48–52 (D) and 162–166 (E) calculated in 200 ns blocks within the 800 ns trajectory (see Materials and methods). The bar plots represent the means calculated using the block averaging method, while each block’s average is depicted as a dot alongside. The error bars capture the standard error of the mean, premised on treating each block as an independent measure (i.e. n = 4). Notably, for D166Y (panel E, blue bar), the interaction energy is considerably more negative, indicating a stronger interaction compared to WT. *p < 0.05, **p < 0.01, ****p < 0.0001, one-way analysis of variance (ANOVA) with Tukey HSD post hoc tests.
-
Figure 9—figure supplement 2—source data 1
Excel file with quantitative data.
- https://cdn.elifesciences.org/articles/88619/elife-88619-fig9-figsupp2-data1-v2.zip
Figure 10

The I67N mutation inhibits spontaneous and evoked release.
(A) SNAP25b I67N is similarly expressed as the wildtype (WT) SNAP25b protein. EGFP-SNAP25b was overexpressed in neurons from CD1 (WT) mice; both endogenous and overexpressed SNAP25 are shown. Valosin-containing protein (VCP) was used as the loading control. Quantification of EGFP-SNAP25b (B) and endogenous SNAP25 (C) from Western blots (as in A). Displayed are the intensity of EGFP-SNAP25b or endogenous SNAP25 bands, divided by the intensity of VCP bands, normalized to the WT situation (n = 3 independent experiments). The expression level of the I67N mutant was indistinguishable from WT protein (analysis of variance, ANOVA). (D) Cell viability represented as the number of neurons per glial islet. ****p < 0.0001, Brown–Forsythe ANOVA test with Dunnett’s multiple comparisons test. (E) Representative image of mutant (I67N) hippocampal neurons stained for the dendritic marker MAP2 and the synaptic markers VGlut1. Displayed is MAP2 staining, representing the cell morphology, in inserts MAP2 staining is depicted in red and VGlut staining in cyan. The scale bar represents 50 µm. (F) Number of synapses per neuron in WT and mutant cells. The WT data are the same as in Figure 2D, E because these experiments were carried out in parallel. The difference was tested using ANOVA between all conditions, which was non-significant. (G) Total dendritic length of WT and mutant neurons. (H) Example traces of mEPSC release for WT, mutant (I67N), and 1:1 co-expression of WT and SNAP25 mutant. (I) The mini frequency was decreased in both I67N mutant and the WT + I67N combination (I67N: n = 39, 36, 30 for WT, co-expressed and mutant). ****p < 0.0001, ***p < 0.001, Kruskal–Wallis with Dunn’s multiple comparisons. (J) mEPSC amplitudes were unchanged by the I67N mutation. (K) Example evoked excitatory postsynaptic currents (eEPSC) for WT, mutant (I67N), and co-expressed WT and mutant. (L) eEPSC amplitude was decreased by the I67N mutations (I67N: n = 39, 37, 30 for WT, co-expressed and mutant conditions, respectively). SNAP25b mutations: ****p < 0.0001, **p < 0.01, Brown–Forsythe ANOVA test with Dunnett’s multiple comparisons test. (M) Overall evoked charge after a single depolarization (I67N: 24, 10, 0 for WT, co-expressed and mutant conditions, respectively). (N) Fractional contribution of the synchronous release component to the overall charge (I67N: 24, 10, 0 for WT, co-expressed, and mutant conditions, respectively). Source Data containing quantitative data are found in the Source Data files for Figures 2—4.
Figure 11

The I67N mutation has normal readily releasable pool (RRP) size, but increased energy barrier for fusion.
(A, E) Example traces for the wildtype (WT), mutant, and co-expressed condition. Each cell was stimulated by 0.25 M (A, in gray) and 0.5 M sucrose (A, in color) or 0.375 M sucrose (E, in gray) and 0.75 M (E, in color). The charge released by 0.25 M sucrose (B, I67N: n = 21, 15, 8 for WT, co-expressed, and mutant conditions, respectively) or 0.375 M sucrose (F, I67N: n = 12, 16, 18; a few cells were stimulated with 0.35 M sucrose – shown with open symbols). (B) **p < 0.01; *p < 0.05, Kruskal–Wallis test with Dunn’s multiple comparison test; (F) p = 0.0339 Brown–Forsythe analysis of variance (ANOVA) test; Dunnett’s multiple comparison test, p = 0.0571. The charge released by 0.5 M sucrose (C, I67N: n = 21, 15, 8 for WT, co-expressed, and mutant conditions, respectively), or 0.75 M sucrose (G, I67N: n = 13, 16, 18). (C) **p < 0.01, *p < 0.05, Brown–Forsythe ANOVA with Dunnett’s multiple comparisons test. The ratio of the 0.25 and 0.5 M sucrose pool (D, I67N: n = 21, 15, 8 for WT, co-expressed, and mutant conditions, respectively), or the ratio of 0.375 and 0.75 M sucrose pool (H, n = 13, 16, 18). (D) *p < 0.05, Kruskal–Wallis test with Dunn’s multiple comparisons test. (H) ****p < 0.0001; ***p < 0.001, ANOVA with Dunnett’s multiple comparisons test. (I) eEPSCs in response to 50 APs at 40 Hz recorded in 2 mM extracellular Ca2+ (I67N: n = 23, 16, 20 for WT, co-expressed, and mutant conditions, respectively). Inserts: Normalized eEPSC amplitudes demonstrating facilitation of mutant conditions. (J) Normalized eEPSC amplitudes in response to 50 APs at 40 Hz recorded in 2 mM extracellular Ca2+. (K) Paired-pulse ratio at interstimulus interval 25 ms (I67N: n = 24, 14, 17 for WT, co-expressed, and mutant conditions, respectively). *p < 0.05, ANOVA with Dunnett’s multiple comparison test. Source Data containing quantitative data are found in the Source Data files for Figures 5 and 7.
Figure 12
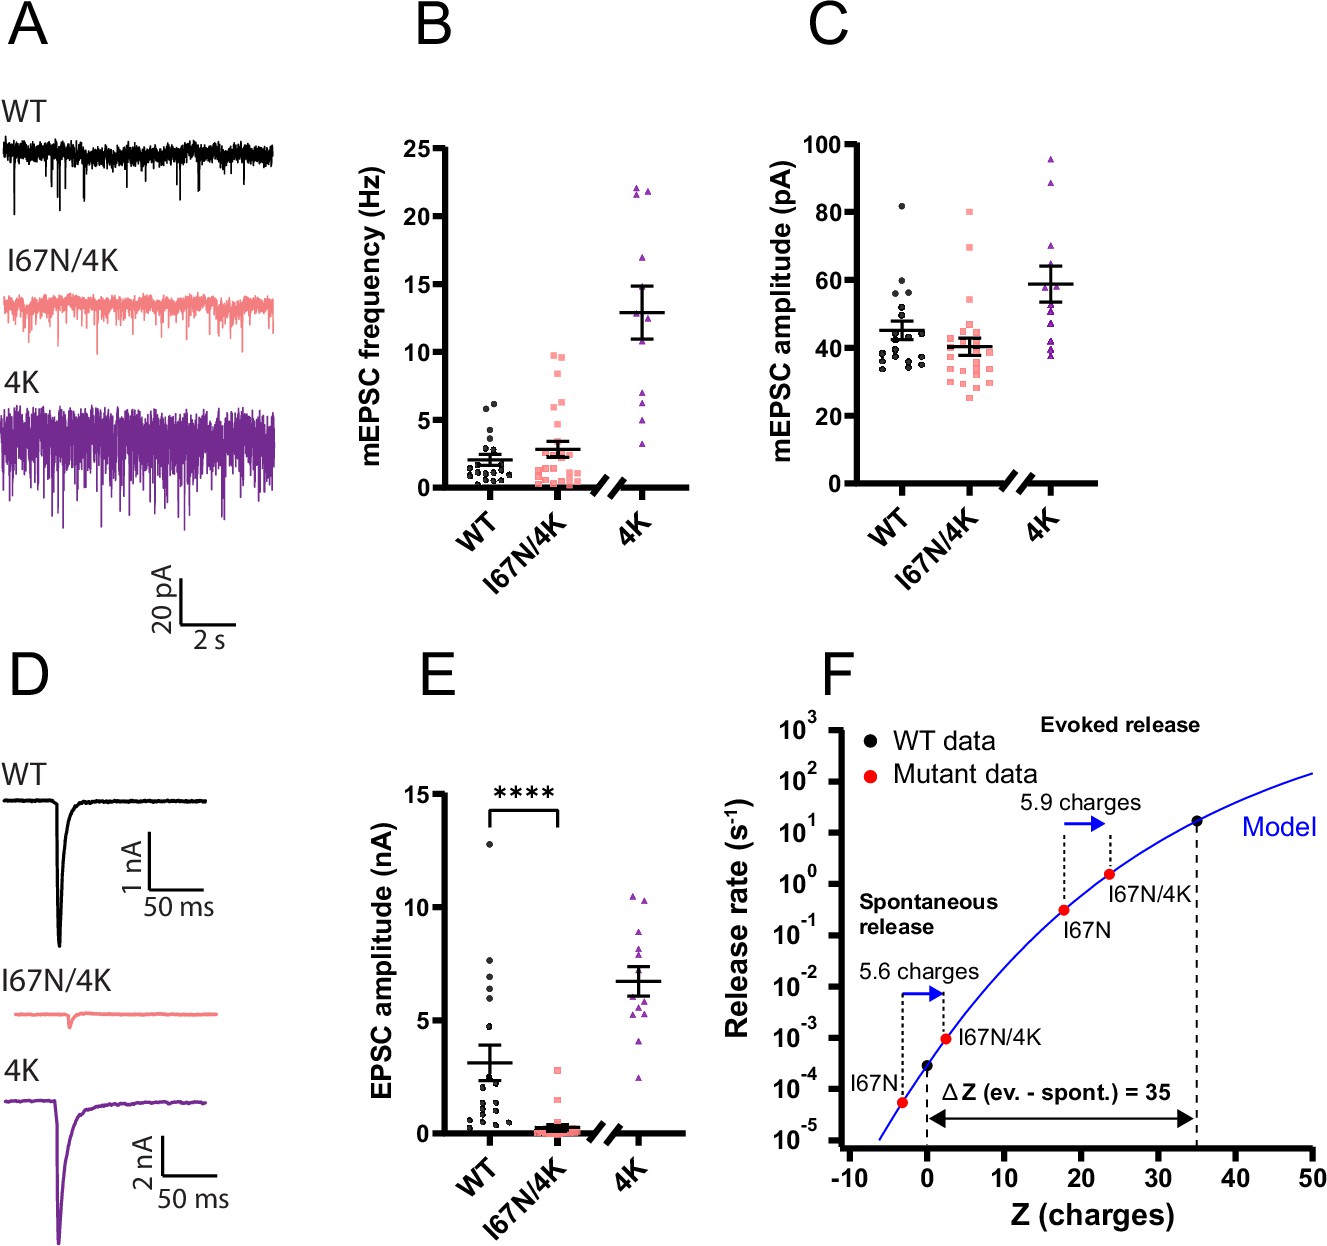
Adding positive surface charges to the SNARE complex partly compensate for the I67N mutation.
(A) Example traces of mEPSC release for wildtype (WT), I67N/E183K/S187K/T190K/E194K (I67N/4K) and E183K/S187K/T190K/E194K (4K) SNAP25b. Data from the 4K mutation were obtained in a separate experiment and are shown for comparison, but statistical tests with 4K mutation data were not carried out. (B) The mini frequencies for the WT and I67N/4K are not significantly different; data from the 4K mutation are shown for comparison (n = 19, 25, 13 for WT, I67N/4K, and 4K, respectively). (C) Mini amplitudes remain unaffected by I67N/4K mutation. eEPSC examples (D) and amplitudes (E) for WT and I67N/4K; 4K is shown for comparison (n = 19, 25, 13 for WT, I67N/4K, and 4K, respectively). ****p < 0.0001 Mann–Whitney test. (F) Electrostatic triggering model (blue line; Ruiter et al., 2019) refitted to WT spontaneous and evoked data points (black points). Fitted parameters: rate 0.00029 s−1 at zero (0) charge (Z); fraction f = 0.030; the maximum rate was fixed at 6000 s−1. WT (black points), I67N, I67N/4K (red points): means of log-transformed data. The charge values (Z, horizontal axis) for I67N and I67N/4K were found by interpolation in the model; the two spontaneous points (I67N, I67N/4K) are separated by 5.6 charges. For evoked release, rates were found by deconvolution and normalizing to RRP0.5 (Ruiter et al., 2019). The Z-values for evoked release were found by interpolation in the model; the two mutants (I67N, I67N/4K) are separated by 5.9 charges.
-
Figure 12—source data 1
Excel file containing quantitative data.
- https://cdn.elifesciences.org/articles/88619/elife-88619-fig12-data1-v2.zip
Figure 13
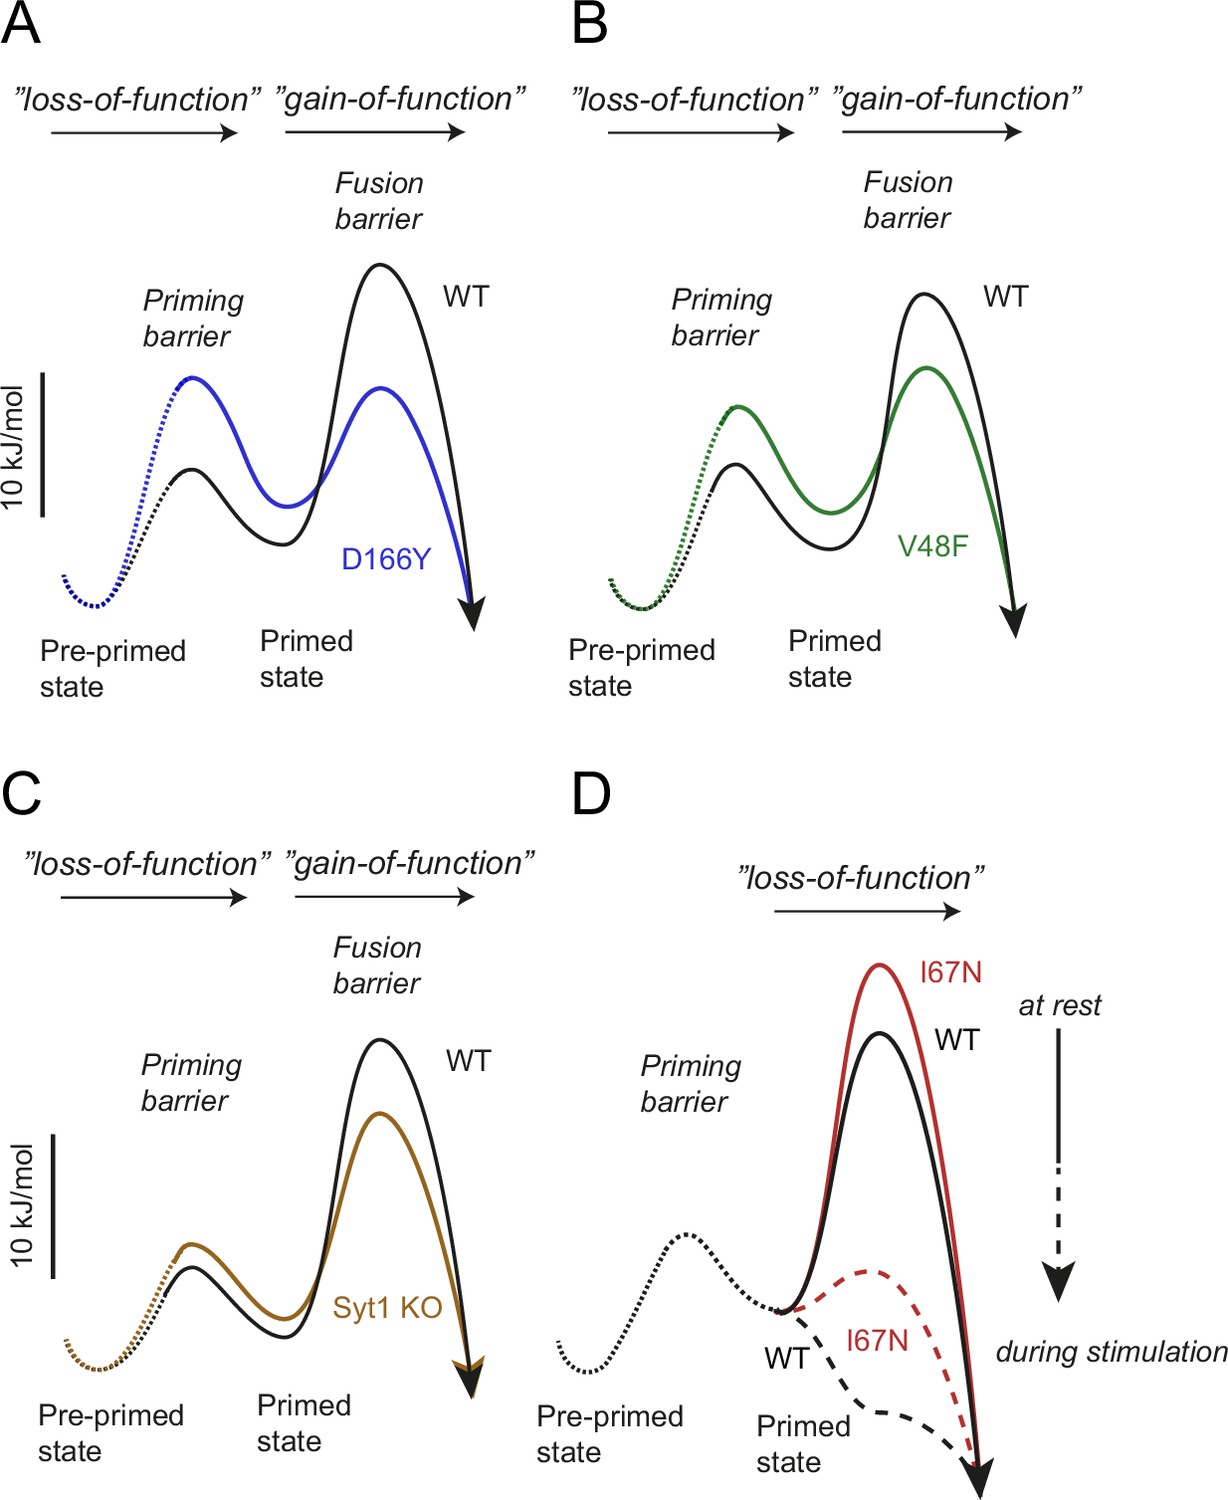
Energy landscapes.
The energy landscapes of wildtype (WT) and mutants were calculated as explained in Materials and methods and displayed to scale. Energy landscapes for D166Y (A), V48F (B), and Syt1 knockout (KO) (C) are shown at rest and are characterized by a higher priming barrier (‘loss-of-function’ phenotype), a destabilized readily releasable pool (RRP), and a lower fusion barrier (‘gain-of-function’ phenotype). The I67N (D) is characterized by a higher fusion barrier (‘loss-of-function’ phenotype). The relative increase in the fusion barrier by the I67N mutation is higher during stimulation than at rest. Dotted lines represent energy levels for which less is known.
Tables
Table 1
Estimated parameters affecting the size of the readily releasable pool (RRP).
Displayed is mean ± standard error of the mean (SEM). Two-sample t-test or Welch’s t-test comparing mutant to wildtype (WT): *p < 0.05; ***p < 0.001; ****p < 0.0001, #non-significant (p = 0.125), ¤non-significant (p = 0.210).
| Mean ± SEM | WT | V48F | WT | D166Y | Syt1 WT | Syt1 KO |
|---|---|---|---|---|---|---|
| k1 [vesicles/s] | 385.6 ±52.2 | 79.87*** ±12.5 | 457.4 ±77.4 | 37.68**** ±7.33 | 1227 ±189 | 646* ±114 |
| k−1 [1/s] | 0.0903 ±0.0091 | 0.0605# ±0.011 | 0.1114 ±0.012 | 0.0294**** ±0.0122 | 0.140 ±0.016 | 0.114¤ ±0.013 |
| kf [1/s] | 0.000844 ±0.000178 | 0.0164**** ±0.00230 | 0.000398 ±0.000077 | 0.03522**** ±0.00352 | 0.000235 ±0.000043 | 0.00286*** ±0.00062 |
Appendix 1—key resources table
| Reagent type (species) or resource | Designation | Source or reference | Identifiers | Additional information |
|---|---|---|---|---|
| Strain, strain background (M. musculus) | CD1 | Experimental medicine, Panum Stable, University of Copenhagen | ||
| Genetic reagent (M. musculus) | Synaptotagmin-1 (syt1) null allele | Geppert et al., 1994 | PMID:7954835 | |
| Genetic reagent (M. musculus) | Snap25 null allele | Washbourne et al., 2002 | PMID:11753414 | |
| Transfected construct (M. musculus) | p156rrl-EGFP-SNAP25b | Delgado-Martínez et al., 2007 | Local identifier, #192 | PMID:17728451 See constructs for rescue experiments |
| Transfected construct (M. musculus) | p156rrl-EGFP-SNAP25b-I67N | Sørensen lab, this paper | Local identifier, #193 | See constructs for rescue experiments |
| Transfected construct (M. musculus) | p156rrl-EGFP-SNAP25b-V48F | Sørensen lab, this paper | Local identifier, #195 | See constructs for rescue experiments |
| Transfected construct (M. musculus) | p156rrl-EGFP-SNAP25b-D166Y | Sørensen lab, this paper | Local identifier, #212 | See constructs for rescue experiments |
| Transfected construct (M. musculus) | p156rrl-EGFP-SNAP25b-I67N/E183K/S187K/T190K/E194K | Sørensen lab, this paper | Local identifier, #209 | See constructs for rescue experiments |
| Gene (human) | Complexin II, CPLX2 | Uniprot | Q6PUV4, CPLX2_HUMAN | |
| Gene (mouse) | VAMP2 | Uniprot | P63044, VAMP2_MOUSE | |
| Gene (rat) | Synaptotagmin-1 | Uniprot | P21707, SYT1_RAT | |
| Gene (rat) | Syntaxin-1A | Uniprot | P32851, STX1A_RAT | |
| Gene (mouse) | SNAP25B | Uniprot | P60879, SNP25_MOUSE | |
| Gene (human) | Complexin II, CPLX2 | Uniprot | Q6PUV4, CPLX2_HUMAN | |
| Strain, strain background (Escherichia coli) | BL21(DE3) | Agilent | Cat# 200131 | |
| Strain, strain background (Escherichia coli) | BL21(DE3)codon+ | Agilent | Cat# 230240 | |
| Recombinant DNA reagent | Complexin II | Malsam et al., 2012 | Local identifier, pMDL80 | PMID:22705946 |
| Recombinant DNA reagent | VAMP2 | Kedar et al., 2015. | Local identifier, pSK28 | PMID:26490858 |
| Recombinant DNA reagent | VAMP2cd | Ruiter et al., 2019 | Local identifier, pSK74 | PMID:30811985 |
| Recombinant DNA reagent | Synaptotagmin-1 | Mahal et al., 2002 | Local identifier, pLM6 | PMID:12119360 |
| Recombinant DNA reagent | Syntaxin-1A | Söllner lab, this paper | Local identifier, pSK270 | See constructs for in vitro protein expression |
| Recombinant DNA reagent | SNAP25B | Parlati et al., 1999 | Local identifier, pFP247 | PMID:11001058 |
| Recombinant DNA reagent | tSNARE | Parlati et al., 1999 | Local identifier, pTW34 | PMID:11001058 |
| Recombinant DNA reagent | SNAP25B I67N | Söllner lab, this paper | Local identifier, pUG1 | See constructs for in vitro protein expression |
| Recombinant DNA reagent | SNAP25B V48F | Söllner lab, this paper | Local identifier, pUG2 | See constructs for in vitro protein expression |
| Recombinant DNA reagent | SNAP25B D166Y | Söllner lab, this paper | Local identifier, pUG3 | See constructs for in vitro protein expression |
| Recombinant DNA reagent | tSNARE SNAP25B I67N | Söllner lab, this paper | Local identifier, pUG7 | See constructs for in vitro protein expression |
| Recombinant DNA reagent | tSNARE SNAP25B V48F | Söllner lab, this paper | Local identifier, pUG8 | See constructs for in vitro protein expression |
| Recombinant DNA reagent | tSNARE SNAP25B D166Y | Söllner lab, this paper | Local identifier, pUG9 | See constructs for in vitro protein expression |
| Sequence-based reagent | SNAP25B I67N fw: ttctttcatgtccttattgttttggtccatcccttcctc rv: gaggaagggatggaccaaaacaataaggacatgaaagaa | Söllner lab, this paper | Quick-change primer to generate SNAP25B I67N | |
| Sequence-based reagent | SNAP25B V48F fw: cttgctcatccaacataaacaaagtcctgatgccagc rv: gctggcatcaggactttgtttatgttggatgagcaag | Söllner lab, this paper | Quick-change primer to generate SNAP25B V48F | |
| Sequence-based reagent | SNAP25B D166Y fw: ctcattgcccatgtatagagccatatggcggagg rv: cctccgccatatggctctatacatgggcaatgag | Söllner lab, this paper | Quick-change primer to generate SNAP25B D166Y | |
| Antibody | Anti-VGlut1 (guinea pig polyclonal) | Merck Millipore | Cat# AB5905 RRID: AB_2301751 | 1:1000; overnight at 4°C |
| Antibody | Anti-MAP2 (chicken polyclonal) | Abcam | Cat# Ab5392 RRID: AB_2138153 | 1:500; overnight at 4°C |
| Antibody | Anti-guinea pig Alexa Fluor 647 (goat polyclonal) | Thermo Fisher Scientific | Cat# A-21450 RRID: AB_2535867 | 1:4000; 1 hr at room temperature |
| Antibody | Anti-chicken Alexa Fluor 568 (goat polyclonal) | Thermo Fisher Scientific | Cat# A11041 RRID: AB_2534098 | 1:1000; 1 hr at room temperature |
| Antibody | Anti-SNAP25 (mouse monoclonal) | Synaptic Systems | Cat# 111011 RRID: AB_887794 | 1:10,000; overnight at 4°C |
| Antibody | Anti-VCP (mouse monoclonal) | Abcam | Cat# Ab11433 RRID: AB_298039 | 1:2000; overnight at 4°C |
| Antibody | Anti-VCP (rabbit monoclonal) | Abcam | Cat# Ab109240 RRID: AB_10862588 | 1:5000 overnight at 4°C |
| Antibody | Anti-mouse HRP (polyclonal goat) | Agilent (Dako) | Agilent, cat# P044701-2 RRID: AB_2617137 | 1:10,000; 1 hr at room temperature |
| Antibody | Anti-rabbit HRP (polyclonal goat) | Agilent (Dako) | Agilent, cat# P044801-2 RRID: AB_2617138 | 1:10,000; 1 hr at room temperature |
| Commercial assay or kit | QuikChange II XL kit | Agilent | Agilent, cat# 200521 | |
| Commercial assay or kit | QIAprep Spin Miniprep Kit | QIAGEN | QIAGEN, cat# 27106 | |
| Commercial assay or kit | BCA Protein assay kit | Pierce | Pierce, cat# 23227 | |
| Commercial assay or kit | QuikChange site-directed DNA mutagenesis kit | Agilent | Cat# 200519 | |
| Commercial assay or kit | Venor GeM OneStep mycoplasma test | Minerva biolabs | Art. Nr. 11-8025 | |
| Chemical compound, drug | NaCl | Sigma-Aldrich | Sigma-Aldrich, cat# S9888 | |
| Chemical compound, drug | KCl | Sigma-Aldrich | Sigma-Aldrich, cat# P5405 | |
| Chemical compound, drug | Glucose | Sigma-Aldrich | Sigma-Aldrich, cat# G8270 | |
| Chemical compound, drug | CaCl2 | Sigma-Aldrich | Sigma-Aldrich, cat# 31307 | |
| Chemical compound, drug | MgCl2 | Sigma-Aldrich | Sigma-Aldrich, cat# M2393 | |
| Chemical compound, drug | 96% ethanol | VWR | VWR, cat# 20824.321 | |
| Chemical compound, drug | Sucrose | Sigma-Aldrich | Sigma-Aldrich, cat# S1888 | |
| Chemical compound, drug | EGTA | Sigma-Aldrich | Sigma-Aldrich, cat# E4378 | |
| Chemical compound, drug | HEPES | Sigma-Aldrich | Sigma-Aldrich, cat# H4034 | |
| Chemical compound, drug | Na-ATP | Sigma-Aldrich | Sigma-Aldrich, cat# A2383 | |
| Chemical compound, drug | Creatine phosphate | Sigma-Aldrich | Sigma-Aldrich, cat# P7936 | |
| Chemical compound, drug | Creatine phosphokinase | Sigma-Aldrich | Sigma-Aldrich, cat# C3755 | |
| Chemical compound, drug | Albumin | Sigma-Aldrich | Sigma-Aldrich, cat# A9418 | |
| Chemical compound, drug | Trypsin-inhibitor | Sigma-Aldrich | Sigma-Aldrich, cat# T9253 | |
| Chemical compound, drug | Penicillin/streptomycin | Gibco | Gibco, cat# 15140122 | |
| Chemical compound, drug | Fetal bovine serum | Gibco | Gibco, cat# 10500064 | |
| Chemical compound, drug | MEM non-essential amino acids (100×) | Gibco | Gibco, cat# 11140050 | |
| Chemical compound, drug | Collagen Type I | Corning | Corning, cat# 354236 | |
| Chemical compound, drug | Agarose Type II-A | Sigma-Aldrich | Sigma-Aldrich, cat# A-9918 | |
| Chemical compound, drug | Trypsin–EDTA (10×) | Gibco | Gibco, cat# 15090-046 | |
| Chemical compound, drug | Trypsin–EDTA (1×) | Gibco | Gibco, cat# 25300-054 | |
| Chemical compound, drug | DMEM (1×) + GlutaMAX-1 | Gibco | Gibco, cat# 31966-021 | |
| Chemical compound, drug | Geneticin Selective Antibiotic (G418 Sulfate) | Gibco | Gibco, cat. 11811064 | |
| Chemical compound, drug | Poly-D-lysine | Sigma-Aldrich | Sigma-Aldrich, cat# P7405 | |
| Chemical compound, drug | Glacial acetic acid | Sigma-Aldrich | Sigma-Aldrich, cat# 695084 | |
| Chemical compound, drug | Neurobasal | Gibco | Gibco, cat# 21103049 | |
| Chemical compound, drug | Neurobasal-A | Gibco | Gibco, cat# 10888022 | |
| Chemical compound, drug | HBSS | Gibco | Gibco, cat# 24020-091 | |
| Chemical compound, drug | B-27 supplement | Gibco | Gibco, cat# 17504044 | |
| Chemical compound, drug | 100× Glutamax-1 supplement | Gibco | Gibco, cat# 35050-061 | |
| Chemical compound, drug | β-Mercaptoethanol | Sigma-Aldrich | Sigma-Aldrich, cat# M7522 | |
| Chemical compound, drug | Paraformaldehyde | Sigma-Aldrich | Sigma-Aldrich, cat# P6148 | |
| Chemical compound, drug | PIPES | Sigma-Aldrich | Sigma-Aldrich, cat# 80635 | |
| Chemical compound, drug | Triton X-100 | Sigma-Aldrich | Sigma-Aldrich, cat# T8787 | |
| Chemical compound, drug | Octyl-beta-glucoside | Thermo Fisher Scientific | Thermo Scientific, cat# 28310 | |
| Chemical compound, drug | BSA | Sigma-Aldrich | Sigma-Aldrich, cat# A4503 | |
| Chemical compound, drug | Protease cocktail inhibitor | Thermo Scientific | Thermo Scientific, cat# 87785 | |
| Chemical compound, drug | RIPA buffer | Sigma-Aldrich | Sigma-Aldrich, cat# R0278 | |
| Chemical compound, drug | NuPAGE MES SDS Running Buffer | Invitrogen | Invitrogen, cat# NP0002 | |
| Chemical compound, drug | Trizma base | Sigma-Aldrich | Sigma-Aldrich, cat# T1503 | |
| Chemical compound, drug | Glycine | Sigma-Aldrich | Sigma-Aldrich, cat# G8898 | |
| Chemical compound, drug | 10% SDS | Sigma-Aldrich | Sigma-Aldrich, cat# 71736 | |
| Chemical compound, drug | Tween20 | Sigma-Aldrich | Sigma-Aldrich, cat# P9416 | |
| Chemical compound, drug | Sample Reducing Agent | Invitrogen | Invitrogen, cat# B0009 | |
| Chemical compound, drug | LDS Sample Buffer | Invitrogen | Invitrogen, cat# B0007 | |
| Chemical compound, drug | Difco Skim Milk | BD Life Sciences | BD Life Sciences, cat# 232100 | |
| Chemical compound, drug | ECL plus Western blotting substrate | Pierce | Pierce, cat# 32132 | |
| Chemical compound, drug | POPE (1-hexadecanoyl-2-octadecenoyl-SN-glycero-3-phosphoethanolamine) | Avanti Polar Lipids | Cat# 850757 P-25 mg | |
| Chemical compound, drug | POPC (1-palmitoyl-2-oleoyl-SN-glycero-3- phosphocholine) | Avanti Polar Lipids | Cat# 850457 P-25 mg | |
| Chemical compound, drug | DOPS (1,2-dioleoyl-SN-glycero-3-phosphoserine) | Avanti Polar Lipids | Cat# 840035 P-10 mg | |
| Chemical compound, drug | Cholesterol (from ovine wool) | Avanti Polar Lipids | Cat# 700000 P-100 mg | |
| Chemical compound, drug | PI (L-α-phosphatidylinositol) | Avanti Polar Lipids | Cat# 840042 P-25 mg | |
| Chemical compound, drug | PI(4,5)P2 (L-α-phosphatidylinositol-4,5-bisphosphate) | Avanti Polar Lipids | Cat# 840046 P-1 mg | |
| Chemical compound, drug | Atto647-DPPE (1,2-dipalmitoyl-SN-glycero-3-phosphoethanolamine) | ATTO-TEC | Cat# AD 647 N-151 | |
| Chemical compound, drug | Atto488-DPPE (1,2-dipalmitoyl-SN-glycero-3-phosphoethanolamine) | ATTO-TEC | Cat# AD 488-151 | |
| Chemical compound, drug | Atto550-DPPE (1,2-dipalmitoyl-SN-glycero-3-phosphoethanolamine) | ATTO-TEC | Cat# AD 550-151 | |
| Chemical compound, drug | Nycodenz | Axis-Shield | Prod. No. 18003 | |
| Other | MonoS 5/50 GL column; MonoQ 5/50 GL column | GE Healthcare | Discontinued | Ion exchange columns |
| Other | Protino Ni-NTA Agarose | Macherey-Nagel | Cat# 745400 | Affinity resin |
| Other | PreScission protease | Cytiva | Cat# 27084301 | Site-specific protease |
| Other | PD10 desalting column PD MidiTrap G-25 column | Cytiva | Cat# 17085101 Cat# 28918008 | Buffer exchange columns |
| Other | Platinum foil 25 × 25 mm | Fisher scientific | Cat# 11356429 | Component of the electrode assembly for GUV formation |
| Other | Copper tape, 25 mm | 3M | Cat# ET 1181 | Component of the electrode assembly for GUV formation |
| Other | PTFE tape, 25.4 mm | 3M | Cat# 5491 | Component of the electrode assembly for GUV formation |
| Software, algorithm | Igor | Wavemetrics | ||
| Software, algorithm | Patchmaster v2.73 | HEKA | ||
| Software, algorithm | MiniAnalysis v6.0.7 | Synaptosoft | ||
| Software, algorithm | Zeiss Zen Blue | |||
| Software, algorithm | Zeiss Zen Black | |||
| Software, algorithm | SynD Automated Image Analysis | Schmitz et al., 2011 | PMID:21167201 | |
| Software, algorithm | GraphPad Prism 9 | |||
| Software, algorithm | ImageJ | NIH software | ||
| Software, algorithm | ||||
| Software, algorithm | GROMACS, version 2022 | GROMACS | ||
| Software, algorithm | AlphaFold, version 2 | Jumper et al., 2021 | PMID:34265844 | |
| Software, algorithm | ColabFold, version 1.5.2 | Mirdita et al., 2022 | PMID:35637307 |
Additional files
Download links
A two-part list of links to download the article, or parts of the article, in various formats.
Downloads (link to download the article as PDF)
Open citations (links to open the citations from this article in various online reference manager services)
Cite this article (links to download the citations from this article in formats compatible with various reference manager tools)
SNAP25 disease mutations change the energy landscape for synaptic exocytosis due to aberrant SNARE interactions
eLife 12:RP88619.
https://doi.org/10.7554/eLife.88619.3


