Computational analysis of long-range allosteric communications in CFTR
- Department of Chemical Engineering, Bogazici University, Turkey
- Polymer Research Center, Bogazici University, Turkey
- Department of Molecular Microbiology, Bruce and Ruth Rappaport Faculty of Medicine, Technion-Israel Institute of Technology, Israel
- Department of Biochemistry and Molecular Biology, Faculty of Life Sciences, Tel-Aviv University, Israel
Figures
Figure 1 with 6 supplements
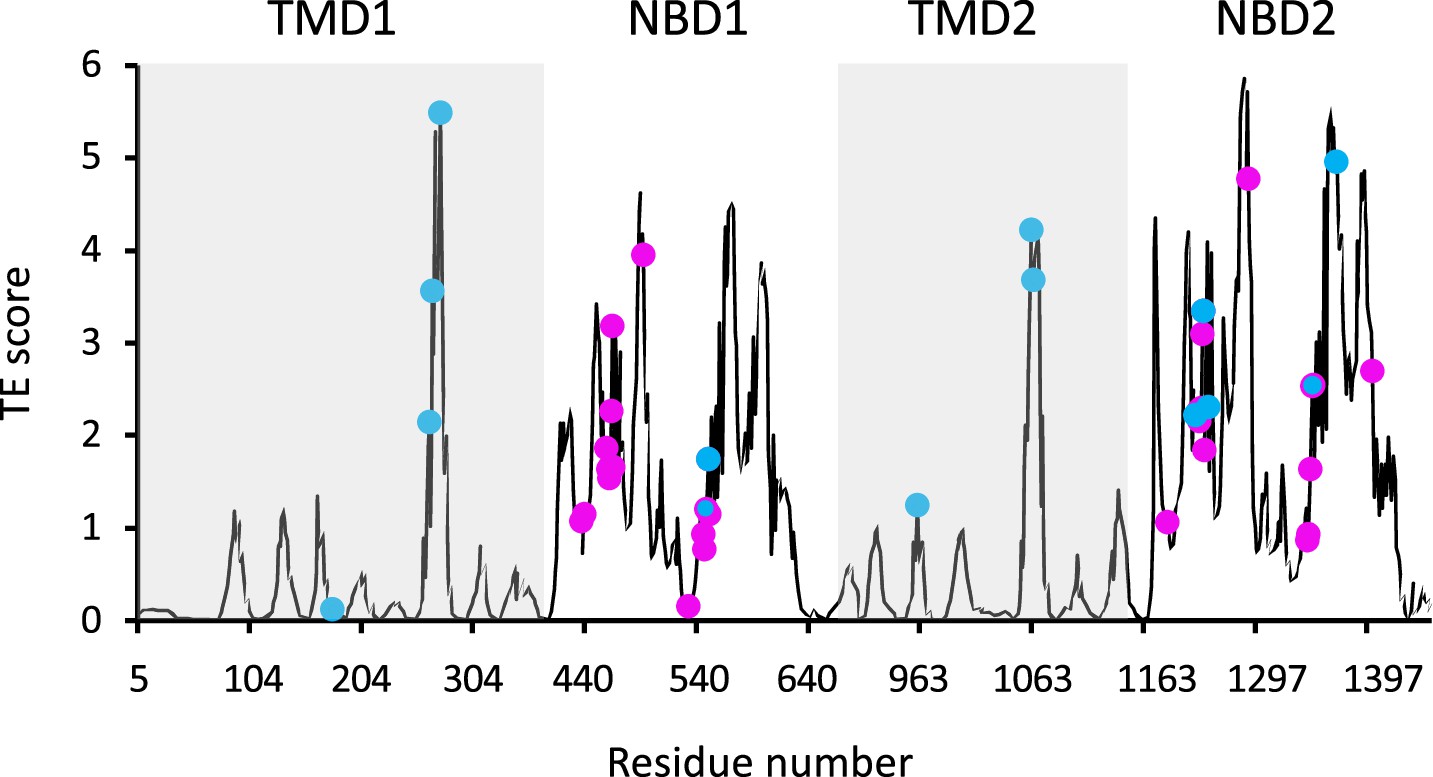
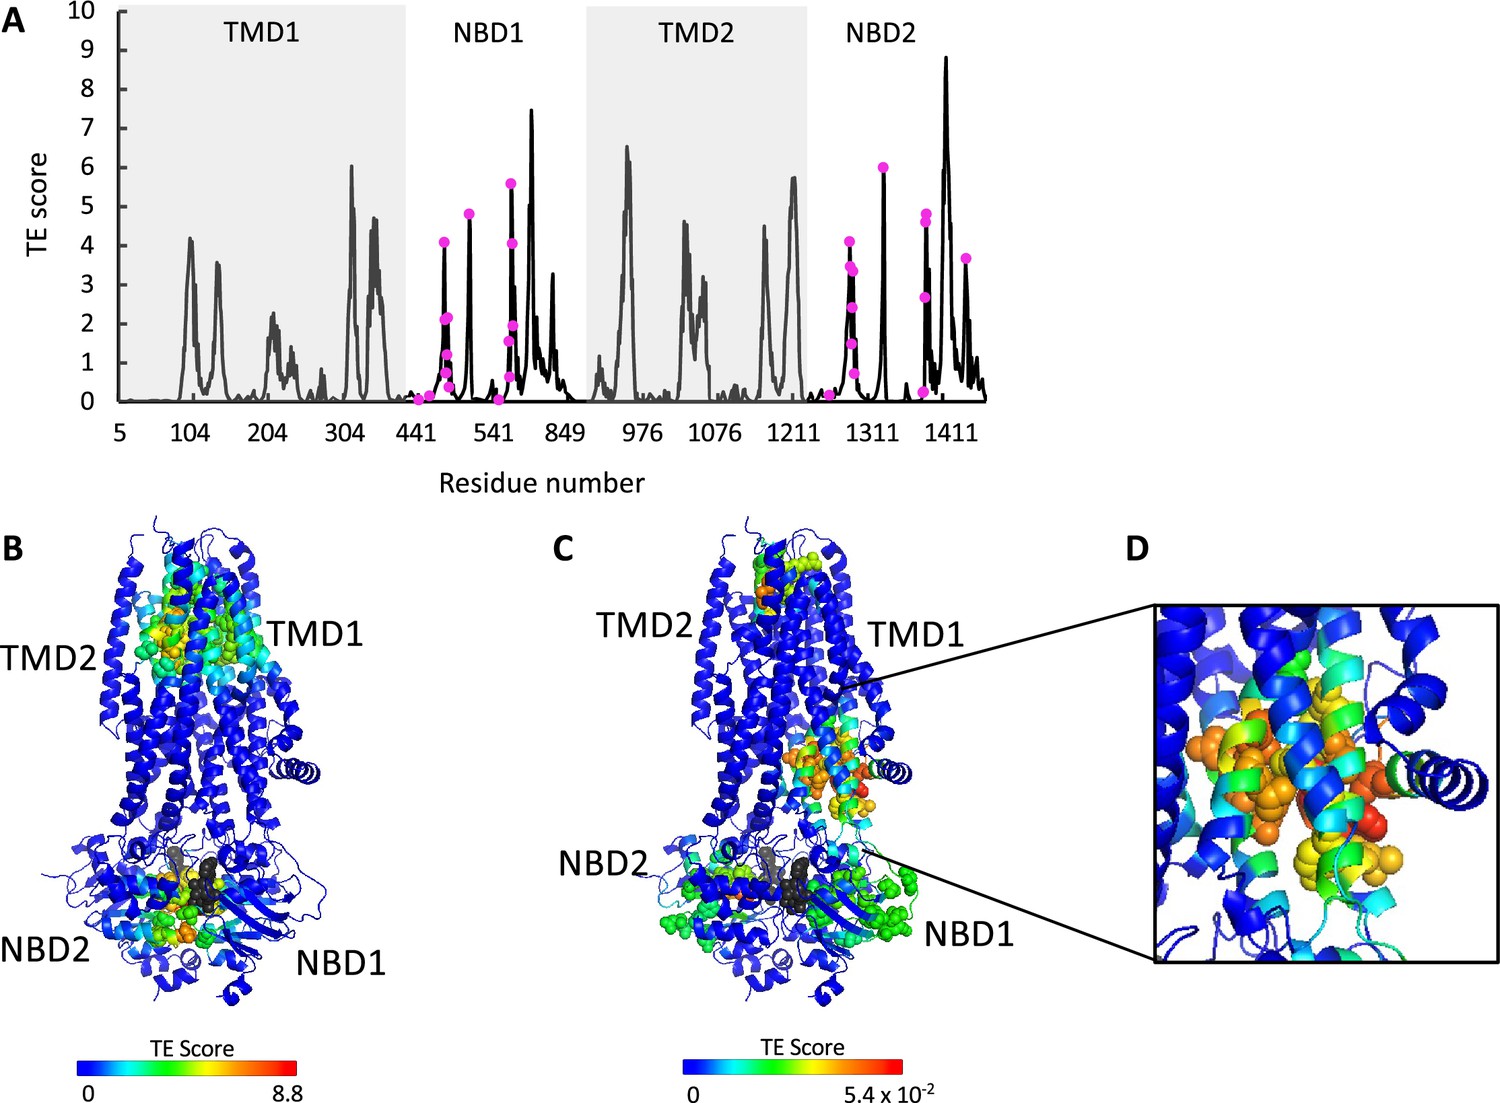
Functional sites of cystic fibrosis transmembrane conductance regulator (CFTR) segregate to allosteric hotspots.
Shown is the amount of information (transfer entropy [TE] score) transmitted by each residue of dephosphorylated ATP-free human CFTR (PDB ID 5UAK) calculated using the 10 most collective Gaussian network model (GNM) modes (solid black trace). The positions of the 14 functionally important residues (see text for details) and of 30 ATP-binding residues are shown as cyan and magenta spheres, respectively.
Figure 1—figure supplement 1

Eigenvalue decays as a function of mode number, shown for ATP-free (orange) and ATP-bound (blue) human cystic fibrosis transmembrane conductance regulator (CFTR) (PDB ID 5UAK and 6MSM, respectively).
Figure 1—figure supplement 2

Sensitivity of the results to Rcut.
Shown is the amount of information transmitted (transfer entropy [TE] score) by each residue of dephosphorylated ATP-free (A) or phosphorylated ATP-bound (B) human cystic fibrosis transmembrane conductance regulator (CFTR) calculated using Rcut of 7 Å or 10 Å (blue and orange curves, respectively).
Figure 1—figure supplement 3
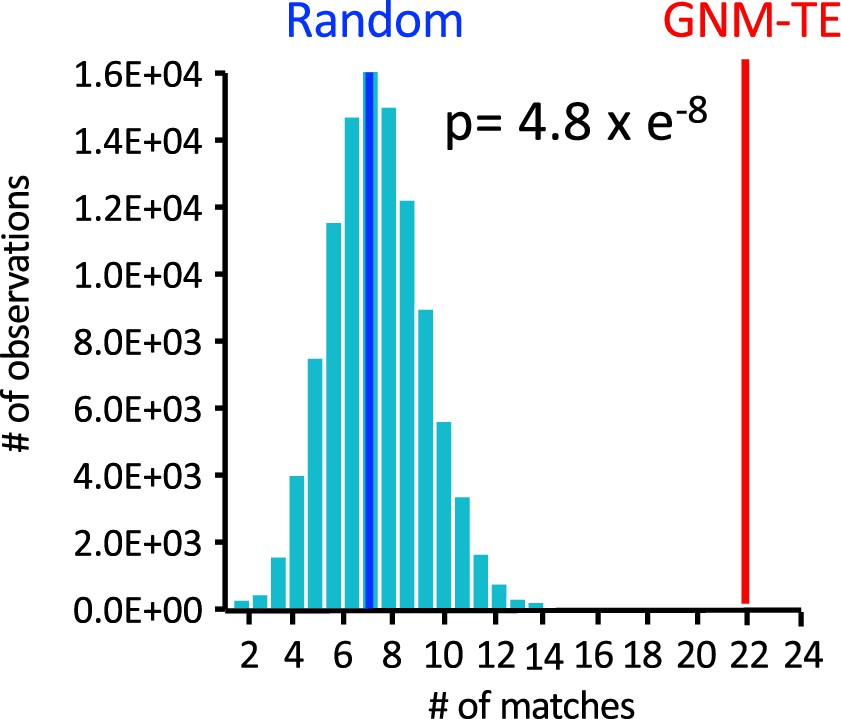
Co-localization of the Gaussian network model-transfer entropy (GNM-TE) peaks with the hinges identified by GNM.
100,000 sets of 60 randomized positions were generated, and for each such set the number of matches (within a cutoff distance of ≤4 Å) to a position of a hinge residue that was identified by GNM was counted. Shown is the probability distribution for the 100,000 random sets (cyan bars). Blue and red vertical lines indicate the mean value of matches for the random and for the GNM-TE determined peaks, respectively. Also shown is the p-value obtained by one-tailed hypothesis tests with a significance level of 0.05.
Figure 1—figure supplement 4

Correlation between allosteric peaks and positions of the functionally essential residues.
100,000 sets of 60 randomized positions were generated and for each such set the number of matches with the positions of the 14 essential residues was counted. Shown is the probability distribution when considering only exact matches (A), or also first-coordination sphere interactions within a cutoff distance of ≤4 Å (B), or also second-coordination sphere interactions within a cutoff distance of ≤7 Å (C). Blue and red vertical lines indicate the mean value of matches for the random and Gaussian network model-transfer entropy (GNM-TE)-based predictions, respectively. Also shown are the p-value obtained by one-tailed hypothesis tests with a significance level of 0.05.
Figure 1—figure supplement 5

Correlation between allosteric peaks and ATP-binding residues.
100,000 sets of 60 randomized positions were generated and for each such set the number of matches with the positions of the ATP-binding residues was counted. Shown is the probability distribution when considering only exact matches (A), or also first-coordination sphere interactions within a cutoff distance of ≤4 Å (B), or also second-coordination sphere interactions within a cutoff distance of ≤7 Å (C). Blue and red vertical lines indicate the mean value of matches for the random and Gaussian network model-transfer entropy (GNM-TE)-based predictions, respectively. Also shown are the p-value obtained by one-tailed hypothesis tests with a significance level of 0.05.
Figure 1—figure supplement 6
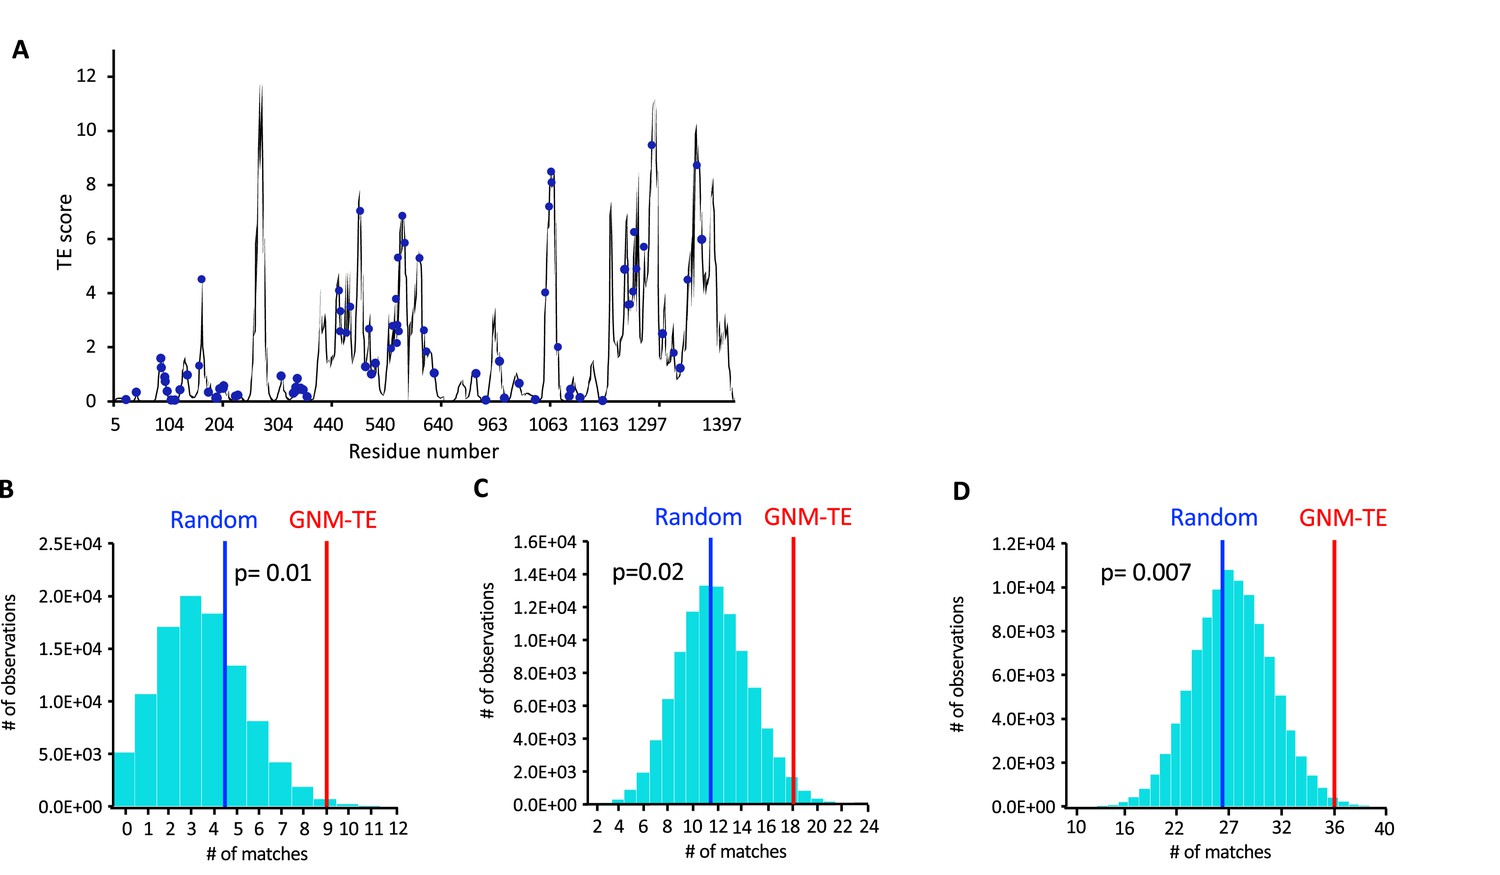
Correlation between allosteric peaks and positions of disease-causing mutations.
(A) Shown is the amount of information transmitted (transfer entropy [TE] score) by each residue of dephosphorylated ATP-free human cystic fibrosis transmembrane conductance regulator (CFTR) (PDB ID 5UAK) calculated using the 10 most collective Gaussian network model (GNM) modes (solid black trace). The positions of 86 missense disease-causing mutations (https://cftr2.org/) are shown as blue spheres. (B–D) 100,000 sets of 60 randomized positions were generated and for each such set the number of matches with the positions of the disease-causing mutations was counted. Shown is the probability distribution when considering only exact matches (B), or also first-coordination sphere interactions within a cutoff distance of ≤4 Å (C), or also second-coordination sphere interactions within a cutoff distance of ≤7 Å (D). Blue and red vertical lines indicate the mean value of matches for the random and GNM-TE-based predictions, respectively. Also shown are the p-values obtained by one-tailed hypothesis tests with a significance level of 0.05.
Figure 2
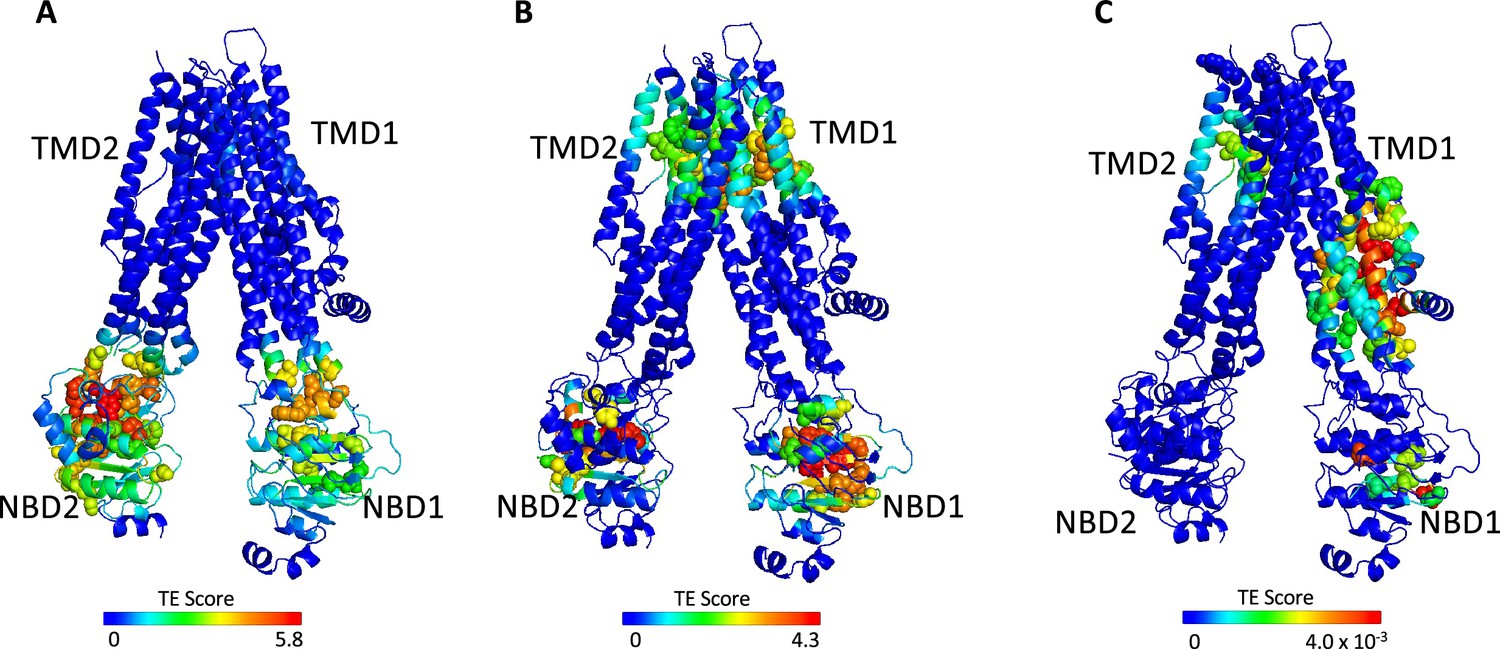
Identification of allosteric hotspots in dephosphorylated ATP-free cystic fibrosis transmembrane conductance regulator (CFTR).
A cartoon representation of dephosphorylated ATP-free human CFTR (PDB ID 5UAK), where each residue is colored according to the amount of information it transmits (transfer entropy [TE] score), expressed as transfer entropy × collectivity (TECol) calculated using the 10 most collective Gaussian network model (GNM) modes (A), or upon removal of the first (B) or first and second (C) most collective GNM modes. Red and blue colors represent high and low levels of information output, respectively.
Figure 3 with 2 supplements
ATP binding and phosphorylation rewires and focuses the allosteric connectivity of cystic fibrosis transmembrane conductance regulator (CFTR).
(A) Shown is the amount of information transmitted (transfer entropy [TE] score) by each residue of phosphorylated ATP-bound human CFTR (PDB ID 6MSM) calculated using the 10 most collective Gaussian network model (GNM) modes (solid black trace). The positions of the ATP-binding residues are shown as magenta spheres. (B, C) A cartoon representation of phosphorylated ATP-bound human CFTR (PDB ID 6MSM), where each residue is colored according to the amount of information it transmits (TE score), calculated using the 10 most collective GNM modes (B), or upon removal of the first most collective GNM mode (C). Red and blue colors represent high and low levels of information output, respectively, and the ATP molecules are shown as black/gray spheres. (D) A magnified view of the allosteric cluster that is adjacent to the docking site of the R domain.
Figure 3—figure supplement 1
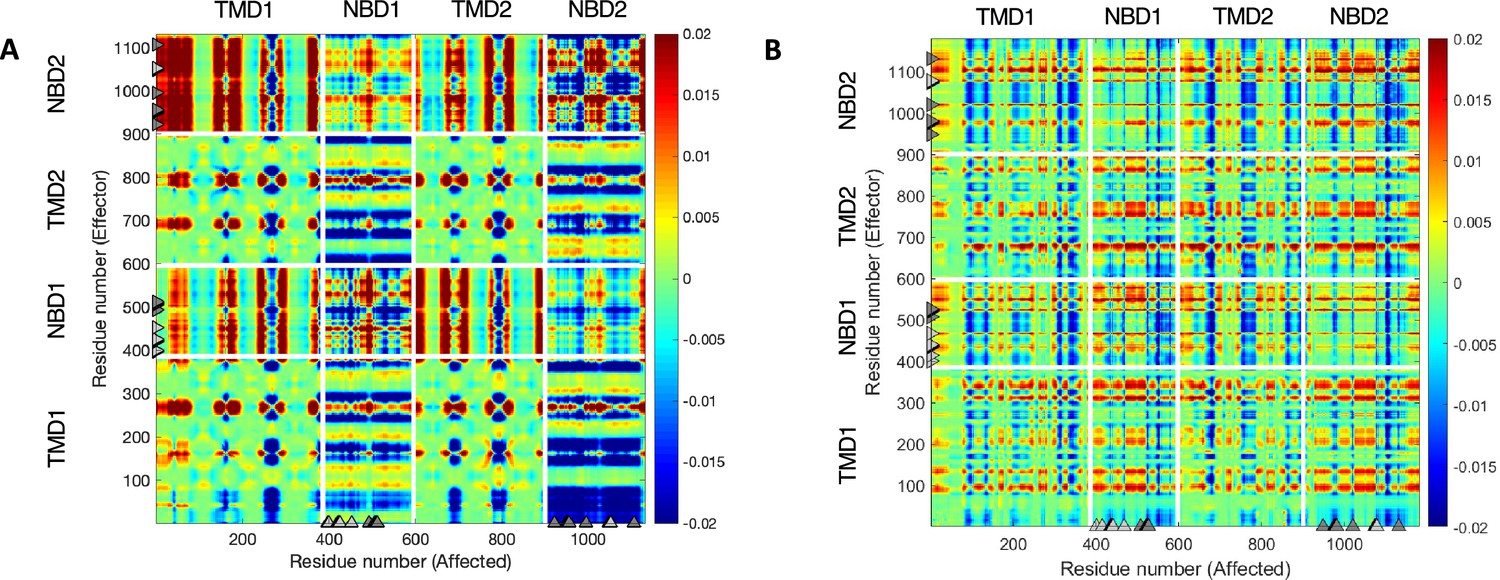
Phosphorylation and ATP binding rewires the allosteric connectivity in cystic fibrosis transmembrane conductance regulator (CFTR).
Net transfer entropy (TE) between all residues of CFTR was calculated using the 10 most collective Gaussian network model (GNM) modes for (A) dephosphorylated ATP-free human CFTR (PDB ID 5UAK) and for (B) phosphorylated ATP-bound human CFTR (PDB ID 6MSM). In this 2D cross-correlations map the transfer entropies from effector residues (Y-axis) to the affected residues (X-axis) are color coded, with red and blue colors indicating residues that transmit information (entropy sources) and residues that receive information, respectively. The white lines indicate the domain boundaries, and the gray triangles indicate the locations of the ATP-binding sites.
Figure 3—figure supplement 2

Conservation of the effect of ATP.
Shown is the amount of information transmitted (transfer entropy [TE] score) by each residue of dephosphorylated ATP-free (A) or phosphorylated ATP-bound (B) human (blue curves) or zebrafish (orange curves) cystic fibrosis transmembrane conductance regulator (CFTR) (PDB IDs 5UAK, 5UAR, 6MSM, 5W81, respectively).
Figure 4
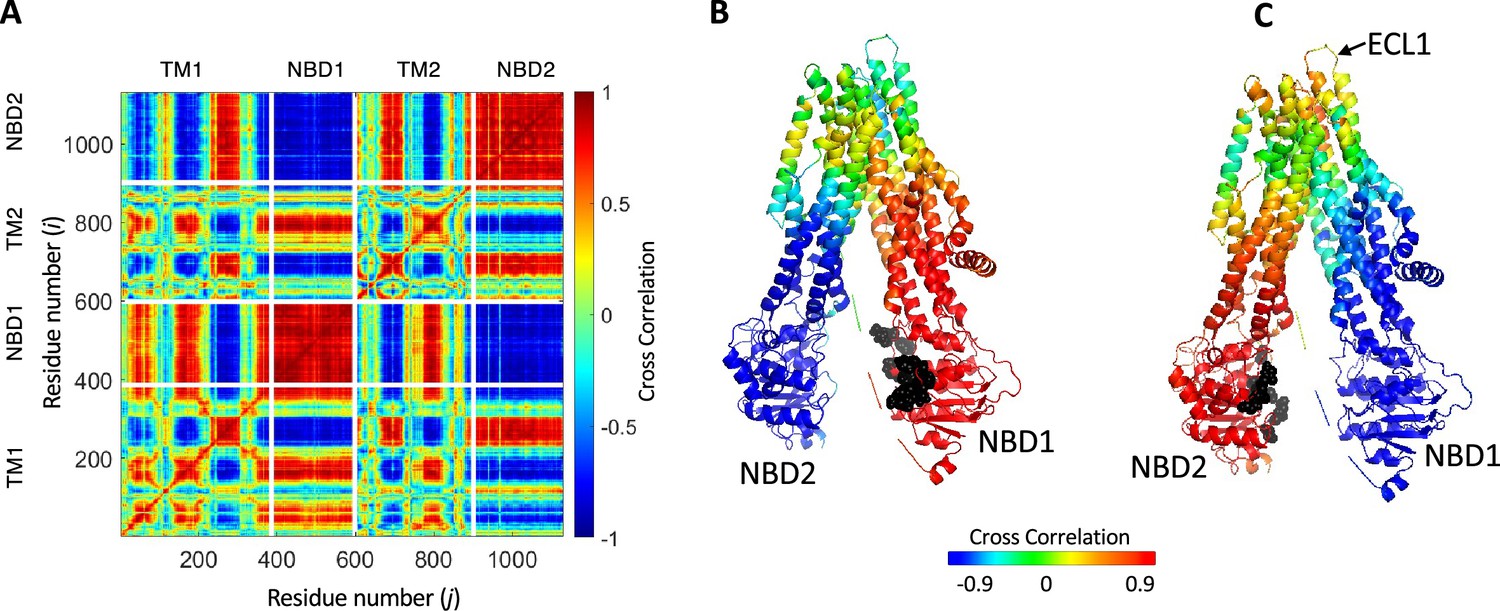
Synchronized movements of residues and domains of cystic fibrosis transmembrane conductance regulator (CFTR).
(A) Shown is a 2D map of the dynamic cross-correlations between all residues of CFTR during the conformational transiting from the dephosphorylated ATP-free state to the phosphorylated ATP-bound state (PDB ID 5UAK and 6MSM, respectively). Red colors indicate strong positive correlation, meaning that the residues move in parallel vectors in space and time, blue colors indicate negative correlations. Domain boundaries are indicated by white lines. (B, C) Cartoon representation of CFTR where each residue is colored according to its dynamic cross-correlations with the ATP-binding residues (black spheres) of nucleotide binding domain (NBD)1 (B) or NBD2 (C).
Figure 5 with 1 supplement
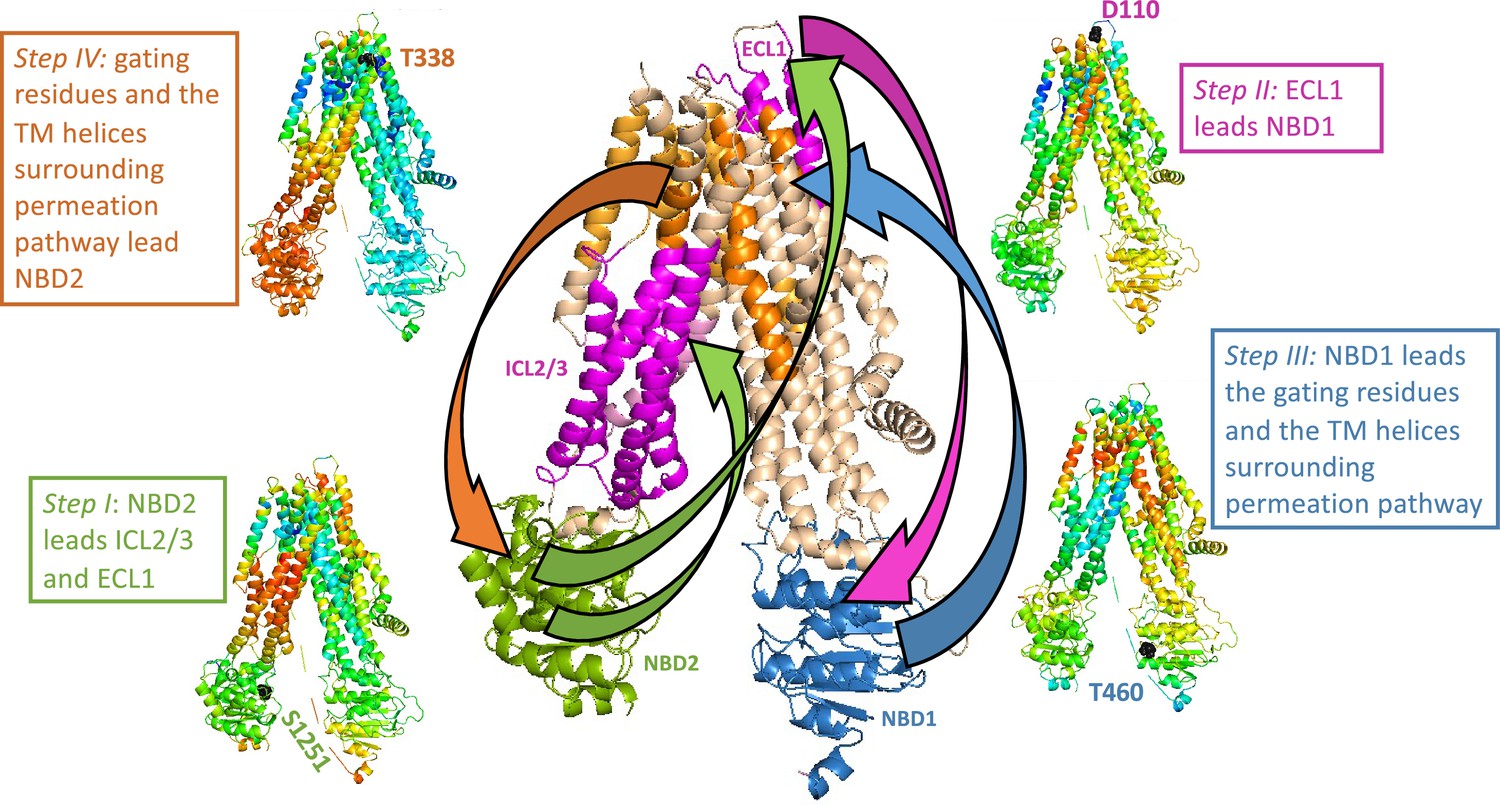
Trajectory and sequence of allosteric transduction in cystic fibrosis transmembrane conductance regulator (CFTR).
Dynamic cross-correlations were calculated using a time delay (τ) of 16 cycles out of 50 required to complete the conformational transition between the dephosphorylated ATP-free and phosphorylated ATP-bound states. Red and blue colors indicate high and low correlations, respectively. Steps I–IV: Each residue is colored according to the degree of the correlation of its movement at time (t + τ) relative to the movement at time (t) of S1251 of nucleotide binding domain (NBD)2 (step I), D110 of ECL1 (step II), T460 of NBD1 (step III), and the gating residue T338 (step IV). Center (large) panel: Shown is a summary of the allosteric trajectory, originating from NBD2 (green) to ICL2/3 and ECL1 (magenta), from ECL1 to NBD1 (blue), from NBD1 to the permeation pathway helices (orange), and finally back to NBD2.
Figure 5—figure supplement 1

Directionality of allosteric transduction in cystic fibrosis transmembrane conductance regulator (CFTR).
Shown is the time-delayed dynamic cross-correlation map for the transition between the ATP-free and ATP-bound conformations of CFTR. A time delay (τ) of 16 cycles (out of a 50 necessary to complete this transition) was imposed between residues i (vertical axis) and residues j (horizontal axis). Red and blue colors represent positive and negative correlations, respectively. As shown, the synchrony between the movements of nucleotide binding domain (NBD)2 and ICL2/3 and ECL1 are maintained if NBD2 moves first but are lost if the temporal order of the motions is reversed (compare solid and dashed green rectangles, respectively). Similarly, ECL1 and NBD1 move in synchrony only if the former leads the motion and not vice versa (compare solid and dashed magenta rectangles, respectively), NBD1 leads the motion of the permeation pathway TM helices (PPH, compare solid and dashed blue rectangles, respectively), and the gating residues and the permeation pathway TM helices lead NBD2 (compare solid and dashed orange rectangles, respectively).
Figure 6
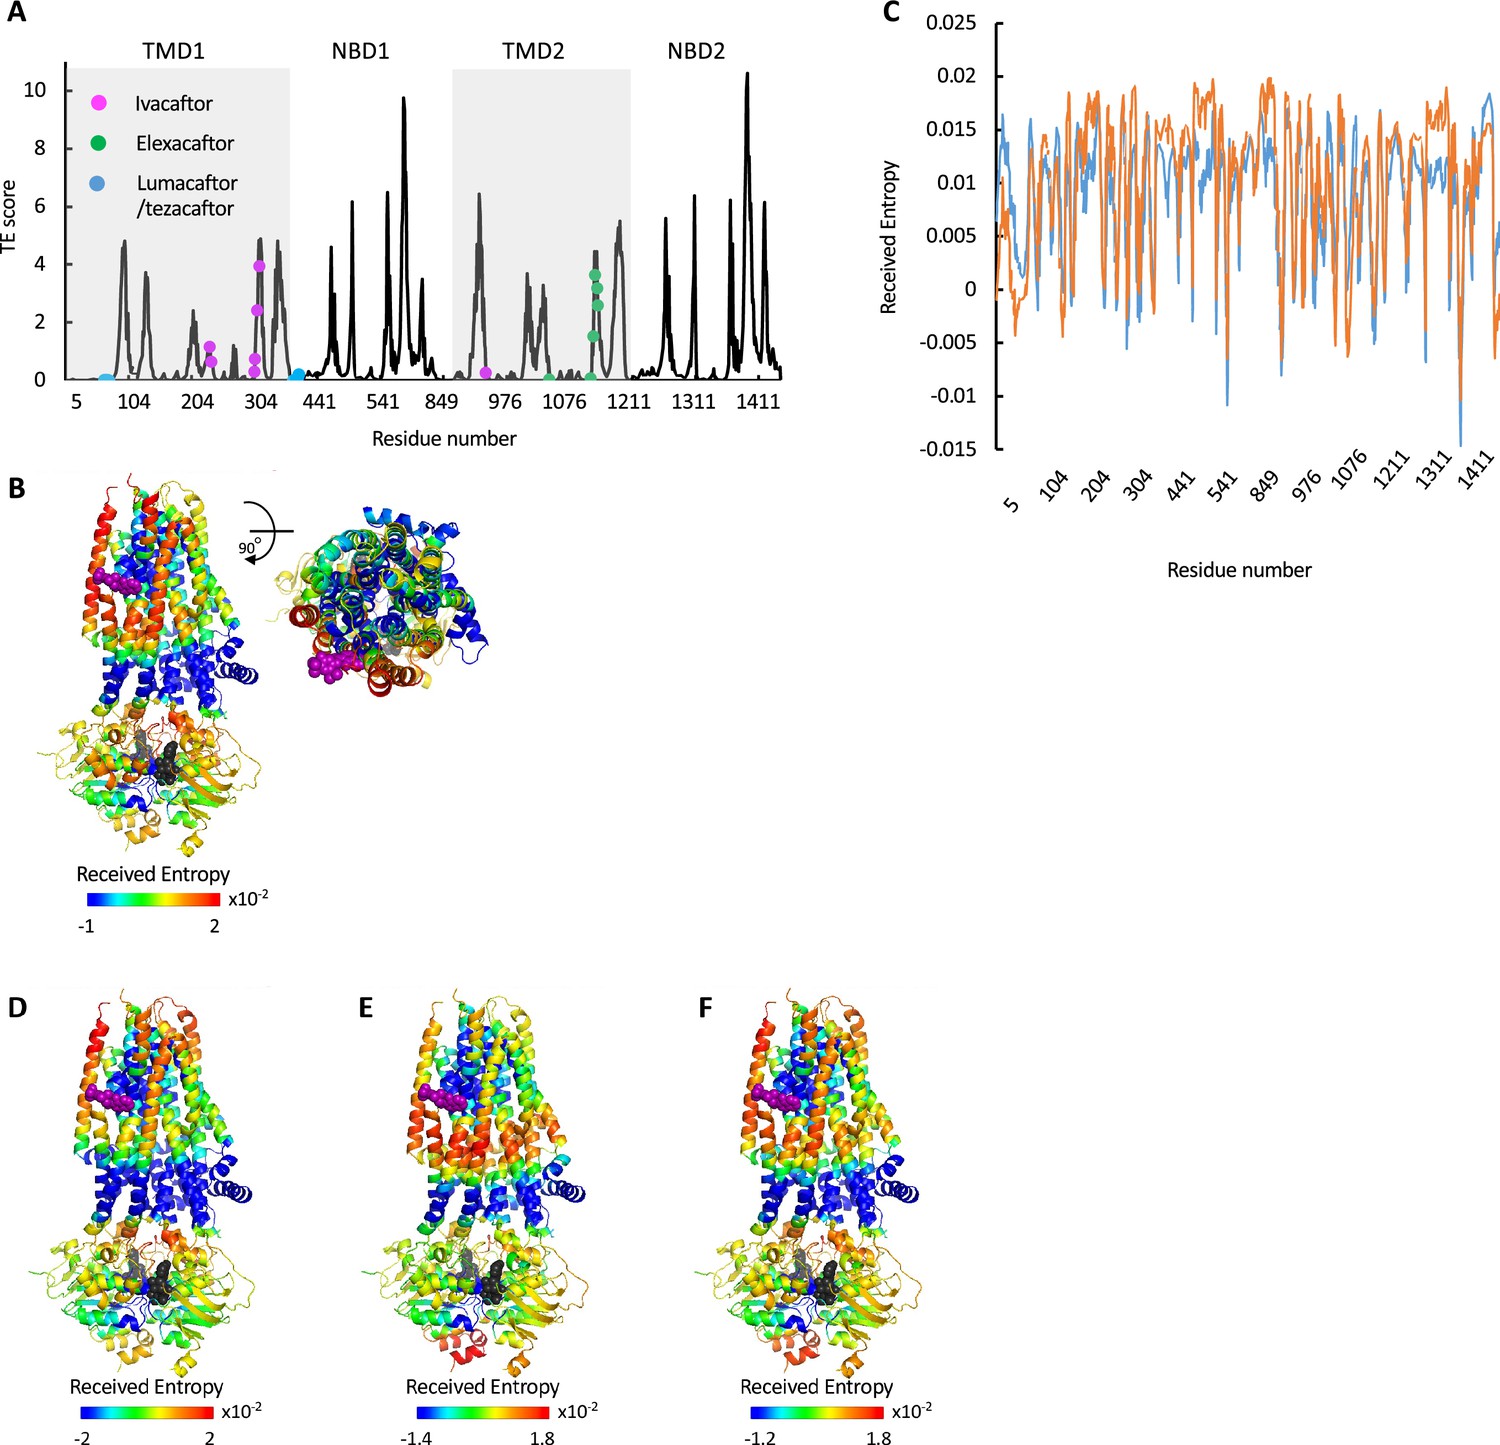
Allosteric modulation of cystic fibrosis transmembrane conductance regulator (CFTR) by drugs.
(A) Shown is the amount of information TRANSMITTED (transfer entropy [TE] score) by each residue of CFTR ΔF508 bound to Trikafta (PDB ID 8EIQ) calculated using the 10 most collective Gaussian network model (GNM) modes (solid black trace). The binding sites of ivacaftor, elexacaftor, and lumacaftor/tezacaftor are shown as magenta, green, or cyan spheres, respectively. (B) Cartoon representations of ivacaftor bound CFTR (PDB ID 6O2P), with ivacaftor and ATP shown as magenta and black/gray spheres, respectively. Residues are colored according to the amount of entropy RECEIVED from the ivacaftor binding residue F312 (C) Shown is the amount of entropy RECEIVED by each residue of CFTR from the ATP-binding residue G551 (blue trace) or the ivacaftor binding residue F312 (orange trace). (D–F) Same as B, only the residues are colored according to the amount of entropy RECEIVED from the gating residue F337 (D), the ATP-binding residue G551 (E), and the sum of the entropy received from both G551 and F337 (F).
Figure 7
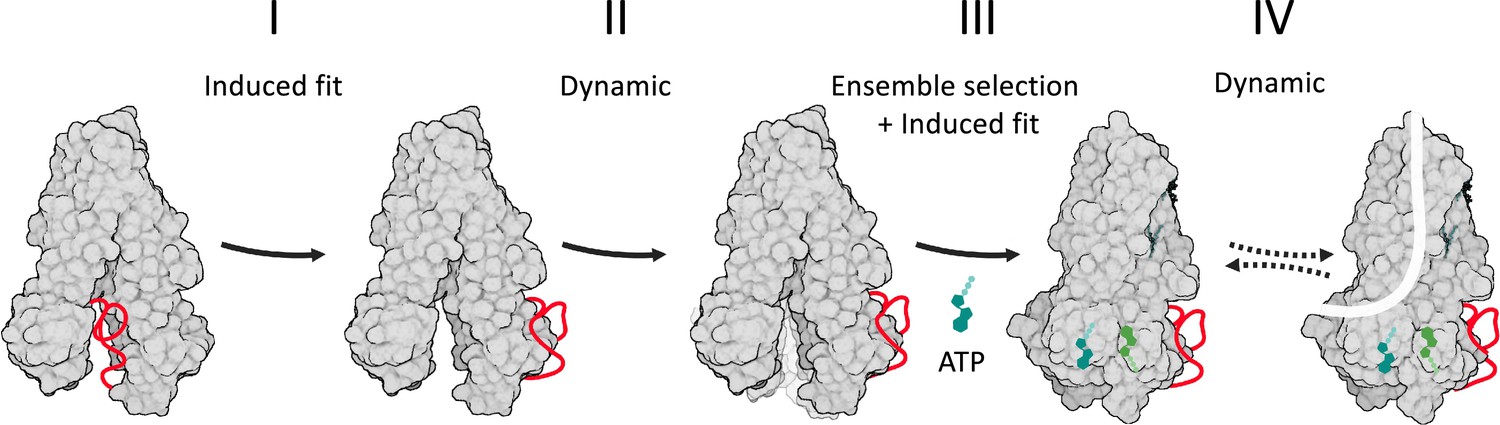
Model of cystic fibrosis transmembrane conductance regulator (CFTR’s) conformational changes and their allosteric control.
CFTR is shown in a gray space-filling model, the regulatory (R) domain as a red ribbon, and ATP in shades of green. Following its phosphorylation, the R domain dislodges from the nucleotide binding domains (NBDs) dimer interface (step I of the conformational change). This allows the ATP-binding residues to fluctuate and sample conformers near the NBDs-open state (step II), some of which provide an initial ATP-binding site. In step III, this subset of conformers is selected by ATP to initiate binding (i.e. ensemble selection), which then proceeds to complete closure of the NBDs by an induced fit mechanism. In step IV, the channel bursts to the conducting state by a dynamic mechanism, without a major conformational change.
Additional files
Download links
A two-part list of links to download the article, or parts of the article, in various formats.
Downloads (link to download the article as PDF)
Open citations (links to open the citations from this article in various online reference manager services)
Cite this article (links to download the citations from this article in formats compatible with various reference manager tools)
Computational analysis of long-range allosteric communications in CFTR
eLife 12:RP88659.
https://doi.org/10.7554/eLife.88659.3


