Reprogramming of cardiac phosphoproteome, proteome, and transcriptome confers resilience to chronic adenylyl cyclase-driven stress
- Laboratory of Cardiovascular Science, Intramural Research Program, National Institute on Aging, National Institutes of Health, United States
- Department of Immunology, St. Jude Children’s Research Hospital, United States
Figures
Figure 1 with 2 supplements
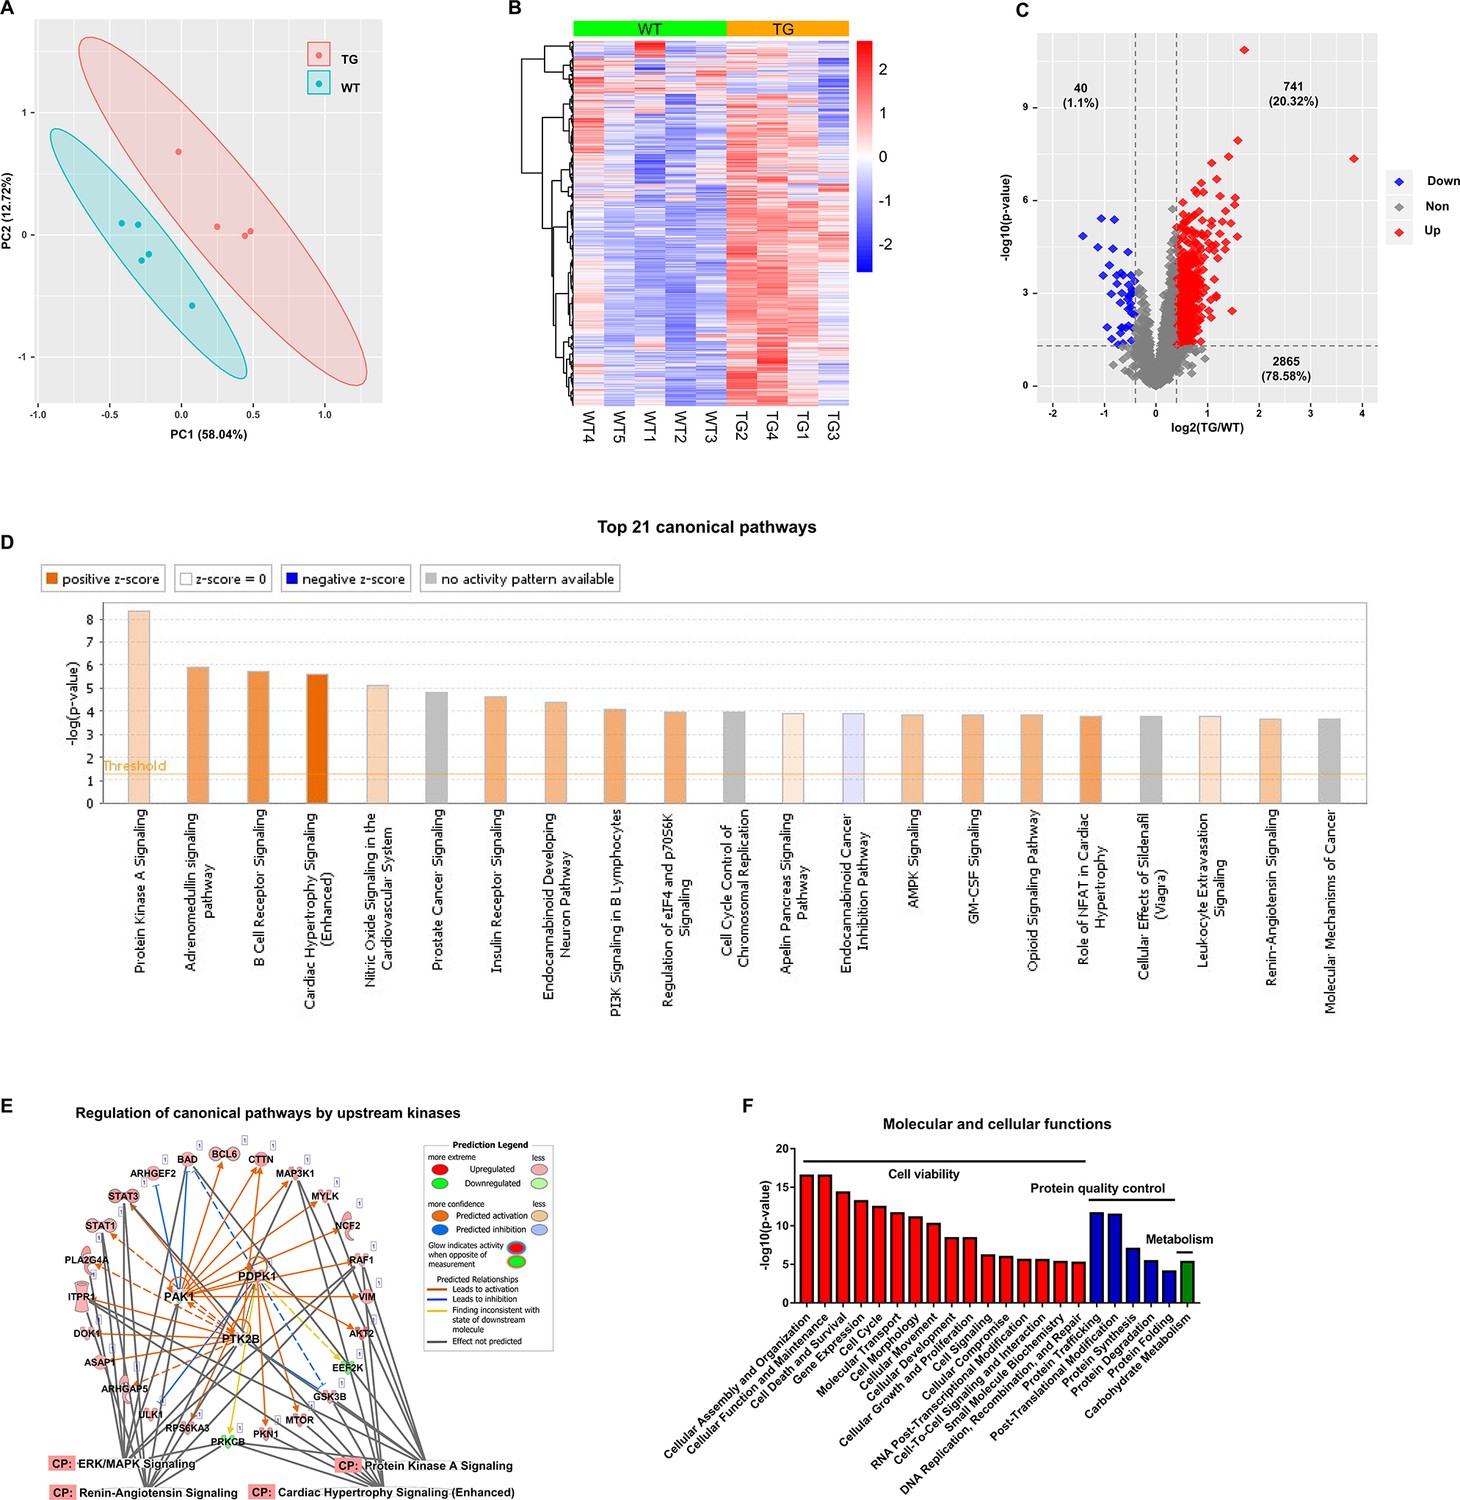
Cardiac-specific overexpression of adenylyl cyclase type 8 (TGAC8) reprograms the left ventricle (LV) phosphorylation state.
(A) Principal component analysis (PCA) plot of phosphoproteome in TGAC8 vs. WT LVs. (B) Heatmap of scaled expressions of phosphorylated proteins. (C) Volcano plot of phosphoproteome. Red dots represent upregulated phosphoproteins with -log10(p-value)>1.3 and log2(fold change)≥0.4; blue dots represent downregulated phosphoproteins with -log10(p-value)>1.3 and log2(fold change)≤–0.4; gray dots represent nonsignificantly regulated phosphoproteins with -log10(p-value)≤1.3 or absolute(log2(fold change))<0.4. (D) Top 21 canonical pathways enriched from phosphoproteome. Orange and blue bars represent activated and inhibited pathways, respectively. The darker the color is, the greater the absolute(z-score) is, and the more significantly enriched the pathway is. (E) Regulatory pathway from upstream kinases. Three dots in the center represent the predicted upstream kinases. Surrounding dots represent identified phosphoproteins differentially regulated in phosphoproteome. Terms on the bottom represent canonical pathways in which the phosphoproteins are involved. Meanings of colors refer to the box of prediction legend besides the graph. (F) Enriched molecular and cellular functions from the phosphoproteome. They are related to three categories, including cell viability, protein quality control, and metabolism.
Figure 1—figure supplement 1
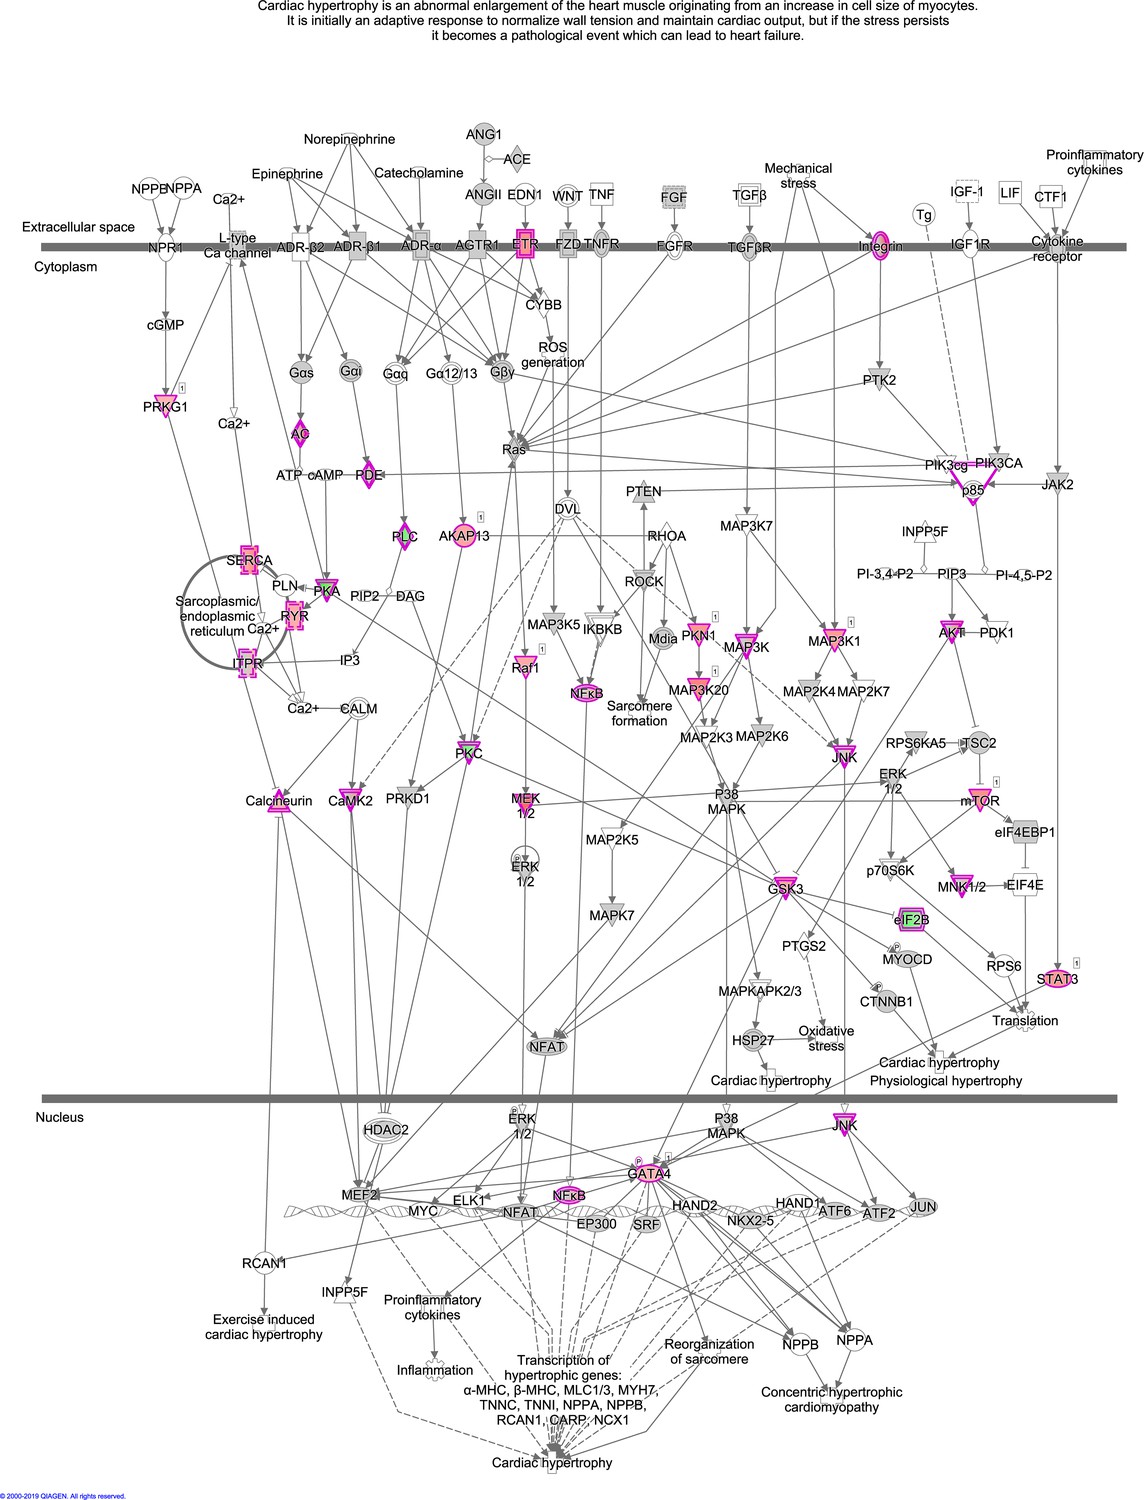
The enriched pathway, Cardiac Hypertrophy Signaling (Enhanced), from the phosphoproteome.
Cardiac Hypertrophy Signaling (Enhanced) is visualized using ingenuity pathway analysis (IPA). Dots with purple outlines are identified phosphoproteins or protein complexes. Red and green fill colors indicate upregulation and downregulation, respectively.
Figure 1—figure supplement 2
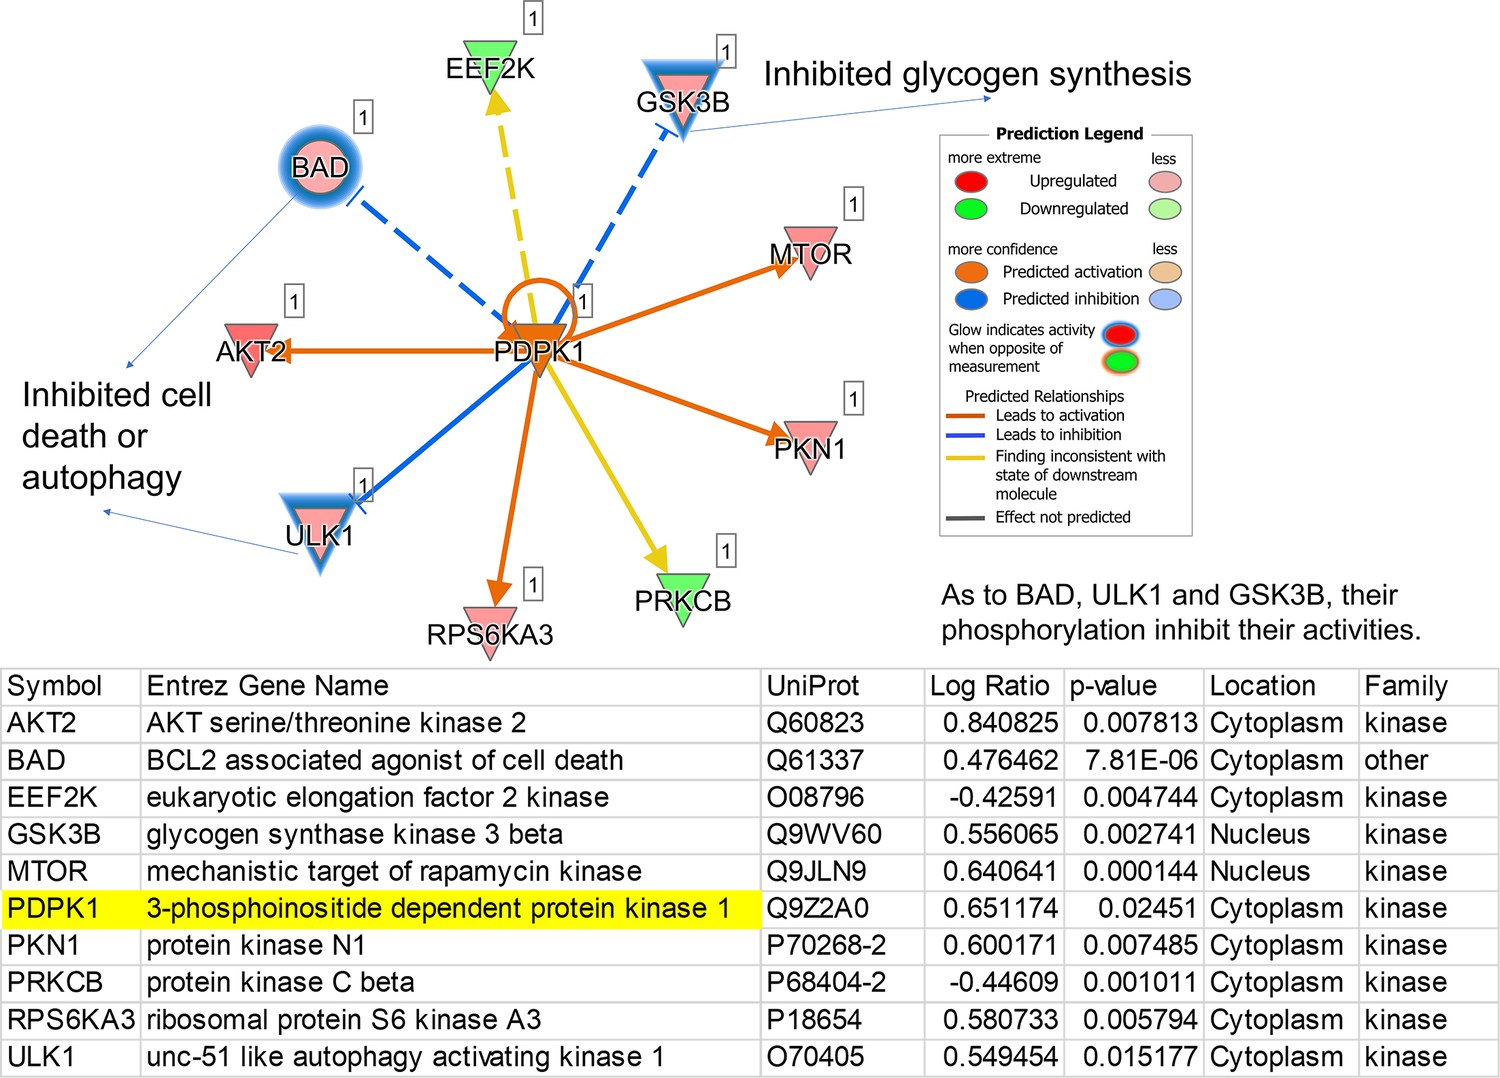
The regulatory pathway is under the control of a predicted upstream kinase, PDPK1.
PDPK1 in the center is one representative of predicted upstream kinases. Surrounding dots represent identified phosphoproteins differentially regulated in phosphoproteome. Meanings of colors refer to the box of prediction legend beside the graph. Blue glows represent that the increased phosphorylation levels inhibit the activity of corresponding proteins.
Figure 2

Characteristics of upregulated phosphopeptides.
(A) Composition of phosphosites that reside on the upregulated phosphopeptides. (B) Sequence logo diagrams of upregulated phosphopeptides centered on the phosphosites and flanked by six amino acids on the N and C termini, respectively using WebLogo online software. Colors of amino acids represent different chemical properties. (C) Western blots of phosphorylation of protein kinase A (PKA) substrates and their statistics results: RRXS*/T*. Unpaired Student’s t-test with Welch’s correction was used.(D) Test the amphiphilicity feature of the upregulated phosphopeptides using iceLogo online software and refer to a published work by Mitaku and colleagues in 2002 (Mitaku et al., 2002).
Figure 3

Integrative analysis of transcriptome, proteome, and phosphoproteome.
(A) Circos plot of gene expression at different levels from transcription, to protein, and to phosphorylation. Bars in each layer of circle represent changes in significantly regulated molecules (q-value or p-value <0.05) in transcriptome, total proteome, and unnormalized phosphoproteome. Bar height, color, and direction represent log2(fold change). Red and upward indicate upregulation, and blue and downward indicate downregulation. (B–C) Scatter plots of correlation between phosphoproteome and transcriptome (B) or total proteome (C). (D) Comparison of canonical pathway enrichments from the transcriptome, total proteome, and phosphoproteome. Enrichment z-scores were calculated in IPA, and were scaled to generate heatmap in R language. (E) Integrative graph of expression of all phosphoproteins and selected types of molecules. Bar plot on the bottom displays expression of all significantly changed (p-value <0.05) phosphoproteins in unnormalized phosphoproteome. Y-axis denotes log2(fold change), and x-axis denotes each molecule ranked by log2(fold change). Bars were colored by -log10(p-value). Stick plots on the top display kinases, phosphatases, and transcription factors (TFs) selected from the bottom bar plot and their changes in transcriptome (RNA), total proteome (pro), and normalized phosphoproteome (norm). From top to bottom: each large block denotes the changes of certain types of molecules (from kinases to phosphatases, to TFs). In each block, the three rows from top to bottom indicate the changes in transcriptome, total proteome, and normalized phosphoproteome. Each stick represents a molecule and color represents the change: red: (p-value or q-value <0.05) and log2FC >0; blue: (p-value or q-value <0.05) and log2FC <0; black: (p-value or q-value ≥0.05) or log2FC = 0; gray: unidentified in one of the omics. Their locations are matched to those in the bottom bar plot. (F–J) Pie plots of the composition of phosphoproteins in the unnormalized phosphoproteome. Regardless of p-value, numbers of four types of proteins, including kinases, phosphatases, TFs, and others, are displayed in (F). After filtration with cutoff p-value <0.05, numbers of those types of proteins are displayed in (G). Extracted from G, numbers of upregulated and downregulated kinases (H), phosphatases (I), and TFs (J) are displayed.
Figure 4
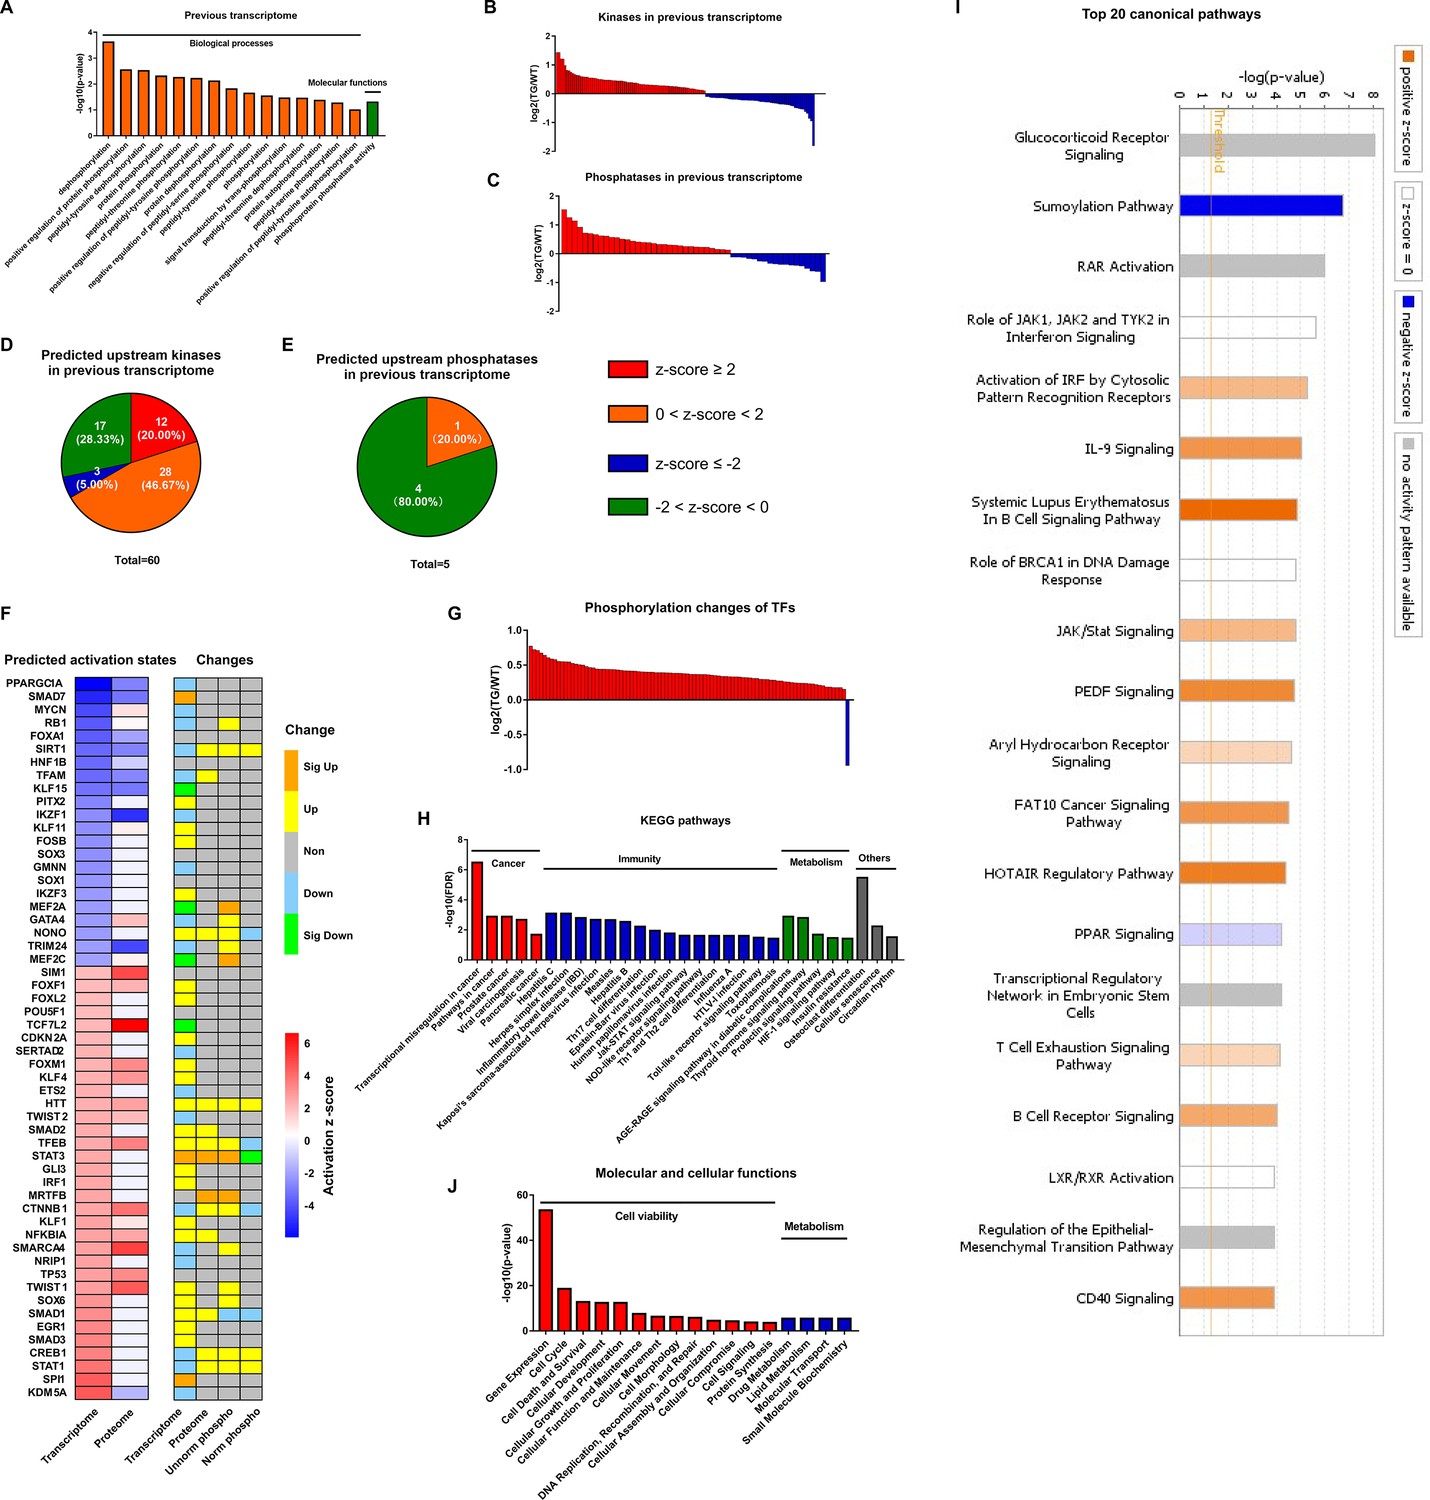
Coordination of phosphoproteome and transcriptome.
(A) Gene ontology (GO) term enrichments of biological processes and molecular functions about phosphorylation and dephosphorylation from transcriptome. (B–C) Changes of kinases (B) and phosphatases (C) whose q-values are less than 0.05 in transcriptome. (D–E) States of upstream kinases (D) and phosphatases (E) are predicted based on transcriptome. Z-scores were calculated in ingenuity pathway analysis (IPA). Positive and negative z-scores indicate activated and inhibited states, respectively. The larger absolute values of z-score indicate more activated or inhibited states. (F) Heatmap of predicted upstream transcription regulators (left) and their changes in different omics datasets (right). Left: Fill color represents activation z-scores in transcriptome and total proteome. Red and blue indicate activated and inhibited states, respectively. Molecules are ranked by z-scores in transcriptome. Right: Fill color represents changes in transcriptome, total proteome, unnormalized phosphoproteome, and normalized phosphoproteome: orange: (p-value or q-value <0.05) and log2FC >0; yellow: (p-value or q-value ≥0.05) and log2FC >0; green: (p-value or q-value <0.05) and log2FC <0; light blue: (p-value or q-value ≥0.05); and log2FC <0; gray: unidentified in one of the omics. (G) Changes of differentially regulated transcription factors (TFs) with p-value <0.05 in the unnormalized phosphoproteome. (H) Kyoto Encyclopedia of Genes and Genomes (KEGG) pathway enrichments of the differentially regulated TFs. They are in four primary categories: cancer, immunity, metabolism, and others. (I) Top 20 canonical pathways enriched from the phosphoproteome using IPA. The darker the color is, the greater the absolute(z-score) is, and the more significantly enriched the pathway is. (J) Enriched molecular and cellular functions from the phosphoproteome using IPA. They are in two primary categories: cell viability and metabolism.
Figure 5

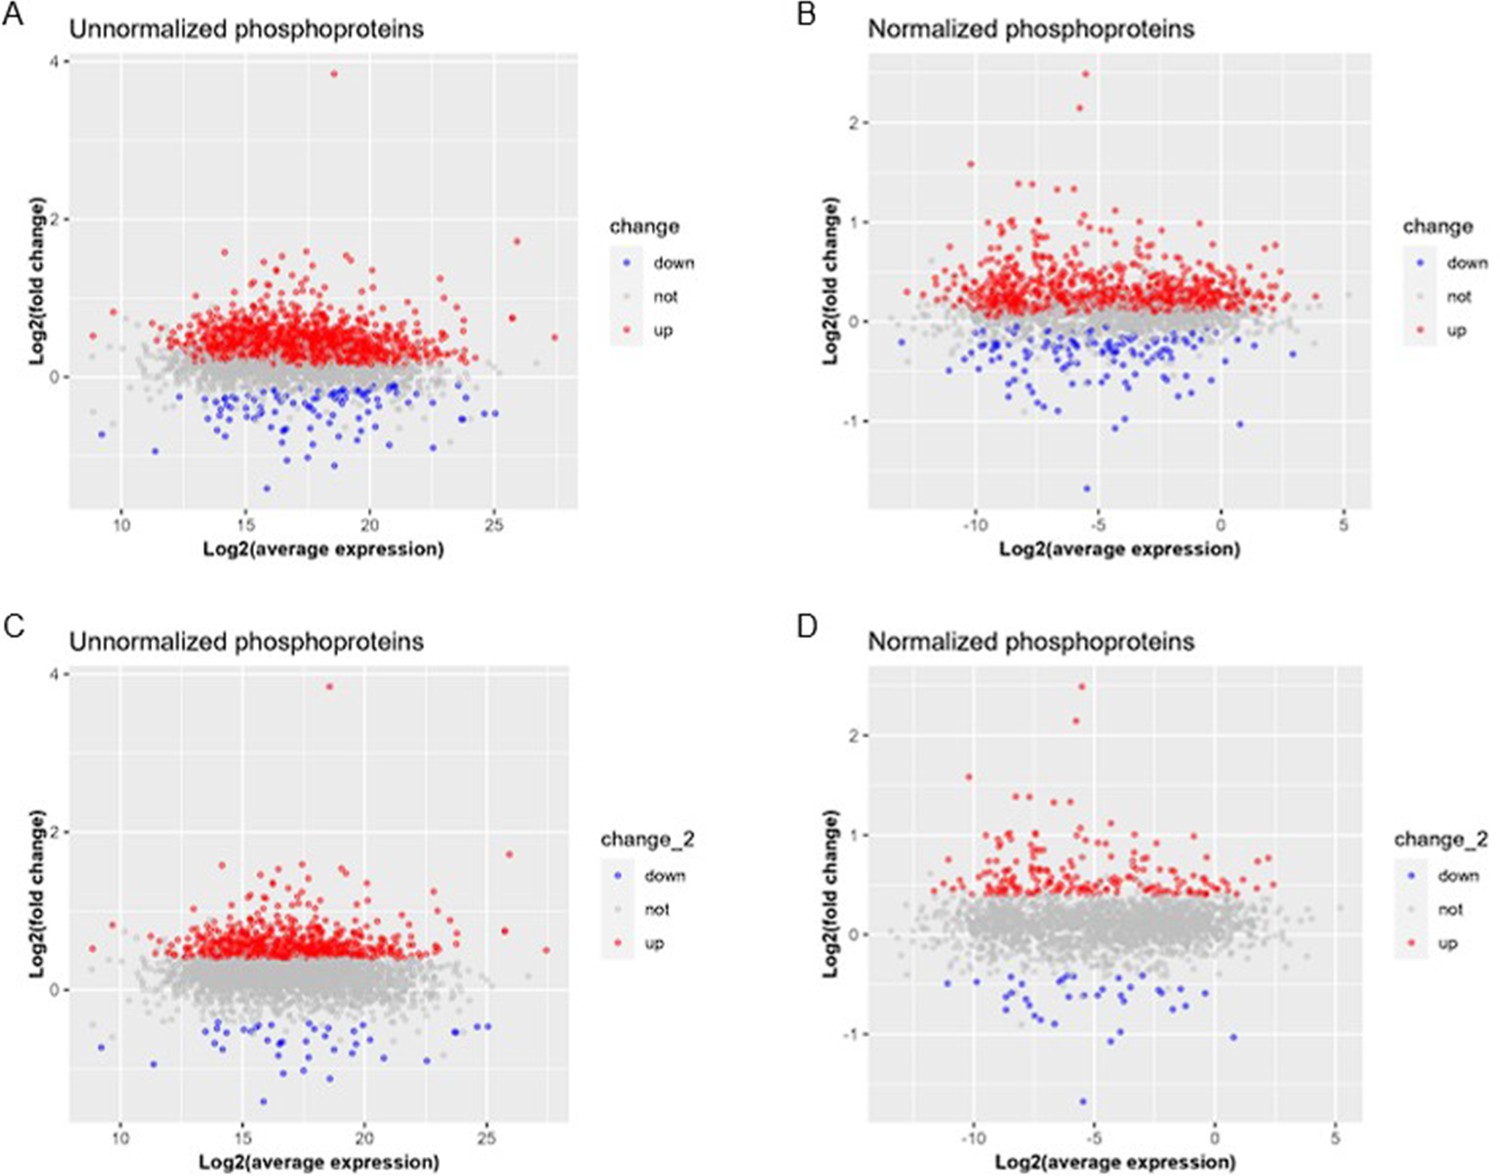
Analysis of normalized phosphoproteome.
(A) Gene ontology (GO) term enrichments of biological processes and molecular functions about phosphorylation and dephosphorylation from the present proteome. (B–C) Changes of kinases (B) and phosphatases (C) whose q-values are less than 0.05 in previous proteome. (D–E) States of upstream kinases (D) and phosphatases (E) are predicted based on the present proteome. Z-scores were calculated in ingenuity pathway analysis (IPA). Positive and negative z-scores indicate activated and inhibited states, respectively. The larger absolute values of z-score indicate more activated or inhibited states. (F) Venn plot of new total proteome and unnormalized phosphoproteome that were conducted concurrently in the same platform. (G) Principal component analysis (PCA) plot of phosphoproteome normalized to total proteome. (H) Heatmap of expressions of phosphoproteins normalized to total proteins.(I) Volcano plot of normalized phosphoproteome. Red dots represent upregulated phosphoproteins with -log10(p-value)>1.3 and log2(fold change)≥0.4; blue dots represent downregulated phosphoproteins with -log10(p-value)>1.3 and log2(fold change)≤–0.4; gray dots represent nonsignificantly regulated phosphoproteins with -log10(p-value)≤1.3 or absolute(log2(fold change))<0.4. (J) Comparison of canonical pathway enrichments between unnormalized and normalized phosphoproteome. Orange fill colors indicate that all comparable pathways on the top are activated in both omics datasets. The darker the color is, the greater the absolute(z-score) is, and the more significantly enriched the pathway is.
Figure 6 with 1 supplement

Coordinated regulation of transcriptome, proteome, and phosphoproteome on PI3K/AKT and ERK/MAPK signaling pathways and protein synthesis and degradation.
(A) Canonical pathway enrichment of phosphoproteome only with cutoffp-value <0.05. The darker the color is, the greater the absolute (z-score) is, and the more significantly enriched the pathway is. (B) Comparison of PI3K/AKT signaling and protein ubiquitination pathways enriched from transcriptome (red outline), proteome (blue outline), and phosphoproteome (green outline). (C–D) Western blots of two phosphorylation sites on pan-AKT protein for verification of phosphorylation and activation of PI3K/AKT signaling pathway in cardiac-specific overexpression of adenylyl cyclase type 8 (TGAC8) vs. wild-type (WT). (E) Western blot of ubiquitination in TGAC8 vs. WT. (F) Pathway graph of PI3K/AKT signaling marked with changes in transcriptome (left box), proteome (middle box), and phosphoproteome (right box). Fill colors indicate changes: red and green indicate upregulation and downregulation, respectively; gray indicates nonsignificant regulation. (G) Phosphopeptide number of substrates of PI3K. Y-axis represents protein substates of PI3K; x-axis represents number of phosphopeptides. Red and blue bars indicate upregulated (p-value <0.05 and log2(fold change)>0) and downregulated (p-value <0.05 and log2(fold change)<0) phosphopeptides, respectively. Two-tailed unpaired Student’s t-test with Welch’s correction was conducted and p-values were shown in plots.
-
Figure 6—source data 1
The full raw unedited gels and blots and figures with the uncropped gels or blots with the relevant bands associated with Figure 6C and D.
- https://cdn.elifesciences.org/articles/88732/elife-88732-fig6-data1-v1.zip
-
Figure 6—source data 2
The full raw unedited gels and blots and figures with the uncropped gels or blots with the relevant bands associated with Figure 6E.
- https://cdn.elifesciences.org/articles/88732/elife-88732-fig6-data2-v1.zip
Figure 6—figure supplement 1
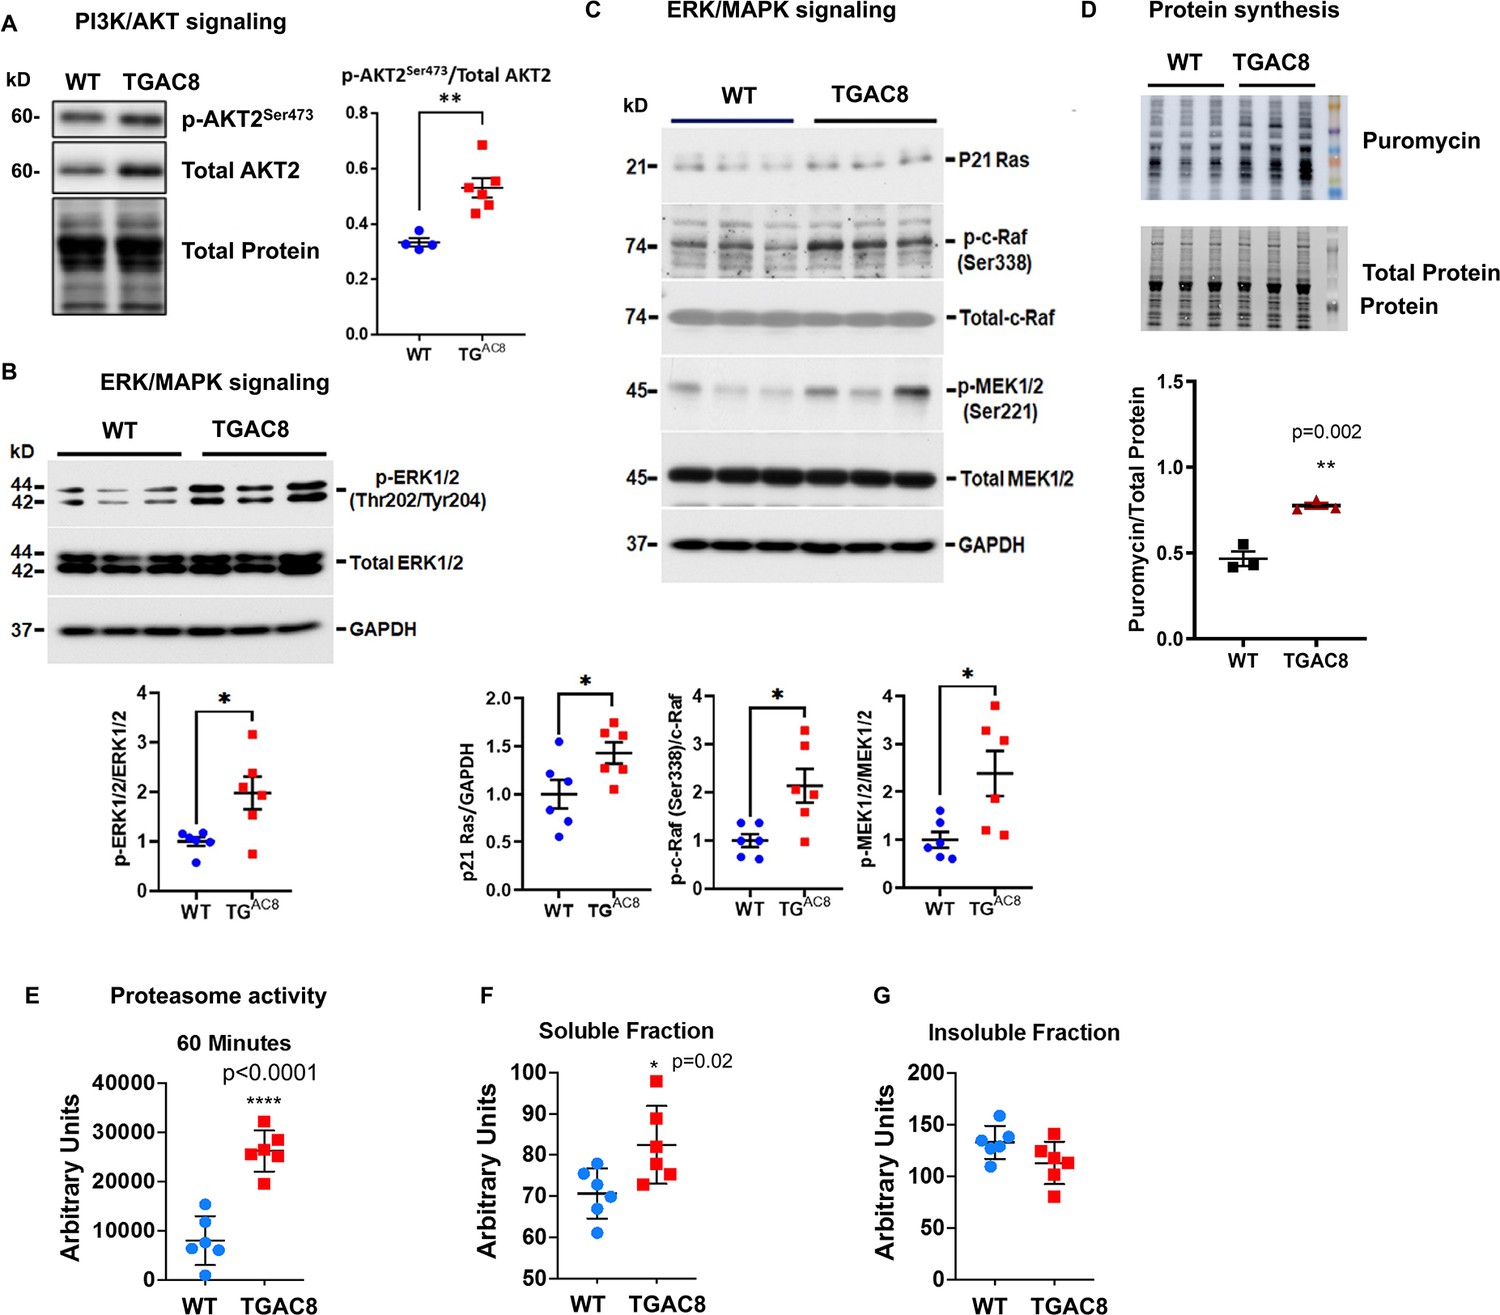
Cross-verification of activated PI3K/AKT and ERK/MAPK signaling pathways and enhanced protein synthesis and degradation from our previous study.
(A) Western blots of one phosphorylation site on isoform 2 of AKT protein for verification of phosphorylation and activation of PI3K/AKT signaling pathway in cardiac-specific overexpression of adenylyl cyclase type 8 (TGAC8) vs. wild-type (WT). (B–C) Western blot verification of phosphorylation and activation of ERK/MAPK signaling pathway in TGAC8 vs. WT. (D) Confirmation of enhanced protein synthesis in TGAC8 vs. WT. (E) The enhanced proteasome activity in TGAC8 vs. WT. (F–G) The soluble misfolded proteins were increased in TGAC8 LV (F) whereas the insoluble protein aggregates did not accumulate within the TGAC8 vs. WT (G). Two-tailed unpaired Student’s t-test with Welch’s correction was performed. p-values: *<0.05, **<0.01, ***<0.001, ****<0.0001. These data were adapted from our recently published study in TGAC8 and WT mice (Tarasov, 2022).
Figure 7

Analyses of proteins changed discordantly in proteome and phosphoproteome.
(A) Venn diagram of significantly regulated proteins in total proteome and significantly regulated phosphoproteins in unnormalized phosphoproteome that were conducted concurrently in the same platform. (B–D) Functional analyses of proteins whose expressions are changed discordantly at total protein and phosphorylation levels. Mitochondria and others are enriched in cellular component analysis (B). Functions related to metabolism, mitochondria, and others are enriched in Reactome pathway (C) and biological process analyses (D).
Figure 8
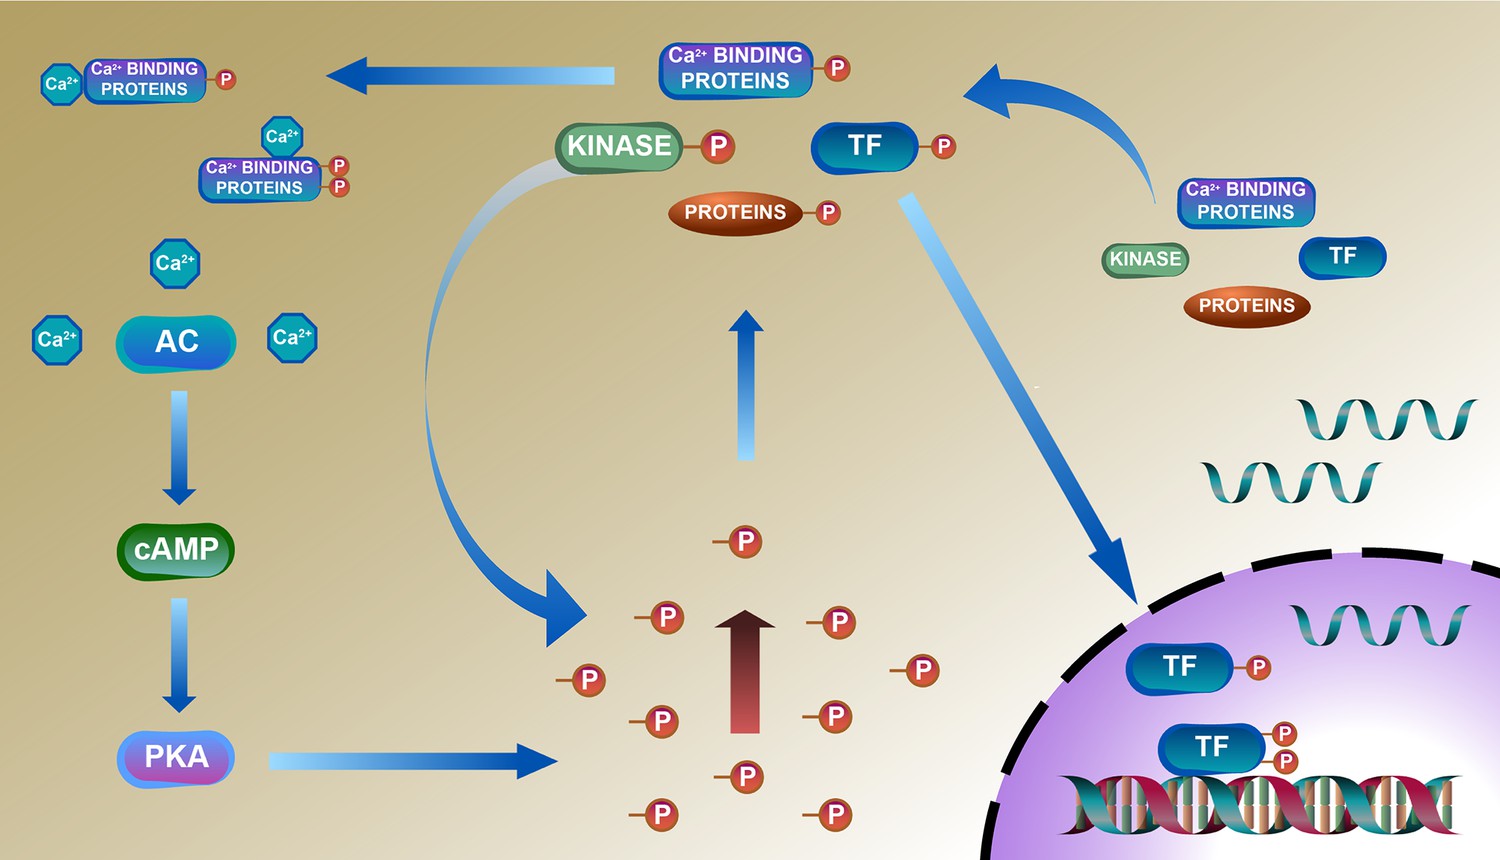
Deduced schematic of coordination of phosphoproteome with transcriptome and proteome in cardiac-specific overexpression of adenylyl cyclase type 8 (TGAC8) mouse left ventricle (LV).
Based on our results, we deduced a mechanism of reprogramed phosphoproteome in TGAC8 mouse LV: First, TGAC8 mouse induces a PKA-dependent phosphorylation via AC8-cAMP-PKA axis. Many cytoplasmic proteins including transcription factors (TFs) are thus phosphorylated and then transported into the nuclear where TFs recognize and bind to the promotors to activate the transcription of more regulatory factors, including kinases, phosphatases, and TFs. The activation states of these factors are changed upon phosphorylated in the cytosol, thereby activating additional kinases-controlled phosphorylation cascades and reprogramming the cardiac phosphoproteome comprehensively. Left column: AC8-cAMP-PKA signaling; middle column: phosphorylation (phosphoproteome); lower right: transcription (transcriptome); upper right: translation (proteome).
Figure 9
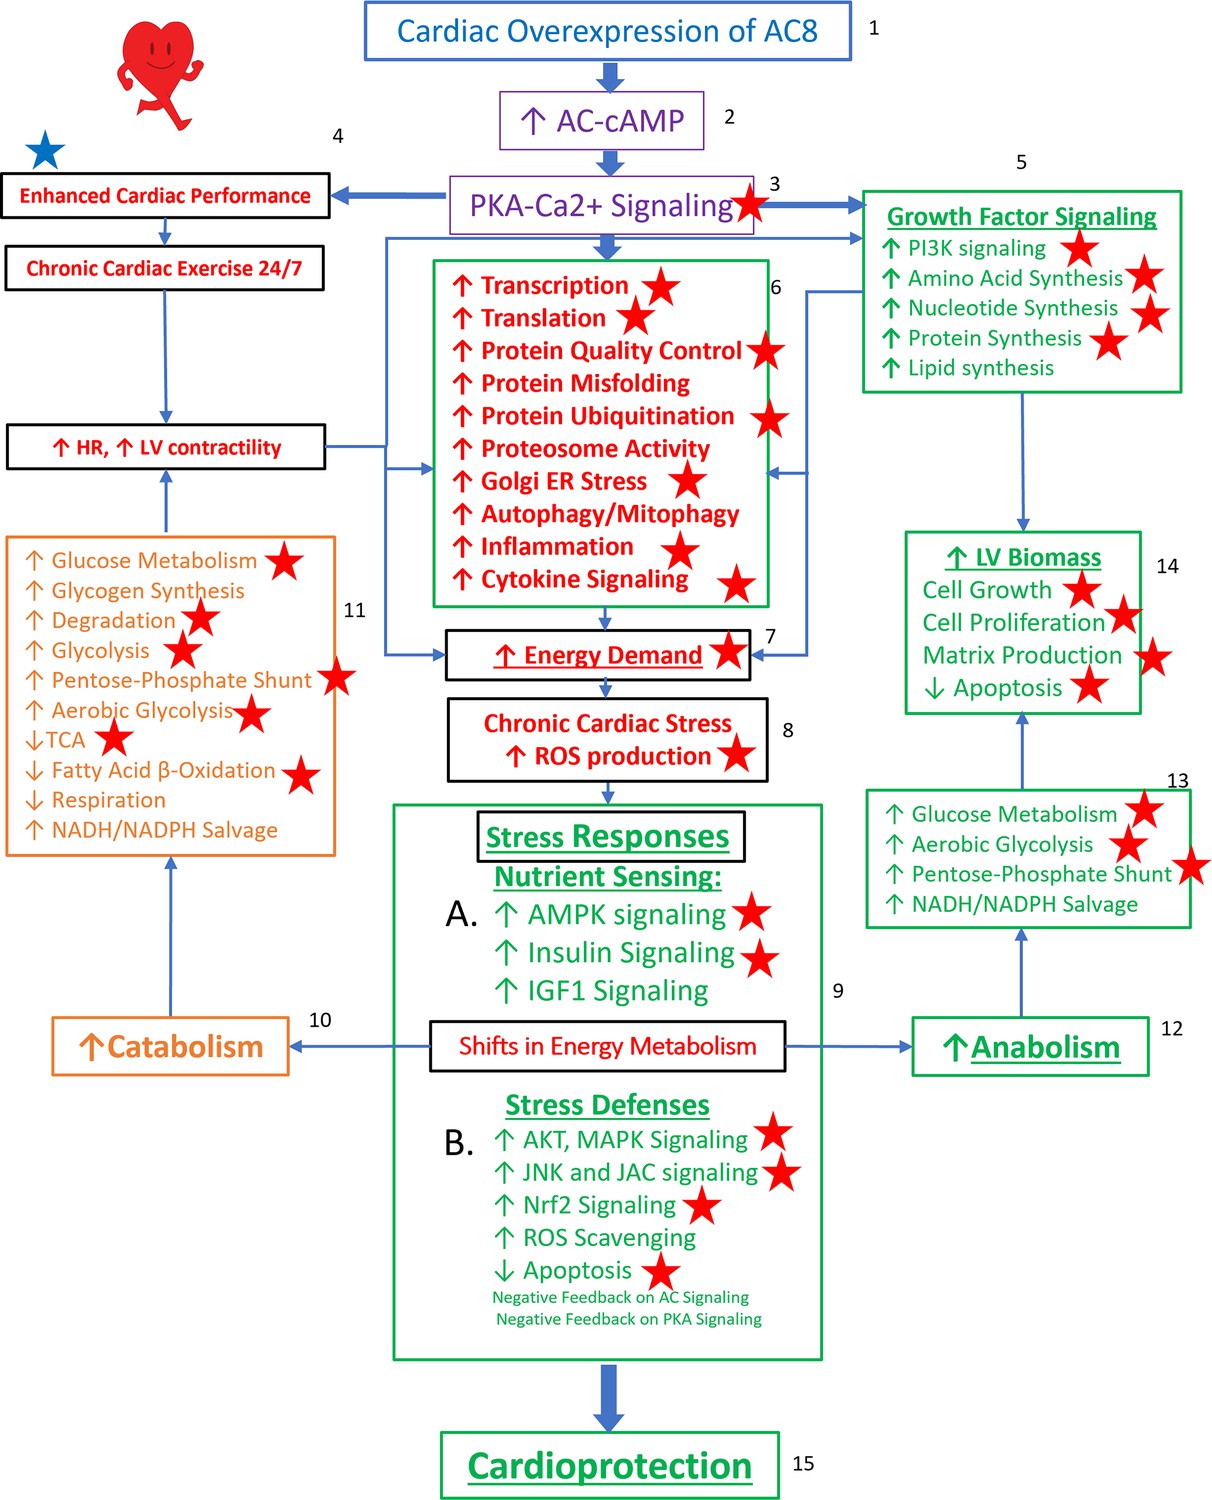
Reprogrammed concentric performance and protection circuitry in response to the constitutive challenge of marked cardiac-specific overexpression of adenylyl cyclase type 8 (TGAC8).
Based on the present phosphoproteome, we optimized our previously deduced mechanism graph and labeled findings from the phosphoproteome using red stars. TGAC8 mouse induces a chronic cardiac exercise on the heart, manifested as increased heart rate and contractility accompanied with increased energy demand and cardiac biomass. Multiple signaling pathways, related to nutrient sensing, energy production, cardiac cellular stress, cardiac stress response, growth factor signaling, and cell proliferation, are potential downstream mediating the effect of the activated AC8-cAMP-PKA-Ca2+ signaling in mouse left ventricle (LV). The altered cardiac functions were also observed associated with protein phosphorylation in our previous study and labeled in blue star here.
Author response image 1
Additional files
Download links
A two-part list of links to download the article, or parts of the article, in various formats.
Downloads (link to download the article as PDF)
Open citations (links to open the citations from this article in various online reference manager services)
Cite this article (links to download the citations from this article in formats compatible with various reference manager tools)
Reprogramming of cardiac phosphoproteome, proteome, and transcriptome confers resilience to chronic adenylyl cyclase-driven stress
eLife 12:RP88732.
https://doi.org/10.7554/eLife.88732.3


