Statistical examination of shared loci in neuropsychiatric diseases using genome-wide association study summary statistics
- Department of Basic and Clinical Neuroscience, Maurice Wohl Clinical Neuroscience Institute, King’s College London, United Kingdom
- Department of Biostatistics and Health Informatics, King’s College London, United Kingdom
- NIHR Maudsley Biomedical Research Centre (BRC) at South London and Maudsley NHS Foundation Trust and King’s College London, United Kingdom
- Social, Genetic and Developmental Psychiatry Centre, Institute of Psychiatry, Psychology and Neuroscience, King’s College London, United Kingdom
- Perron Institute for Neurological and Translational Science, Australia
- Centre for Molecular Medicine and Innovative Therapeutics, Murdoch University, Australia
- Institute of Health Informatics, University College London, United Kingdom
- NIHR Biomedical Research Centre at University College London Hospitals NHS21 Foundation Trust, United Kingdom
- King’s College Hospital, United Kingdom
Figures
Figure 1
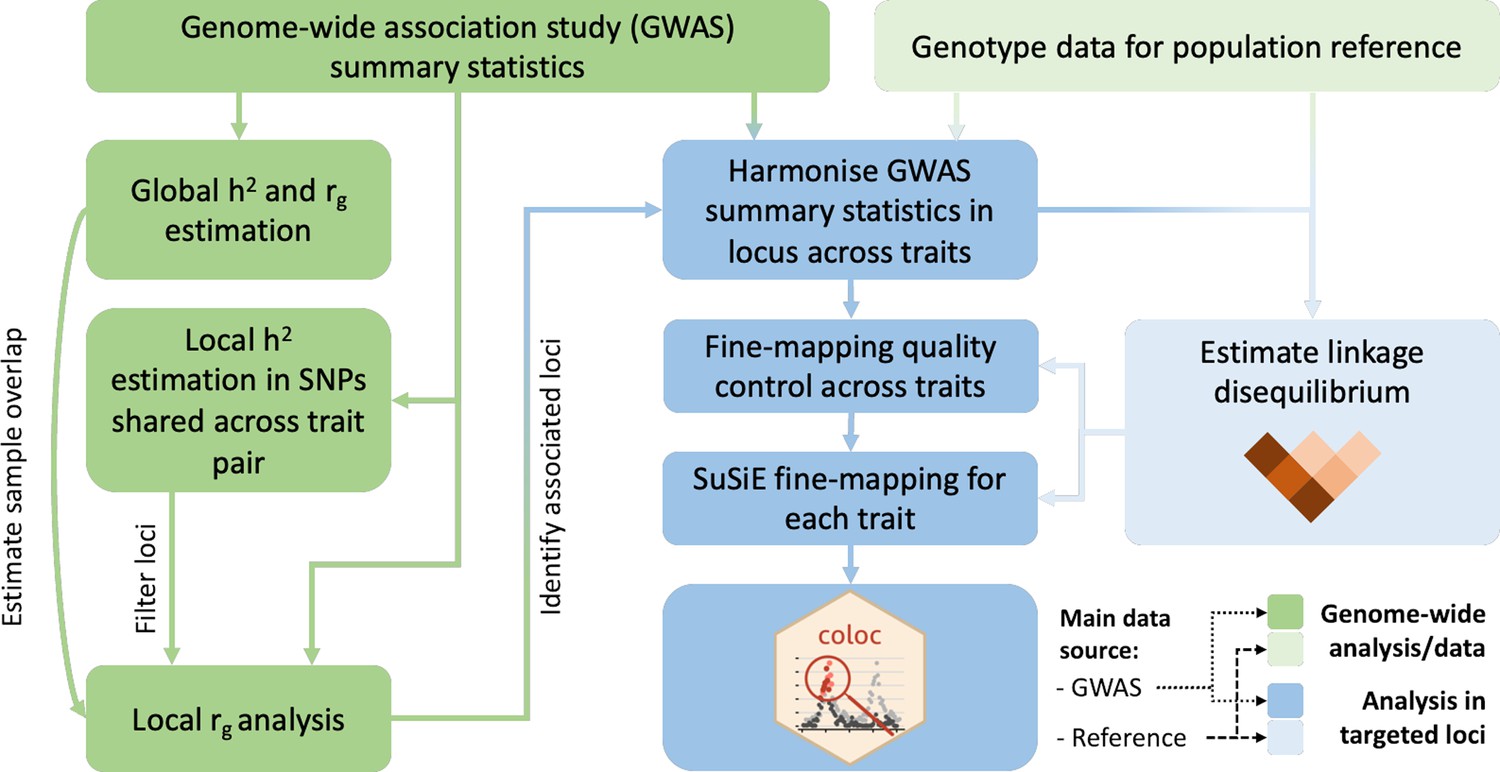
Overview of the analysis procedure for this study.
SuSiE (sum of single effects) is a univariate fine-mapping approach implemented within the R package susieR. ‘coloc’ is an R package for bivariate colocalisation analysis between pairs of traits. h2 = heritability, rg = bivariate genetic correlation. The analysis steps shaded in blue have been implemented within a readily applied analysis pipeline available on GitHub, copy archived at Spargo, 2023.
Figure 2

Genome-wide genetic correlation estimates between all trait pairs.
The heatmap displays genetic correlations (rg) each tile is labelled with the rg estimate and with its standard error in parentheses, alongside the p-value. AD = Alzheimer’s disease, ALS = amyotrophic lateral sclerosis, FTD = frontotemporal dementia, PD = Parkinson’s disease, SZ = schizophrenia.
Figure 3 with 1 supplement
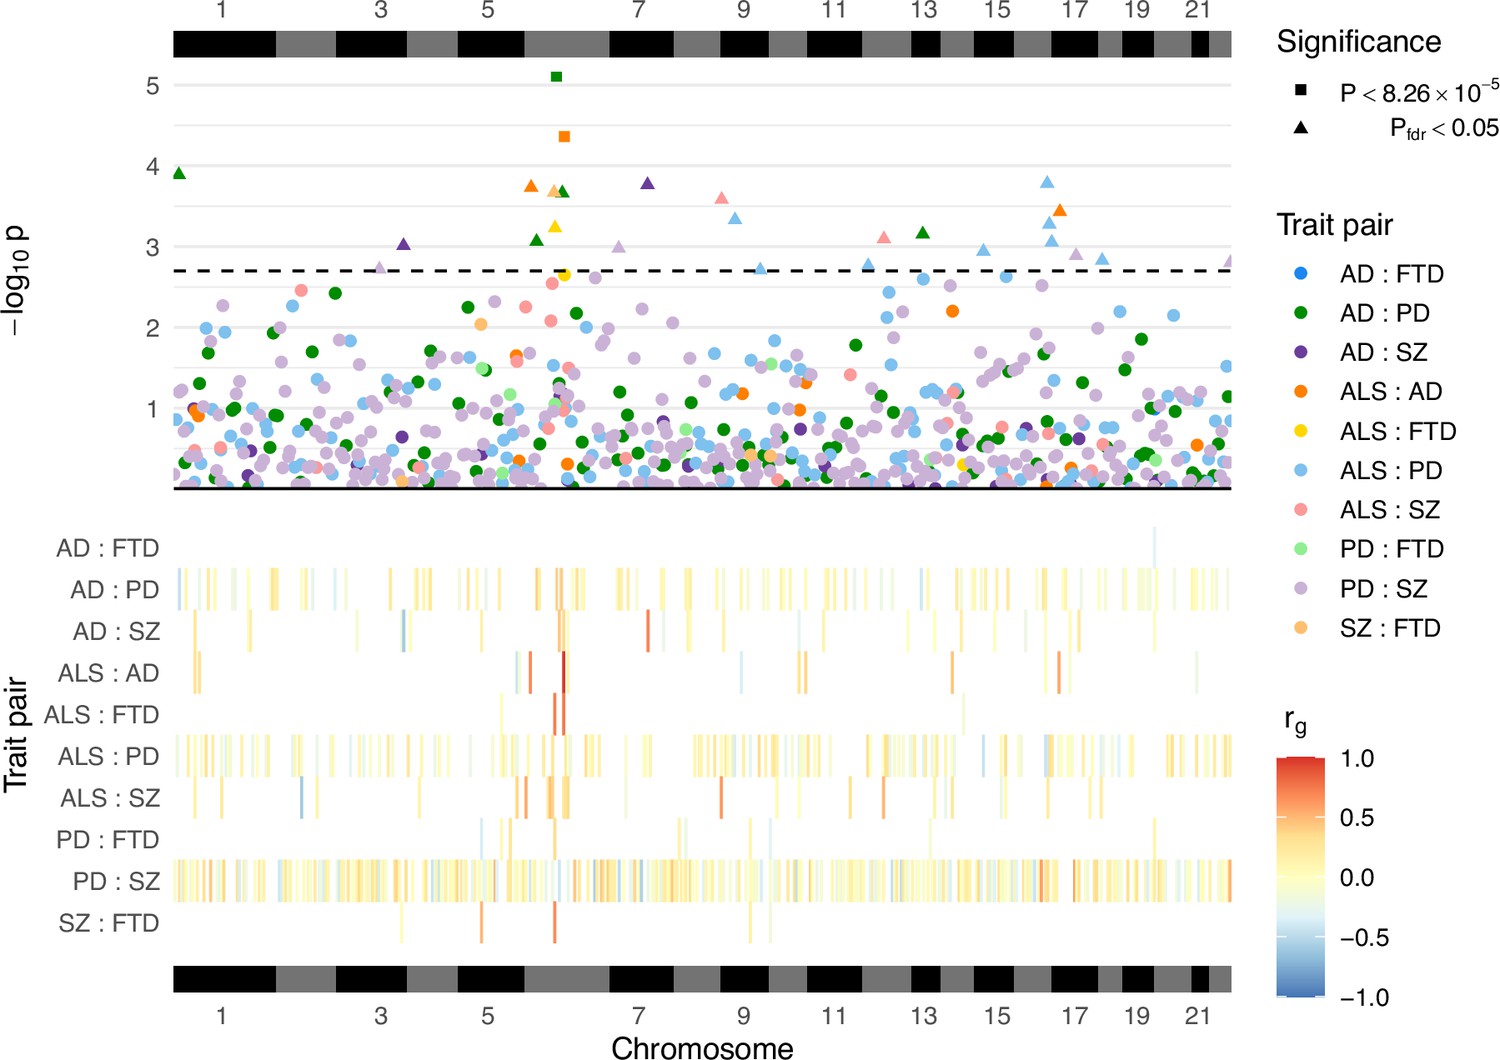
Local genetic correlation analyses between trait pairs.
The lower panel displays a heatmap of genetic correlations (rg) across genomic regions where any bivariate analyses were performed; white colouring indicates that the region was not analysed for a given trait pair owing to insufficient univariate heritability in one or both traits. The upper panel shows a Manhattan plot of p-values from each correlation analysis, denoting trait pairs by colour and comparisons passing defined significance thresholds by shape (square for a strict Bonferroni threshold and triangle for a false discovery rate [FDR] adjusted threshold); the hatched line indicates the threshold p-value above which pfdr < 0.05. The panels are both ordered by relative genomic position, with bars above and below indicating each chromosome. AD = Alzheimer’s disease, ALS = amyotrophic lateral sclerosis, FTD = frontotemporal dementia, PD = Parkinson’s disease, SZ = schizophrenia. Supplementary file 1a provides a complete summary of local genetic correlation analyses performed. Twenty-six bivariate comparisons were significant following FDR adjustment (pfdr < 0.05), two of which also passed the stringent Bonferroni threshold (p < 8.26 × 10⁻⁵; 0.05/605). While some regions included genome-wide significant single-nucleotide polymorphisms (SNPs) (p < 5 × 10⁻⁸) for one or both traits, others occurred in regions where genome-wide association studies (GWAS) associations were weaker (see Table 2). Five of these associations occurred at loci within the human leukocyte antigen (HLA) region (GRCh37: Chr6:28.48–33.45 Mb; 6p22.1–21.3, Genome Reference Consortium, 2023), and all five traits were implicated in at least one of these.
Figure 3—figure supplement 1
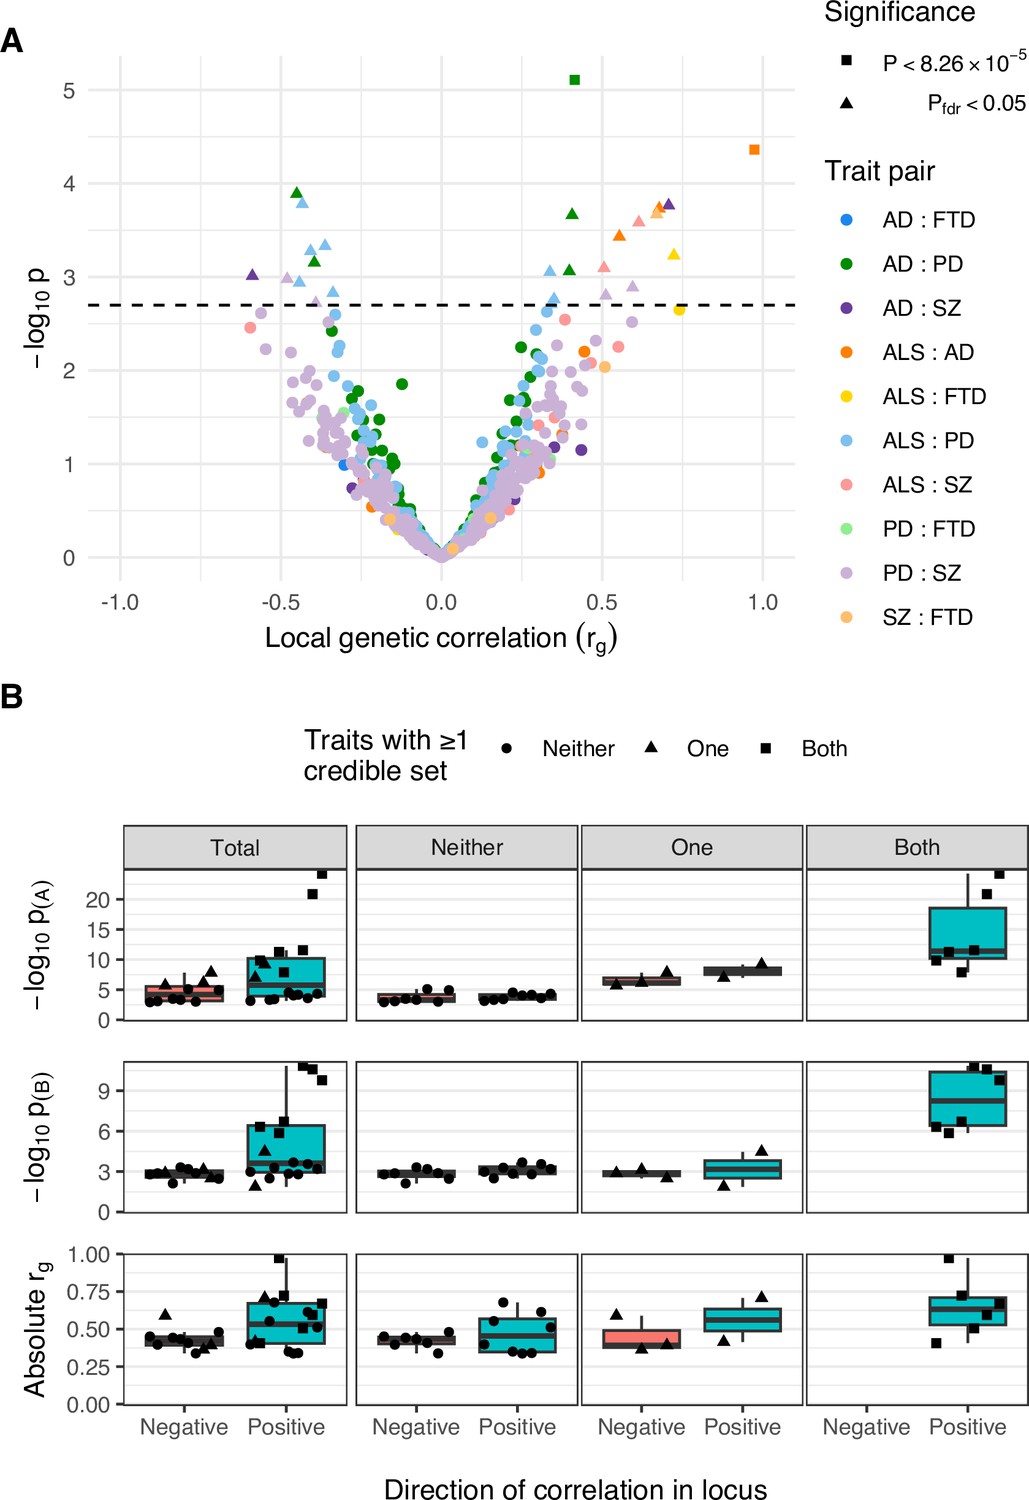
Comparison of positively and negatively correlated genetic loci.
(A) Distribution of genetic correlation estimates (rg) and p-values across trait pairs in local genetic correlation analysis. Trait pairs are denoted by colour and comparisons passing defined significance thresholds are denoted by shape (square for a strict Bonferroni threshold and triangle for a false discovery rate [FDR] adjusted threshold); the hatched line indicates the threshold p-value above which pfdr < 0.05. (B) Boxplots comparing FDR-significant loci with positive and negative local genetic correlations. Sub-panels are split row-wise by comparison measure: ‘−log10 p(A)’ and ‘−log10 p(B)’ show the p-value for the most significant variant in a given locus for each of the two analysed traits, with ‘A’ being the trait with more-significant and ‘B’ less-significant top variant; ‘Absolute rg’ shows the absolute correlation coefficient for the local genetic correlation between trait pairs in a given locus. The leftmost column of sub-panels displays the results across all significant loci and remaining columns split data by the number of traits in the pair with at least one fine-mapping credible set identified at that locus.
Figure 4 with 3 supplements
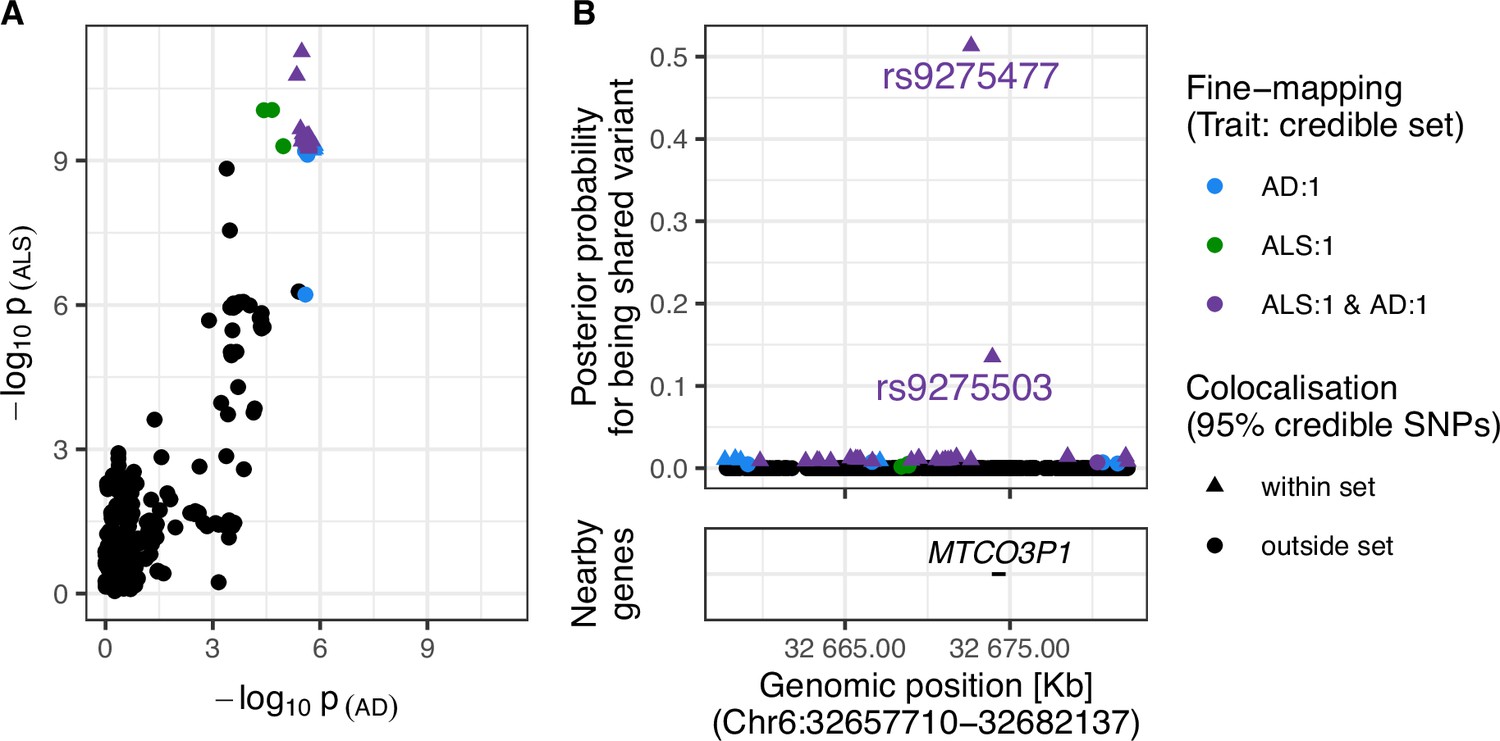
Evidence for colocalisation between amyotrophic lateral sclerosis (ALS) and Alzheimer’s disease (AD) in the Chr6:32.63–32.68 Mb region.
(A) Single-nucleotide polymorphism (SNP)-wise p-value distribution between ALS and AD across Chr6:32.63–32.68 Mb, in which colocalisation analysis found 0.90 posterior probability of the shared-variant hypothesis (see Table 3). (B) (upper) Per-SNP posterior probabilities for being a shared variant between ALS and AD, (lower) positions of HGNC gene symbols nearby to the 95% credible SNPs. Posterior probabilities for being a shared-variant sum to 1 across all SNPs analysed and are predicated on the assumption that a shared variant exists; 95% credible SNPs are those spanned by the top 0.95 of posterior probabilities. The x-axis for Panel B is truncated by the base pair range of the credible SNPs and genomic positions are based on GRCh37.
Figure 4—figure supplement 1
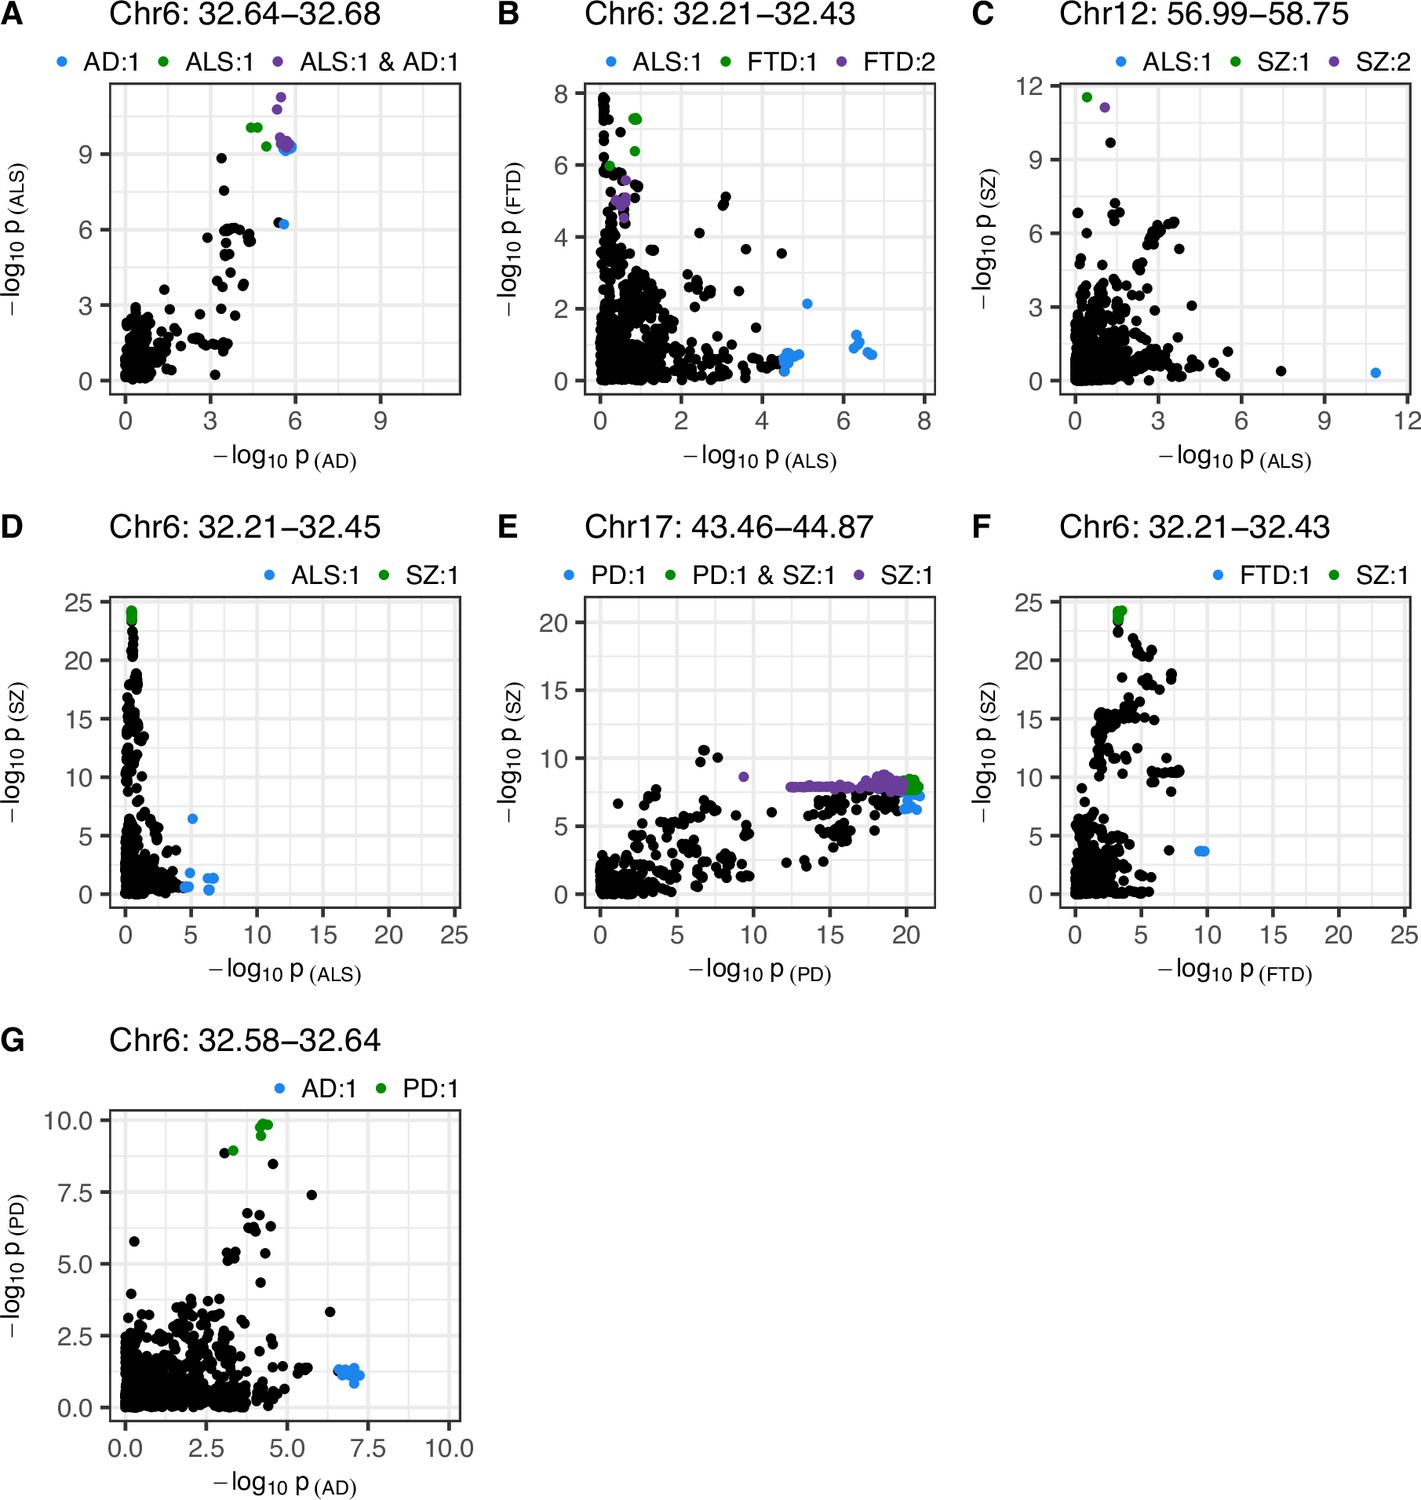
Single-nucleotide polymorphism (SNP)-wise p-value distribution between trait pairs in comparisons where colocalisation analysis suggested a causal variant in both traits.
Colocalisation analysis supported the shared-variant hypothesis for the comparison in (A), and the presence of distinct variants for each trait in (B-G) (see Table 3). Colouring indicates fine-mapping credible sets assigned to SNPs across the traits compared; the legend above each panel is in the format 'Trait: credible set number'. The genomic position range shown above each panel is in Mb. AD = Alzheimer’s disease, ALS = amyotrophic lateral sclerosis, FTD = frontotemporal dementia, PD = Parkinson’s disease, SZ = schizophrenia.
Figure 4—figure supplement 2
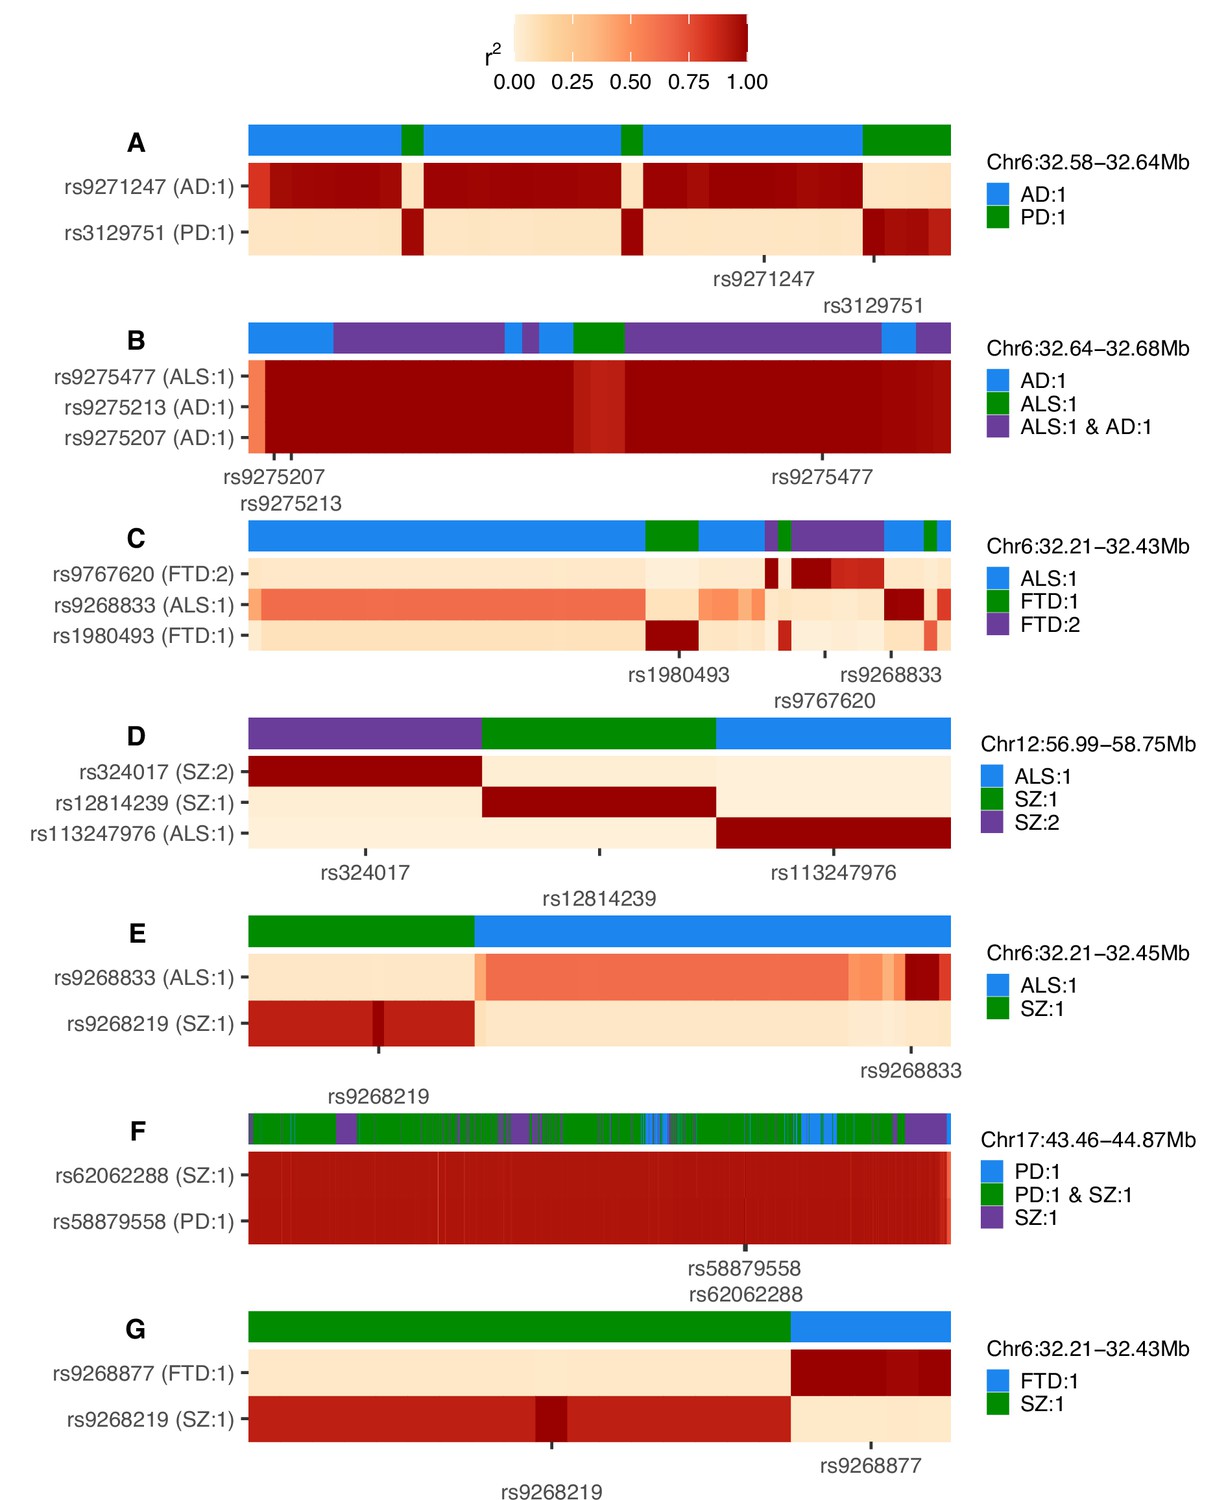
Heatmaps of linkage disequilibrium (LD) in the 1000 Genomes European reference population across variants assigned to any credible set during univariate fine-mapping of trait pairs (A-G).
LD is shown relative to the single-nucleotide polymorphisms (SNPs) with the highest posterior inclusion probability (PIP) for each credible set, displaying all top PIP SNPs when ties occur. The y-axis splits by top PIP SNPs and the x-axis displays SNPs ordered by genomic position, marking only the positions of the top PIP SNPs. Credible set assignments for each variant are shown in the colour bar at the top of each panel and for the top PIP SNPs in the y-axis label; these are annotated in the format: ‘trait: credible set number’. The genomic range indicated at the top right of each panel refers to the positions spanned across all SNPs analysed and is in Mb. AD = Alzheimer’s disease, ALS = amyotrophic lateral sclerosis, FTD = frontotemporal dementia, PD = Parkinson’s disease, SZ = schizophrenia.
Figure 4—figure supplement 3
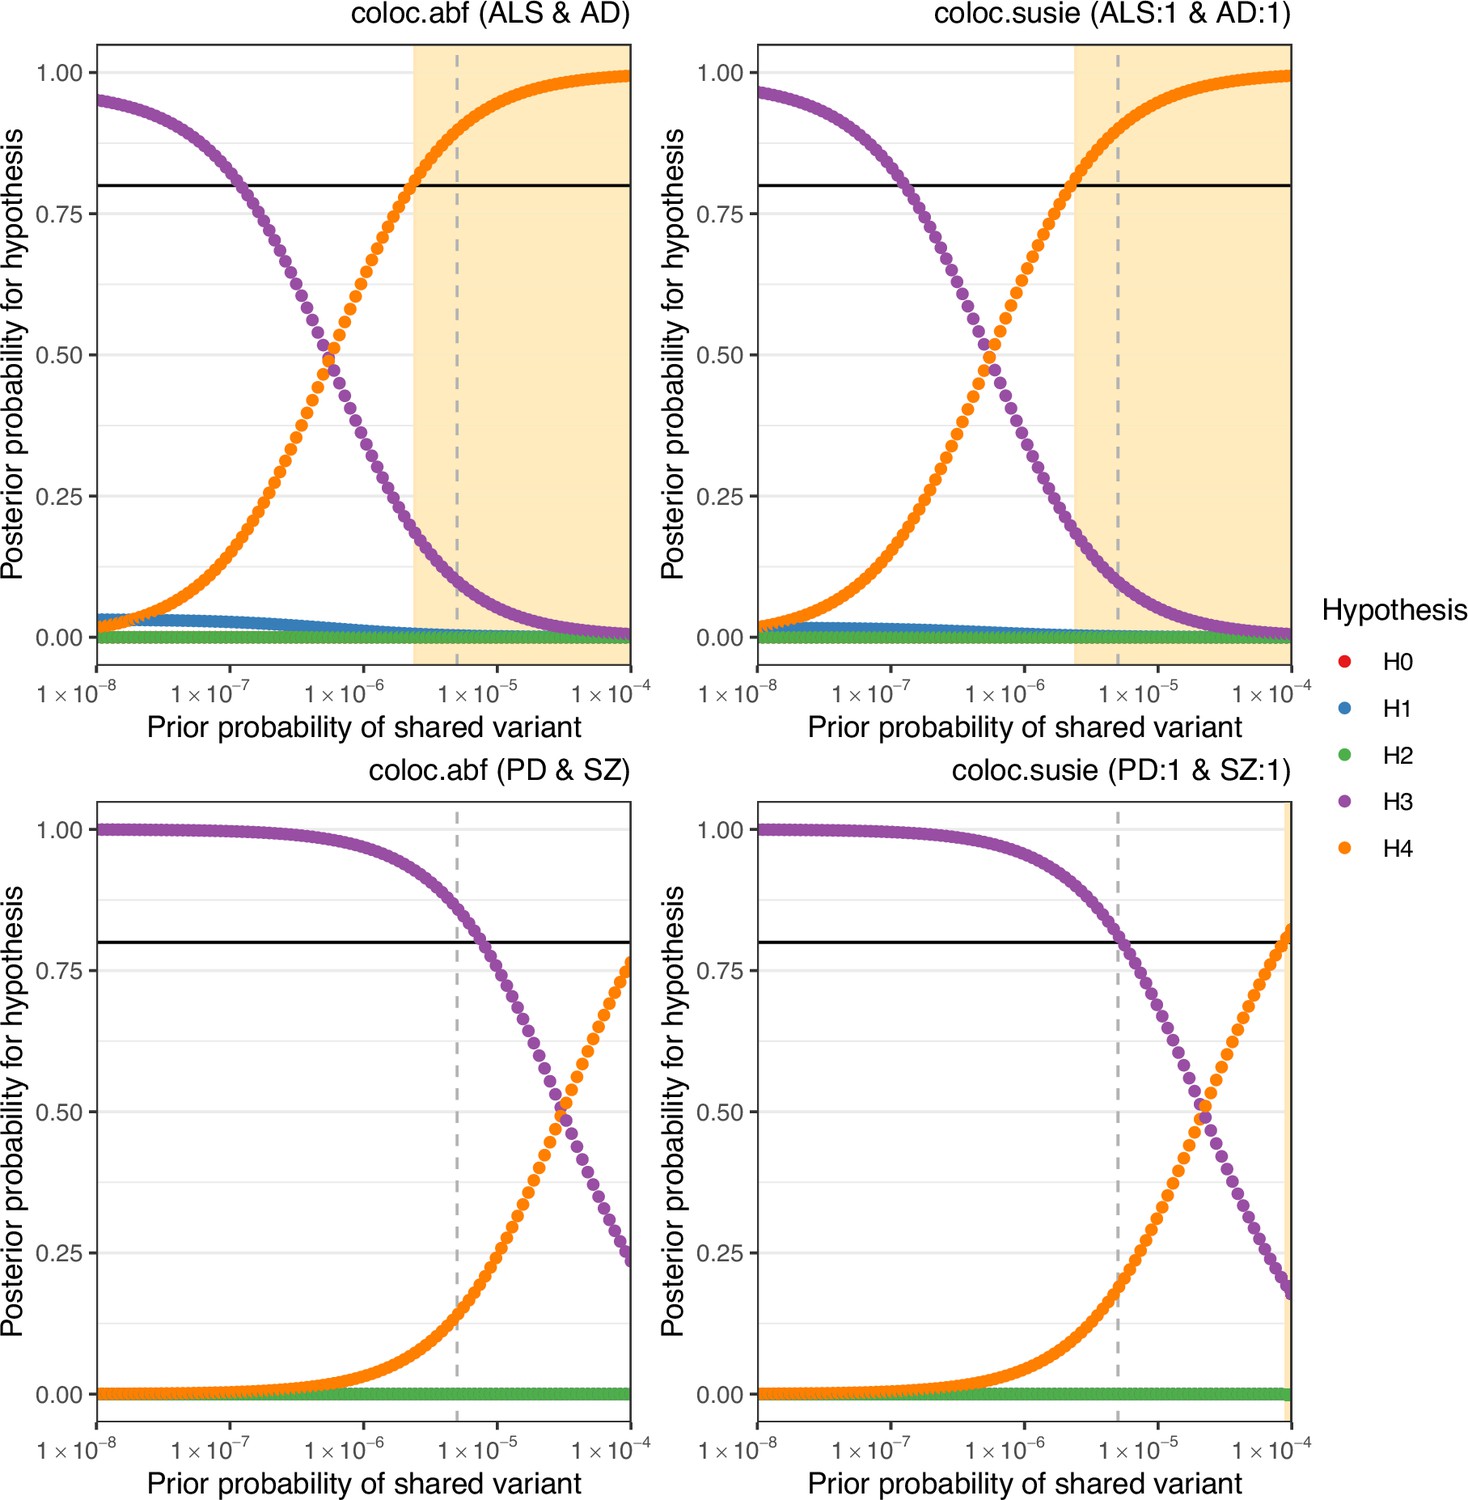
Sensitivity of colocalisation analysis to the prior probability of a shared variant between traits.
The upper panels display analysis at Chr6:32629240–32682213 between amyotrophic lateral sclerosis (ALS) and Alzheimer’s disease (AD). The lower panels are for Chr17:43460501–44865832 between Parkinson’s disease (PD) and schizophrenia (SZ). Panels labelled ‘coloc.abf’ display analysis across all single-nucleotide polymorphisms (SNPs) in the region and ‘coloc.susie’ indicates analysis across the SNPs within the pair of fine-mapping credible sets identified across trait pairs. Plot points indicate posterior probability of each hypothesis (H0 = no causal variant for either trait, H1 = variant causal for the trait one, H2 = variant causal for trait two, H3 = distinct causal variants for each trait, H4 = a shared causal variant between traits), according to the prior probability of H4. The vertical hatched line indicates the prior H4 probability defined for the reported analysis; the black horizontal line indicates the defined threshold for acceptance of H4: posterior H4 probability >0.8. Cream shading of the plot area indicates prior H4 probabilities which yield a posterior probability of H4 above the threshold.
Tables
Table 1
Genome-wide association studies (GWAS) sampled.
Each GWAS is a GWAS meta-analysis of disease risk across people of European ancestry.
| Trait | Estimated lifetime risk in population | GWAS | Liability scale h2 (standard error) | ||
|---|---|---|---|---|---|
| Reference | N cases | N controls | |||
| Alzheimer’s disease | 1/10, Chêne et al., 2015† | Kunkle et al., 2019 | 21,982 | 41,944 | 0.093 (0.0155) |
| Amyotrophic lateral sclerosis | 1/350, Alonso et al., 2009; Johnston et al., 2006 | Van Rheenen et al., 2021 | 27,205 | 110,881 | 0.0277 (0.003) |
| Frontotemporal dementia | 1/742, Coyle-Gilchrist et al., 2016 | Ferrari et al., 2014 | 2154 | 4308 | 0.0329 (0.0283) |
| Parkinson’s disease | 1/37, Parkinson’s, 2017 | Nalls et al., 2019 | 15,056 (+18,618 proxies*) | 449,056 | 0.0506 (0.0046) |
| Schizophrenia | 1/250, Saha et al., 2005 | Trubetskoy et al., 2022 | 53,386 | 77,258 | 0.1761 (0.0061) |
-
*
Proxy cases from the UK Biobank Cohort.
-
†
Estimated from cumulative risk after age 45 after correcting for competing risk of mortality and assuming a lifespan of ~85 years. h2 = heritability.
Table 2
Comparison of genome-wide SNP significance against local genetic correlation significance thresholds in all trait pairs and loci analysed.
All loci analysed showed sufficient local univariate heritability across compared traits to allow bivariate correlation analysis. Subsequent fine-mapping and colocalisation analyses were performed in this study for regions with at least a false discovery rate (FDR) adjusted significance for the local genetic correlation. SNP = single-nucleotide polymorphism.
| Number of traits in pair with genome-wide significant (p < 5 × 10⁻⁸) SNP in locus | Smallest significance threshold for local genetic correlation | |||
|---|---|---|---|---|
| Bonferroni (p < 8.26 × 10⁻⁵; 0.05/605) | FDR (pfdr < 0.05) | Nominal (p < 0.05) | Non-significant(p ≥ 0.05) | |
| 0 | 1 | 17 | 77 | 394 |
| 1 | 1 | 4 | 18 | 80 |
| 2 | 0 | 3 | 2 | 8 |
Table 3
Colocalisation analysis conducted across 95% credible sets identified during univariate fine-mapping of trait pairs.
N SNPs refer to the number of SNPs present for both traits and the 1000 Genomes reference panel in the region within colocalisation and fine-mapping analysis.
| Trait | Genomic position (GRCh37) | Local genetic correlation estimate (95% confidence interval) | Fine-mapping credible set for trait | N SNPs | SNP with highest PIP for fine-mapping credible set (nearest gene; sense-strand base pair distance) | Posterior probability for hypothesis¶ | |||||||
|---|---|---|---|---|---|---|---|---|---|---|---|---|---|
| 1 | 2 | 1 | 2 | Trait 1 | Trait 2 | H0 | H1 | H2 | H3 | H4 | |||
| AD | PD | Chr6:32576785–32639239† | 0.406 (0.197, 0.648) | 1 | 1 | 958 | rs9271247 (HLA-DQA1; +15,844) | rs3129751 (HLA-DQA1; +13,767) | <0.01 | <0.01 | <0.01 | 0.95 | 0.05 |
| ALS | AD | Chr6:32629240–32682213* | 0.974 (0.717, 1.000) | 1 | 1 | 475 | rs9275477‡ (MTCO3P1; +1260) | rs9275207 (MTCO3P1; +16,191) | <0.01 | <0.01 | <0.01 | 0.10 | 0.90 |
| ALS | FTD | Chr6:32208902–32454577§ | 0.723 (0.370, 1.000) | 1 | 1 | 1709 | rs9268833 (HLA-DRB9; 0) | rs1980493 (BTNL2; 0) | <0.01 | <0.01 | 0.01 | 0.99 | <0.01 |
| 2 | rs9767620 (HLA-DRB9; +1498) | <0.01 | <0.01 | 0.01 | 0.99 | <0.01 | |||||||
| ALS | SZ | Chr6:32208902–32454577§ | - | 1 | 1 | 1711 | rs9268833 (HLA-DRB9; 0) | rs9268219 (C6orf10; 0) | <0.01 | <0.01 | <0.01 | 0.98 | <0.01 |
| Chr12:56987106–58748139 | 0.506 (0.218, 0.807) | 1 | 1 | 2260 | rs113247976 (KIF5A; 0) | rs12814239 (LRP1; 0) | <0.01 | <0.01 | <0.01 | 1.00 | <0.01 | ||
| 2 | rs324017 (NAB2; 0) | <0.01 | <0.01 | <0.01 | 1.00 | <0.01 | |||||||
| PD | SZ | Chr17:43460501–44865832 | 0.595 (0.266, 0.950) | 1 | 1 | 2453 | rs58879558 (MAPT; 0) | rs62062288 (MAPT; 0) | <0.01 | <0.01 | <0.01 | 0.81 | 0.19 |
| SZ | FTD | Chr6:32208902–32454577§ | 0.669 (0.379, 0.990) | 1 | 1 | 1657 | rs9268219 (C6orf10; 0) | rs9268877 (HLA-DRB9; 0) | <0.01 | <0.01 | <0.01 | 1.00 | <0.01 |
-
*
Indicates comparisons with genetic correlation analysis p < 8.26 × 10⁻⁵ (0.05/605).
-
†
Denotes locus extended by ±10 kb for fine-mapping and colocalisation analysis.
-
‡
Variant identified in colocalisation as having the highest posterior probability of being shared variant assuming hypothesis 4 is true (see Figure 4).
-
§
Differences in fine-mapping solutions across trait pairs in the Chr6:32.21–32.45 Mb locus reflect differences in the SNPs retained after restricting to those in common between the compared genome-wide association studies (GWAS).
-
¶
H0 = no causal variant for either trait, H1 = variant causal for trait 1, H2 = variant causal for trait 2, H3 = distinct causal variants for each trait, H4 = a shared causal variant between traits. PIP = posterior inclusion probability, AD = Alzheimer’s disease, ALS = amyotrophic lateral sclerosis, FTD = frontotemporal dementia, PD = Parkinson’s disease, SZ = schizophrenia.
Additional files
-
Supplementary file 1
Extended results from local genetic correlation analysis and subsequent fine-mapping and colocalisation analyses across loci correlated between trait pairs.
(a) Results of all bivariate local genetic correlation analyses. (b) Results of colocalisation analyses performed across all single-nucleotide polymorphisms (SNPs) sampled in the region. Number of SNPs refers to the number of SNPs in common between the two traits analysed and present within the 1000 genomes reference panel. Comparisons where univariate fine-mapping identified at least one credible set in each trait were also performed on the basis of these credible sets (see Table 3). Annotations column: * denotes comparisons with genetic correlation analysis p-values below the strict Bonferroni correction threshold; all others passed false discovery rate (FDR) correction. ∆ denotes locus with boundaries extended by ±10 kb compared to the region partition defined in genetic correlation analysis. (c) Overview of credible sets identified across fine-mapping analyses in summary statistics harmonised across trait pairs.
- https://cdn.elifesciences.org/articles/88768/elife-88768-supp1-v1.xlsx
-
MDAR checklist
- https://cdn.elifesciences.org/articles/88768/elife-88768-mdarchecklist1-v1.pdf
Download links
A two-part list of links to download the article, or parts of the article, in various formats.
Downloads (link to download the article as PDF)
Open citations (links to open the citations from this article in various online reference manager services)
Cite this article (links to download the citations from this article in formats compatible with various reference manager tools)
Statistical examination of shared loci in neuropsychiatric diseases using genome-wide association study summary statistics
eLife 12:RP88768.
https://doi.org/10.7554/eLife.88768.3


