Imidacloprid disrupts larval molting regulation and nutrient energy metabolism, causing developmental delay in honey bee Apis mellifera
- College of Life Sciences, Chongqing Normal University, China
- Key Laboratory of Pollinator Resources Conservation and Utilization of the Upper Yangtze River, Ministry of Agriculture and Rural Affairs, China
- Chongqing Key Laboratory of Microsporidia Infection and Control, China
- The State Key Laboratory of Resource Insects, Southwest University, China
Figures
Figure 1
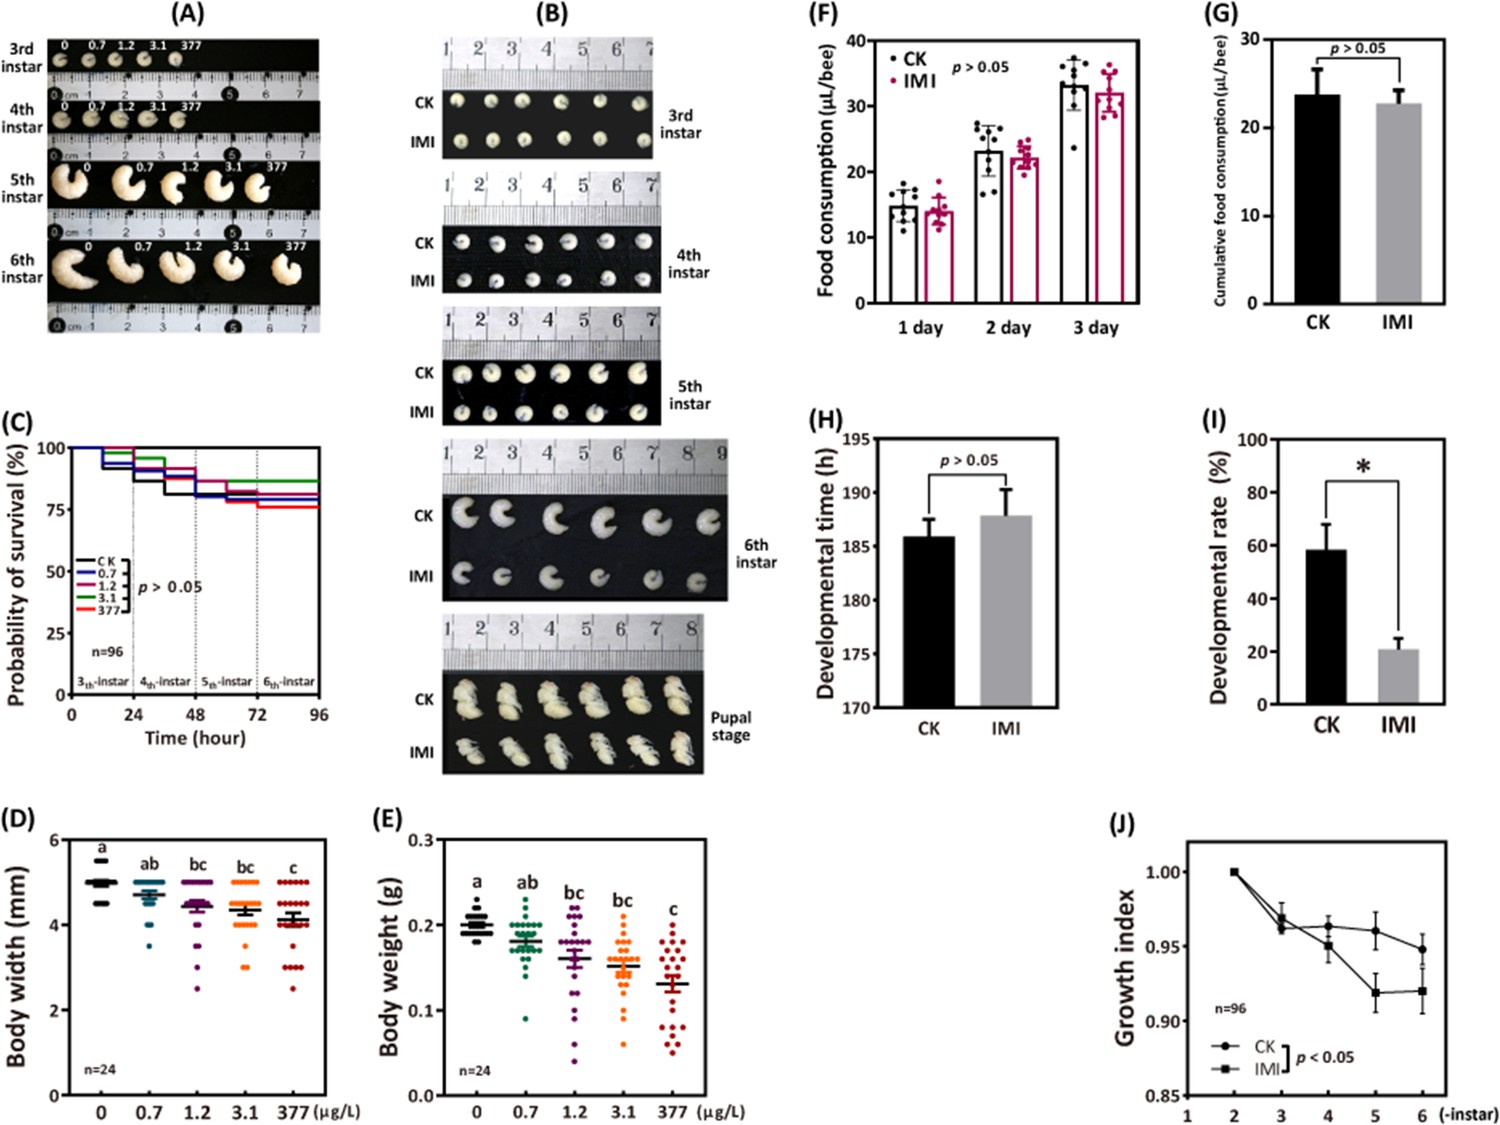
Imidacloprid causes larval developmental retardation in A. mellifera.
Larvae were orally administered imidacloprid (IMI) or artificial food (CK) beginning at 3-day-old, followed by developmental monitoring for 96 hr. (A) Larval developmental phenotypes at 0.7, 1.2, 3.1, and 377 ppb environmental concentrations of imidacloprid exposure. (B) Larval developmental phenotype at 377 ppb imidacloprid exposure. (C) Effect of 0.7, 1.2, 3.1, and 377 ppb imidacloprid on larval survival. (D and E) Body width and weight of larvae exposed to 0.7, 1.2, 3.1, and 377 ppb imidacloprid for 96 hr. (F and G) Statistics for daily (F) and 3-day cumulative feeding (G) for larvae exposed to 377 ppb imidacloprid. (H) Larval development time from 3-day-old to pupal stage. (I) The number of larvae that successfully reached the pupal stage as a percentage of the total initial sample size. (J) The growth index of larvae. Statistical significance was set at *p<0.05 and **p<0.01.
-
Figure 1—source data 1
Effect of imidacloprid on the survival of A. mellifera larvae.
- https://cdn.elifesciences.org/articles/88772/elife-88772-fig1-data1-v1.csv
-
Figure 1—source data 2
Effect of imidacloprid on the body width of A. mellifera larvae.
- https://cdn.elifesciences.org/articles/88772/elife-88772-fig1-data2-v1.csv
-
Figure 1—source data 3
Effect of imidacloprid on the body weight of A. mellifera larvae.
- https://cdn.elifesciences.org/articles/88772/elife-88772-fig1-data3-v1.csv
-
Figure 1—source data 4
Effect of imidacloprid on the food consumption of A. mellifera larvae.
- https://cdn.elifesciences.org/articles/88772/elife-88772-fig1-data4-v1.csv
-
Figure 1—source data 5
Effect of imidacloprid on the cumlative food consumption of A. mellifera larvae.
- https://cdn.elifesciences.org/articles/88772/elife-88772-fig1-data5-v1.csv
-
Figure 1—source data 6
Effect of imidacloprid on the developmental time of A. mellifera larvae.
- https://cdn.elifesciences.org/articles/88772/elife-88772-fig1-data6-v1.csv
-
Figure 1—source data 7
Effect of imidacloprid on the developmental rate of A. mellifera larvae.
- https://cdn.elifesciences.org/articles/88772/elife-88772-fig1-data7-v1.csv
-
Figure 1—source data 8
Effect of imidacloprid on the growth index of A. mellifera larvae.
- https://cdn.elifesciences.org/articles/88772/elife-88772-fig1-data8-v1.csv
Figure 2

Imidacloprid neurotoxicity in A. mellifera larvae.
(A) Acetylcholinesterase (AChE) activity and (B) nerve conduction-related gene expression analysis in larvae exposed to 377 ppb imidacloprid for 72 hr or a control group. IMI is the larvae exposed to imidacloprid for 72 hr. CK is the artificial food control group. Statistical significance was set at *p<0.05 and **p<0.01.
-
Figure 2—source data 1
The effect of imidacloprid on neurotoxicity in A. mellifera larvae such as the activity of AChE.
- https://cdn.elifesciences.org/articles/88772/elife-88772-fig2-data1-v1.csv
-
Figure 2—source data 2
The effect of imidacloprid on neurotoxicity in A. mellifera larvae, including the expression of genes related to nerve conduction.
- https://cdn.elifesciences.org/articles/88772/elife-88772-fig2-data2-v1.csv
Figure 3

Effects of imidacloprid on the homeostasis of developmental regulation in A. mellifera larvae.
(A) Relative gene expression and (B) hormone levels of developmental regulatory-related genes in larvae exposed to 377 ppb imidacloprid for 72 hr or a control group. Statistical significance was set at *p<0.05 and **p<0.01.
-
Figure 3—source data 1
Effect of imidacloprid on the expression of the developmental regulatory genes JHAMT, Br-c and Vg in A. mellifera larvae.
- https://cdn.elifesciences.org/articles/88772/elife-88772-fig3-data1-v1.csv
-
Figure 3—source data 2
Effect of imidacloprid on the developmental regulatory hormones 20E and JH-3 in A. mellifera larvae.
- https://cdn.elifesciences.org/articles/88772/elife-88772-fig3-data2-v1.csv
Figure 4

Imidacloprid induced a detoxification response in A. mellifera larvae.
Relative expression levels of cytochrome P450 monooxygenase family genes in larvae exposed to imidacloprid for 72 hr. IMI is the larvae exposed to imidacloprid for 72 hr. CK is the artificial food control group. Statistical significance was set at *p<0.05, **p<0.01, and ***p<0.001.
-
Figure 4—source data 1
Effect of imidacloprid on the expression of detoxification genes in A. mellifera larvae.
- https://cdn.elifesciences.org/articles/88772/elife-88772-fig4-data1-v1.csv
Figure 5
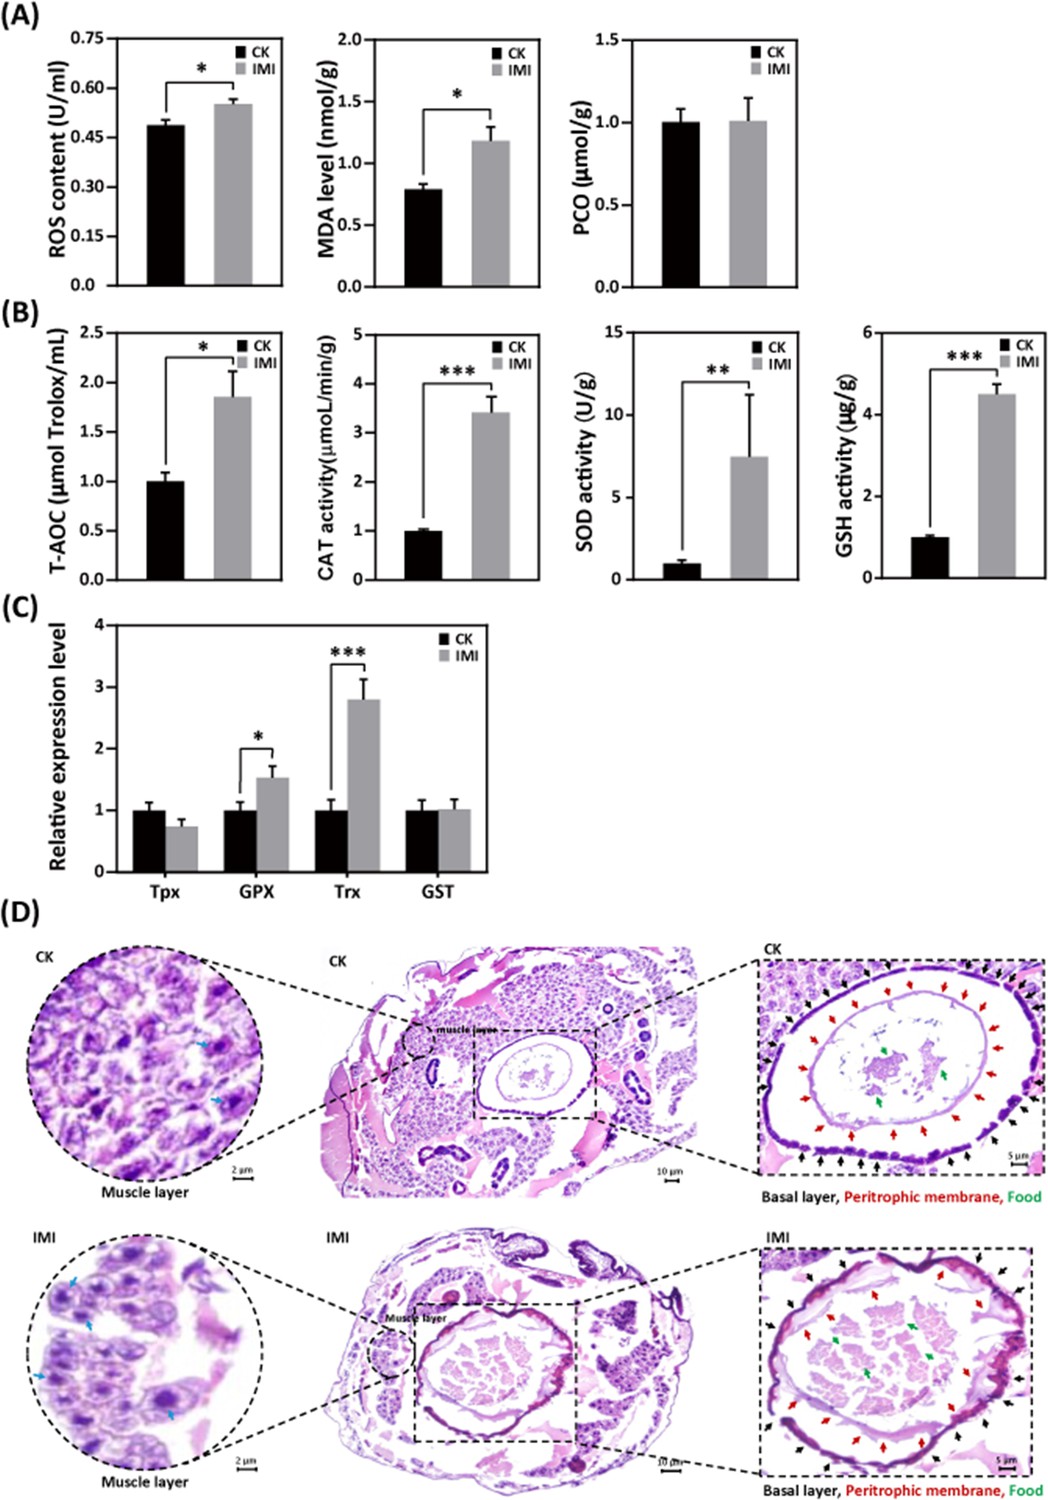
Imidacloprid exposure causes oxidative stress, gut apoptosis, and tissue structural damage while inducing antioxidant defenses in A. mellifera larvae.
(A) Analysis of oxidative stress and damage in larvae exposed to imidacloprid for 72 hr. Reactive oxygen species (ROS) levels indicate the degree of oxidative stress. Malondialdehyde (MDA) is a marker for lipid peroxidation. Protein carbonylation (PCO) levels reflect the extent of protein carbonylation damage. (B) Activity of antioxidants in larvae exposed to imidacloprid for 72 hr. (C) The relative expression levels of antioxidant genes in larvae exposed to imidacloprid for 72 hr. (D) Histological sections of the larval gut stained with hematoxylin-eosin (HE). The circled inserts in the figure show magnified views of the muscle layer. The blue arrow indicates the cell nucleus of the muscle layer. The boxed inset in the figure is a magnified view of the basal layer (black arrow), peritrophic membrane (red arrow), and food residues (green arrow). IMI is the larvae exposed to imidacloprid for 72 hr. CK is the artificial food control group. Statistical significance was set at *p<0.05, **p<0.01, and ***p<0.001.
-
Figure 5—source data 1
Effect of imidacloprid on the ROS levels in A. mellifera larvae.
- https://cdn.elifesciences.org/articles/88772/elife-88772-fig5-data1-v1.csv
-
Figure 5—source data 2
Effect of imidacloprid on the activities of the antioxidants CAT, SOD and GSH in A. mellifera larvae.
- https://cdn.elifesciences.org/articles/88772/elife-88772-fig5-data2-v1.csv
-
Figure 5—source data 3
Effect of imidacloprid on the expression of antioxidant genes GPX and Trx in A. mellifera larvae.
- https://cdn.elifesciences.org/articles/88772/elife-88772-fig5-data3-v1.csv
-
Figure 5—source data 4
Effect of imidacloprid on the total antioxidant capacity (T-AOC) in A. mellifera larvae.
- https://cdn.elifesciences.org/articles/88772/elife-88772-fig5-data4-v1.zip
-
Figure 5—source data 5
Effect of imidacloprid on the oxidative damage in A. mellifera larvae.
- https://cdn.elifesciences.org/articles/88772/elife-88772-fig5-data5-v1.zip
Figure 6
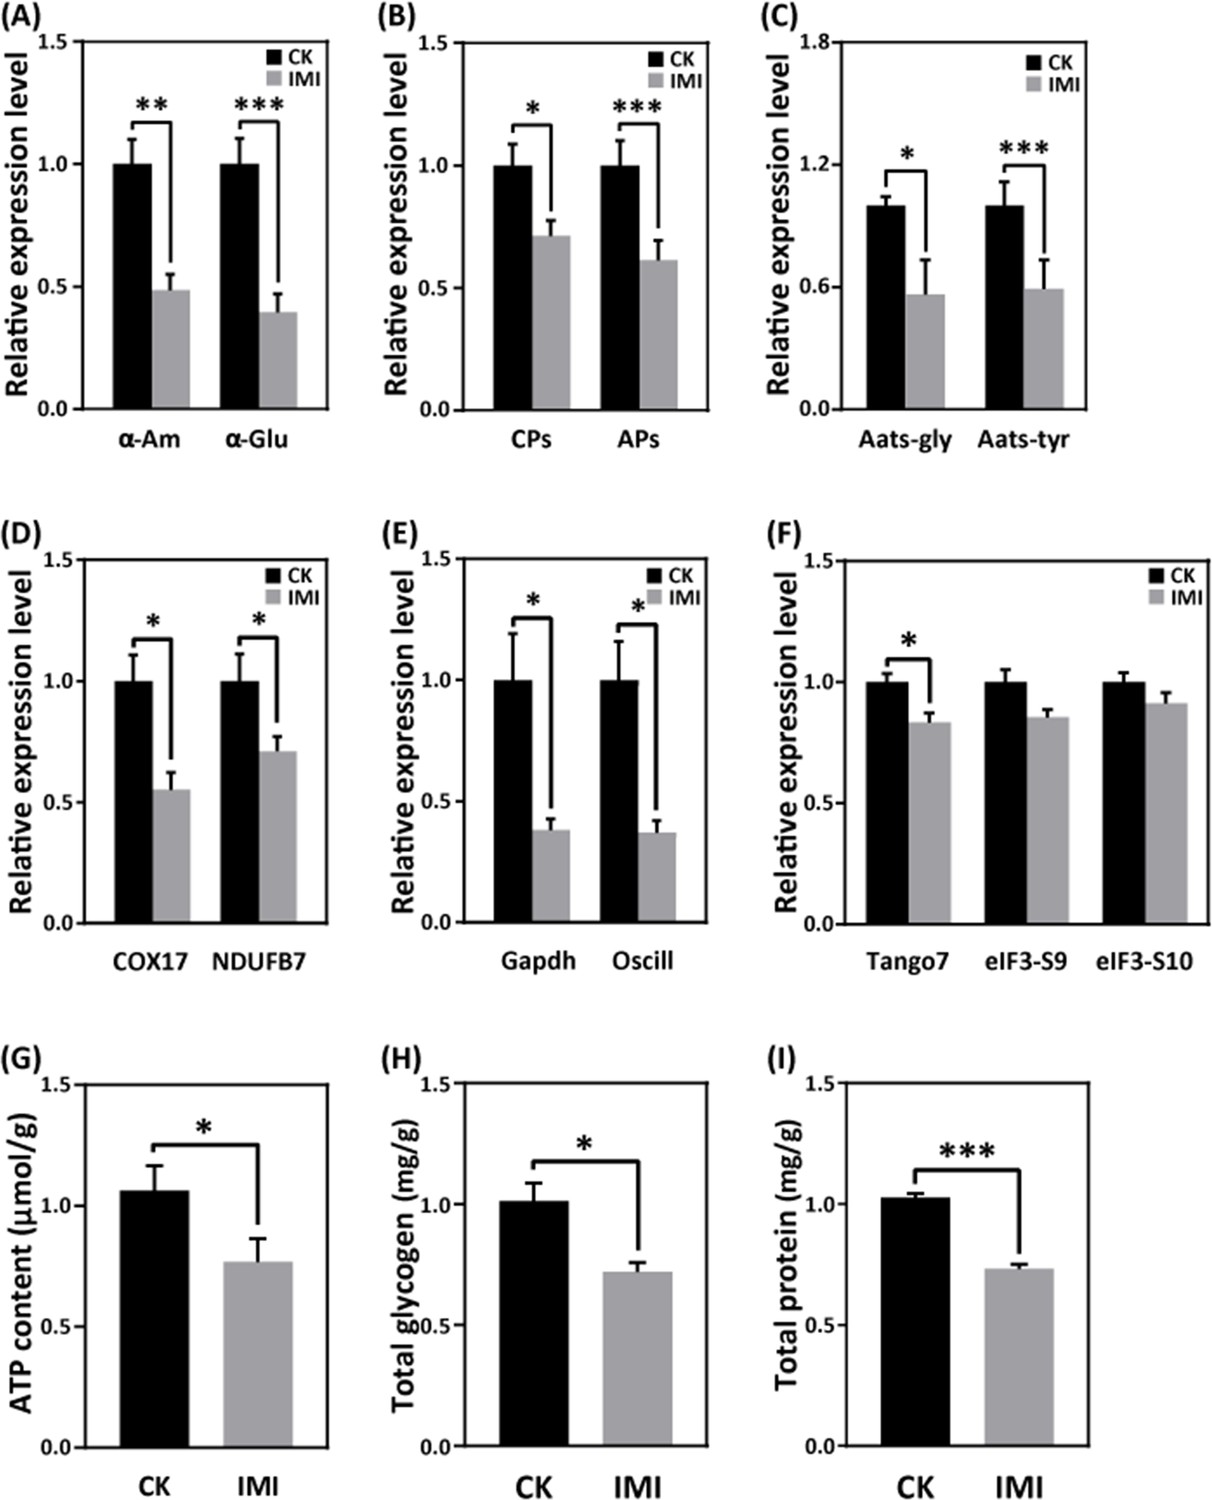
Imidacloprid toxicity inhibited the expression of genes involved in nutrient catabolism, protein synthesis, and energy metabolism and reserves.
(A) Carbohydrate catabolism. (B) Proteolysis. (C) Amino acid transport. (D) Mitochondrial oxidative phosphorylation. (E) Glycolysis. (F) Protein synthesis. (G) The total contents of ATP, glycogen (H), and protein (I). IMI is the larvae exposed to imidacloprid for 72 hr. CK is the artificial food control group. Statistical significance was set at *p<0.05, **p<0.01, and ***p<0.001.
-
Figure 6—source data 1
Effects of imidacloprid on α-Am and α-Glu, genes involved in carbohydrate metabolism in A. mellifera larvae.
- https://cdn.elifesciences.org/articles/88772/elife-88772-fig6-data1-v1.csv
-
Figure 6—source data 2
Effects of imidacloprid on CPs and APs, genes involved in proteolysis in A. mellifera larvae.
- https://cdn.elifesciences.org/articles/88772/elife-88772-fig6-data2-v1.csv
-
Figure 6—source data 3
Effects of imidacloprid on Aats-Gly and Aats-Tyr, genes involved in amino acid transport in A. mellifera larvae.
- https://cdn.elifesciences.org/articles/88772/elife-88772-fig6-data3-v1.csv
-
Figure 6—source data 4
Effects of imidacloprid on COX17 and NDUFB7, genes involved in energy metabolism in A. mellifera larvae.
- https://cdn.elifesciences.org/articles/88772/elife-88772-fig6-data4-v1.csv
-
Figure 6—source data 5
Effects of imidacloprid on Gapdh and Oscillin, genes involved in glycolysis and energy production in A. mellifera larvae.
- https://cdn.elifesciences.org/articles/88772/elife-88772-fig6-data5-v1.csv
-
Figure 6—source data 6
Effects of imidacloprid on Tango7, elF3-S9, and elF3-S10, genes involved in protein synthesis in A. mellifera larvae.
- https://cdn.elifesciences.org/articles/88772/elife-88772-fig6-data6-v1.csv
-
Figure 6—source data 7
Effects of imidacloprid on total ATP levels involved in energy production and reserves in A. mellifera larvae.
- https://cdn.elifesciences.org/articles/88772/elife-88772-fig6-data7-v1.csv
-
Figure 6—source data 8
Effects of imidacloprid on total glycogen contents involved in energy production and reserves in A. mellifera larvae.
- https://cdn.elifesciences.org/articles/88772/elife-88772-fig6-data8-v1.csv
-
Figure 6—source data 9
Effects of imidacloprid on total protein levels involved in energy production and reserves in A. mellifera larvae.
- https://cdn.elifesciences.org/articles/88772/elife-88772-fig6-data9-v1.csv
Figure 7

Correlation between phenotypes and molecular characteristics in imidacloprid-exposed larvae with developmental retardation.
Data were normalized using GraphPad software, followed by a Pearson correlation coefficient calculation using SPSS, and a heatmap was generated.
-
Figure 7—source data 1
All data used for correlation analysis between developmental retardation phenotypes and molecular characteristics.
- https://cdn.elifesciences.org/articles/88772/elife-88772-fig7-data1-v1.csv
Figure 8
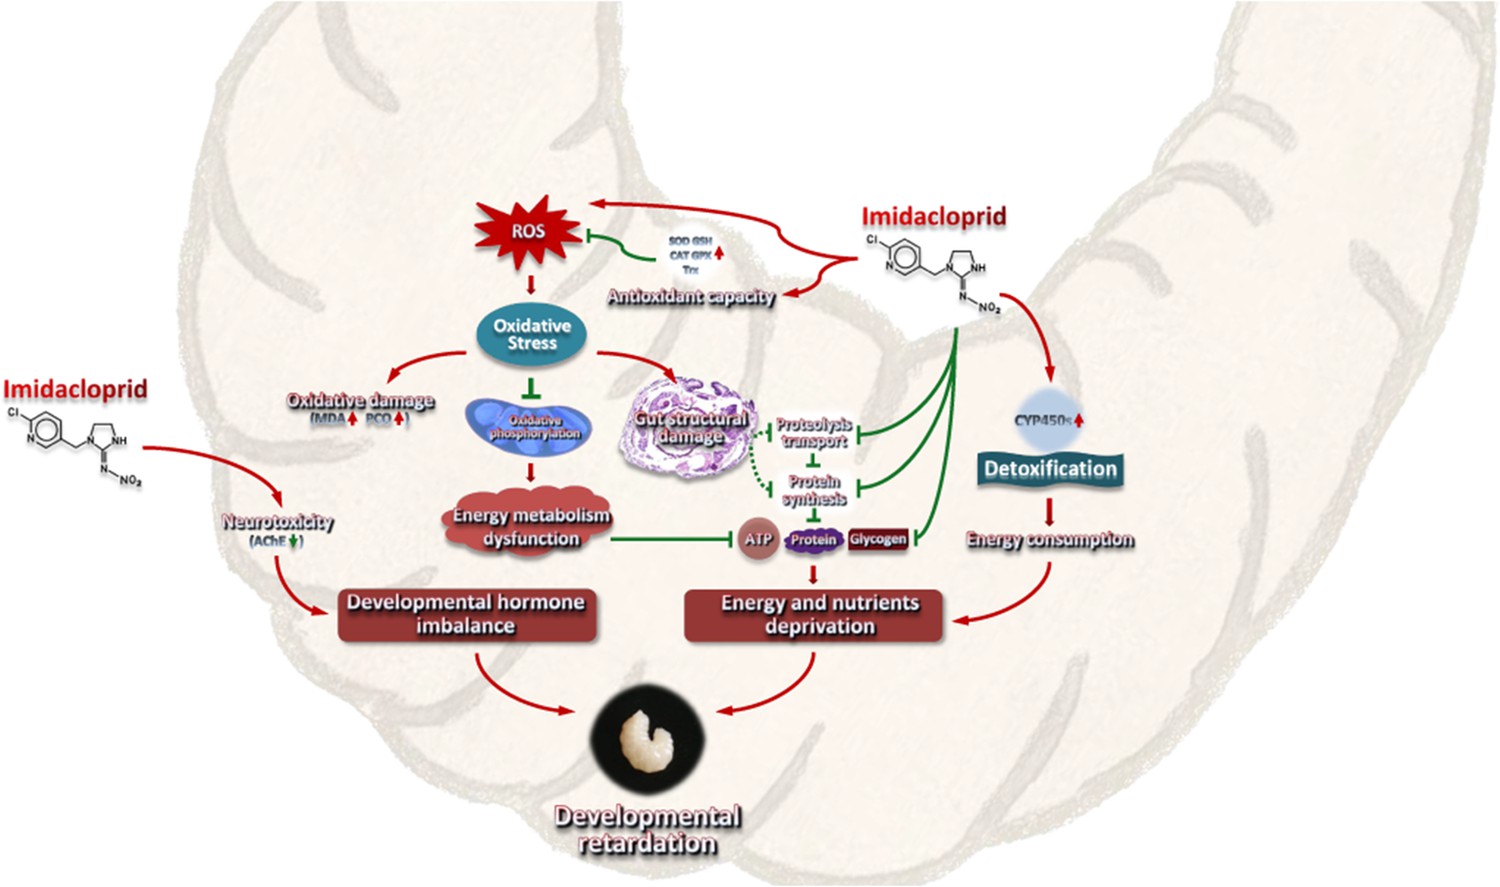
A model interpreting the ecotoxicological effects of imidacloprid on A. mellifera larvae and the mechanisms of imidacloprid-induced developmental retardation.
Imidacloprid toxicity caused growth and developmental delay in A. mellifera larvae. It disrupts the regulatory balance of molt development, resulting in restricted development. In addition, the damage caused by imidacloprid restricts the metabolism and utilization of food nutrients and energy in larvae. The additional energy consumed by larval P450 detoxification and antioxidant defenses further reduces the supply of nutrients and energy supply for growth and development. The arrows indicate induction or promotion, the straight lines indicate inhibition, and the green dotted lines indicate speculative inhibition.
Additional files
-
Supplementary file 1
Primers used in real-time quantitative PCR.
- https://cdn.elifesciences.org/articles/88772/elife-88772-supp1-v1.doc
-
MDAR checklist
- https://cdn.elifesciences.org/articles/88772/elife-88772-mdarchecklist1-v1.doc
Download links
A two-part list of links to download the article, or parts of the article, in various formats.
Downloads (link to download the article as PDF)
Open citations (links to open the citations from this article in various online reference manager services)
Cite this article (links to download the citations from this article in formats compatible with various reference manager tools)
Imidacloprid disrupts larval molting regulation and nutrient energy metabolism, causing developmental delay in honey bee Apis mellifera
eLife 12:RP88772.
https://doi.org/10.7554/eLife.88772.4


