Autotrophic growth of Escherichia coli is achieved by a small number of genetic changes
- Department of Plant and Environmental Sciences, Weizmann Institute of Science, Israel
- Interfaculty Institute for Microbiology and Infection Medicine Tübingen, University of Tübingen, Germany
- Department of Life Sciences Core Facilities, Weizmann Institute of Science, Israel
Figures
Figure 1
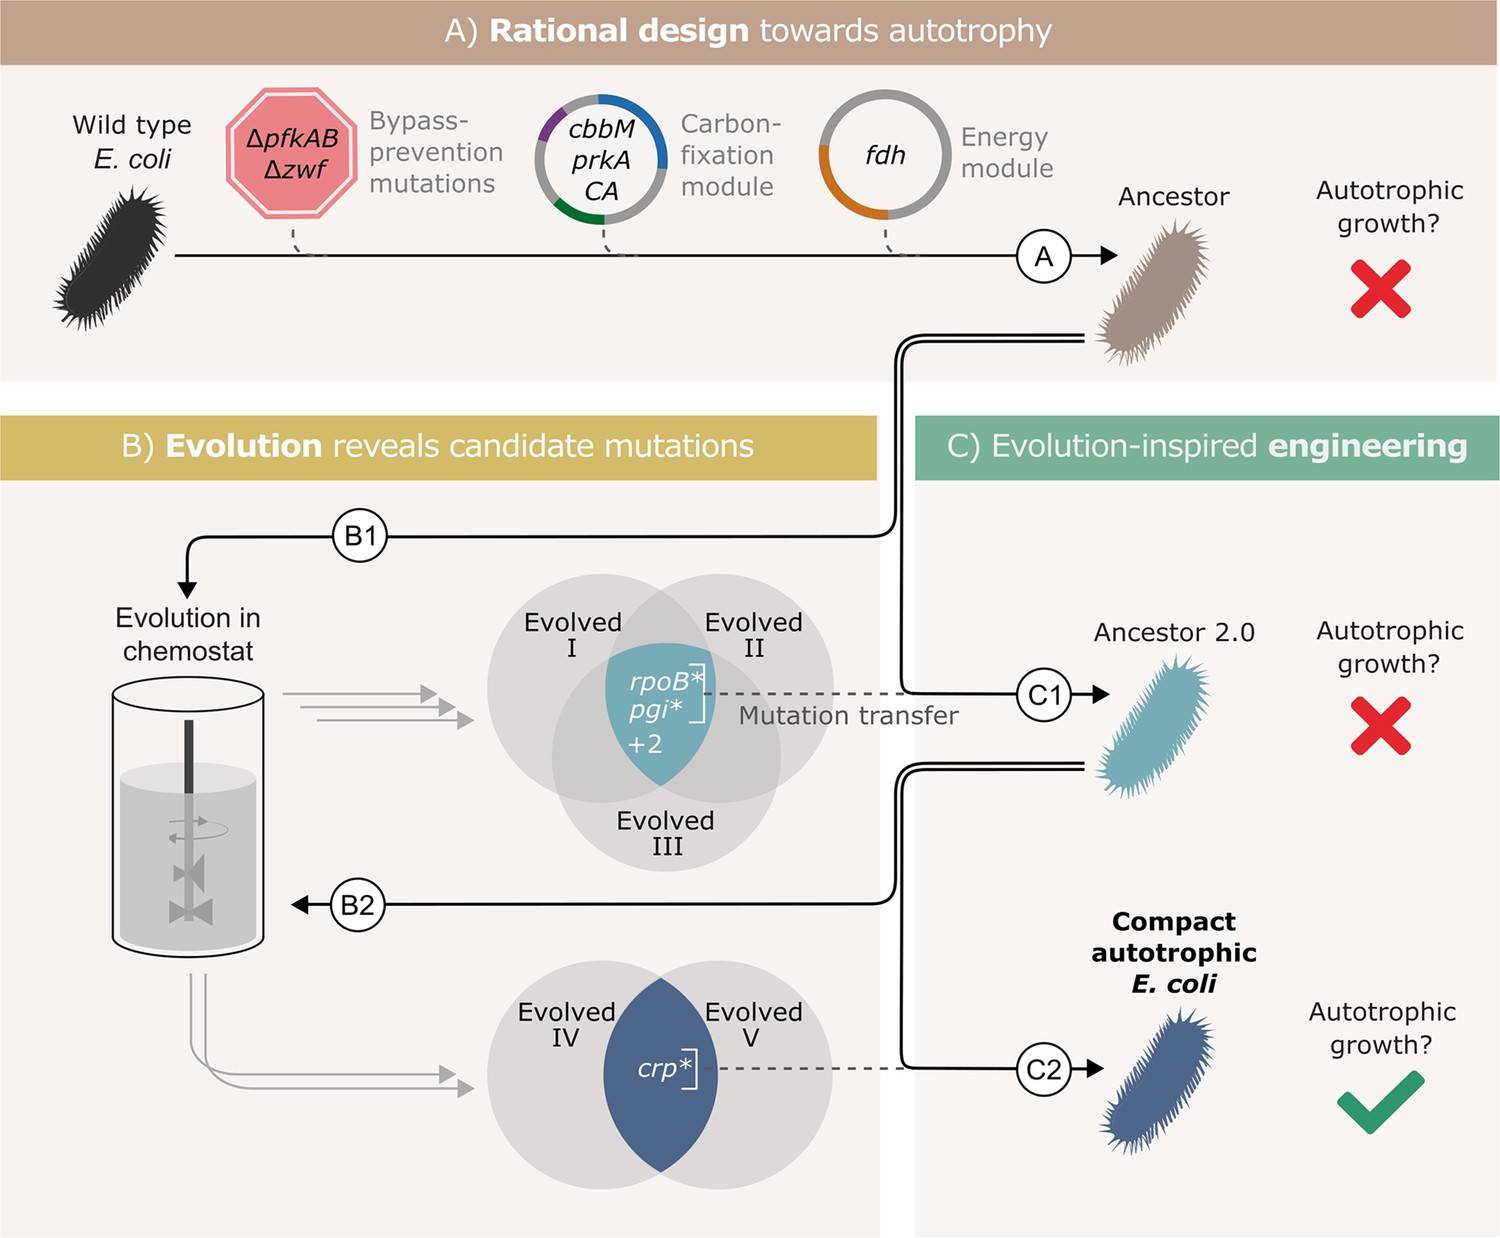
Autotrophic phenotype achieved by introducing 3 mutations on top of a rationally designed ancestor.
(A) We rationally designed the ‘wild-type’ E. coli background strain (BW25113, depicted as a black bacterium) by introducing 4 enzymes: RuBisCO (cbbM), phosphoribulokinase (prkA), carbonic anhydrase (CA) and formate dehydrogenase (fdh), and 3 genomic knockouts: glucose-6-phosphate dehydrogenase (zwf) and phosphofructokinase A&B (pfkAB). We denote the resulting strain as ‘Ancestor’ (brown bacterium). (B) We tested the resulting strain for autotrophic growth and, since it didn't grow, we used it for adaptive lab evolution in xylose-limited chemostats - that is, conditions that select for higher carbon fixation flux. Altogether, we were able to isolate three evolved clones (two distinct strains from one chemostat experiment, Evolved I and II, and another strain from a second experiment, Evolved III, step B1). (C) Out of four consensus mutations that we identified, two - rpoB and pgi - were incorporated into the ancestor, giving ‘Ancestor 2.0’ (light blue bacterium, step C1). Once more, we tested for autotrophic growth and were unsuccessful. Therefore, we initiated another round of adaptive lab evolution experiments using Ancestor 2.0 growing in two xylose limited chemostats and isolated two evolved clones (one from each chemostat, step B2). The two clones shared a single consensus mutation, in crp. We thus created a new strain from Ancestor 2.0 by introducing the crp mutation into it (blue bacterium, step C2). This strain could grow autotrophically and thus we achieved a compact autotrophic strain.
Figure 2 with 1 supplement
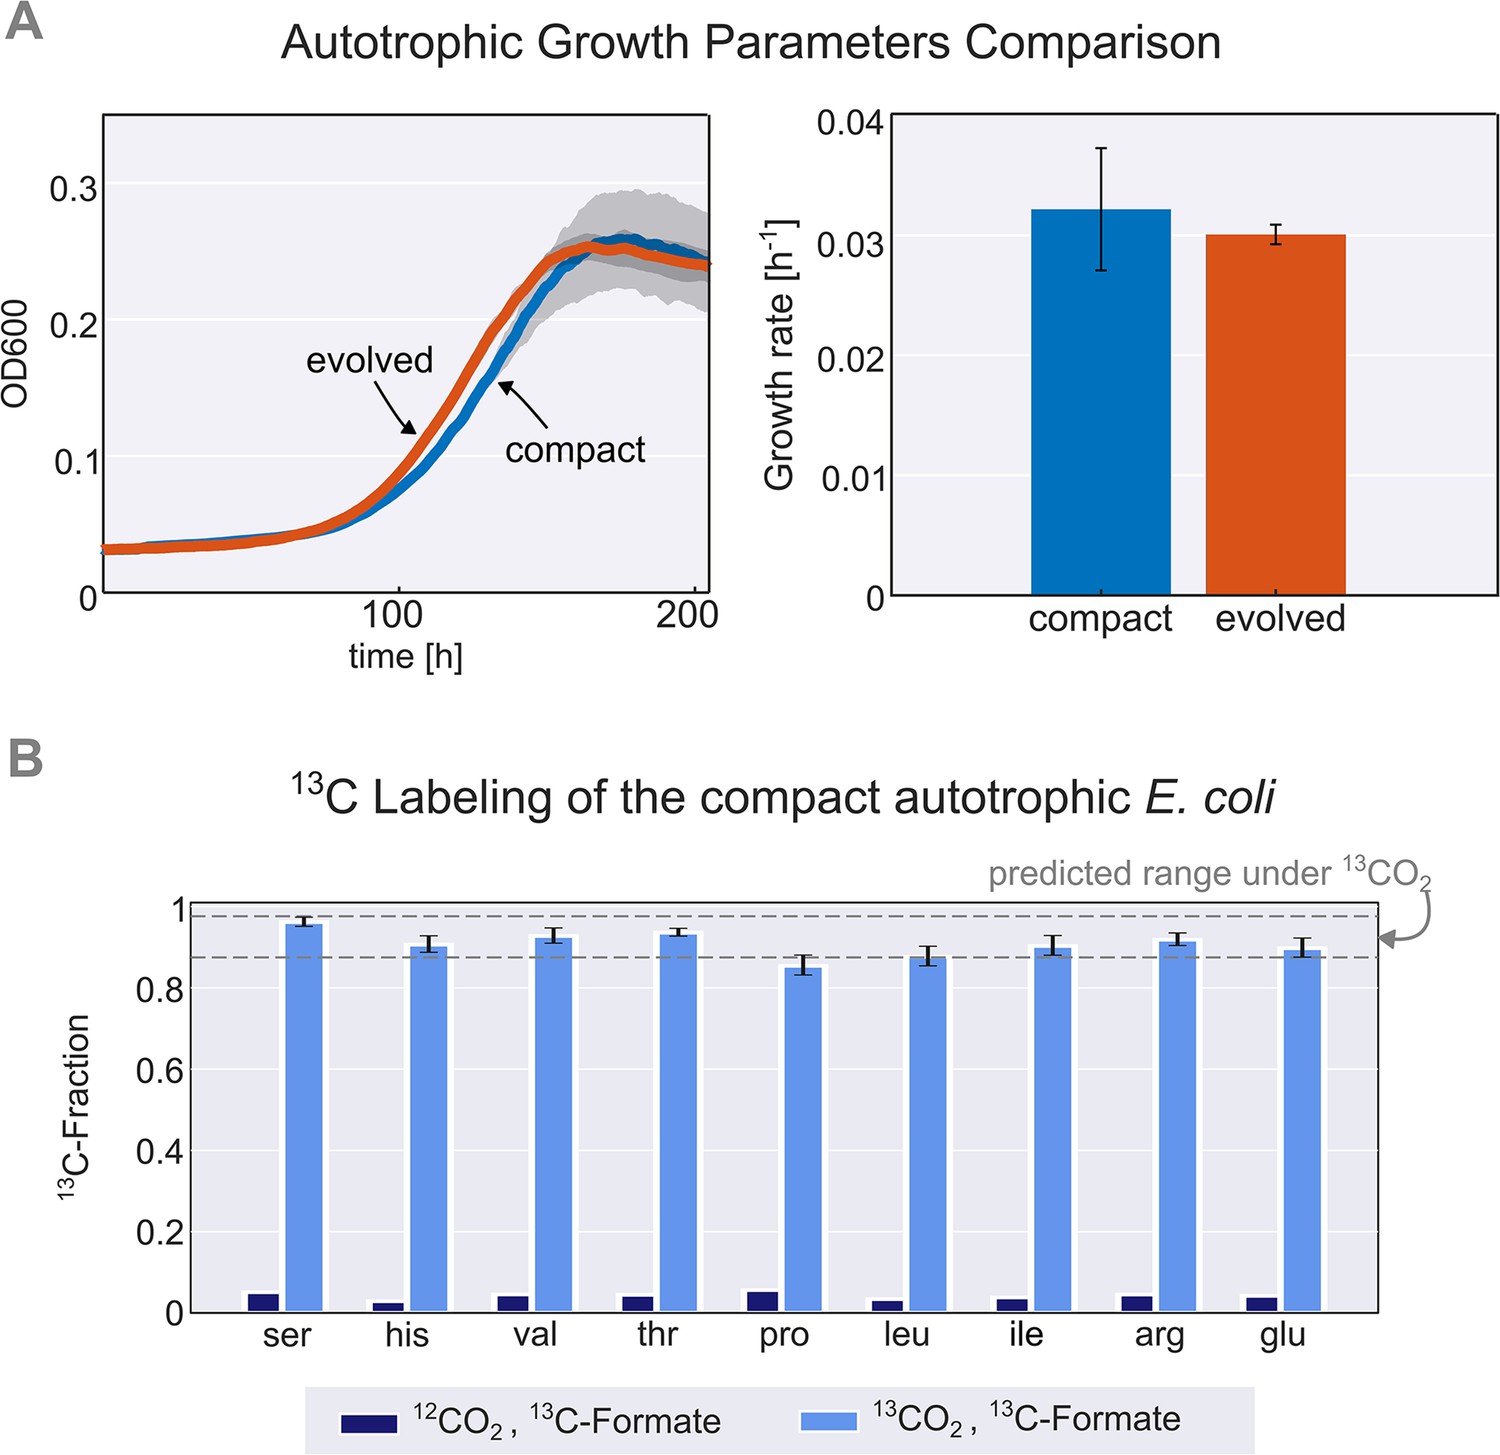
Validation and characterisation of the autotrophic phenotype.
(A) Left: growth curve of an isolated evolved clone (orange) versus the engineered compact strain (light blue) in liquid M9 minimal media supplemented with 45 mM sodium formate and sparged with a gas mixture of 10% CO2, 5% oxygen, and 85% nitrogen. Right: calculated growth rate using linear regression of the engineered compact strain and evolved strain, the calculated doubling time with the given conditions is about 24 hr (μ≈0.03 h–1). Growth was carried out in triplicates (n=3) in a Spark plate reader with gas control, dark grey area and error bars correspond to the standard deviation of the mean (150 μl culture +50 μl mineral oil, to prevent evaporation). (B) The fractional contribution of 13CO2 to various protein-bound amino acids of the compact autotrophic strain after ≈4 doublings on 13CO2 and 13C labeled formate (light blue, mean of n=3). This reached the expected 13C labeling fraction (see Materials and methods) of the biosynthesized amino acids. When grown in naturally labeled CO2 and 13C labeled formate (dark blue, n=1, technical triplicate) the 13C content dropped to close to natural abundance. Experiments with 13CO2 as the substrate were carried out in air-tight (i.e. sealed) growth vessels. Error bars represent standard deviation of the mean.
Figure 2—figure supplement 1

The fractional contribution of 13CO2 to various protein-bound amino acids evolved autotrophic strain after ≈4 doublings on 13CO2 and 13C labeled formate (light blue, mean of n=3) reached the expected 13C labeling fraction of the biosynthesized amino acids (see Materials and methods).
When grown in naturally labeled CO2 and 13C labeled formate (dark blue, n=1, technical triplicate) the 13C content dropped to close to natural abundance. Experiments with 13CO2 as the substrate were carried out in air-tight (i.e. sealed) growth vessels. Error bars represent standard deviation of the mean.
Figure 3 with 1 supplement
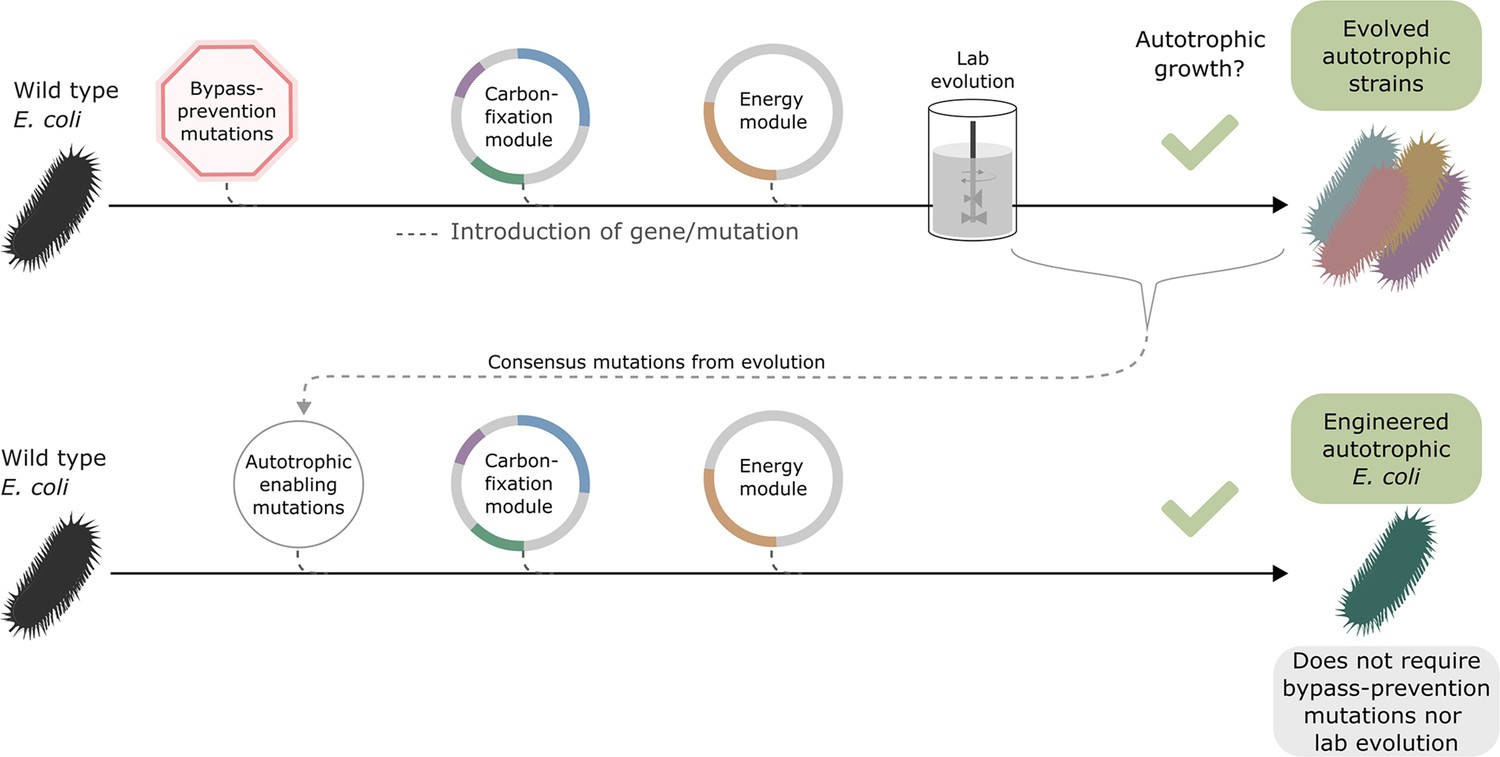
Auxiliary knockouts are not required for final phenotype.
We transformed a wild-type BW25113 E. coli strain (black bacteria) with the carboxylating and energy module plasmids (grey circles with coloured gene annotations), and inserted three auxiliary genomic knockouts (red octagon) to rewire metabolism toward carboxylating dependency. This strain was used for iterative evolution experiments in order to generate diverse autotrophic strains and reveal mutations candidates for rational design, that is consensus mutations. The identified autotrophic enabling mutations (thin grey circle) were then introduced in a wild-type strain expressing the heterologous plasmids but without the auxiliary knockouts, the final strain was able to grow in autotrophic conditions. Dashed lines represent gene/mutation introduction.
Figure 3—figure supplement 1

Growth of Compact versus Engineered autotrophic E. coli.
(A) Growth curve of continuous cultures in liquid M9 minimal media supplemented with 60 mM sodium formate and sparged with a gas mixture of 10% CO2, 5% oxygen, and 85% nitrogen. Top: Compact autotrophic E. coli (blue). Bottom: Engineered autotrophic strain (green). The experiment was conducted in a DASBox mini fermentation system (Eppendorf, Germany) and the cultures were diluted in a 1:30 ratio once reaching stationarity. Dotted lines (grey) demarcate the manually selected time-windows used for the different technical replicates. (B) Growth parameters of the different technical replicates (as marked in panel A) that were used to calculate the maximal OD600. Growth rates were calculated by linear regression of the log-transformed OD600 values (data and source code can be found at https://gitlab.com/milo-lab-public/compact-autocoli). Top: replicates of the Compact autotrophic strain (blue). Bottom: replicates of the Engineered autotrophic strain (green). (C) Maximal OD600 and calculated growth rate of the Compact autotrophic E. coli (blue) and the Engineered autotrophic E. coli (green). Bar heights represent averages (n=3) of the maximal ODs and growth rates of each replicate. Error bars represent standard errors. p-values are based on Student’s t-test with equal variance.
Figure 4 with 2 supplements
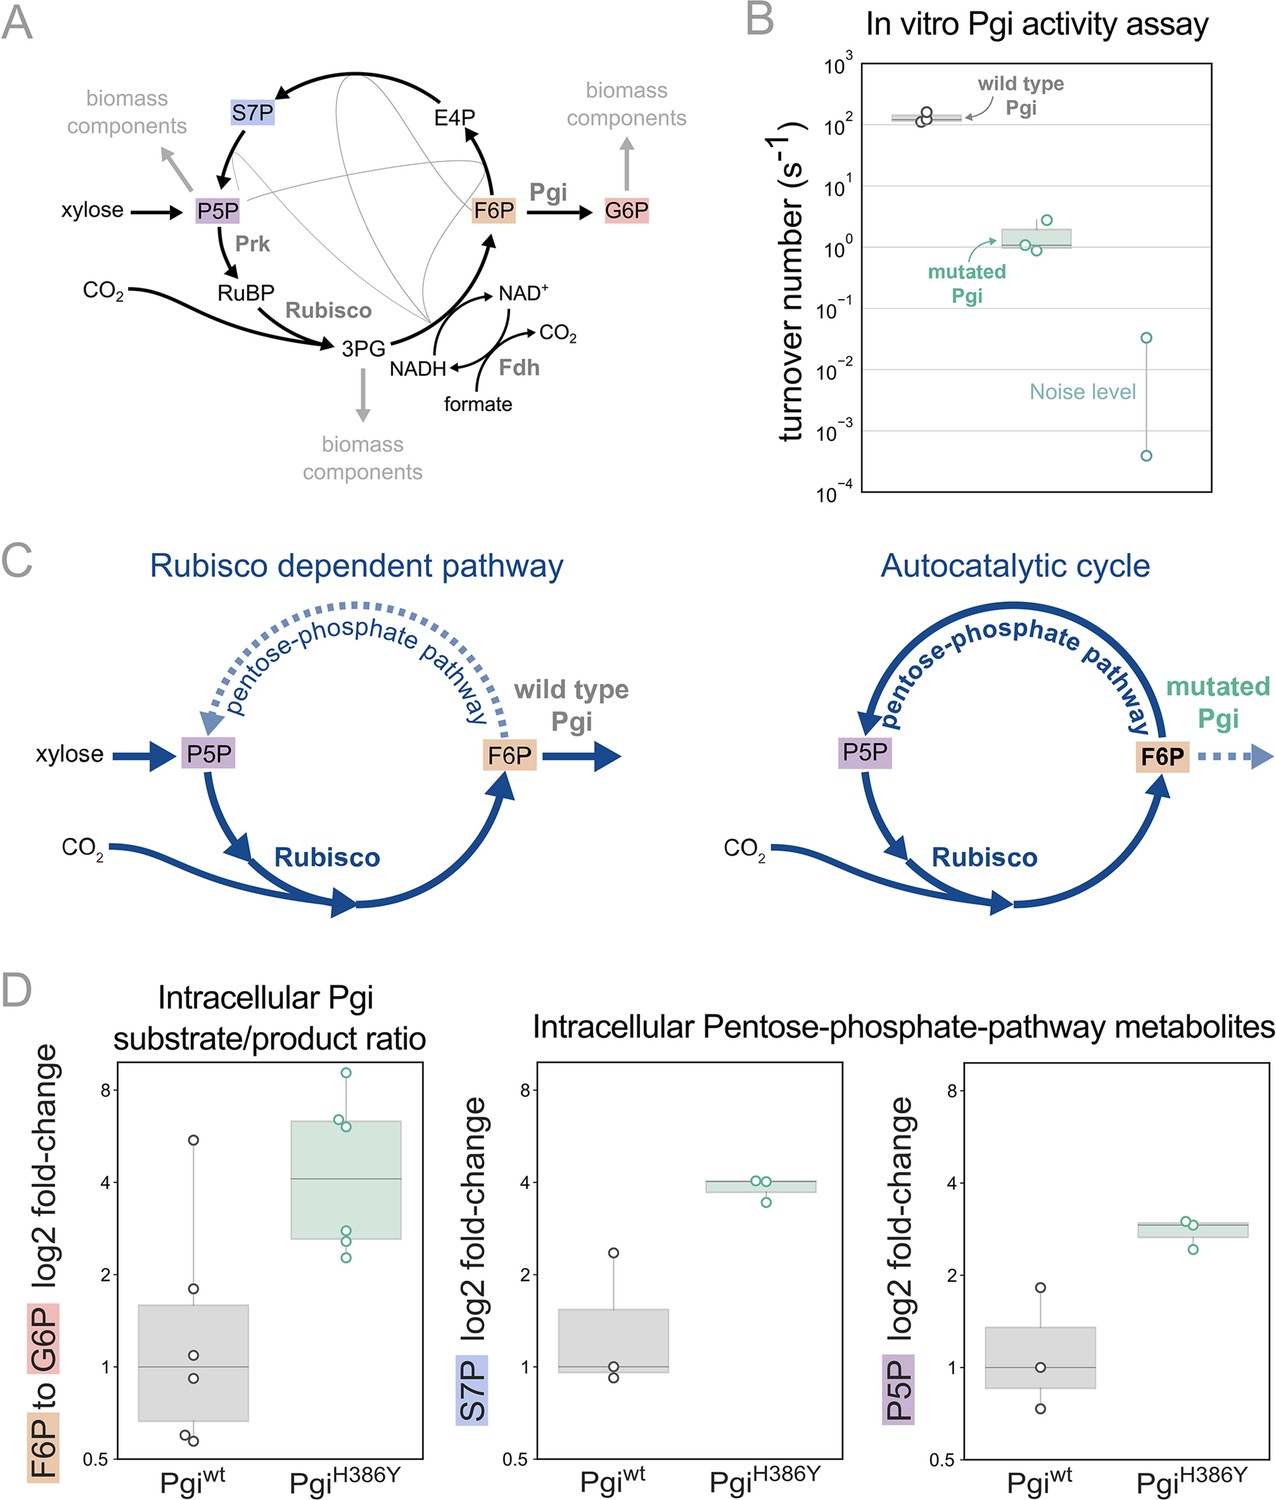
Pgi mutation is required to partition flux towards regeneration of autocatalytic cycle substrate.
(A) Metabolic scheme of rPP cycle components when growing on xylose. (B) In vitro spectrophotometric coupled assay determined that the rate of the isomerization of fructose-6-phosphate (F6P) to glucose-6-phosphate (G6P) is ≈100-fold lower for purified PgiH386Y (≈1.5 [s–1]) compared to Pgiwild-type (≈130 [s–1]), n=3. Noise level was determined by negative control samples containing a non-Pgi enzyme. (C) Left: The wild type Pgi, competes for its substrate F6P with the autocatalytic cycle, resulting in low F6P pool and low regeneration rate of ribulose-5-phosphate (Ru5P), which means that the RuBisCO-dependent pathway requires constant xylose supply. Right: The mutated Pgi (green) has reduced activity, which increases the ratio between the flux in the cycle and efflux which is needed for a stable regenerative flux towards Ru5P (via the pentose-phosphate-pathway), thus enabling an autotrophic cycle. (D) Left: Measured relative intracellular ratio of F6P and G6P of the ancestor background harbouring a PgiH386Y mutation compared to the ancestor with a wild-type Pgi, both grown in RuBisCO-dependent conditions, n=6 cultures p-value <0.05. Right: Relative intracellular abundance of pentose-phosphate-pathway metabolites - sedoheptulose-7P (S7P) and total pool of pentose phosphates (ribulose-5P, ribose-5P, ribose-1P, and xylulose-5P - denoted P5P) in a PgiH386Y strain versus the Pgiwild-type strain, both growing in a RuBisCO-dependent manner, n=3 cultures, p-value <0.05. p-values are based on Student’s t-test with equal variance.
-
Figure 4—source data 1
In vitro characterization of PgiH386Y.
- https://cdn.elifesciences.org/articles/88793/elife-88793-fig4-data1-v1.zip
Figure 4—figure supplement 1
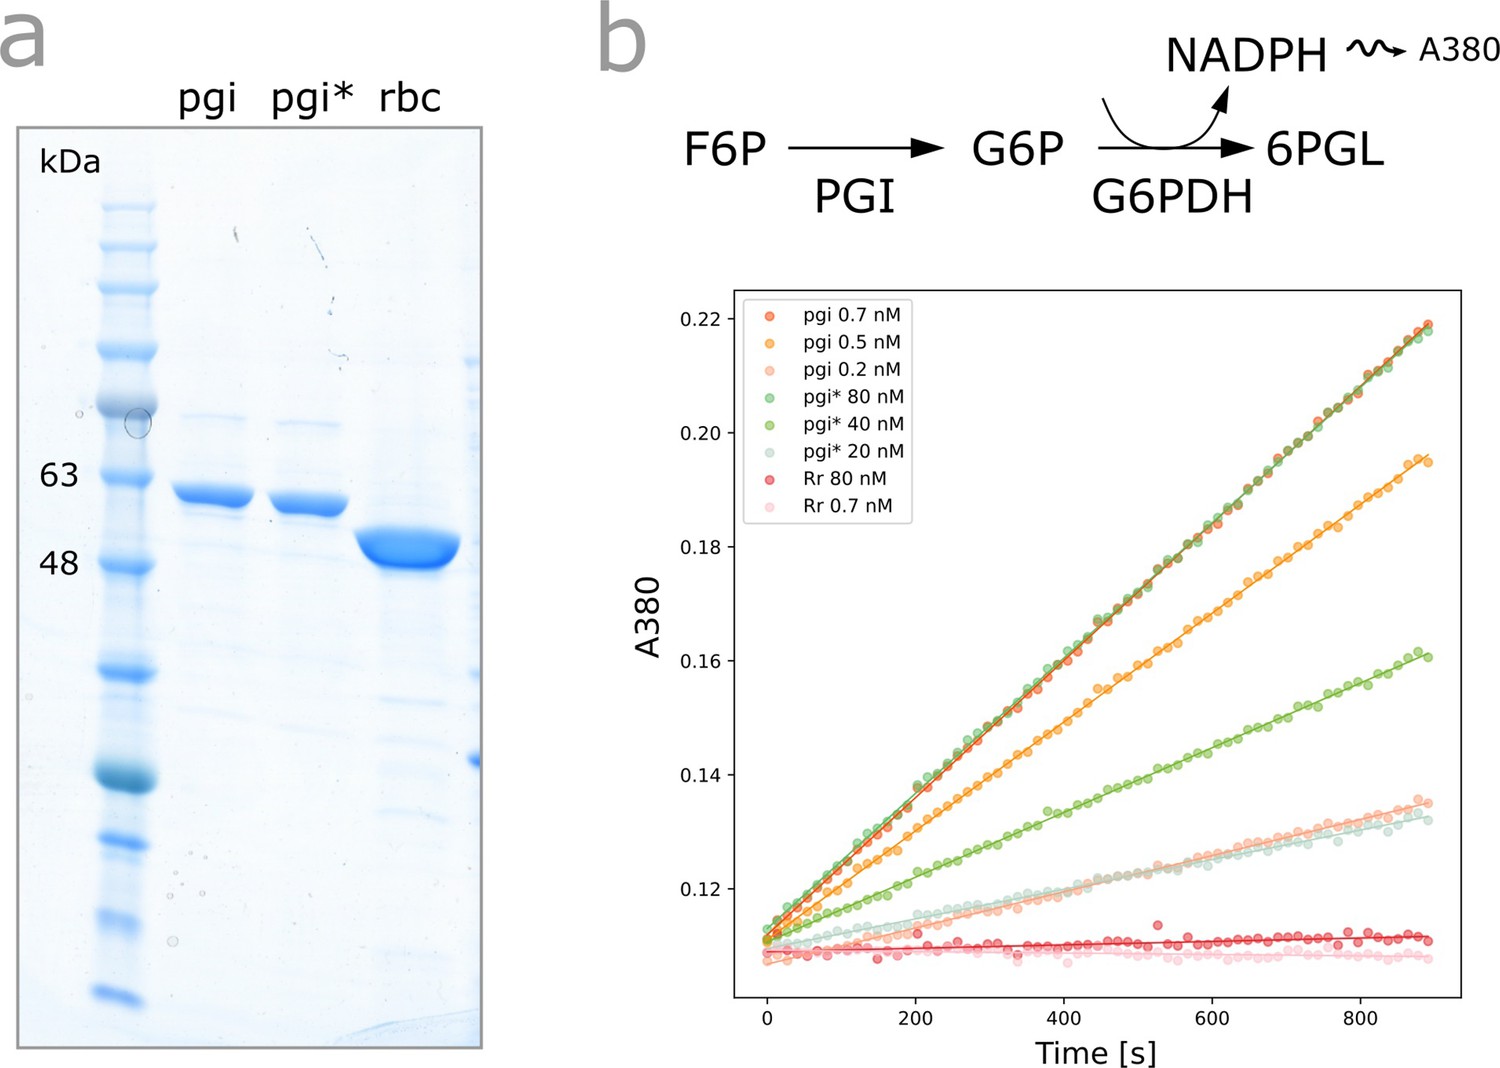
In vitro characterization of PgiH386Y.
(a) SDS-PAGE of purified Pgiwild-type, PgiH386Y and Rubisco after expression in E. coli. (b) Spectrophotometric coupled assay determining the rate of the isomerization of fructose-6-phosphate (F6P) to glucose-6-phosphate (G6P) for purified Pgiwild-type and PgiH386Y. Rubisco was used as a negative control setting the noise level.
Figure 4—figure supplement 2

LC-MS/MS chromatogram of intracellular metabolites involved in the autocatalytic cycle in E. coli ancestor with PgiH386Y mutation and ancestor with Pgiwild-type.
(A) Chromatogram of fructose-6-phosphate (F6P) and glucose-6-phosphate (G6P). Precursor ion (259.0) and product ion (79.0) were used for 12C detection. Strains (n=6) are grown in rubisco dependent conditions. Samples were measured using a Shodex HILICpak VG-50 2D. The retention time of hexose-phosphates were determined with authentic standards of G6P and F6P and the 12C peak heights were used to quantify metabolites. Experiments were performed in two batches of n=3 cultures. First batch samples (replicates 1–3) were used for measurements in A,B and C. (B) Chromatogram of total pool of pentose phosphates (ribulose-5P, ribose-5P, ribose-1P, and xylulose-5P - denoted P5P). Strains were grown in a rubisco-dependent manner (n=3) cultures. Overlay of 12C chromatograms (continuous line) and 13C chromatograms (dashed line) with precursor ion and product ion used for 12C detection as indicated. Samples were measured using an Acquity BEH Amide column and the ratio of 12C (sample) and 13C (internal standard) peak heights was used to quantify metabolites. (C) sedoheptulose-7P (S7P) chromatogram of the same samples and conditions as indicated in B.
Figure 5 with 3 supplements
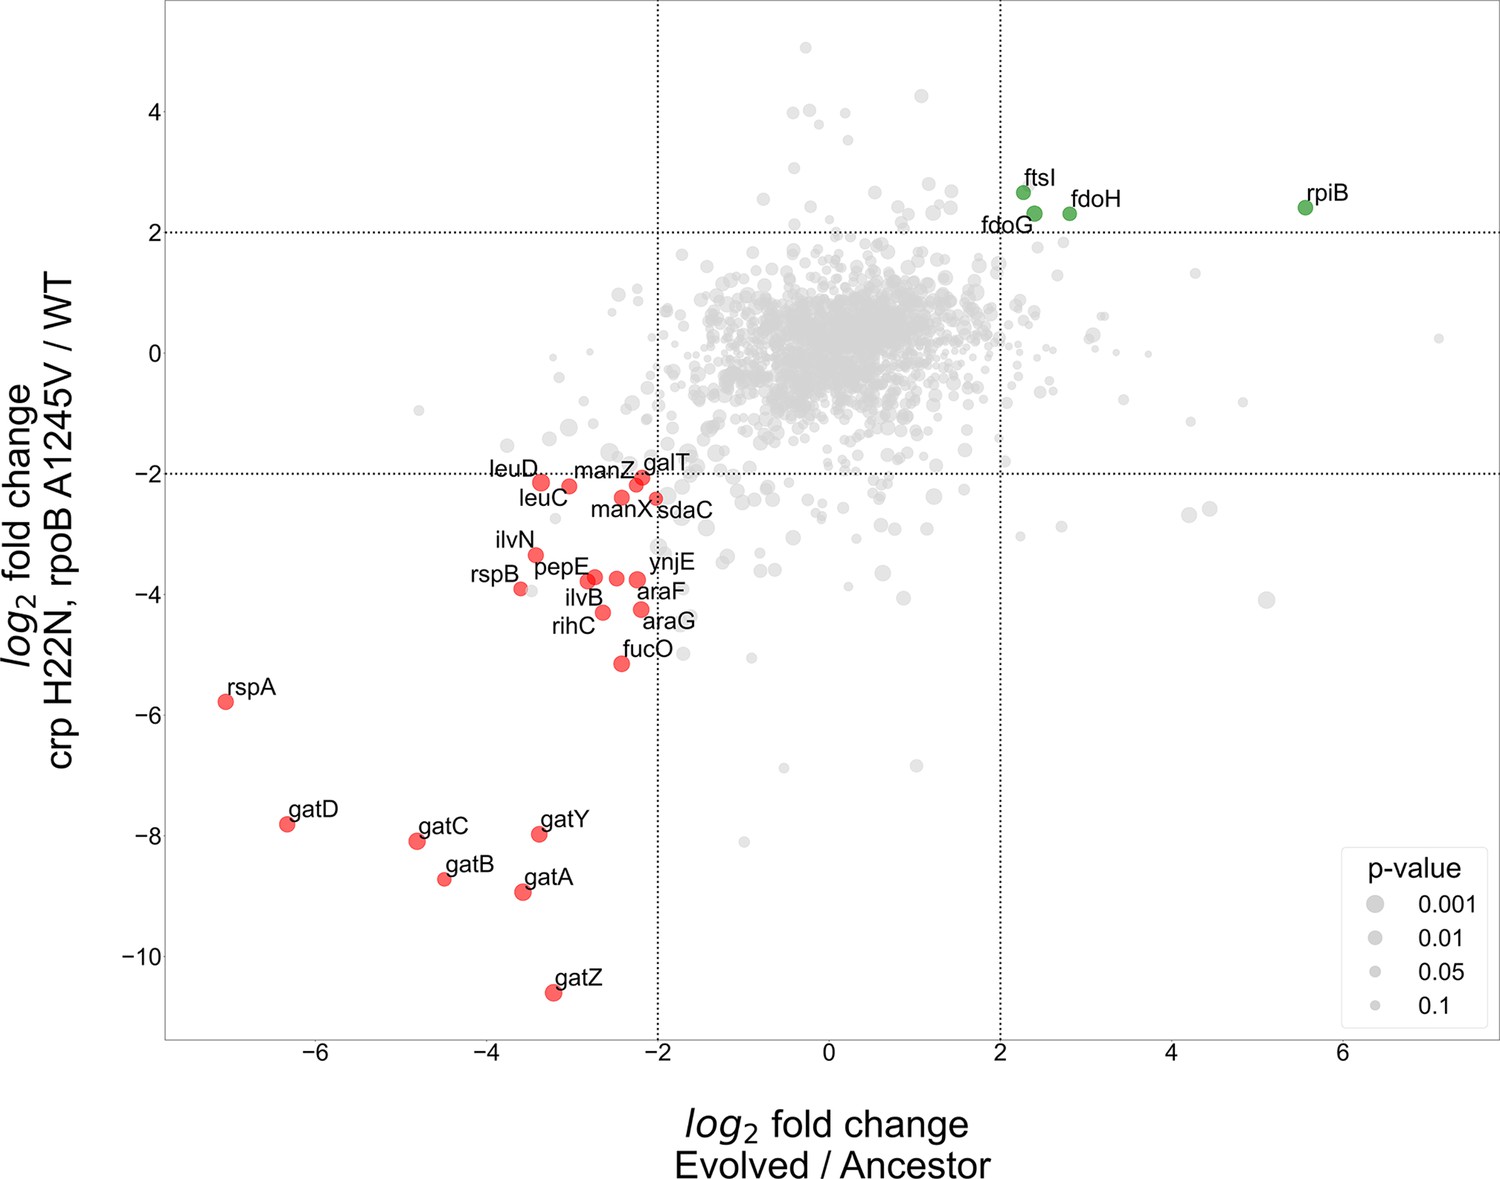
Proteomics analyses of fold change in evolved/ancestor expression levels versus double mutant/WT.
Comparison of the log2 fold change in the evolved autotrophic strain divided by the ancestor expression versus BW rpoB A1245V and crp H22N, divided by the WT. The size of dots represents significance, only genes with >fourfold-change who showed significance (<0.05 p-value) were annotated.
Figure 5—figure supplement 1

proteomics analysis of evolved strain and BW double-mutant.
The differential protein expression between different strains. Red dots represent downregulated genes, Green - up-regulated. Only the genes that were had >fourfold-change and <0.05 p-value in both sets were annotated. (A) Evolved / Ancestor. (B) rpoB A1245V, crp H22N / WT.
Figure 5—figure supplement 2
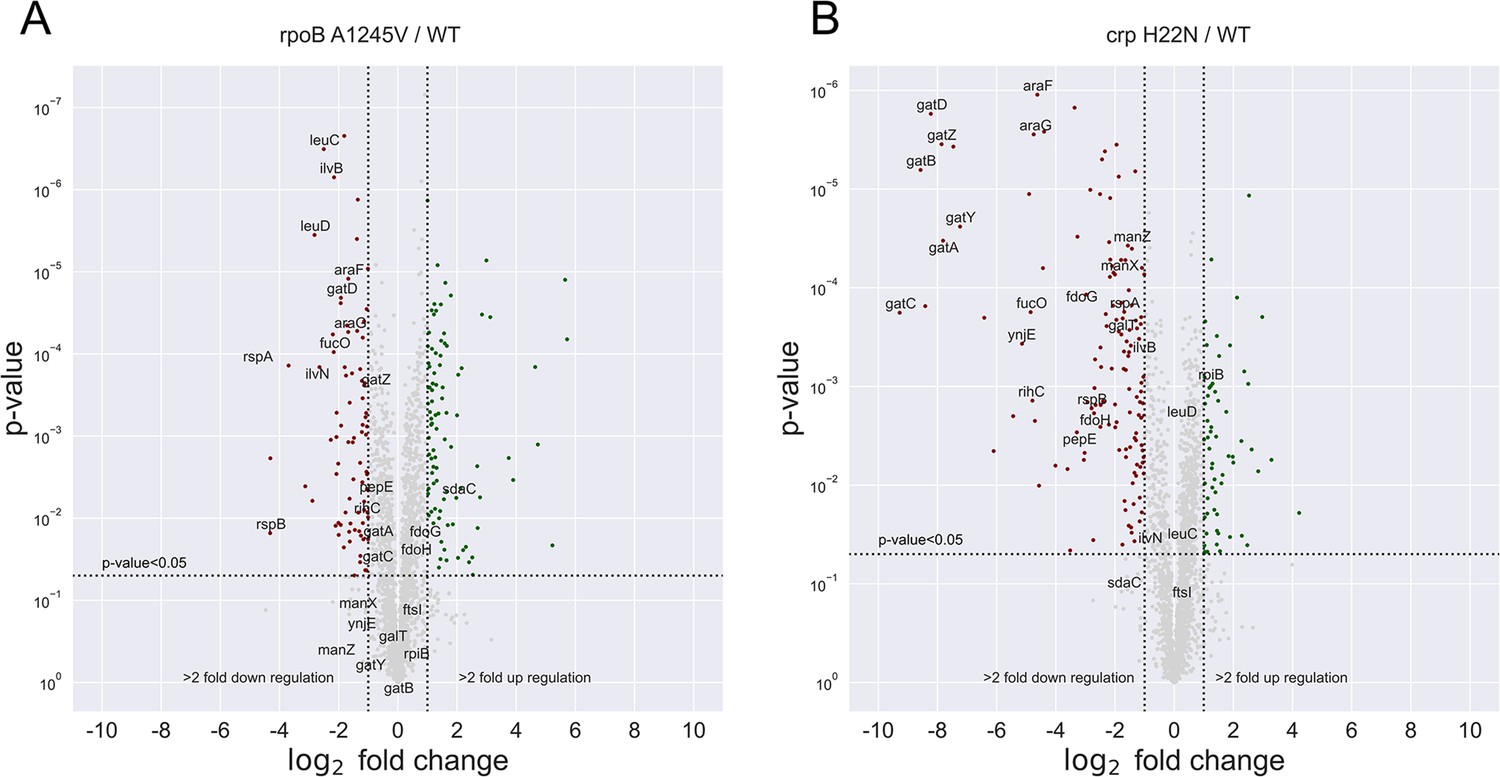
proteomics analysis of BW mutants.
The differential protein expression between different strains. Red dots represent downregulated genes, Green - up-regulated. Only the genes that were had >fourfold-change and <0.05 p-value in both of Figure 6—figure supplement 1A, B sets were annotated (A) rpoB A1245V / WT. (B) crp H22N / WT.
Figure 5—figure supplement 3
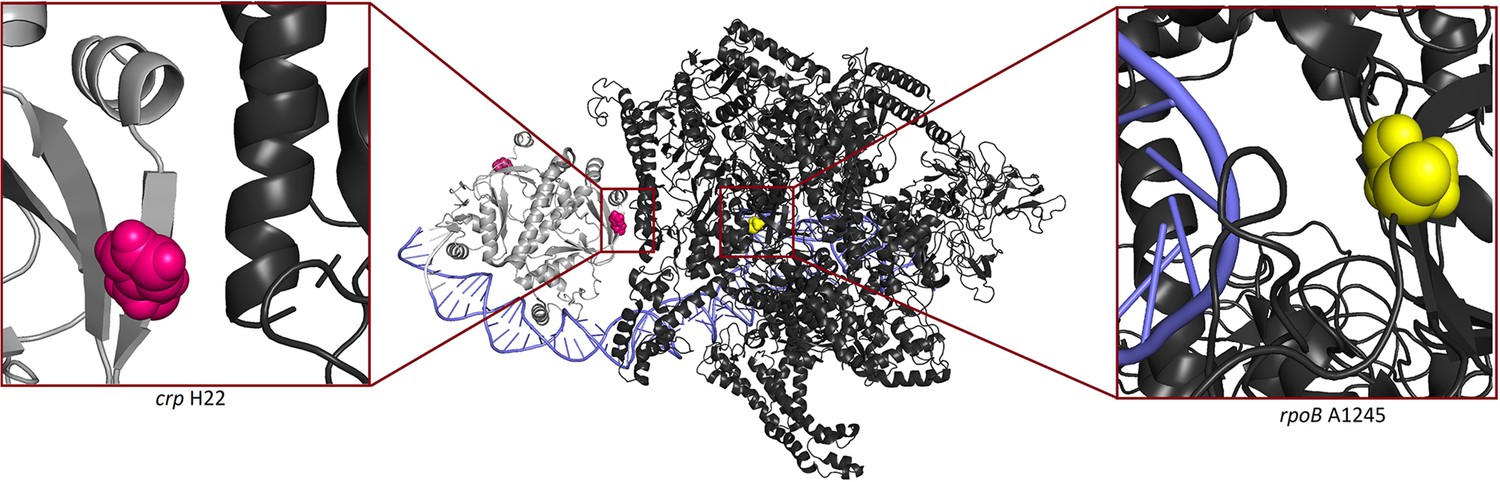
3D structure of wild type RNA polymerase and cAMP receptor protein.
In light grey Crp, in black RNA polymerase (the holoenzyme which includes RpoB), in purple DNA, mutated positions are shown in pink (Crp H22) and in yellow (RpoB A1245). Crp H22 is located in activation region 2 of Crp. The protein structure was taken from (Shi et al., 2020).
Figure 6 with 1 supplement
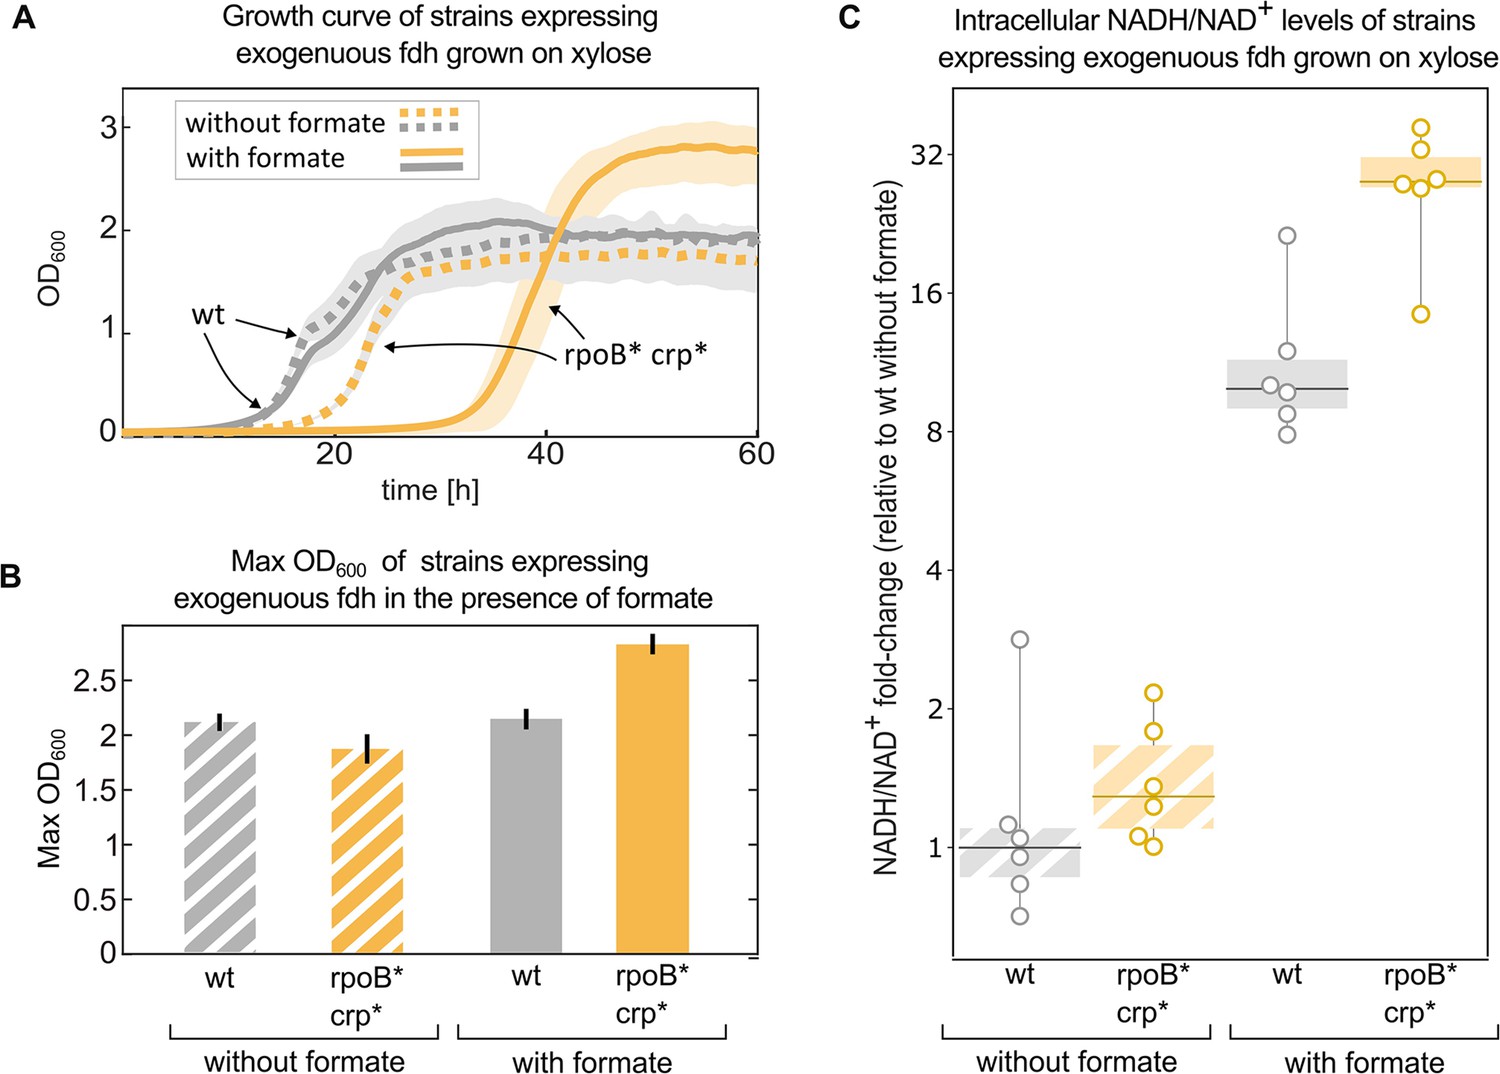
Mutations in rpoB and crp increase yield and intracellular NADH/NAD + levels in fdh-expressing E. coli in the presence of formate.
Growth experiment of BW25113 wild-type (grey) compared to a crp H22N rpoB A1245V mutant (orange). Both strains express fdh. (A) Strains were grown in 1 g/L xylose and 40 mM formate (solid line) or in the absence of formate (dashed line). The experiment was executed in a 96-well plate in 10% CO2 atmosphere, n=6 repeats. Lines represent the mean, light-grey background represents the standard deviation of the mean. (B) Maximal OD600 of the wild-type (grey) and mutant (orange) strains grown in 1 g/L xylose and 40 mM formate or in the absence of formate. Bar heights represent averages (n=6) of the median of the top 10 OD measurements of each replicate. Error bars represent standard deviation of the mean. (C) Intracellular NADH/NAD+ ratio of the wild-type (grey) was compared to the mutant (orange). The strains were grown in 2 g/L xylose and 30 mM formate, or in the absence of formate. The y-values are NADH/NAD+ ratios as fold-changes relative to wild-type without formate. Boxes represent 25–75 percentile ranges and dark lines represent median values. All data points are depicted without removing outliers. n=6 cultures, for the comparison in the presence of formate p-value <0.05. p-values are based on Student’s t-test with equal variance.
Figure 6—figure supplement 1
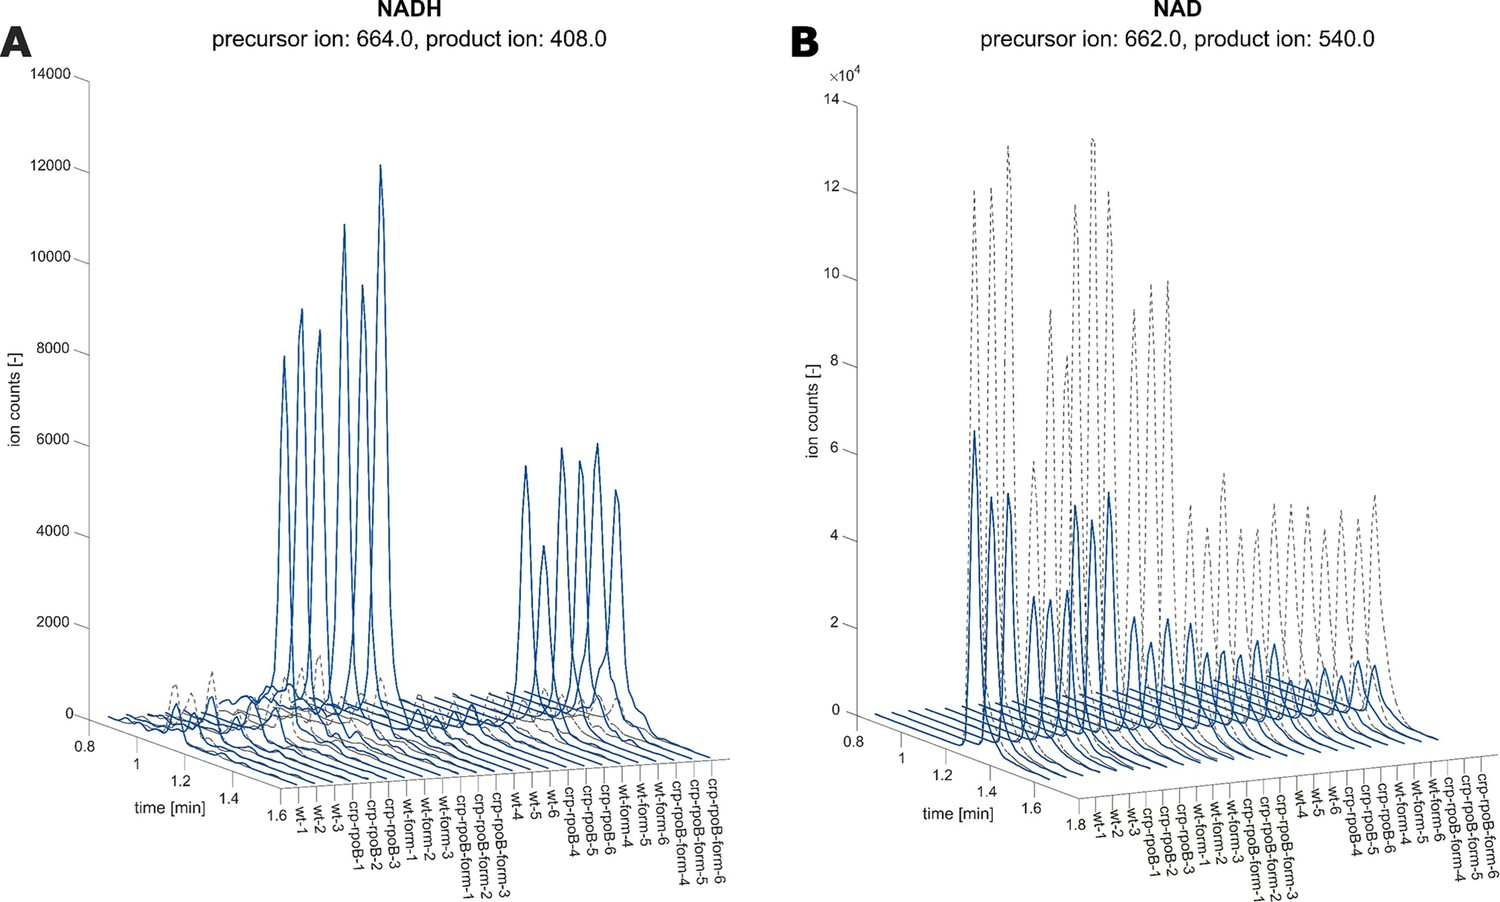
LC-MS/MS chromatograms of NADH and NAD in fdh-expressing E. coli in the presence and absence of formate.
(A) NADH chromatogram of E. coli BW25113 wild-type compared to a crpH22N rpoBA1245V mutant. Experiments were performed in two batches of n=3 cultures. Chromatograms are sorted accordingly. Overlay of 12C chromatograms (continues line) and 13C chromatograms (dashed line). Precursor ion and product ion used for 12C detection are indicated. Strains are grown with 30 mM formate (blue) or without the addition of formate (gray). (B) NAD chromatogram, same samples as in A. The ratio of 12C (sample) and 13C (internal standard) peak heights was used to quantify metabolites.
Additional files
-
Supplementary file 1
iterative evolution mutations.
- https://cdn.elifesciences.org/articles/88793/elife-88793-supp1-v1.xlsx
-
Supplementary file 2
Compact and evolved labeling run curated peaks summary.
- https://cdn.elifesciences.org/articles/88793/elife-88793-supp2-v1.xlsx
-
Supplementary file 3
compact vs evolved growth experiment DATA 45 mM 5 pctO2.
- https://cdn.elifesciences.org/articles/88793/elife-88793-supp3-v1.xlsx
-
Supplementary file 4
compact vs evolved growth experiment MAP 45mM 5 pctO2.
- https://cdn.elifesciences.org/articles/88793/elife-88793-supp4-v1.xlsx
-
Supplementary file 5
pgi kinetic assays data.
- https://cdn.elifesciences.org/articles/88793/elife-88793-supp5-v1.zip
-
Supplementary file 6
G6PvsF6PResults.
- https://cdn.elifesciences.org/articles/88793/elife-88793-supp6-v1.zip
-
Supplementary file 7
PPP metabolites.
- https://cdn.elifesciences.org/articles/88793/elife-88793-supp7-v1.zip
-
Supplementary file 8
Growth experiment WT vs DM FDH variants CO2 40mMFor DATA.
- https://cdn.elifesciences.org/articles/88793/elife-88793-supp8-v1.xlsx
-
Supplementary file 9
Growth experiment WT vs DM FDH variants CO2 40mMFor MAP.
- https://cdn.elifesciences.org/articles/88793/elife-88793-supp9-v1.xlsx
-
Supplementary file 10
Growth experiment WT vs DM FDH variants CO2 NoFormate DATA.
- https://cdn.elifesciences.org/articles/88793/elife-88793-supp10-v1.xlsx
-
Supplementary file 11
Growth experiment WT vs DM FDH variants CO2 NoFormate MAP.
- https://cdn.elifesciences.org/articles/88793/elife-88793-supp11-v1.xlsx
-
Supplementary file 12
rpoB crp metabolomics.
- https://cdn.elifesciences.org/articles/88793/elife-88793-supp12-v1.zip
-
Supplementary file 13
proteomics Evo Anc.
- https://cdn.elifesciences.org/articles/88793/elife-88793-supp13-v1.xlsx
-
Supplementary file 14
proteomics WT variants.
- https://cdn.elifesciences.org/articles/88793/elife-88793-supp14-v1.xlsx
-
Supplementary file 15
Compact AutoColi dasgib log.
- https://cdn.elifesciences.org/articles/88793/elife-88793-supp15-v1.zip
-
Supplementary file 16
Scaffoldless Autocoli dasgib log.
- https://cdn.elifesciences.org/articles/88793/elife-88793-supp16-v1.zip
-
Supplementary file 17
Primer list.
- https://cdn.elifesciences.org/articles/88793/elife-88793-supp17-v1.xlsx
-
MDAR checklist
- https://cdn.elifesciences.org/articles/88793/elife-88793-mdarchecklist1-v1.docx
Download links
A two-part list of links to download the article, or parts of the article, in various formats.
Downloads (link to download the article as PDF)
Open citations (links to open the citations from this article in various online reference manager services)
Cite this article (links to download the citations from this article in formats compatible with various reference manager tools)
Autotrophic growth of Escherichia coli is achieved by a small number of genetic changes
eLife 12:RP88793.
https://doi.org/10.7554/eLife.88793.4


