Metabolic memory of Δ9-tetrahydrocannabinol exposure in pluripotent stem cells and primordial germ cells-like cells
- Institute for Society and Genetics, University of California, Los Angeles, United States
- Department of Obstetrics/Gynecology and Reproductive Endocrinology and Infertility, University of California, Los Angeles, United States
- Molecular, Cellular, and Integrative Physiology Graduate Program, University of California, Los Angeles, United States
- Department of Molecular Cell and Developmental Biology, University of California, Los Angeles, United States
- Center for Reproductive Science, Health and Education, University of California, Los Angeles, United States
- Eli and Edythe Broad Center of Regenerative Medicine and Stem Cell Research, University of California, Los Angeles, United States
- Integrative Biology and Physiology Department, University of California, Los Angeles, United States
- Department of Molecular and Medical Pharmacology, University of California, Los Angeles, United States
- Molecular Biology Institute, University of California, Los Angeles, United States
Figures
Figure 1 with 4 supplements
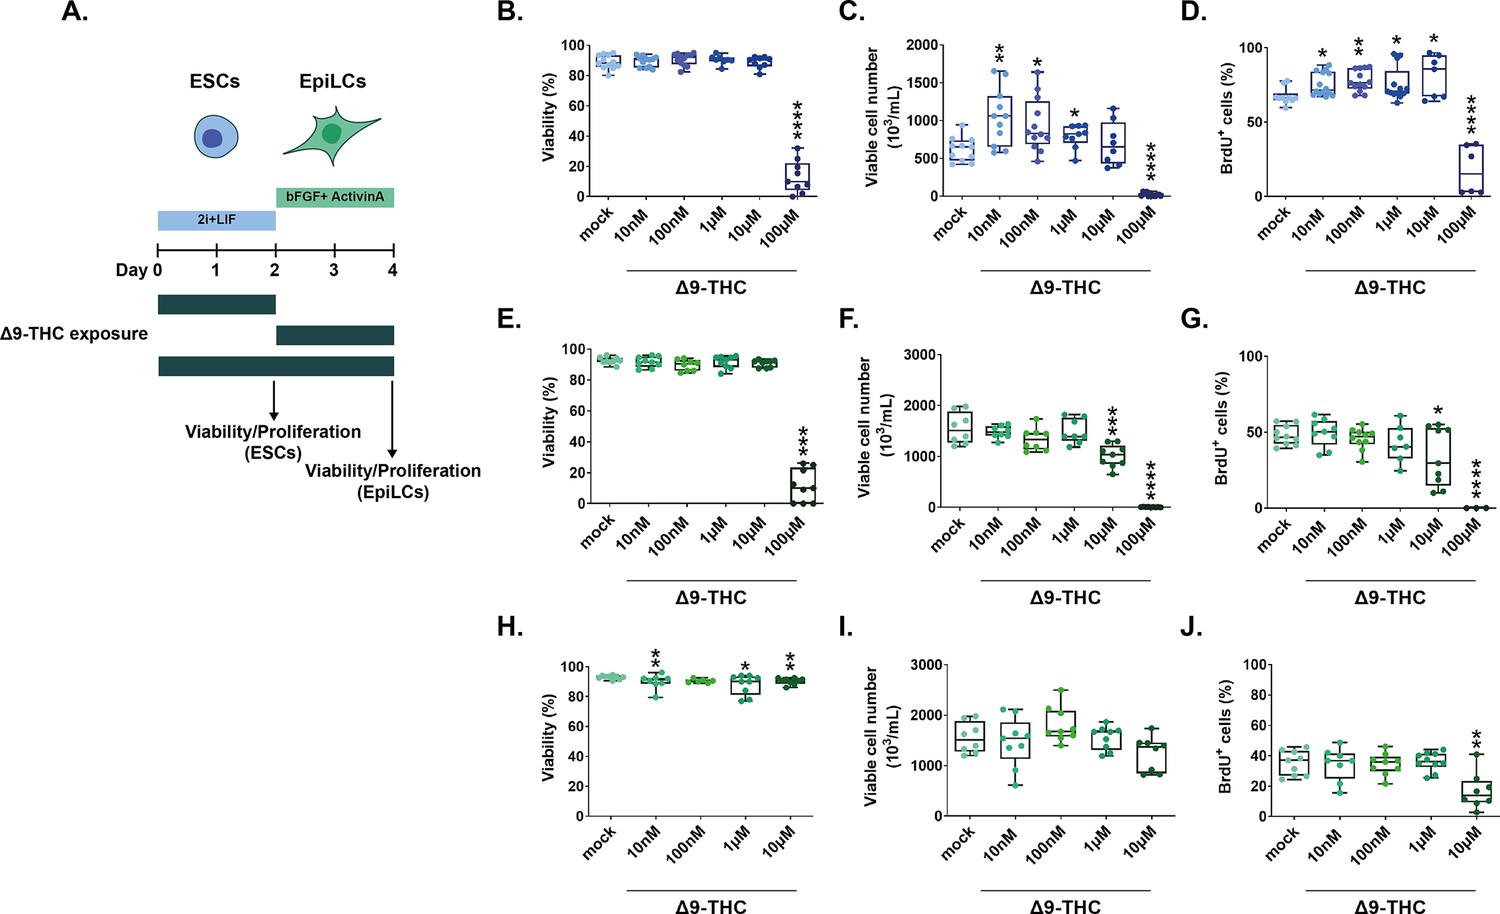
Δ9-THC exposure induces the proliferation of ESCs but not EpiLCs (A) Diagram illustrating Δ9-THC exposure scheme and experimental strategy.
bFGF: basic fibroblast growth factor, ESCs, embryonic stem cells; EpiLCs, epiblast-like cells; LIF, leukemia inhibitory factor. (B, E, H) Whisker boxplot indicating the median cellular viability of stem cells exposed to the different Δ9-THC doses and associated errors. (C, F, I) Whisker boxplot indicating the median number of viable cells exposed to the different Δ9-THC doses indicated and associated errors. (D, G, J) Whisker boxplot indicating the median percentage of BrdU-stained cells exposed to the different Δ9-THC doses and associated errors. ESCs exposed cells are presented in (B, C and D). EpiLCs exposed cells deriving from unexposed ESCs are presented in (E, F and G). EpiLCs exposed cells deriving from exposed ESCs are presented in (H, I and J). At least three independent biological repeats with three technical replicates (N=3, n=3). Statistical significance: *(p<0.05), **(p<0.01), ***(p<0.001), ****(p<0.0001).
Figure 1—figure supplement 1
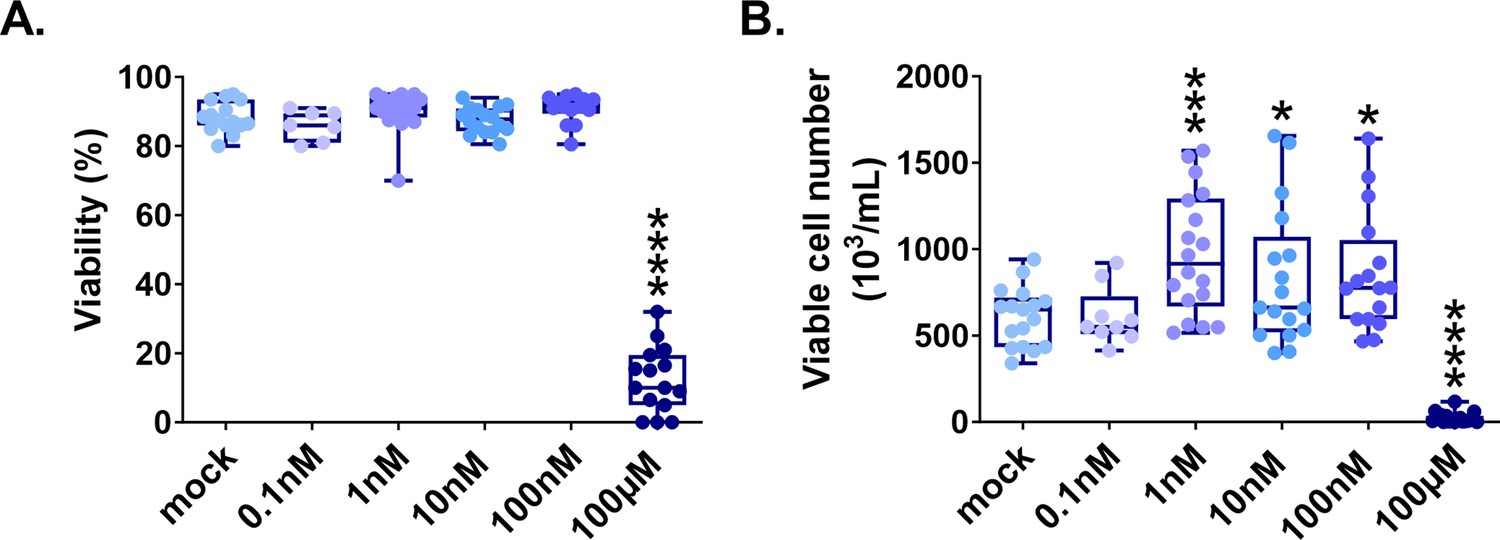
Δ9-THC induces ESCs proliferation for as low as 1 nM.
(A) Whisker boxplot indicating the median cellular viability of ESCs exposed to the different Δ9-THC doses and associated errors. (B) Whisker boxplot indicating the median number of viable cells exposed to the different Δ9-THC doses indicated and associated errors. At least three independent biological repeats with three technical replicates (N=3, n=3). Statistical significance: *(p<0.05), ***(p<0.001), ****(p<0.0001).
Figure 1—figure supplement 2
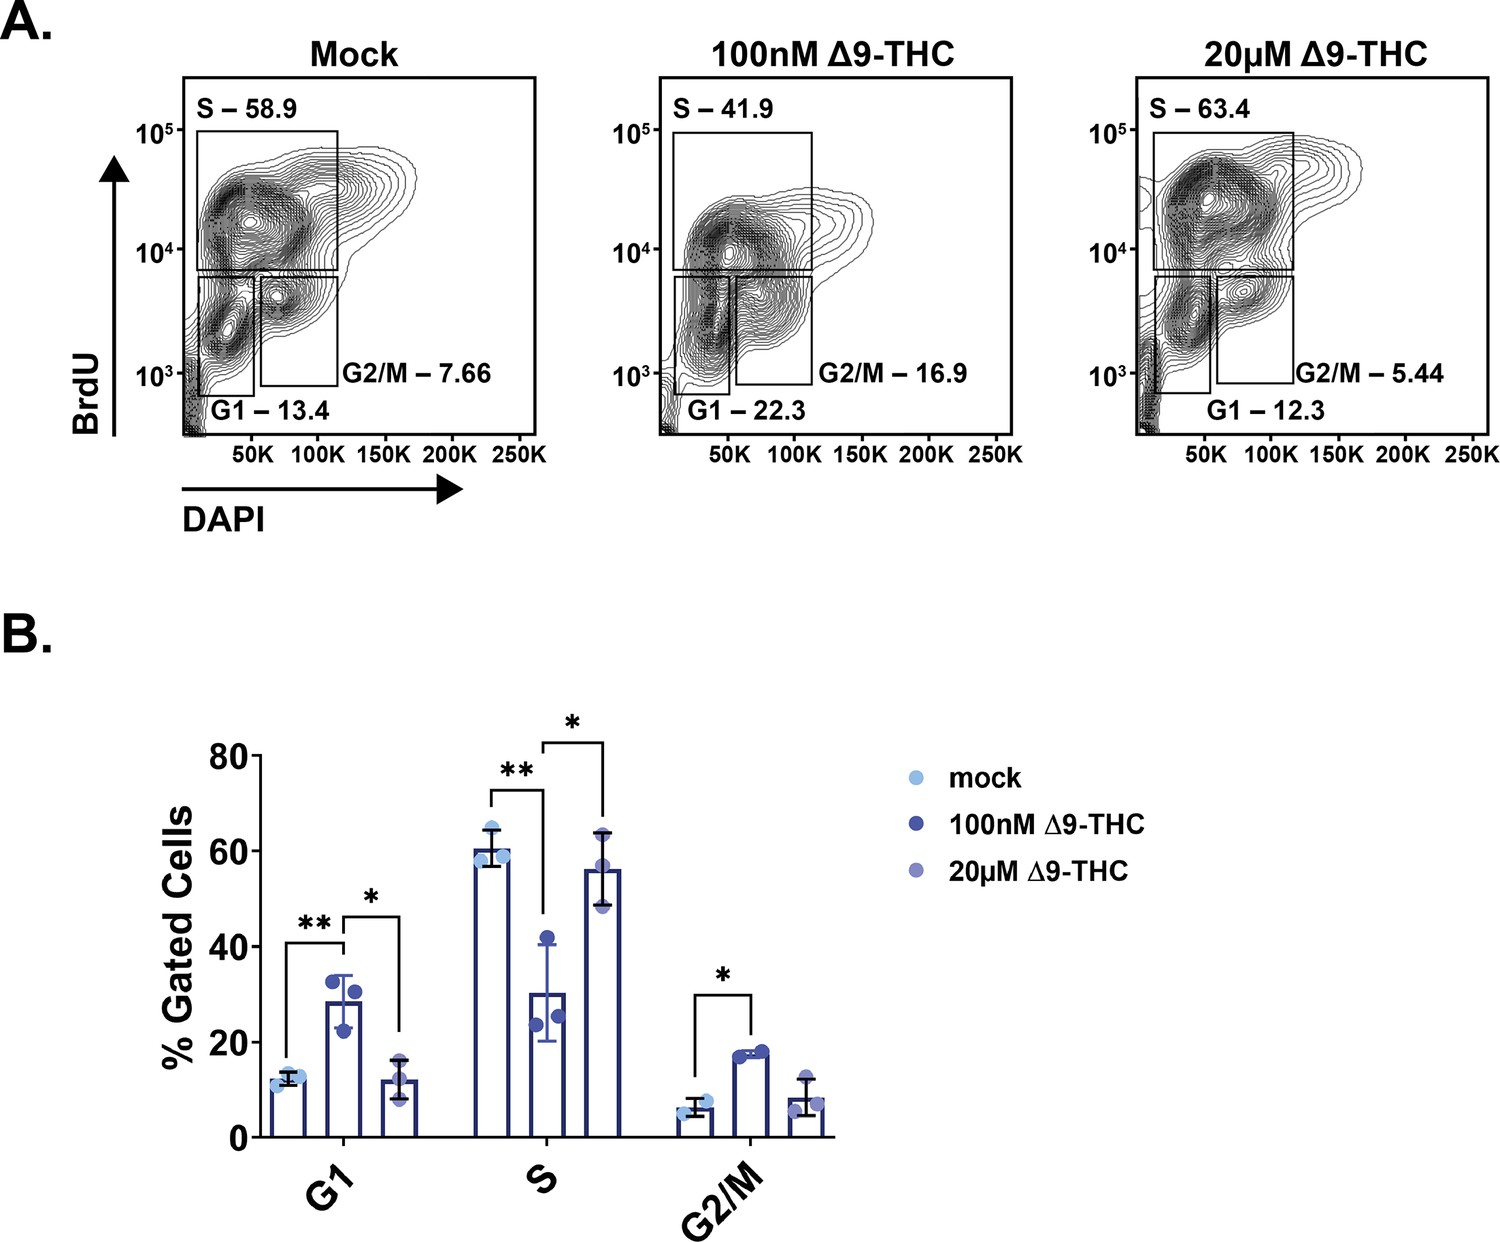
Δ9-THC induces alteration in ESCs cell cycle.
(A) Representative flow contour plots showing distribution of BrdU-stained and DAPI-stained cells, exposed to the different doses of Δ9-THC indicated. The frequency of events in each gate is indicated. (B) The median percentage of events and associated errors for each cell cycle gate were plotted in histograms. At least three independent biological repeats with three technical replicates (N=3, n=3). Statistical significance: *(p<0.05), **(p<0.01).
Figure 1—figure supplement 3
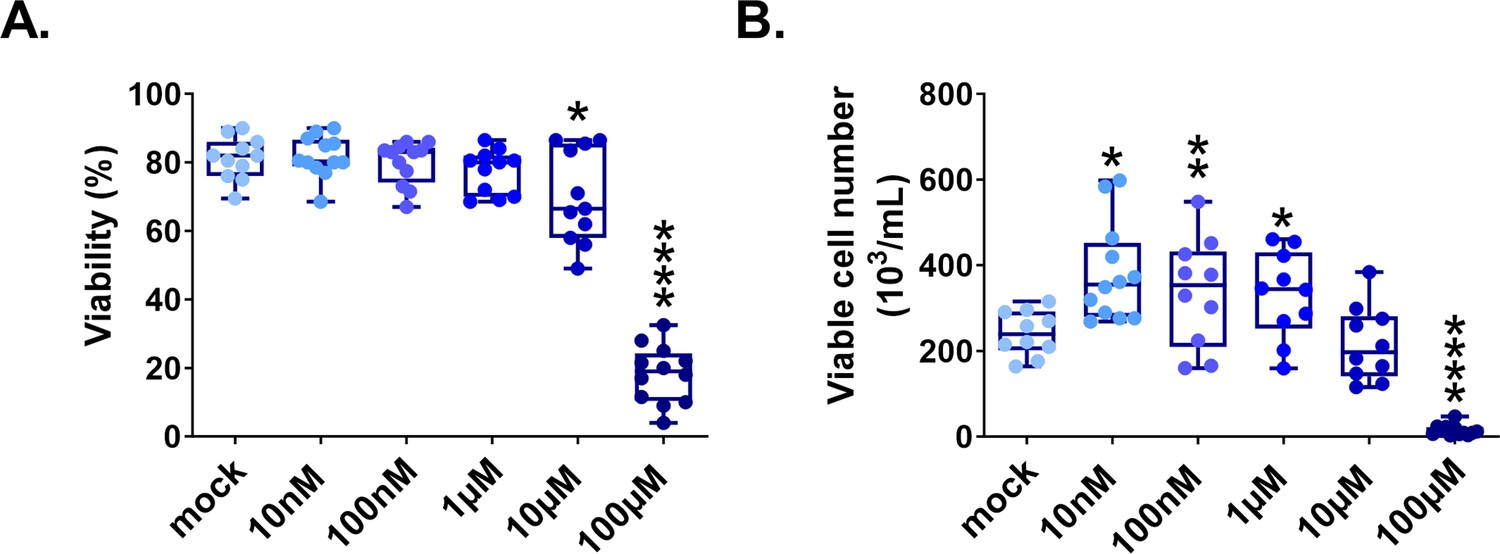
Δ9-THC exposure in male ESCs also provokes cell proliferation.
(A) Whisker boxplot indicating the median cellular viability of male ESCs (the R8 cell line, see Materials and methods section) exposed to the different Δ9-THC doses and associated errors. (B) Whisker boxplot indicating the median number of viable cells exposed to the different Δ9-THC doses indicated and associated errors. At least three independent biological repeats with three technical replicates (N=3, n=3). Statistical significance: *(p<0.05), **(p<0.01), ****(p<0.0001).
Figure 1—figure supplement 4
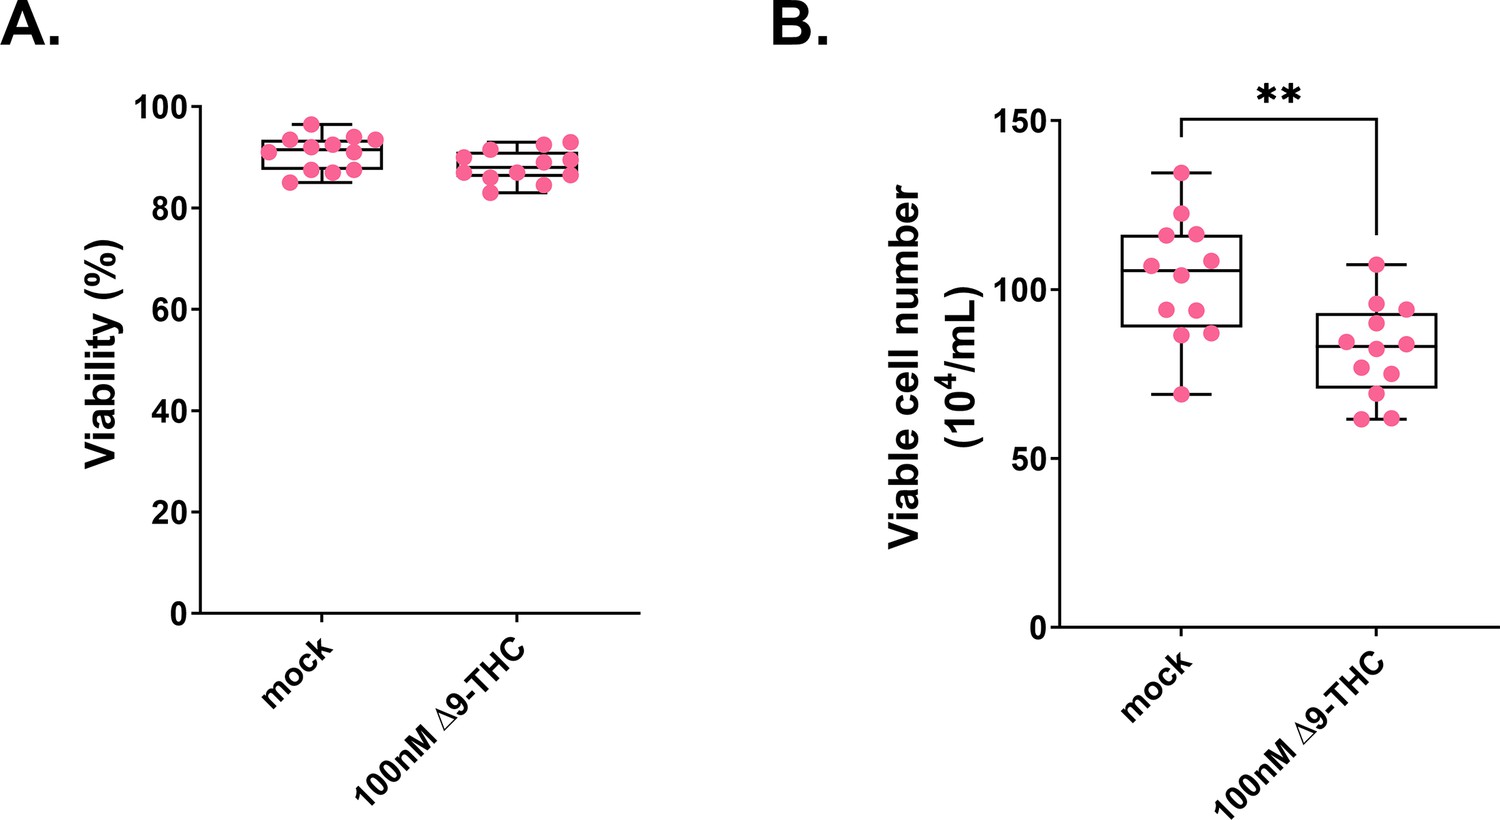
hESCs cell number decreases upon Δ9-THC exposure.
(A) Whisker boxplot indicating the median cellular viability of human embryonic stem cells continuously exposed to 100 nM Δ9-THC doses over 6 days and associated errors. (B) Whisker boxplot indicating the median number of viable cells exposed to 100 nM of Δ9-THC doses indicated and associated errors. For (A and B), six technical repeats of two biological repeats (n=12) were plotted. Statistical significance: **(p<0.01).
Figure 2
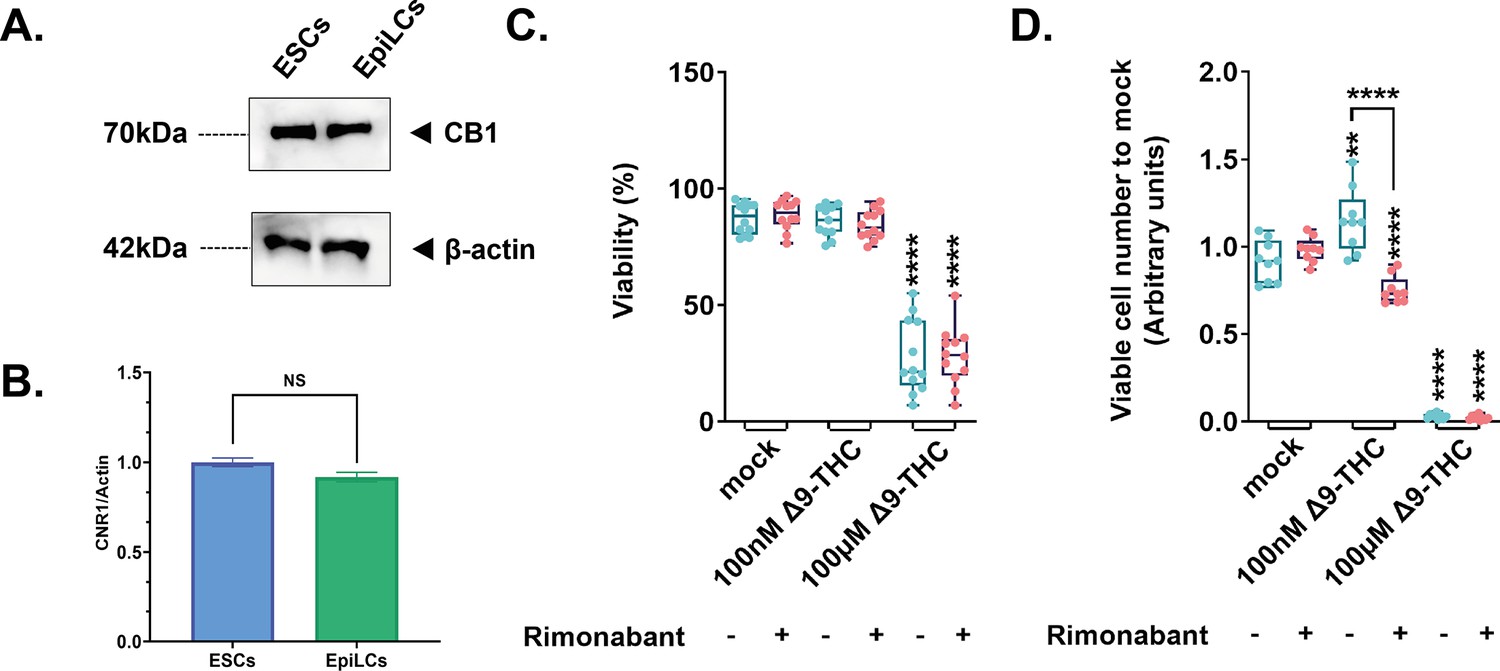
Implication of the CB1 receptor in the proliferative phenotype.
(A) Western blot analysis of transmembrane protein extracts of ESCs or EpiLCs. Antibodies raised against CB1 or β-actin serving as a loading control were used for immunoblotting. (B) Quantification of the gel presented in (A) was done using Image Studio (version 5.2). (C) Whisker boxplot indicating the median cellular viability of stem cells exposed to the different Δ9-THC and rimonabant doses indicated and their associated errors. (D) The median numbers of viable cells exposed to the different Δ9-THC and rimonabant doses indicated were normalized to their own control (+/-rimonabant). Median and associated errors were plotted in whisker boxplots. At least three independent biological repeats with three technical replicates (N=3, n=3). Statistical significance: **(p<0.01), ****(p<0.0001).
-
Figure 2—source data 1
Western blot data for CB1 and β-actin Raw blots from Figure 2A are presented.
- https://cdn.elifesciences.org/articles/88795/elife-88795-fig2-data1-v1.pdf
Figure 3 with 2 supplements
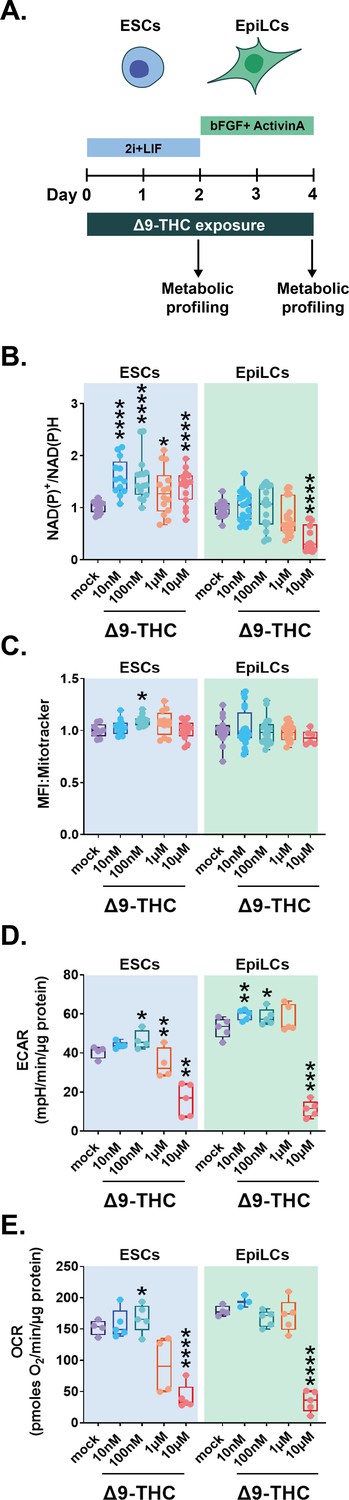
Δ9-THC exposure provokes an increase in glycolytic rates in ESCs and EpiLCs.
(A) Diagram illustrating Δ9-THC exposure scheme and experimental strategy. (B) The NAD(P)+/NADPH ratio of stem cells exposed to the different Δ9-THC doses was normalized to the one measured in the mock-treated condition. Median and associated errors were plotted in whisker boxplots. (C) Mean fluorescence intensity (MFI) associated with the Mitotracker CMXRos stain was normalized to the one measured in the mock-treated condition. Median and associated errors were plotted in whisker boxplots. (D) Median and associated error of the maximal extracellular acidification rate (ECAR) measured in cells exposed to the different Δ9-THC doses and normalized to the protein content was plotted in whisker boxplots. (E) Median and associated error of the maximal oxygen consumption rate (OCR) measured in cells exposed to the different Δ9-THC doses and normalized to the protein content was plotted in whisker boxplots. For (B and C), 5 technical repeats of 3 biological repeats (n=15) were plotted. One representative experiment out of three independent experiments was used to plot results in (D and E). Statistical significance: *(p<0.05), **(p<0.01), ***(p<0.001), ****(p<0.0001).
Figure 3—figure supplement 1
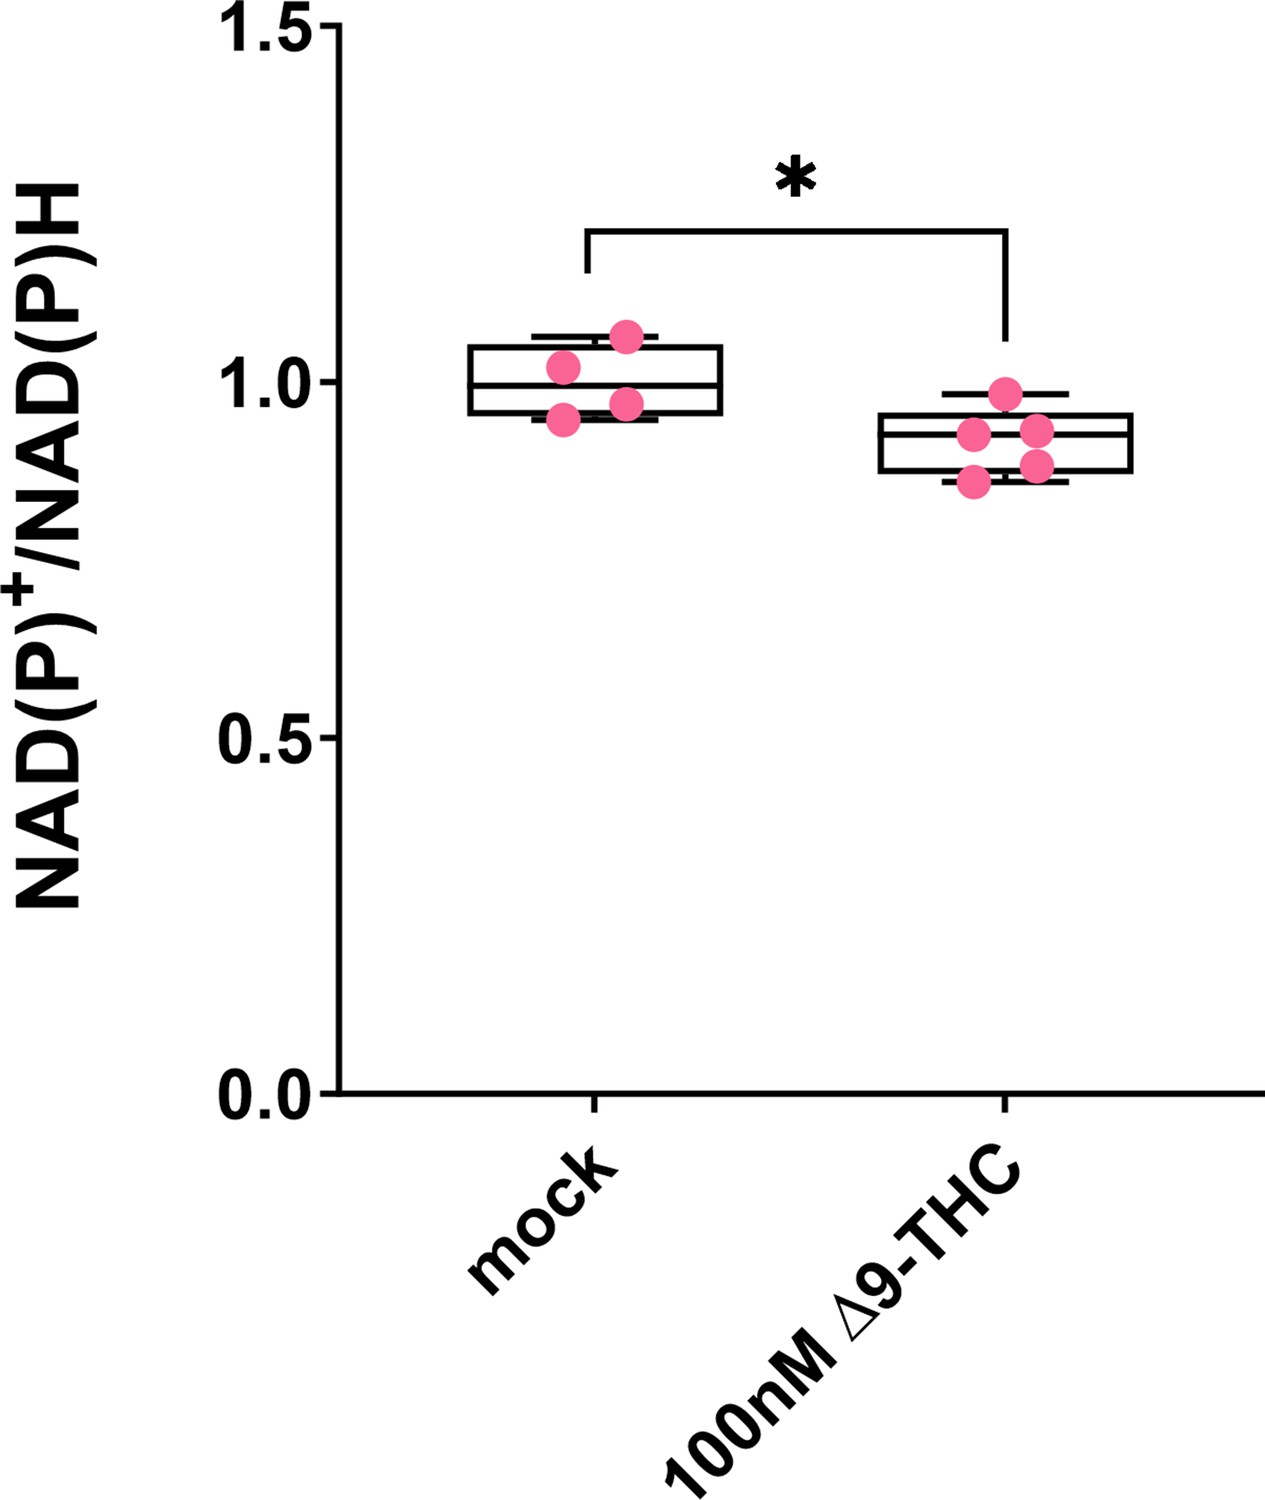
hESCS metabolism is slightly but significantly impacted by Δ9-THC exposure.
The NAD(P)+/NADPH ratio of hESCs exposed to 100 nM of Δ9-THC was normalized to the one measured in the mock-treated condition. Median and associated errors were plotted in whisker boxplots. Five exposure experimental replicates were plotted. Statistical significance: *(p<0.05).
Figure 3—figure supplement 2

Extracellular acidification rates and oxygen consumption rates in ESCs and EpiLCs upon Δ9-THC exposure.
(A and B) Traces were plotted for the extracellular acidification rate (ECAR) measurements in ESCs and EpiLCs, respectively, exposed to the different Δ9-THC doses indicated and normalized to the protein content. The oligomycin injection time is indicated by an arrow and allows to differentiate basal glycolytic rate from maximal glycolytic rate (when mitochondria are inhibited). The datapoints used in the main figure correspond to the first timepoint in the maximal glycolytic capacity section. (C and D) Traces were plotted for the oxygen consumption rate (OCR) measurements in ESCs and EpiLCs, respectively, exposed to the different Δ9-THC doses indicated and normalized to the protein content. The oligomycin, FCCP and AntimycinA/Rotenone injection times are indicated by arrows and allow to differentiate basal respiration from ATP-coupled respiration and maximal respiratory capacity. The datapoints used in the main figure correspond to the second timepoint in the maximal respiratory capacity section. FCCP: Carbonyl cyanide-p-trifluoromethoxyphenylhydrazone. Groups and repeats are as described in Figure 3. Statistical significance: *(p<0.05), **(p<0.01), ****(p<0.0001).
Figure 4 with 2 supplements
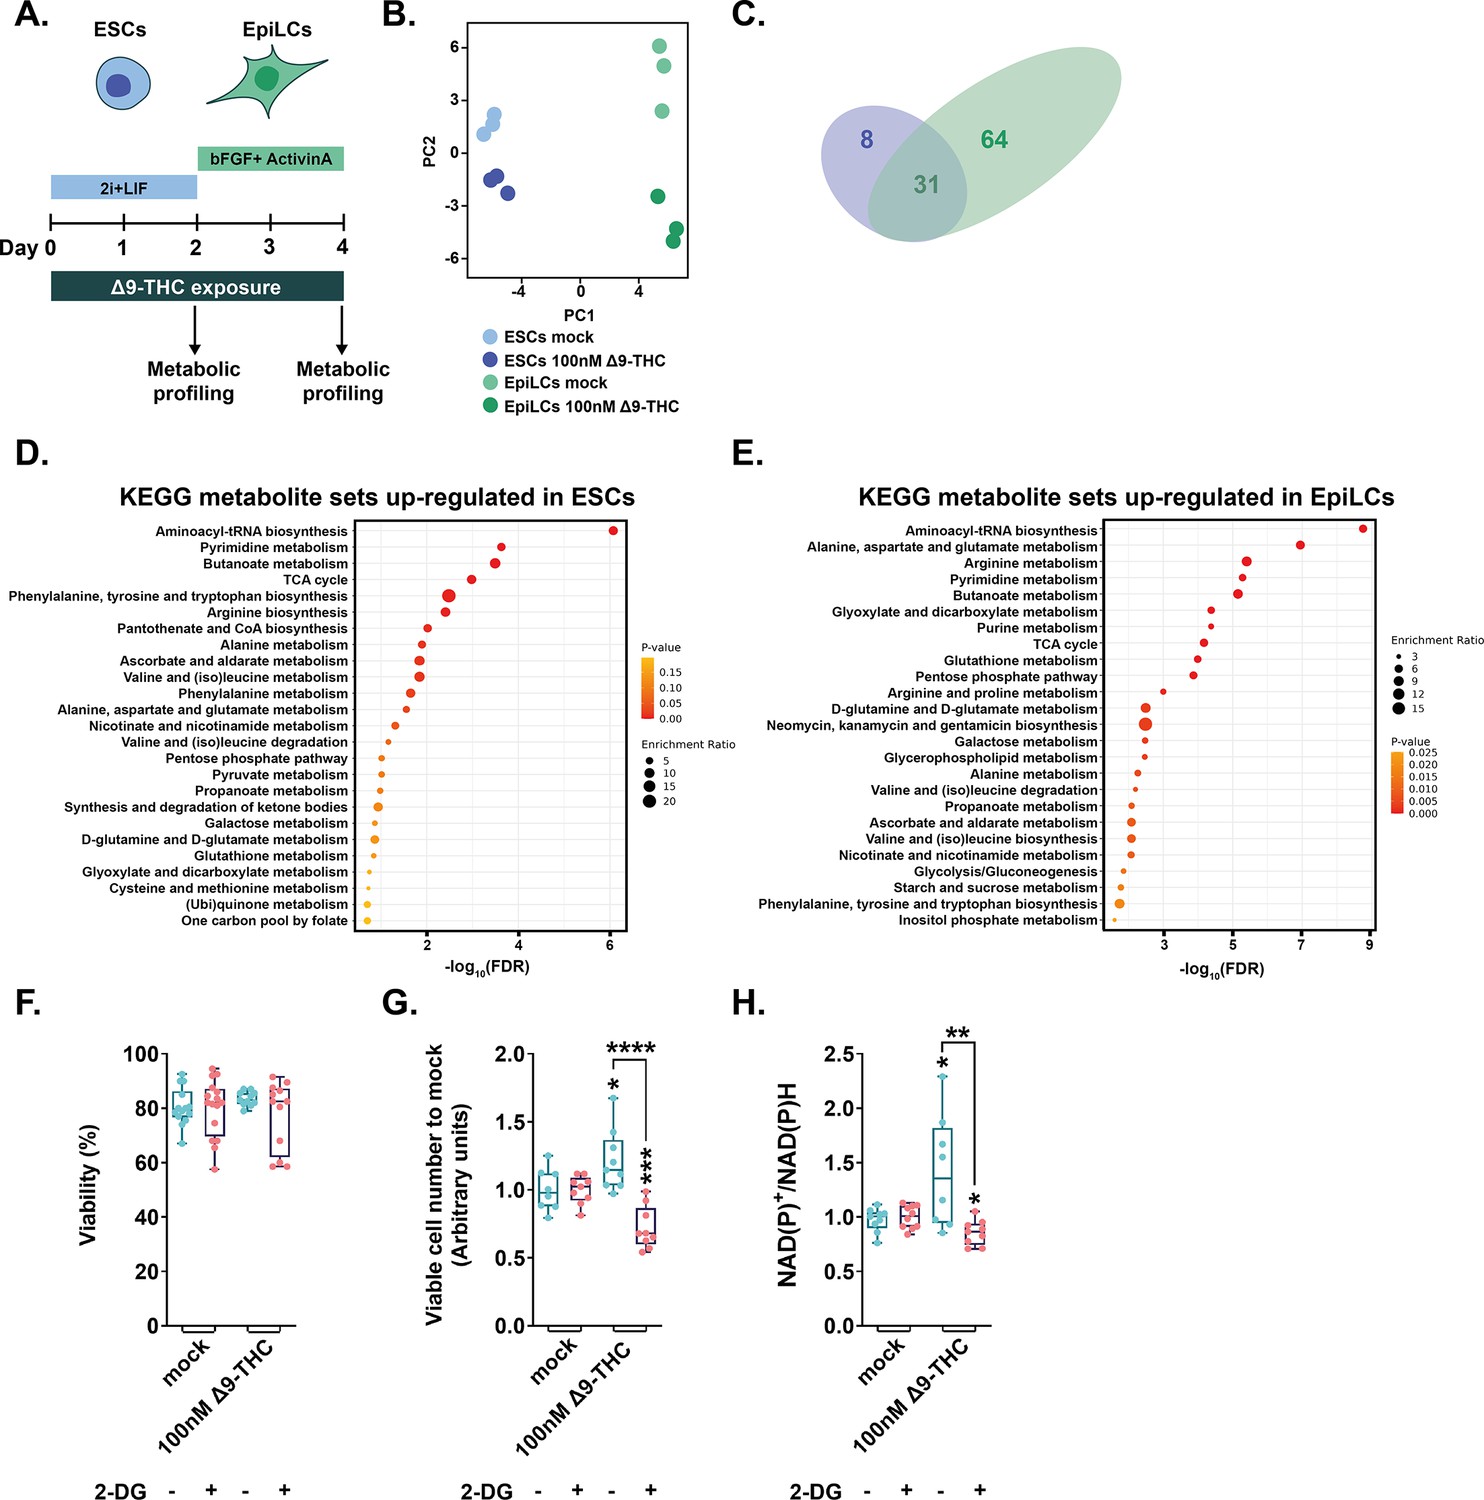
Δ9-THC-induced glycolysis sustain anabolism and ESCs proliferation (A) Diagram illustrating Δ9-THC exposure scheme and experimental strategy.
(B) PCA of the metabolomics profiling of either ESCs or EpiLCs mock-exposed or exposed to 100 nM Δ9-THC. (C) Venn diagram showing the overlap in upregulated metabolites following Δ9-THC exposure in ESCs and EpiLCs. (D and E) KEGG metabolite sets enrichment analysis for upregulated metabolites in ESCs and EpiLCs, respectively, performed by MetaboAnalyst (Pang et al., 2022). KEGG, Kyoto Encyclopedia of Genes and Genomes. (F) Whisker boxplot indicating the median cellular viability of stem cells exposed to 100 nM of Δ9-THC and 10 mM of 2-DG, as indicated, and their associated errors. (G) The median numbers of viable cells exposed to 100 nM of Δ9-THC and 10 mM of 2-DG, as indicated, were normalized to their own control (+/-2 DG). Median and associated errors were plotted in whisker boxplots. (H) The NAD(P)+/NADPH ratio of stem cells exposed to 100 nM of Δ9-THC and 10 mM of 2-DG, as indicated, was normalized to the one measured in the mock-treated condition (+/-2 DG). Median and associated errors were plotted in whisker boxplots. At least three independent biological repeats with three technical replicates (N=3, n=3). Statistical significance: *(p<0.05), **(p<0.01), ***(p<0.001), ****(p<0.0001).
Figure 4—figure supplement 1
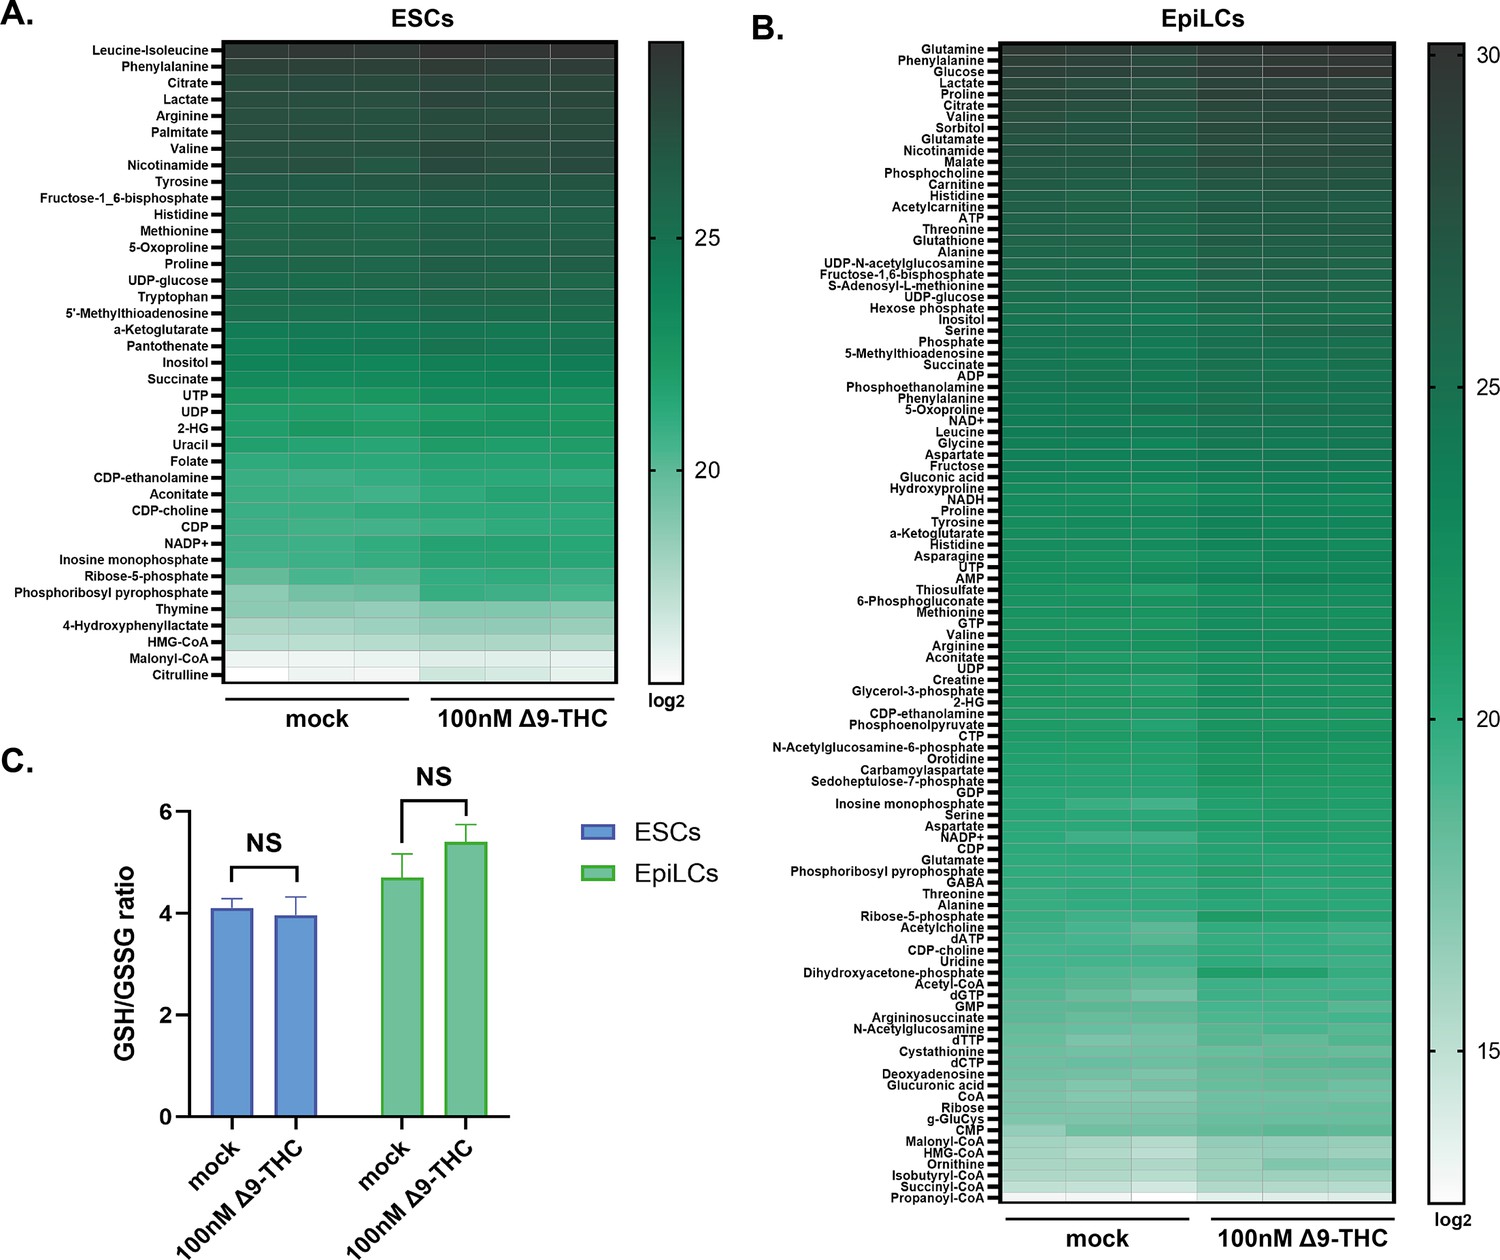
Metabolite profiling in ESCs and EpiLCs upon Δ9-THC exposure.
(A and B) Heatmaps showing the log2 of the amount of each metabolite upregulated in ESCs and EpiLCs upon exposure to 100 nM of Δ9-THC. The relative amounts of metabolites were normalized to the mean value across all samples for one same condition and to the number of viable cells harvested in parallel on a control plate. (C) Histograms showing the ratio of reduced to oxidized glutathione (GSH/GSSG) based on the amounts measured in the metabolomics profiling. N=3, n=3.
Figure 4—figure supplement 2

Extracellular acidification rates and oxygen consumption rates in ESCs upon Δ9-THC and 2-DG exposure.
(A) Traces were plotted for the extracellular acidification rate (ECAR) measurements in ESCs exposed to 100 nM of Δ9-THC and 10 mM of 2-DG, as indicated, and normalized to the protein content. The oligomycin injection time is indicated by an arrow and allows to differentiate basal glycolytic rate from maximal glycolytic rate (when mitochondria are inhibited). (B) Traces were plotted for the oxygen consumption rate (OCR) measurements in ESCs exposed to 100 nM of Δ9-THC and 10 mM of 2-DG, as indicated, and normalized to the protein content. The oligomycin, FCCP and AntimycinA/Rotenone injection times are indicated by arrows and allow to differentiate basal respiration from ATP-coupled respiration and maximal respiratory capacity. FCCP: Carbonyl cyanide-p-trifluoromethoxyphenylhydrazone. Statistical significance: *(p<0.05), **(p<0.01). N=3, n=3.
Figure 5 with 2 supplements
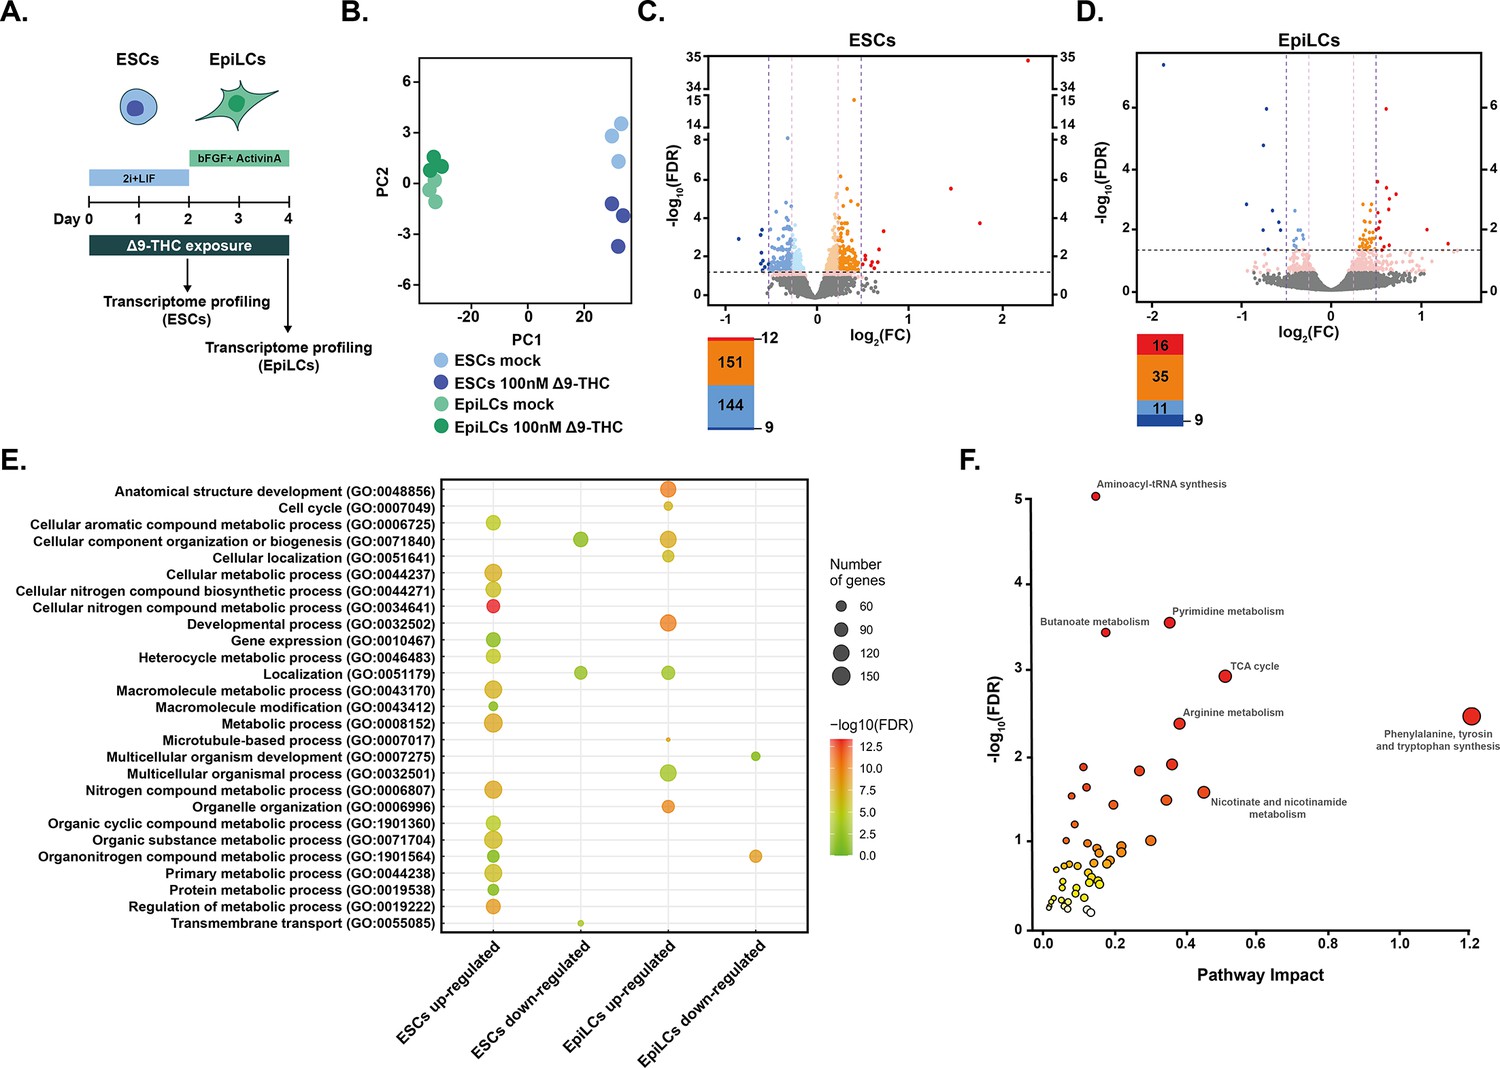
Metabolic changes following Δ9-THC exposure in ESCs are transcriptionally encoded.
(A) Diagram illustrating Δ9-THC exposure scheme and experimental strategy. (B) PCA of the transcriptomics profiling of either ESCs or EpiLCs mock-exposed or exposed to 100 nM Δ9-THC. (C and D) Volcano plot in ESCs and EpiLCs, respectively, showing significance [expressed in log10(adjusted p-value or false-discovery rate, FDR)] versus fold-change [expressed in log2(fold-change, FC)]. Thresholds for significance (adjusted p-value ≤0.05) and gene expression fold-change [|(log2(FC))|>0.25 or |log2(FC)|>0.5] are shown as dashed lines. Color code is as follows: log2(FC) >0.5 in red, log2(FC) >0.25 in orange, log2(FC) >0 in light orange, log2(FC) <0 in light blue, log2(FC) >−0.25 in blue, log2(FC) >0.5 in dark blue and p-value <0.01 in pink. (E) Gene ontology (GO) terms associated with up- and downregulated DEGs [|(log2(FC)|>0.25 and p<0.01)] in ESCs and EpiLCs as determined by g:Profiler (Raudvere et al., 2019). (F) Joint pathway analysis performed by the multi-omics integration tool of MetaboAnalyst (Pang et al., 2022). The p-values were weighted based on the proportions of genes and metabolites at the individual pathway level.
Figure 5—figure supplement 1
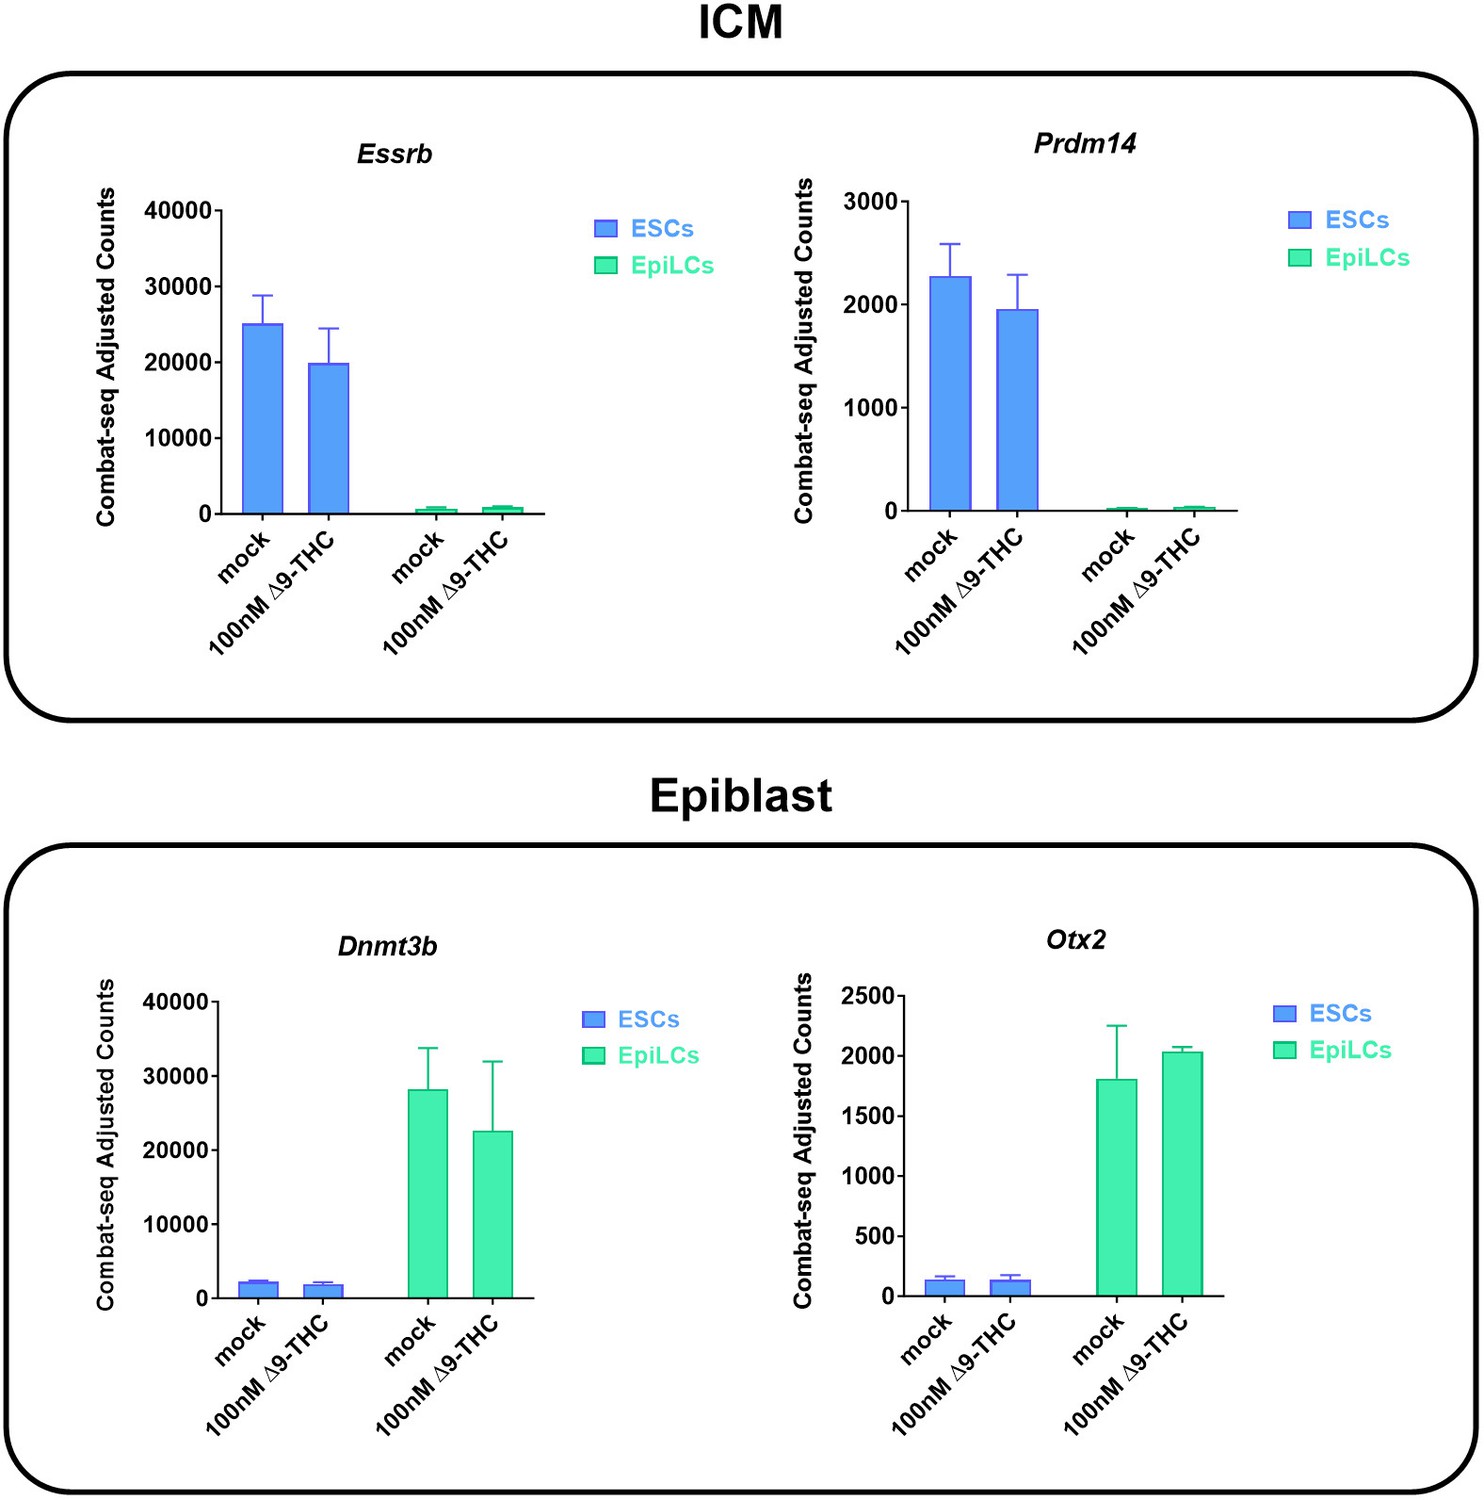
Δ9-THC exposure does not alter markers of pluripotency.
Gene expression profiles of markers for the inner cell mass (ICM) and epiblast. Histograms show the median and associated errors of normalized gene counts in each condition, as indicated.
Figure 5—figure supplement 2
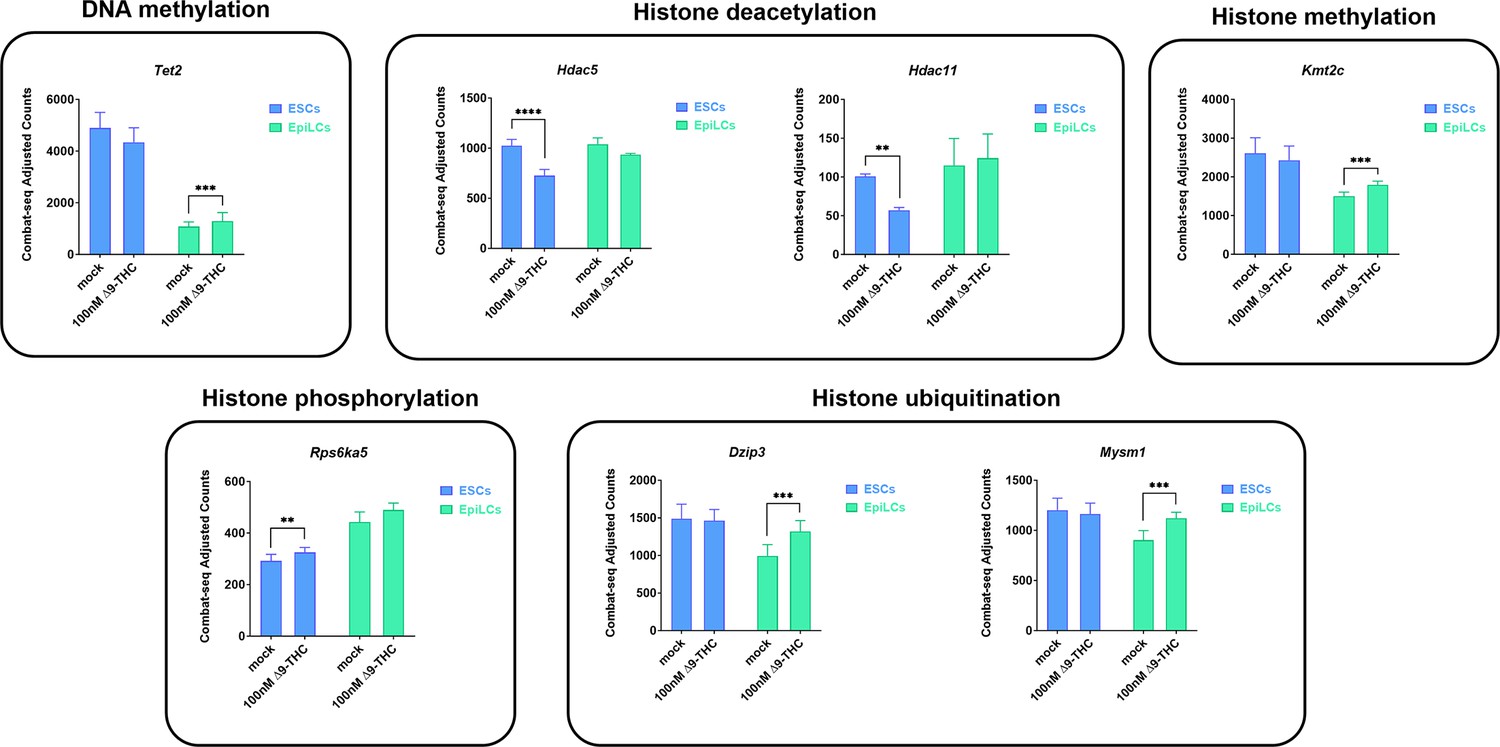
Δ9-THC exposure alters the expression of some epigenetic modifiers.
Histograms show the median and associated errors of normalized gene counts in each condition, as indicated. Only genes with |(log2(FC)|>0.25) and p-value <0.01 from Supplementary file 1 were plotted. Statistical significance: **(p<0.01), ***(p<0.001), ****(p<0.0001).
Figure 6 with 3 supplements
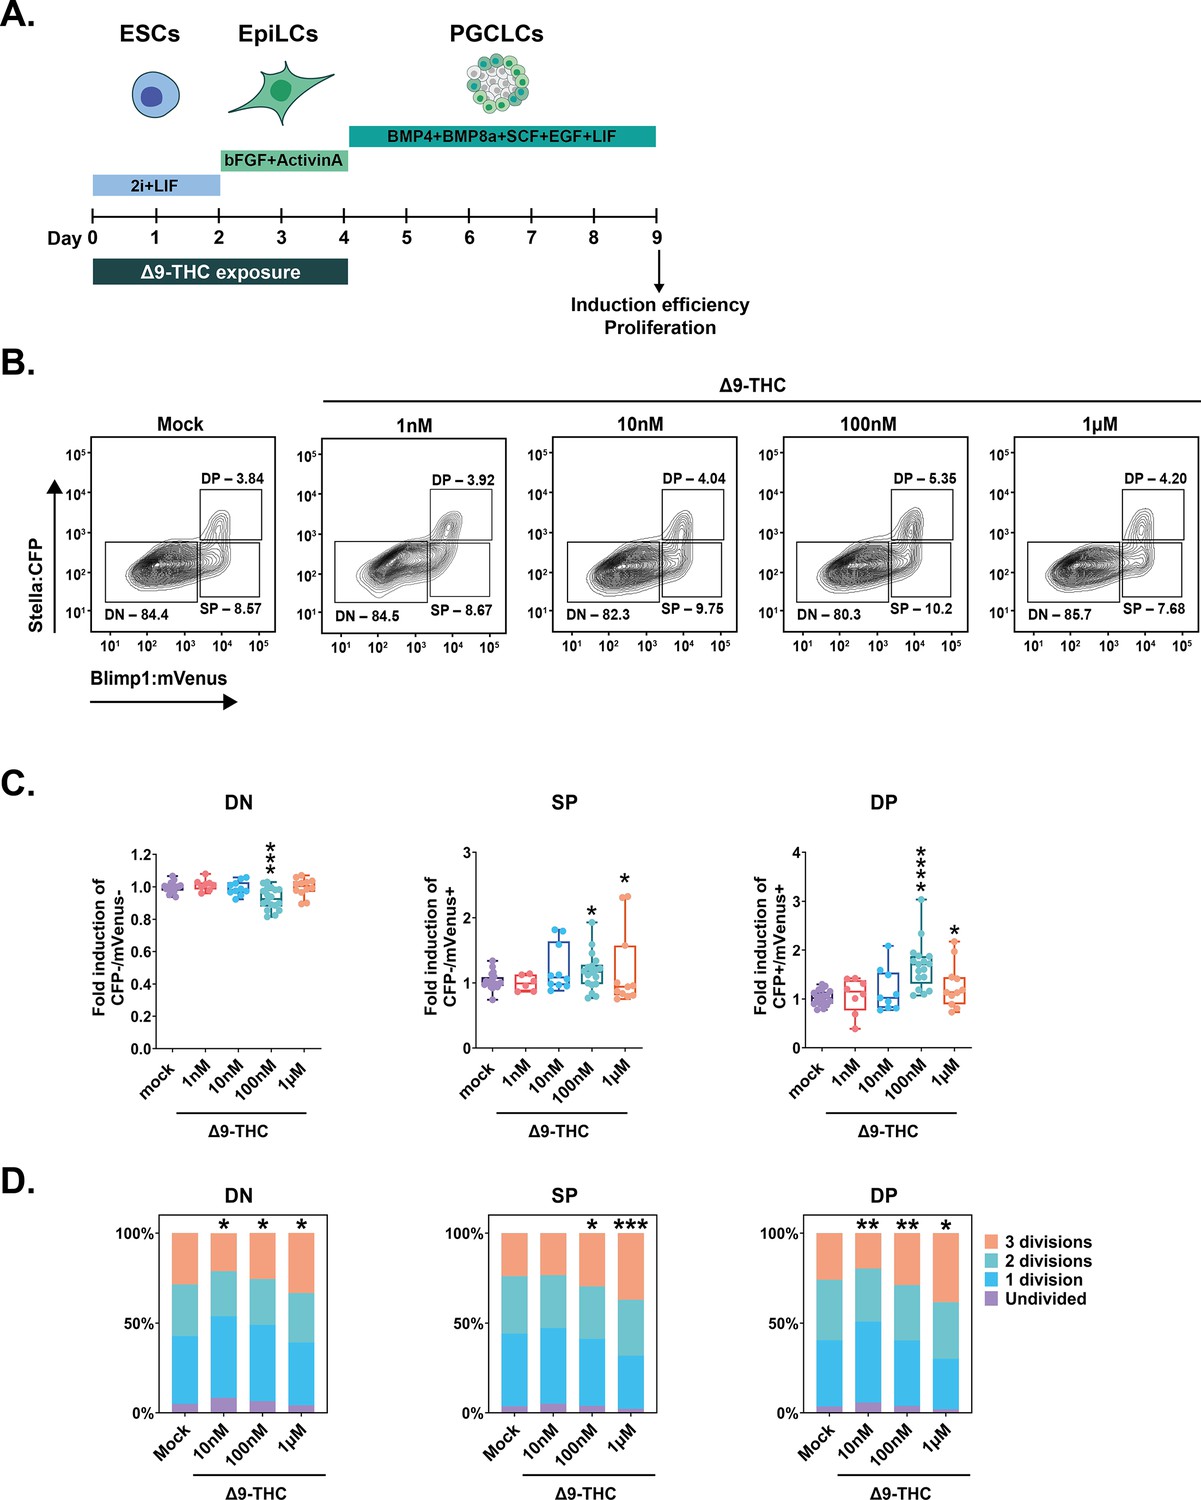
PGCLCs deriving from ESCs and EpiLCs exposed to 100 nM of Δ9-THC proliferate.
(A) Diagram illustrating Δ9-THC exposure scheme and experimental strategy. (B) Representative flow contour plots showing distribution of live-gated events, gating strategy for Stella:CFP versus Blimp1:mVenus and percentages of cells in each subpopulations for ESCs and EpiLCs exposed to the different doses of Δ9-THC indicated. DN: double negative, SP: single positive, DP: double positive subpopulations. (C) The percentage of events in the gates associated to each subpopulation was normalized to the one measured in the mock-treated condition. Median and associated errors were plotted in whisker boxplots independently for each subpopulation. (D) Histograms showing CellTrace Yellow staining profile of cells arising from ESCs and EpiLCs exposed to the different doses of Δ9-THC indicated. The Y-axis represents the average percentage of cells in each category of subpopulations undividing (purple), undergoing 1 division (blue), 2 divisions (green) or 3 divisions (orange). One representative experiment out of three is represented. Statistical significance: *(p<0.05), **(p<0.01), ***(p<0.001), ****(p<0.0001).
Figure 6—figure supplement 1
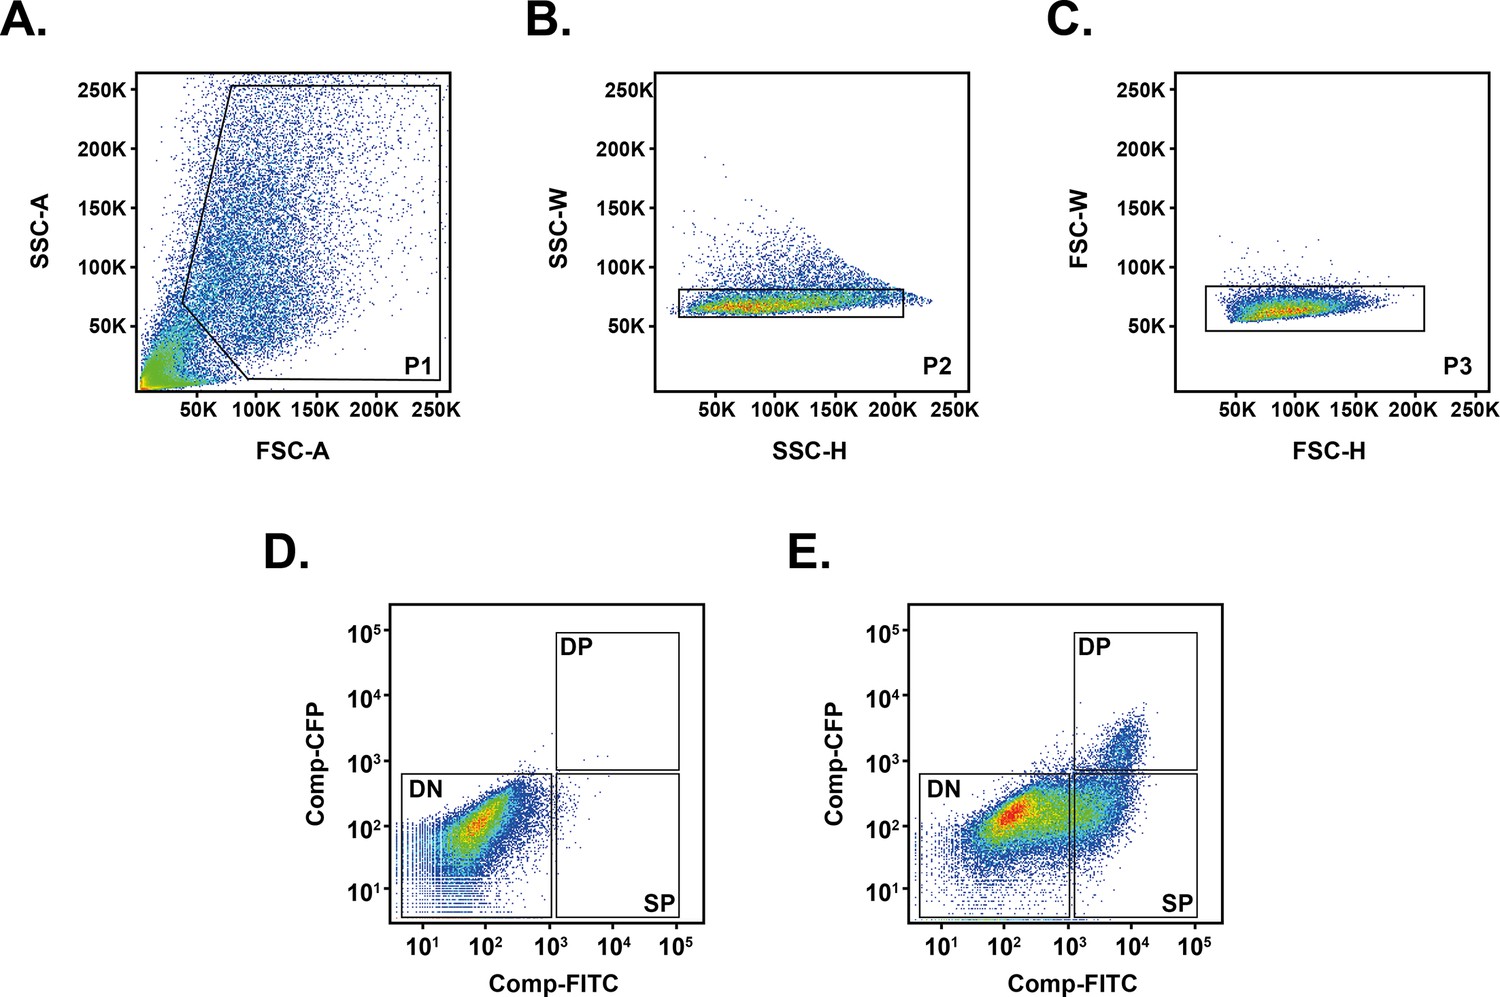
PGCLCs gating and sorting strategy.
(A) Representative flow contour plots showing distribution of events and gating based on embryoid bodies dissociation. (B and C) Representative flow contour plots to isolate singlets based on width to height ratios on the side scatter and front scatter, respectively. (D) Gating strategy for Stella:CFP versus Blimp1:mVenus on the negative control, corresponding to embryoid bodies obtained in an induction medium without cytokines and BMPs (GK15 only). (E) Gating strategy for Stella:CFP versus Blimp1:mVenus on mock-treated cells, corresponding to embryoid bodies obtained in an induction medium complemented with cytokines and BMPs. DN: double negative, SP: single positive, DP: double positive subpopulations.
Figure 6—figure supplement 2
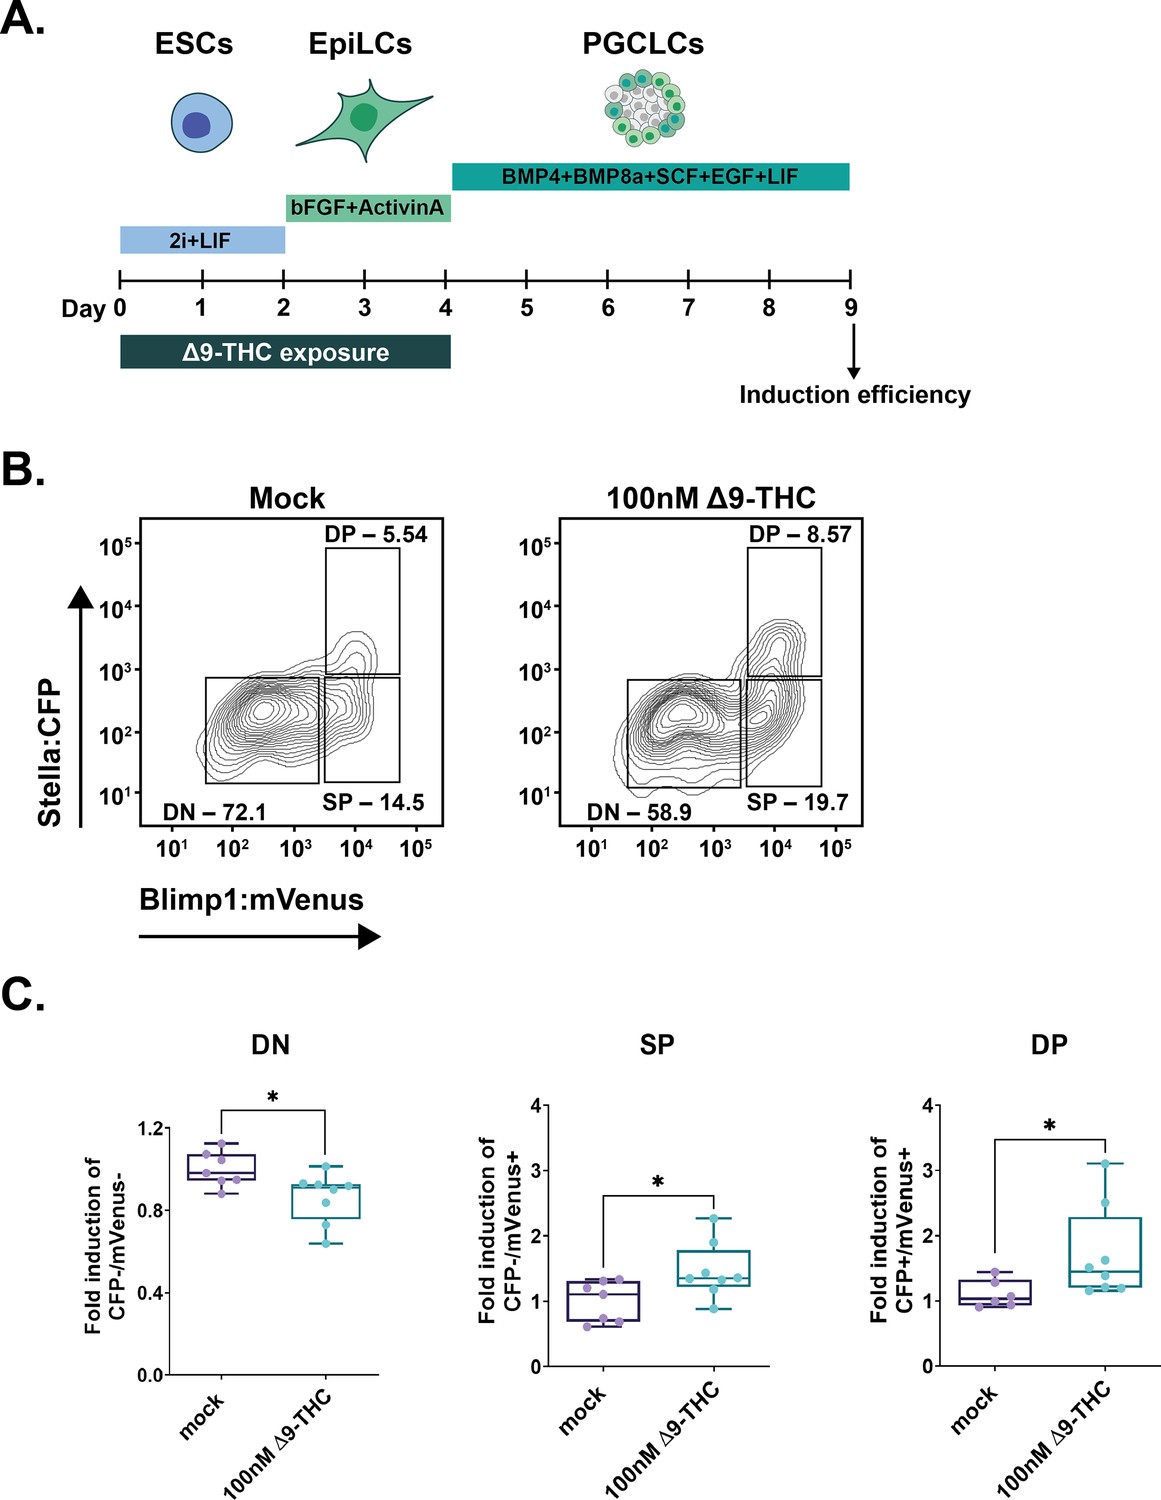
Male PGCLCs deriving from ESCs and EpiLCs exposed to 100 nM of Δ9-THC proliferate.
(A) Diagram illustrating Δ9-THC exposure scheme and experimental strategy. (B) Representative flow contour plots showing distribution of live-gated events, gating strategy for Stella:CFP versus Blimp1:mVenus and percentages of cells in each subpopulations for ESCs and EpiLCs exposed to 100 nM of Δ9-THC. DN: double negative, SP: single positive, DP: double positive subpopulations. (C) The percentage of events in the gates associated to each subpopulation was normalized to the one measured in the mock-treated condition. Median and associated errors were plotted in whisker boxplots independently for each subpopulation. At least three independent biological repeats with three technical replicates (N=3, n=3). Statistical significance: *(p<0.05).
Figure 6—figure supplement 3

No residual Δ9-THC is detected in day 5 embryoid bodies.
Intracellular levels of ∆9-THC were quantified by mass spectrometry in EpiLCs on the day of aggregate formation and in day 5 embryoid bodies (referred as to ‘EpiLCs’ and ‘PGCLCs’). Histograms show the median and associated errors of two independent quantifications. Statistical significance: ****(p<0.0001), one-way ANOVA with post-hoc Tukey HSD.
Figure 7
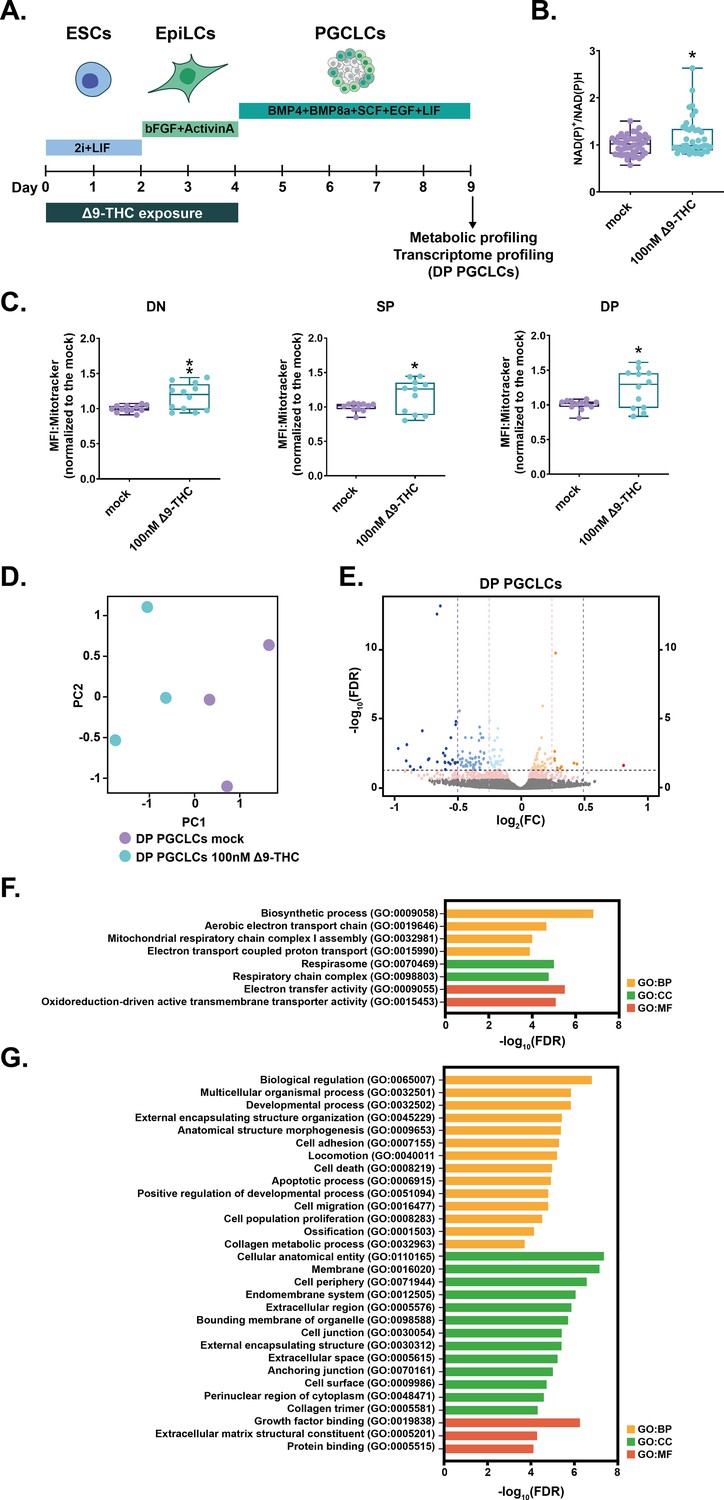
Δ9-THC exposure prior to specification increases mitochondrial respiration in PGCLCs.
(A) Diagram illustrating Δ9-THC exposure scheme and experimental strategy. (B) The NAD(P)+/NADPH ratio of embryoid bodies arising from ESCs and EpiLCs exposed to 100 nM of Δ9-THC was normalized to the one measured in the mock-treated condition. Median and associated errors were plotted in whisker boxplot. (C) Mean fluorescence intensity (MFI) associated with the Mitotracker CMXRos stain in each subpopulation was normalized to the one measured in the mock-treated condition. Median and associated errors were plotted in whisker boxplots. (D) PCA of the transcriptomics profiling of DP PGCLCs deriving from ESCs and EpiLCs either mock-exposed or exposed to 100 nM Δ9-THC. (E) Volcano plot in DP PGCLCs showing significance [expressed in log10(adjusted p-value or false-discovery rate, FDR)] versus fold-change [expressed in log2(fold-change, FC)]. Thresholds for significance and different enrichment ratios [|(log2(FC)|>0.25 or |log2(FC)|>0.5)] are shown as dashed lines. Color code is as follows: log2(FC) >0.5 in red, log2(FC) >0.25 in orange, log2(FC) >0 in light orange, log2(FC) <0 in light blue, log2(FC) >−0.25 in blue, log2(FC) >0.5 in dark blue and p-value <0.01 in pink. (F and G) Gene ontology (GO) terms associated with up- and downregulated DEGs [|(log2(FC)|>0.25 and p<0.01)], respectively, as determined by g:Profiler (Raudvere et al., 2019). Statistical significance: *(p<0.05), **(p<0.01).
Figure 8
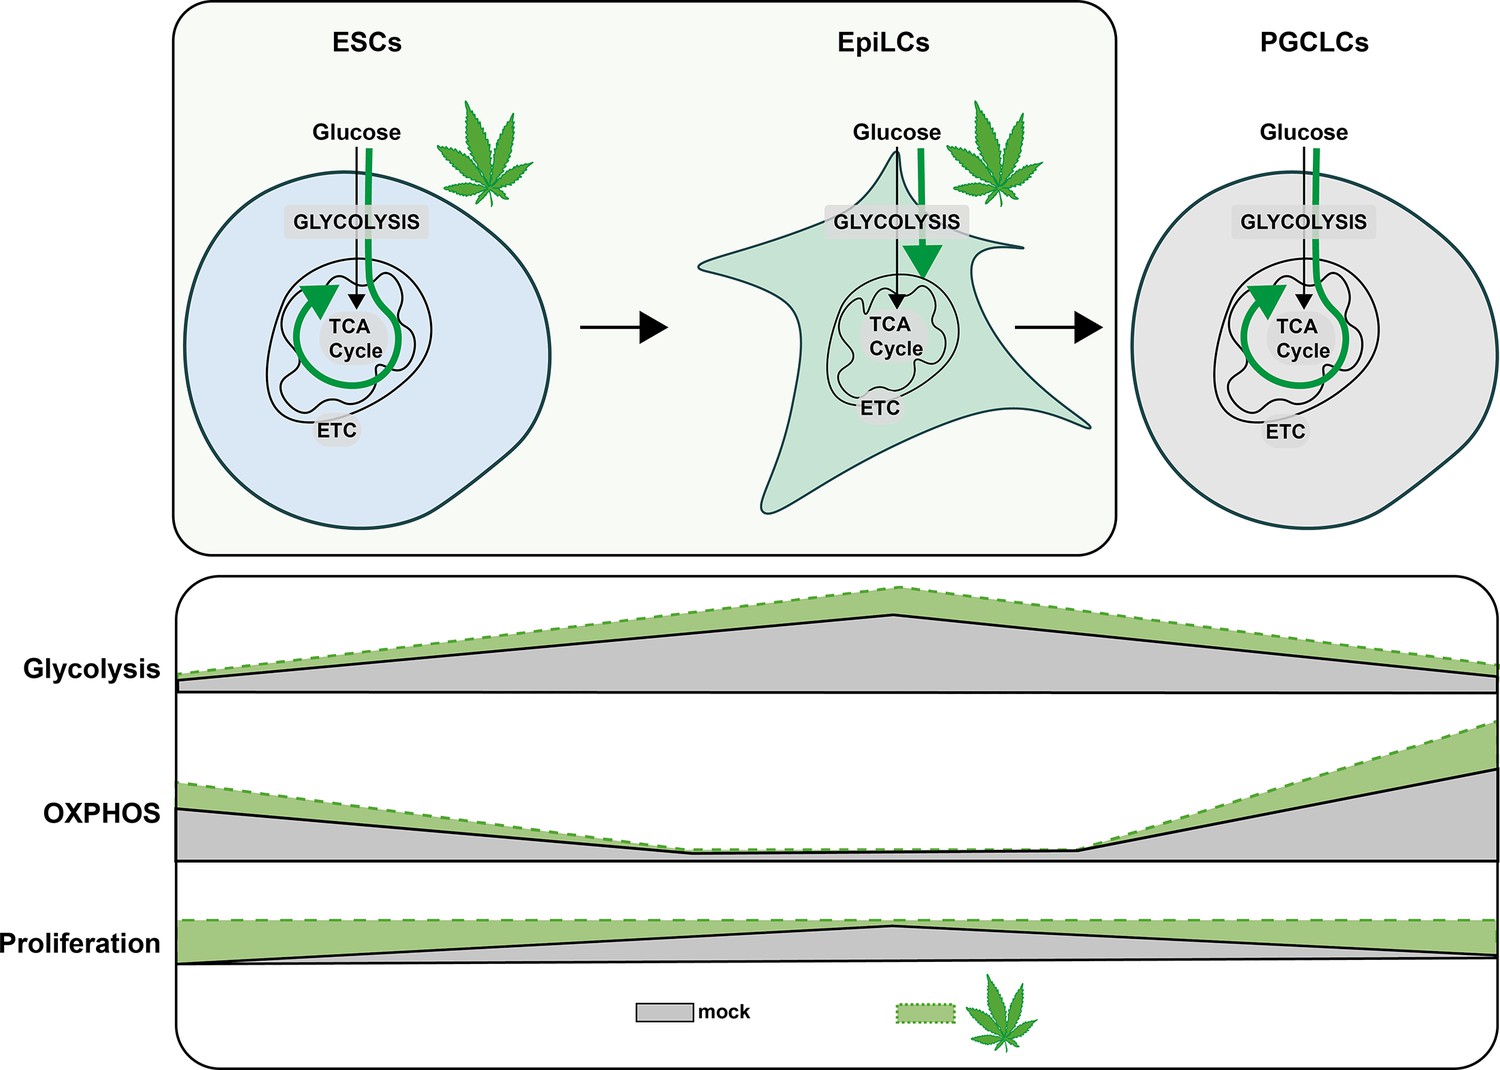
Metabolic impact of Δ9-THC exposure in pluripotent stem cells and primordial germ cells-like cells.
Diagram illustrating the impact of Δ9-THC exposure on stem cells metabolism.
Author response image 1

Cannabinoid receptors and non-cannabinoid receptors protein expression in mouse embryonic stem cells.
Author response image 2

Uncropped gel corresponding to Fig.
2A where an anti-CB1 antibody was used.
Author response image 3
Unnormalized data corresponding to the Figure 2D.
Additional files
-
MDAR checklist
- https://cdn.elifesciences.org/articles/88795/elife-88795-mdarchecklist1-v1.docx
-
Supplementary file 1
Expression of epigenetic enzymes in Δ9-THC or control exposed ESCs and EpiLCs as measured by RNA-seq.
- https://cdn.elifesciences.org/articles/88795/elife-88795-supp1-v1.xlsx
Download links
A two-part list of links to download the article, or parts of the article, in various formats.
Downloads (link to download the article as PDF)
Open citations (links to open the citations from this article in various online reference manager services)
Cite this article (links to download the citations from this article in formats compatible with various reference manager tools)
Metabolic memory of Δ9-tetrahydrocannabinol exposure in pluripotent stem cells and primordial germ cells-like cells
eLife 12:RP88795.
https://doi.org/10.7554/eLife.88795.3


