Distinct states of nucleolar stress induced by anticancer drugs
- Stowers Institute for Medical Research, United States
- Department of Biochemistry and Molecular Genetics, University of Alabama at Birmingham, United States
- Department of Biochemistry and Molecular Biology, University of Kansas Medical Center, United States
Figures
Figure 1
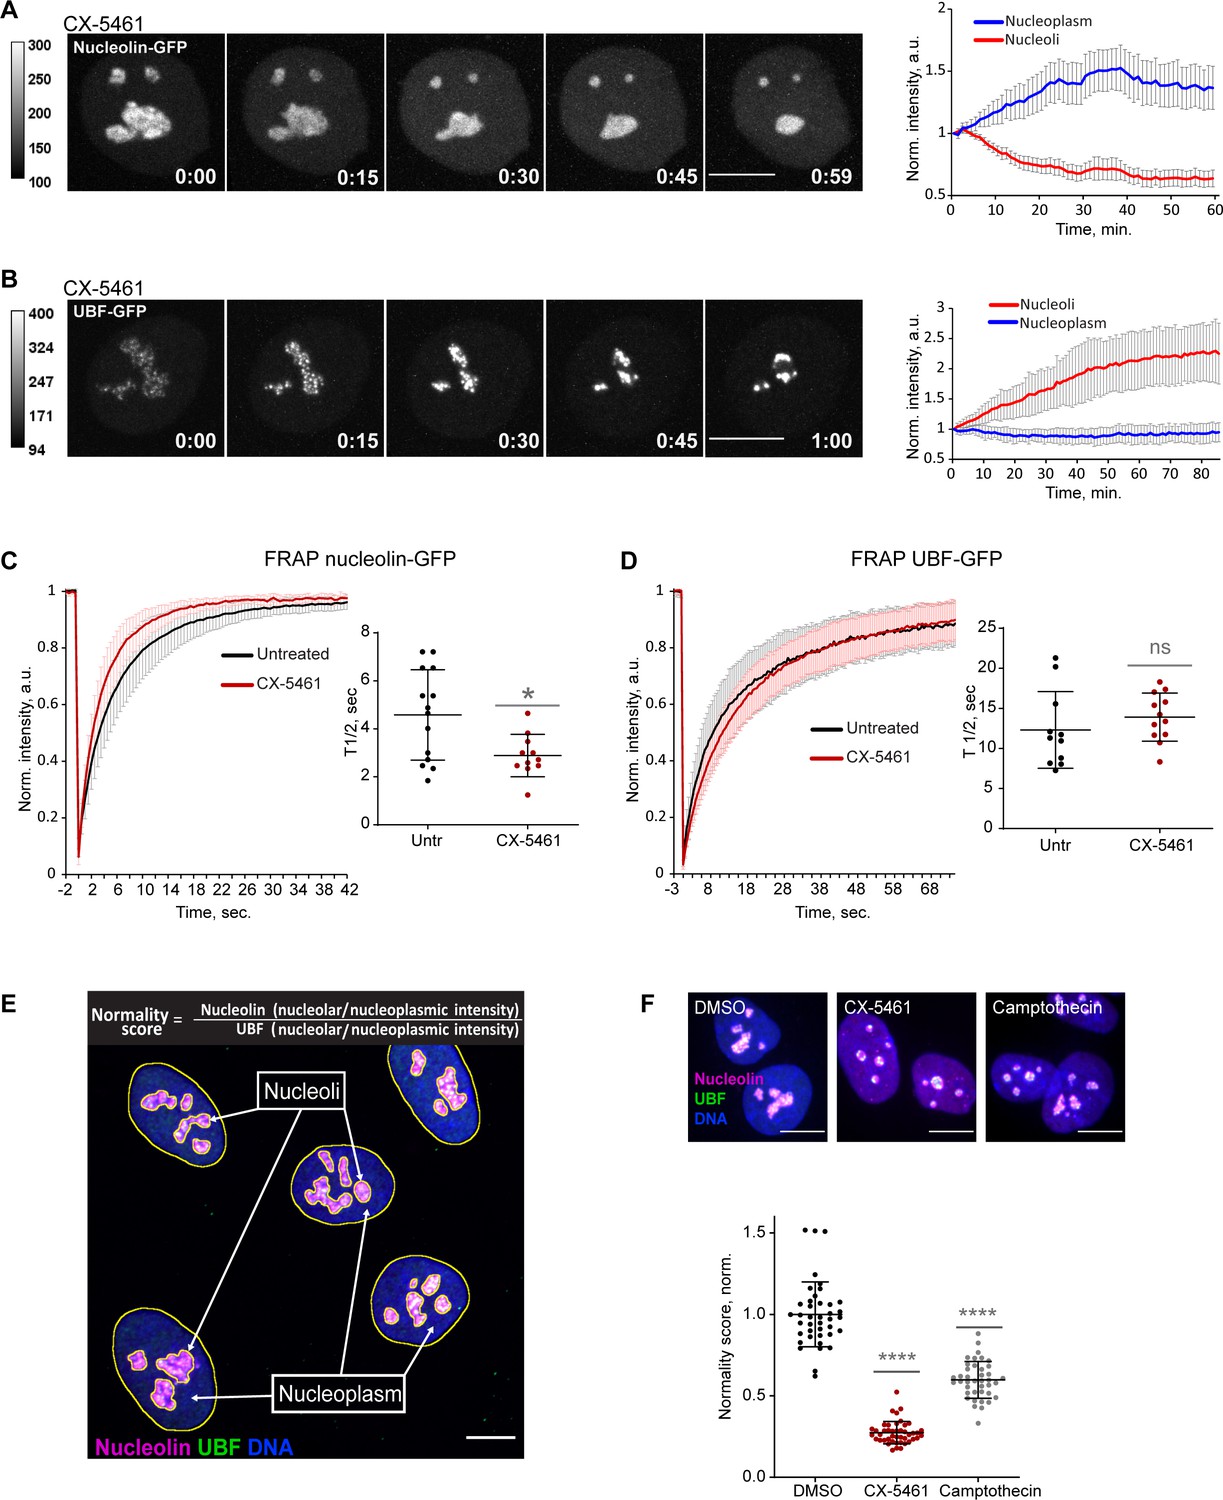
Nucleolar normality score as a parameter for measuring nucleolar stress.
(A) Time-lapse images of eGFP-nucleolin expressing cell treated with 2.5 µM Pol I inhibitor CX-5461 at time 0 are shown. Nucleoli shrink and round up forming small circular remnants. Fluorescence intensity, indicated by the heatscale, decreases in nucleolar remnants and increases in the nucleoplasm. The complete video sequence is shown in Video 1. Bar, 10 µm. The plot on the right shows the average intensity of eGFP-nucleolin in nucleoli and in the nucleoplasm normalized to the initial intensity at time 0. The plot is an average of 10 cells, bars denote standard deviation. (B) Time‐lapse images of eGFP‐UBF expressing cell treated with 2.5 μM CX‐5461 at time 0 are shown. UBF condenses on the periphery of nucleolar remnants forming stress caps of high fluorescence intensity. The complete video sequence is shown in Video 2. Bar, 10 μm. The plot on the right shows the average intensity of eGFP‐UBF in stress caps and in the nucleoplasm normalized to the initial intensity at time 0. The plot is an average of 13 cells, bars denote standard deviation. (C) Fluorescence recovery after photobleaching (FRAP) analysis of eGFP-nucleolin in untreated cells and cells treated with 2.5 µM CX-5461 is shown. The plot is an average of normalized fluorescence intensities of 14 and 10 cells. Bars denote standard deviation. The graph on the right shows corresponding individual T1/2 measurements. Asterisk indicates p<0.05 (t-test comparing the drug-treated group to untreated). (D) FRAP analysis of eGFP-UBF in untreated cells and cells treated with 2.5 µM CX-5461. The plot is an average of normalized fluorescence intensities of 11 and 12 cells. Bars denote standard deviation. The graph on the right shows corresponding individual T1/2 measurements. t-test did not detect a significant difference between the two treatments. (E) The immunofluorescence image illustrates the Nucleolar Normality score measurement. RPE1 cells were labeled with antibodies against nucleolin and UBF and counterstained with DAPI. Segmentation of nucleolar regions was performed on UBF, and whole nuclei were segmented on DAPI. Nucleoplasm regions are areas within the nuclei without nucleoli. The nucleoplasmic intensity was calculated by subtracting the integrated intensity of nucleoli from the integrated intensity of the whole nuclei. For both nucleolin and UBF, the integrated intensity of the nucleolar regions of each cell was divided by the integrated intensity of the nucleoplasm of that cell, giving the nucleolar/nucleoplasm ratio. Dividing the nucleolar/nucleoplasm ratio of the nucleolin by the nucleolar/nucleoplasm ratio of the UBF provides a nucleolar normality score for each cell. (F) Normality score measurements of individual cells treated with DMSO (vehicle), 2.5 µM CX-5461, or 5 µM topoisomerase inhibitor camptothecin, normalized to the average value of DMSO-treated cells. More than 40 individual cells were measured for each condition. Asterisks indicate p<0.0001 (unpaired t-test comparing drug-treated groups to DMSO).
-
Figure 1—source data 1
Source data for Figure 1A-F.
- https://cdn.elifesciences.org/articles/88799/elife-88799-fig1-data1-v1.zip
Figure 2 with 1 supplement
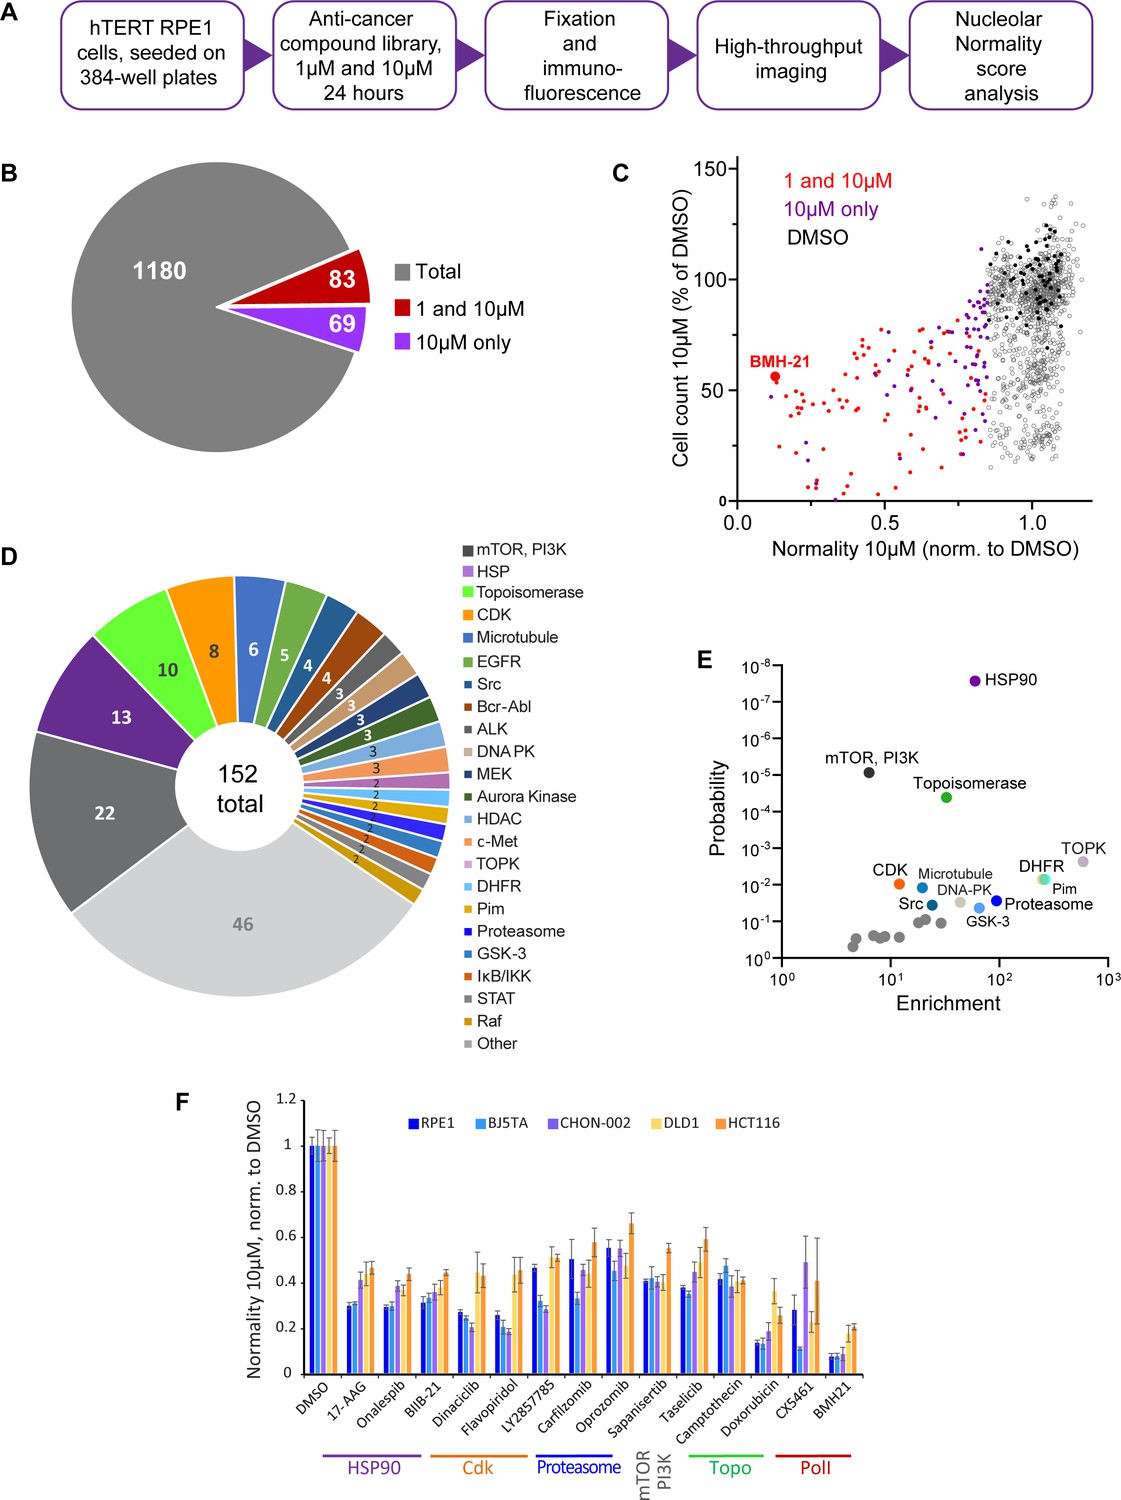
Anticancer drug screen for compounds that induce nucleolar stress.
(A) The diagram illustrates the workflow for the library screen for anticancer compounds that induce nucleolar stress. (B) From the total 1180 compounds, 83 were hits at both 1 and 10 µM, and 69 were hits at 10 µM only. The full list of hit compounds with normality scores is provided in Supplementary file 1. (C) Normality score results from cells treated with 10 µM drug are plotted versus cell count. Both parameters were normalized to the average of the DMSO control (black points). Red points denote hits at 1 and 10 µM, purple points 10 µM only. BMH21 is a Pol I inhibitor present in the library and serves as an internal control. (D) Combined 1 and 10 µM hits and 10 µM only hits grouped by the target. (E) Enrichment of hit drug targets relative to their presence in the library is plotted versus the probability of random occurrence (p-value). A low p-value indicates that the probability of a target being enriched at random is low. Gray points indicate targets whose enrichment was not significant, colored points with labels denote significantly enriched targets (p<0.05). (F) Validation of selected hits from different target classes in multiple cell lines is shown. For each cell line, normality scores were normalized to their own DMSO controls. All drugs caused significant (p<0.05) reductions in normality scores in all cell lines.
-
Figure 2—source data 1
Source data for Figure 2C-F.
- https://cdn.elifesciences.org/articles/88799/elife-88799-fig2-data1-v1.zip
Figure 2—figure supplement 1
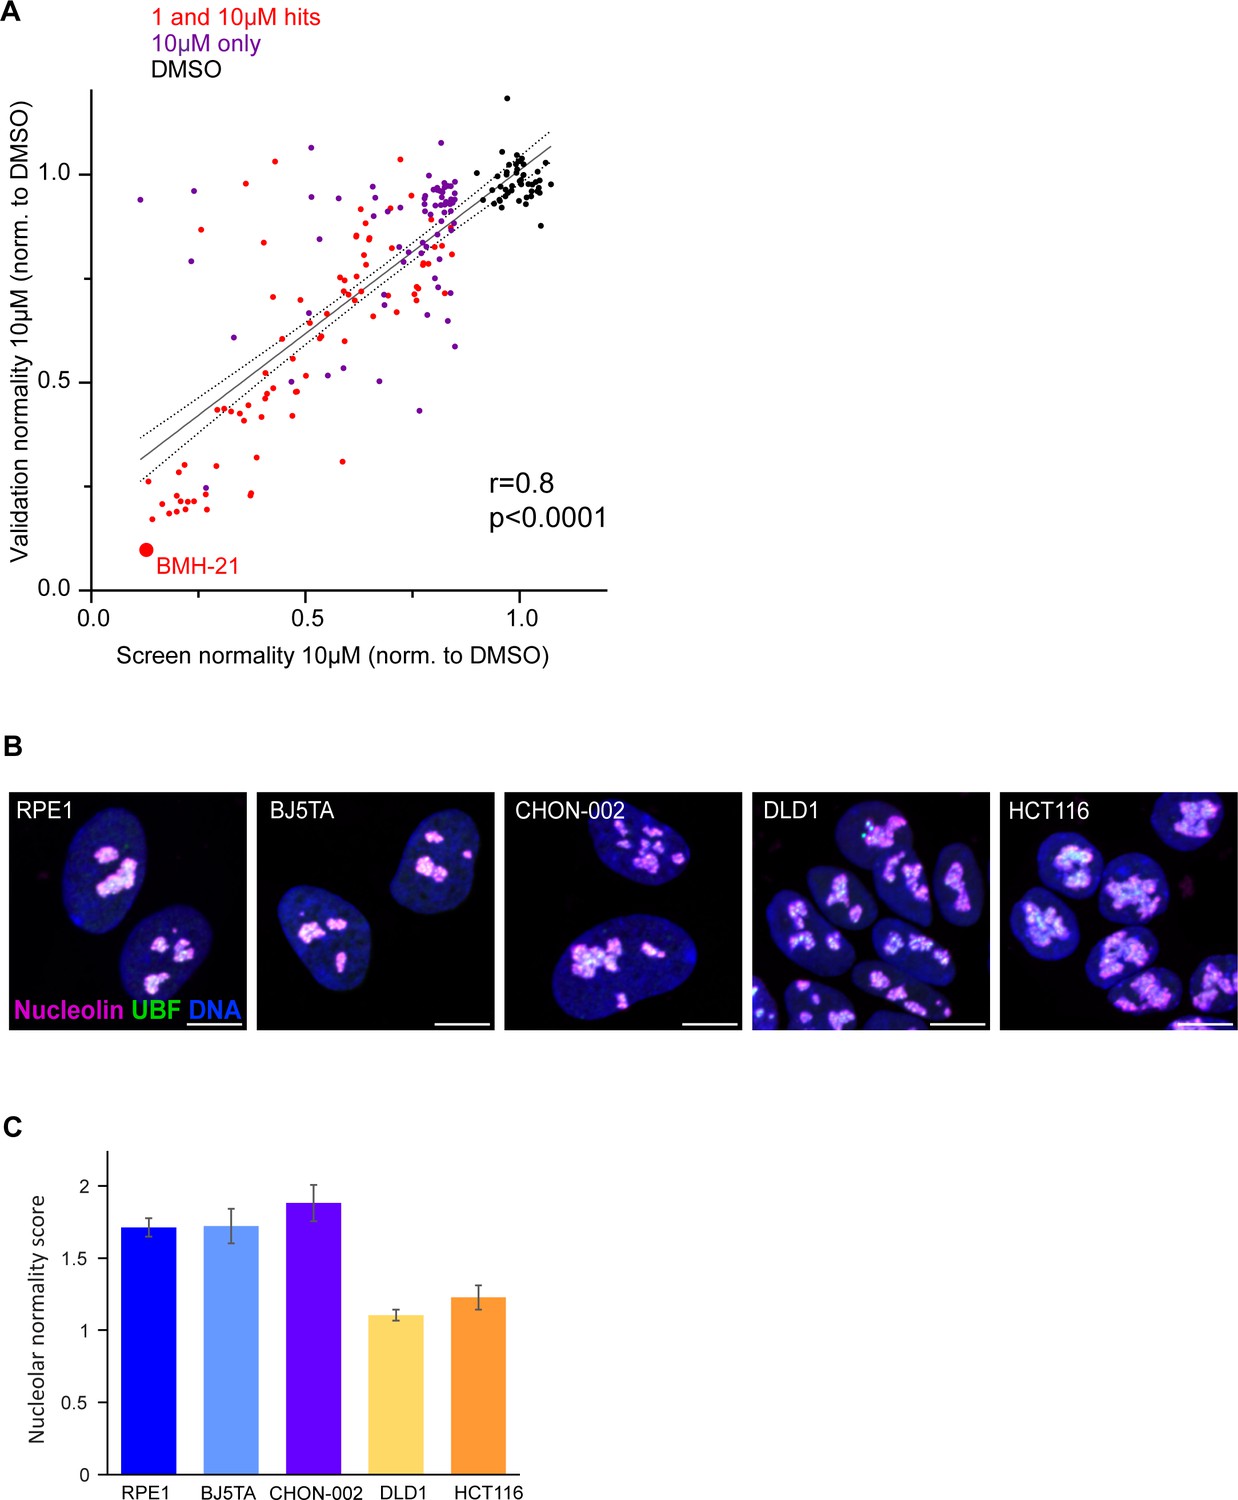
Validation of nucleolar stress hits and nucleolar morphology in different cell lines.
(A) Correlation between the normality score for 152 hit compounds from the screen and the average from validation runs is plotted. RPE1 cells were treated with each compound at 10 µM for 24 hr. The validation experiment was replicated four times (four plates). Normality scores were normalized to the average of DMSO control (black points). Red points denote 1 and 10 µM hits, purple points denote 10 µM hits only. BMH21 – internal positive control, a known Pol I inhibitor present in the library. Normality scores from the validation runs strongly correlated with normality scores from the screen (Pearson’s r = 0.8, p<0.0001). (B) Examples of normal nucleolar morphologies in control (DMSO-treated) hTERT cell lines RPE1, BJ5TA, CHON-002, and cancer cell lines DLD1 and HCT116 is shown. Fixed cells were labeled with antibodies against nucleolin and UBF and counterstained with DAPI. DLD1 and HCT116 cells tend to have larger and more amorphous nucleoli than hTERT cell lines. Bar, 10 µm. (C) Raw nucleolar normality scores of cell lines shown in (B). Note lower normality scores in cancer cell lines DLD1 and HCT116.
-
Figure 2—figure supplement 1—source data 1
Source data for Figure 2—figure supplement 1A and C.
- https://cdn.elifesciences.org/articles/88799/elife-88799-fig2-figsupp1-data1-v1.zip
Figure 3 with 2 supplements
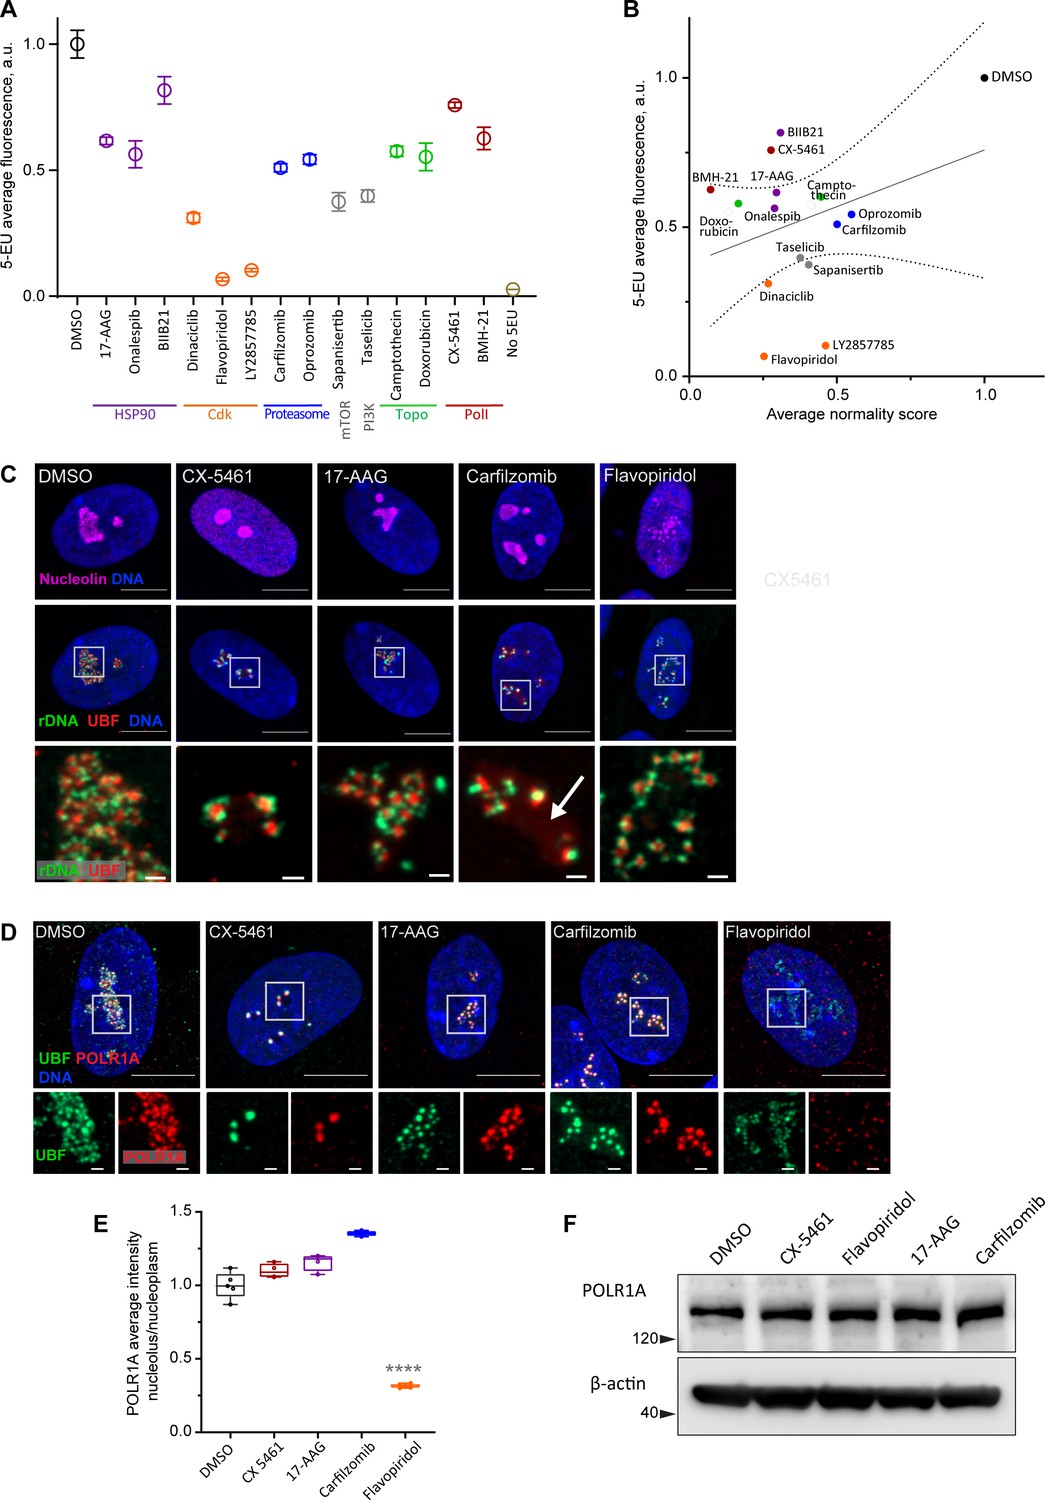
Characterization of nucleolar stresses in a panel of selected drugs.
(A) 5-ethynyluridine (5-EU) incorporation was measured in RPE1 cells treated with the panel of selected drug hits from the screen. All compounds were added for 10 hr followed by 4 hr of 0.5 mM 5-EU incorporation. All drugs were at 10 µM concentration except LY2857785 and CX-5461 were used at 2.5 µM, camptothecin and flavopiridol were used at 5 µM, and doxorubicin and BMH-21 at 1 µM. 5-EU-labeled RNA was detected with fluorescent azide and quantified by imaging. Plots represent means with standard deviations of three or more large fields of view containing hundreds of cells. Raw fluorescent intensity values were normalized to the average of the DMSO controls. All drug treatments caused a significant reduction in 5-EU incorporation compared to DMSO (p<0.01, unpaired t-tests). (B) A correlation plot of average nucleolar normality scores versus average 5-EU fluorescence is shown. Both parameters were normalized to the average of the DMSO controls. The trend for drugs with lower normality scores to have lower 5-EU incorporation was not significant (Pearson’s r = 0.33, p=0.23). (C) Fluorescent in situ hybridization with antibody immunolabeling (immuno-FISH) images of drug-treated RPE1 cells labeled with human rDNA probe (green), UBF (red), and nucleolin (magenta) are shown. Nuclei were counterstained with DAPI (blue). Bar, 10 µm. The duration of 2.5 µM CX-5461 and 10 µM flavopiridol treatments was 5 hr, 10 µM 17-AAG and 10 µM carfilzomib 10 hr. Magnified inserts show details of individual nucleoli (bar, 1 µm). Note peripheral stress caps in CX-5461 and unfolded rDNA/UBF in flavopiridol–treated cells. The arrow in the carfilzomib panel indicates the diffuse pool of UBF not associated with rDNA. (D) Immunofluorescence images of RPE1 cells treated as in (C) and labeled with antibodies against UBF (green) and POLR1A (red, antibody C-1). Nuclei were counterstained with DAPI. Bar, 10 µm. Magnified insets show details of individual nucleoli (bar, 1 µm). UBF and POLR1A label the same structures in all treatments except flavopiridol. (E) The quantification of POLR1A immunofluorescence from (D) is plotted. The box plot depicts ratios of POLR1A signal intensity in the nucleolus versus nucleoplasm normalized to the average of DMSO controls. The plot represents the means of 4–5 fields of view containing a total of 80–100 cells. Asterisks indicate a significant reduction in nucleolar POLR1A (p<0.0001, unpaired t-test flavopiridol vs. DMSO). (F) Western blot analysis of POLR1A protein levels in RPE1 cells treated with the indicated drugs for 8 hr. Total POLR1A levels were not altered.
-
Figure 3—source data 1
Source data for Figure 3A,B and E.
- https://cdn.elifesciences.org/articles/88799/elife-88799-fig3-data1-v1.zip
-
Figure 3—source data 2
Source data for Figure 3F.
- https://cdn.elifesciences.org/articles/88799/elife-88799-fig3-data2-v1.zip
Figure 3—figure supplement 1
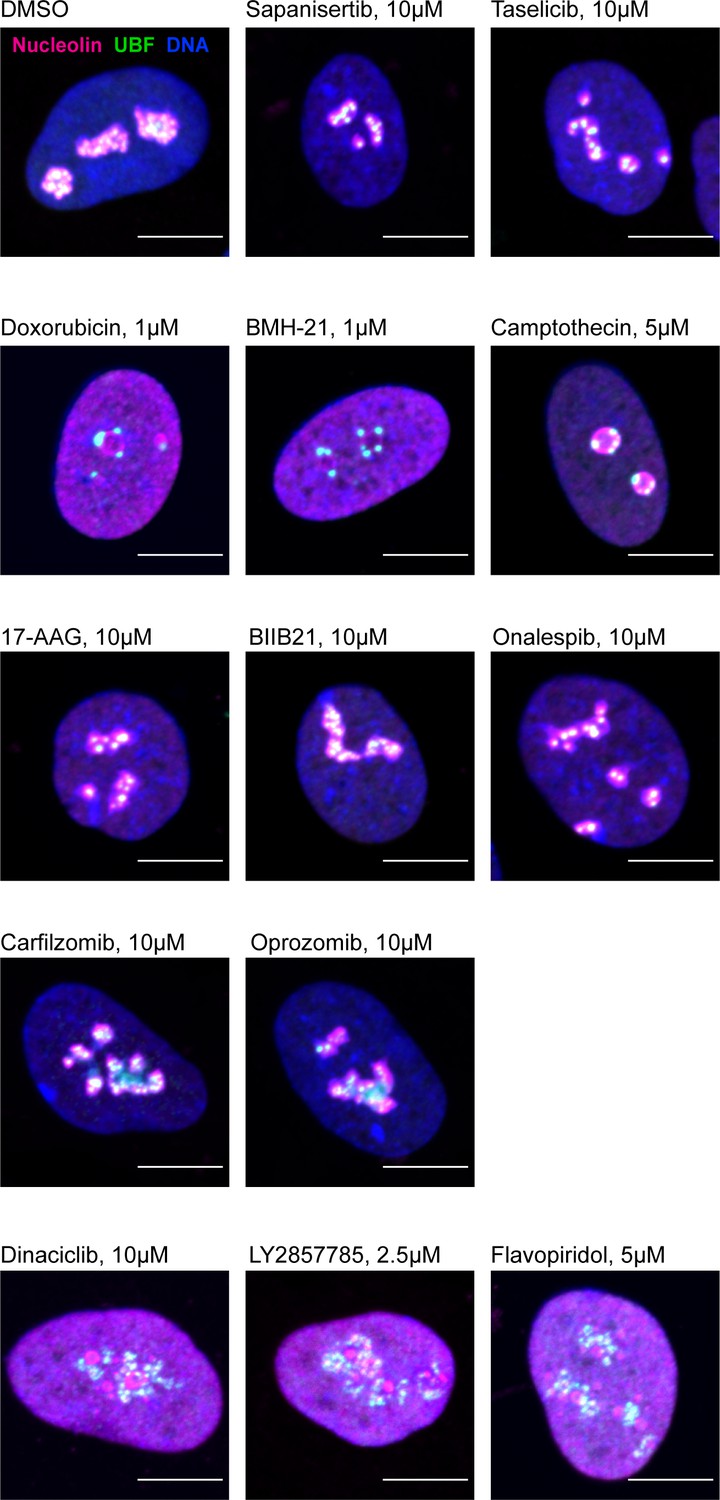
Examples of immunofluorescence labeling of RPE1 cells treated with a panel of indicated compounds.
Fixed cells were labeled with antibodies against nucleolin and UBF and counterstained with DAPI. Bar, 10 µm.
Figure 3—figure supplement 2
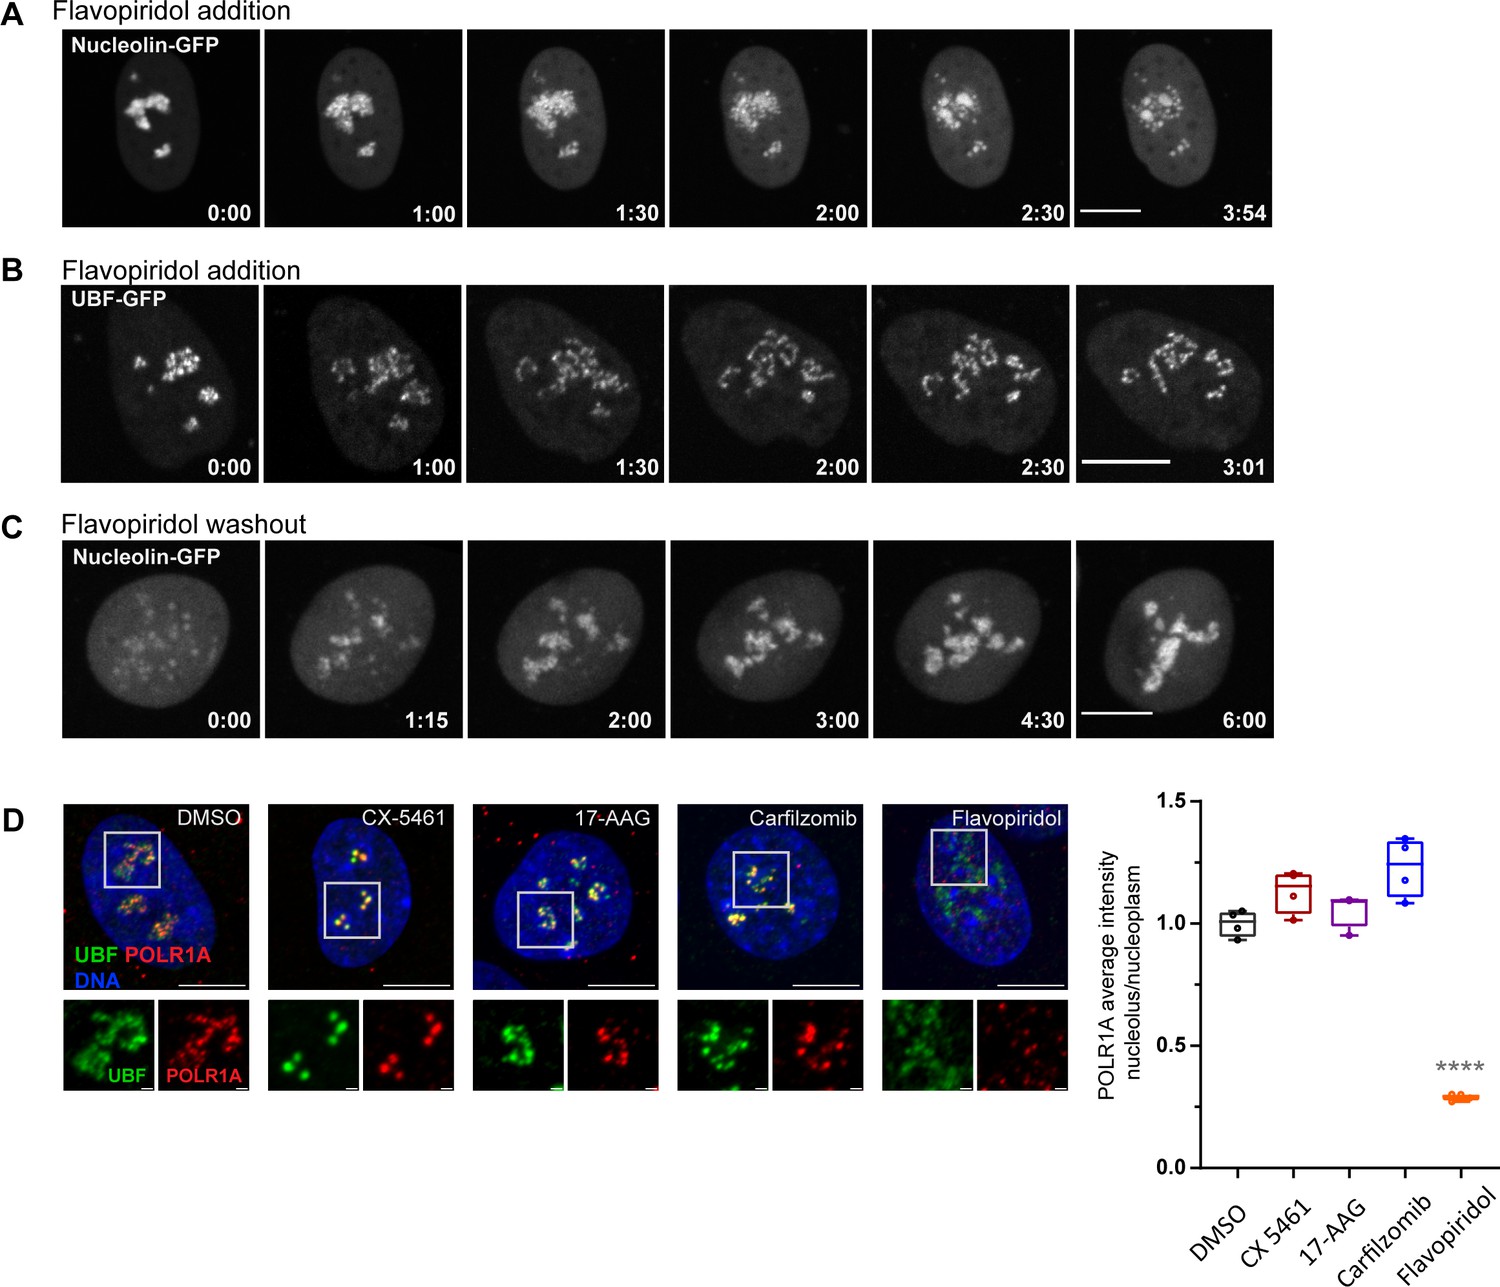
Nucleolar morphology changes after flavopiridol addition and washout, and effects of selected drugs on POLR1A localization.
(A) Time-lapse images (h:min) of eGFP-nucleolin expressing cell RPE1 treated with 10 µM flavopiridol at time 0 are shown. Nucleolin largely disperses forming small round droplets within the diffused nucleoplasmic pool. The complete video sequence is shown in Video 3. Bar, 10 µm. (B) Time-lapse images (h:min) of eGFP-UBF expressing RPE1 cell treated with 10 µM flavopiridol at time 0 are shown. UBF de-compacts into strings with some diffusion into the nucleoplasm. The complete video sequence is shown in Video 4. Bar, 10 µm. (C) Time-lapse images (h:min) after flavopiridol washout are shown. RPE1 cell expressing eGFP-nucleolin was pretreated with 10 µM flavopiridol for 5 hr, then the drug was washed out before imaging. Nucleoli re-formed within 4–5 hr. The complete video sequence is shown in Video 5. Bar, 10 µm. (D) Immunofluorescence images of RPE1 cells treated with indicated drugs as in Figure 3D and labeled with a different POLR1A mouse monoclonal antibody (F-6) than in Figure 3D. UBF was labeled with the same antibody as in Figure 3D. Nuclei were counterstained with DAPI. Bar, 10 µm. Magnified inserts show details of individual nucleoli (bar, 1 µm). The plot on the right shows ratios of POLR1A signal intensity in the nucleolus versus nucleoplasm normalized to the average of DMSO controls. The plot represents means of four fields of view containing many cells. Asterisks indicate a significant reduction in nucleolar POLR1A (p<0.0001, unpaired t-test flavopiridol vs. DMSO).
-
Figure 3—figure supplement 2—source data 1
Source data for Figure 3—figure supplement 2D.
- https://cdn.elifesciences.org/articles/88799/elife-88799-fig3-figsupp2-data1-v1.zip
Figure 4
Effects of CDK9 inhibitors on nuclear morphology and function.
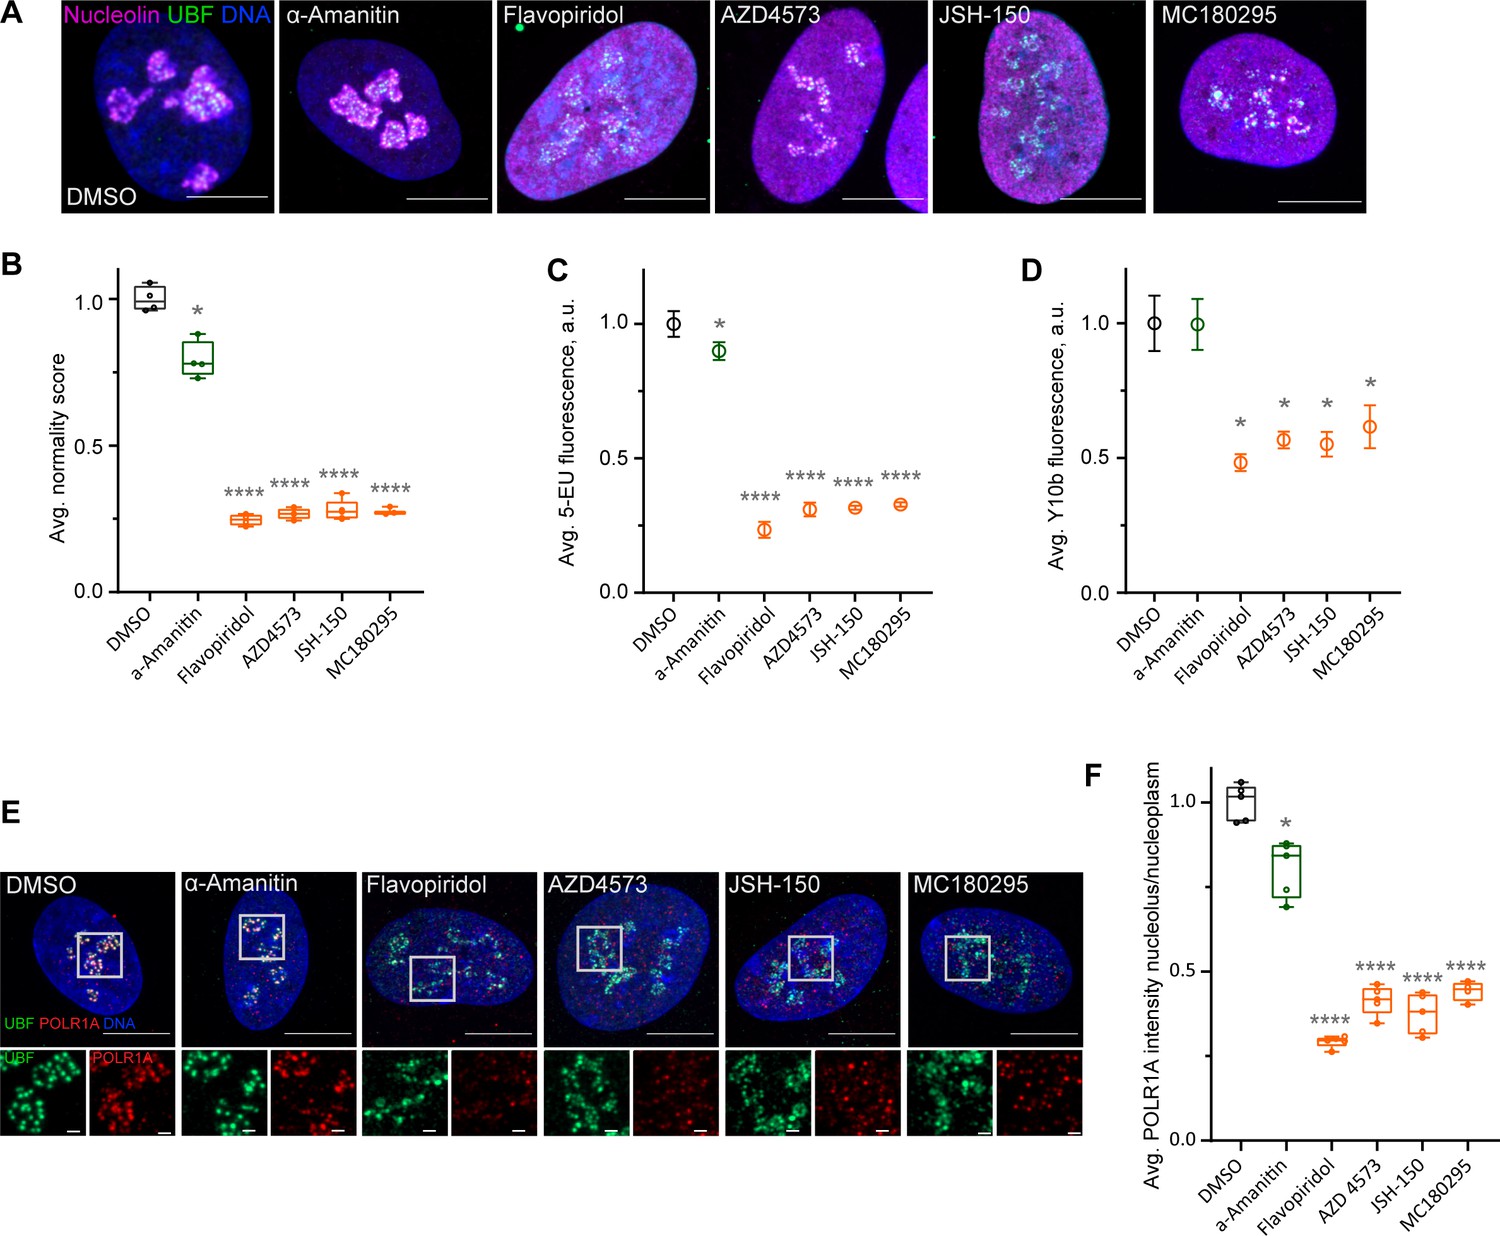
(A) Immunofluorescence images of drug-treated cells labeled with antibodies against nucleolin (magenta) and UBF (green) are shown. Nuclei were counter-stained with DAPI. Cells were treated with DMSO (vehicle), 5 µg/ml Pol II inhibitor α-amanitin, 5 µM pan-CDK inhibitor flavopiridol, or 5 µM CDK9 inhibitors AZD4573, JSH-150, and MC180295 for 5 hr. Note that all CDK inhibitor-treated cells have similar phenotypes. Bar, 10 µm. (B) Normality score measurements of RPE1 cells treated as in (A) are shown. Raw normality scores were normalized to the average of DMSO treated cells. Box plots represent means of 4–5 fields of view containing many cells. Asterisks: *p<0.01, ****p<0.0001 (unpaired t-test comparing treatments vs. DMSO). (C) 5-Ethynyluridine (5-EU) incorporation in RPE1 cells treated as in (A) is shown. 5-EU-labeled RNA was detected with fluorescent azide and quantified by imaging. Plots represent means with standard deviations of 5–8 large fields of view containing hundreds of cells. Raw fluorescence intensity values were normalized to the average of the DMSO-treated control cells. Asterisks: *p<0.01, ****p<0.0001 (unpaired t-test comparing treatment vs. DMSO). (D) Quantification of Y10b (anti-rRNA) antibody labeling of RPE1 cells treated as in (A). Plots represent means with standard deviations of three large fields of view containing hundreds of cells. Raw fluorescent intensity values were normalized to the average of the DMSO control. Asterisks indicate p<0.01 (unpaired t-test comparing treatments vs. DMSO). (E) Immunofluorescence images of RPE1 cells treated as in (A) and labeled with antibodies against UBF (green) and POLR1A (red) are shown. Nuclei were counter-stained with DAPI. Bar, 10 µm. Magnified inserts show details of individual nucleoli (bar, 1 µm). (F) Quantification of POLR1A immunofluorescence from (E) is shown. The box plot depicts ratios of POLR1A signal intensity in the nucleolus versus nucleoplasm normalized to the average of DMSO-treated cells. Plots represent means of 4–5 fields of view containing many cells. Asterisks: *p<0.01, ****p<0.0001 (unpaired t-test comparing treatment vs. DMSO).
-
Figure 4—source data 1
Source data for Figure 4B,C,D,F.
- https://cdn.elifesciences.org/articles/88799/elife-88799-fig4-data1-v1.zip
Figure 5 with 1 supplement
Effects of CDK9 inhibitors on the nuclear proteome and phosphoproteome.
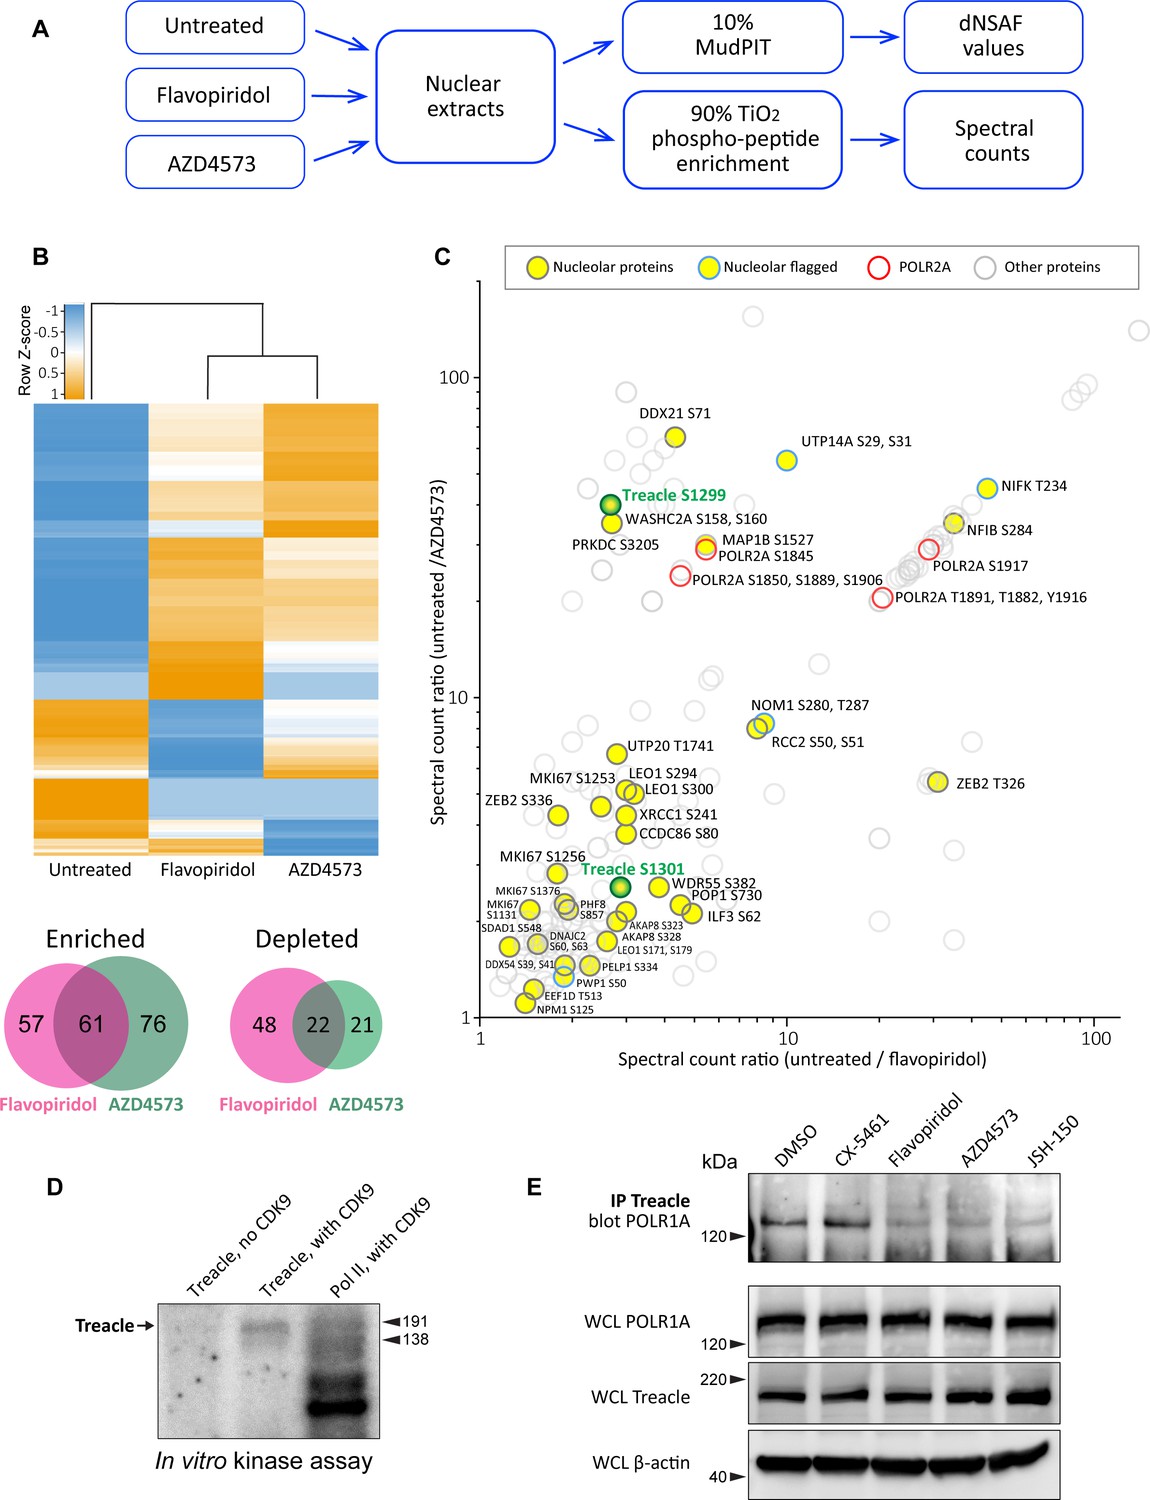
(A) An overview of the nuclear phosphoprotein profiling workflow is shown. Nuclear protein extracts were generated from RPE1 cells or following treatment with 5 µM flavopiridol or 5 µM AZD4573 for 5 hr. After trypsin digestion, peptide samples were split into two parts: 10% of each sample was used for MudPIT and 90% was enriched for phosphopeptides using High-Select TiO2 phosphopeptide enrichment spin tips (Thermo Scientific). Peptides prepared from nuclear extracts and phosphopeptide-enriched samples were analyzed using an Orbitrap Elite Mass Spectrometer coupled with an Agilent 1260 Infinity quaternary pump (two biological replicates per condition). (B) Nuclear proteins selectively enriched or depleted in cells treated with indicated CDK inhibitors were determined. The clustered heatmap shows Z-score values (calculated from dNSAF values) for proteins enriched or depleted in drug-treated cells (LogFC> ± 1.5, QPROT FDR < 0.05). The Venn diagrams depict overlaps between enriched and depleted proteins in both drug treatments. The full list of proteins is provided in Supplementary file 2. (C) Phosphopeptides that decreased after drug treatment are depicted. Axes indicate the ratio of numbers of spectra for phosphopeptides detected in untreated relative to drug-treated samples. If no phosphopeptides were detected in drug-treated samples, the number 0 was replaced with 0.1 to avoid dividing by zero. Proteins with significantly decreased abundance after drug treatment (QPROT FDR <0.0001) were filtered out. In addition, phosphosites with fewer than two spectral counts in either of the untreated samples were not considered. Yellow circles indicate proteins with the GO-term nucleolus for the subcellular compartment, labeled with phosphorylation sites. Blue outlines flag proteins with non-significant dNSAF decrease in any of the treatments. Red outlines denote phosphopeptides belonging to POLR2A, labeled with sites. All other nuclear phosphopeptides are shown as open circles. Treacle phosphosite labels are highlighted in green. The full list of phosphopeptides with sites is provided in Supplementary file 3. (D) Representative in vitro CDK9/cyclin K kinase assay with recombinant human Treacle protein substrate and radiolabeled [γ-32P] ATP is shown. The negative control (first lane) contained the Treacle substrate without the kinase. The second lane contained both the kinase and the substrate. In the third lane, the Pol II holoenzyme complex purified from S. cerevisiae served as a positive control. Molecular weights of RNA Pol II holoenzyme subunits Rbp1 (191 kDa) and Rbp2 (138 kDa) are indicated. (E) Immunoprecipitation (IP) of Treacle from drug-treated cells followed by western blotting with anti-POLR1A antibody. Treacle antibody pulled down POLR1A from lysates of cells treated with DMSO or CX-5461, but not from cells treated with CDK inhibitors. Lower panels show POLR1A and Treacle immunoblots of corresponding whole-cell lysates (WCL). β-Actin was used as a loading control.
-
Figure 5—source data 1
Source data for Figure 5D.
- https://cdn.elifesciences.org/articles/88799/elife-88799-fig5-data1-v1.zip
-
Figure 5—source data 2
Source data for Figure 5E.
- https://cdn.elifesciences.org/articles/88799/elife-88799-fig5-data2-v1.zip
Figure 5—figure supplement 1
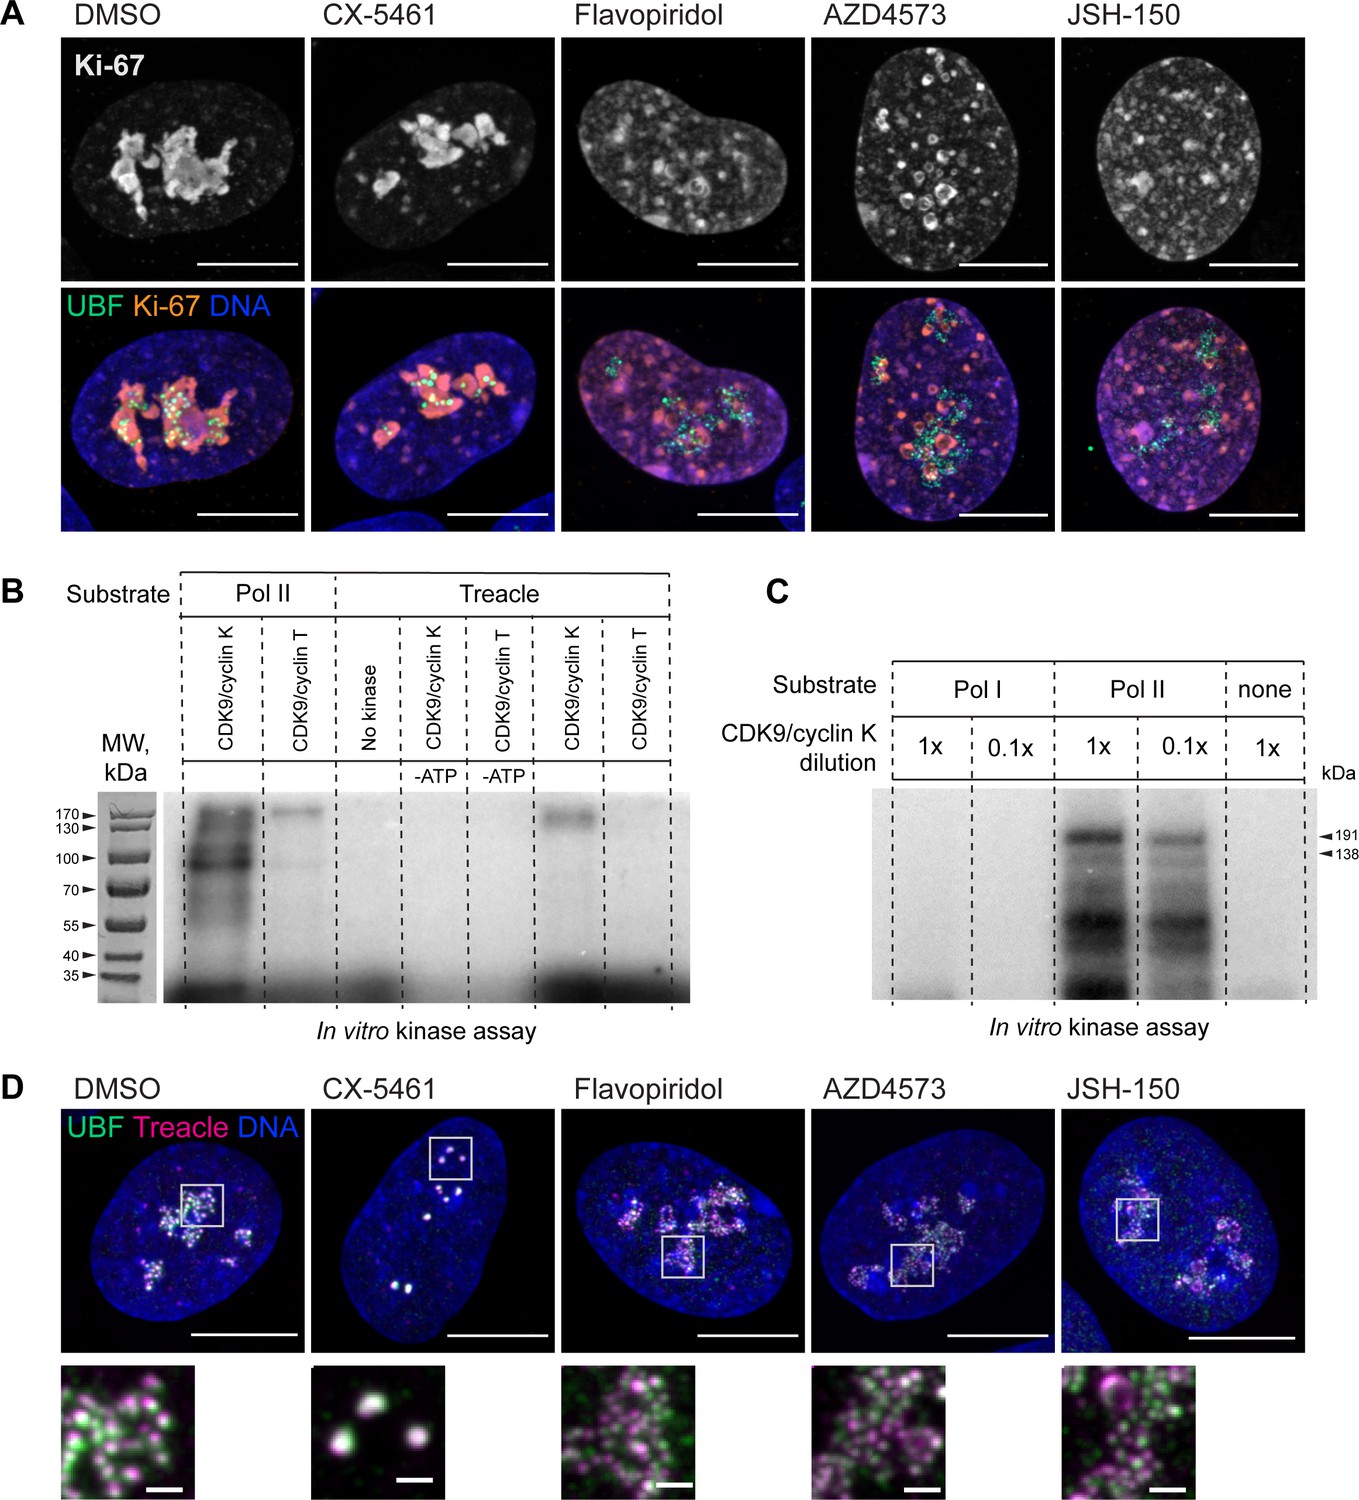
Effects of selected drugs on localization of Ki-67 and Treacle, and additional in vitro CDK9 kinase assays.
(A) Examples of immunofluorescence labeling of RPE1 cells treated with CX-5461 (2.5 µM) and flavopiridol (5 µM), AZD4573 (5 µM), and JSH-150 (5 µM) for 5 hr. Fixed cells were labeled with antibodies against Ki-67 and UBF. Nuclei were counterstained with DAPI. Bar, 10 µm. Magnified inserts show details of individual nucleoli (bar, 1 µm). (B) In vitro radiolabeled [γ-32P] ATP CDK9/cyclin K and CDK9/cyclin T kinase assays with isolated RNA Pol I and RNA Pol II holoenzymes and recombinant Treacle as substrates. Lanes 1–2 contained isolated RNA Pol II complex as a substrate, while lanes 3–7 contained Treacle as a substrate. CDK9/cyclin K effectively phosphorylated both RNA Pol II and Treacle. CDK9/cyclin T activity towards RNA Pol II (positive control) was minimal, suggesting low activity of the reagent. No kinase and no [γ-32P] ATP control lanes were blank as expected. Molecular weight markers are shown on the corresponding image of the gel stained with Coomassie blue. (C) In vitro CDK9/cyclin K kinase assays with isolated RNA Pol I and RNA Pol II holoenzymes and [γ-32P] ATP. CDK/cyclin complex was used at 1× (0.1 µg) or 0.1× (0.01 µg) concentrations. The first two lanes contained RNA Pol I complex and the second two lanes contained RNA Pol II complex as a substrate. CDK9 phosphorylated RNA Pol II but not RNA Pol I. The negative control (last lane) contained no substrate. Molecular weights of RNA Pol II holoenzyme subunits Rbp1 (191 kDa) and Rbp2 (138 kDa) are indicated. (D) Examples of immunofluorescence labeling of RPE1 cells treated as in (A) and labeled with antibodies against Treacle and UBF. Nuclei were counterstained with DAPI. Bar, 10 µm. Magnified insets show details of individual nucleoli (bar, 1 µm).
-
Figure 5—figure supplement 1—source data 1
Source data for Figure 5—figure supplement 1B.
- https://cdn.elifesciences.org/articles/88799/elife-88799-fig5-figsupp1-data1-v1.zip
-
Figure 5—figure supplement 1—source data 2
Source data for Figure 5—figure supplement 1C.
- https://cdn.elifesciences.org/articles/88799/elife-88799-fig5-figsupp1-data2-v1.zip
Figure 6
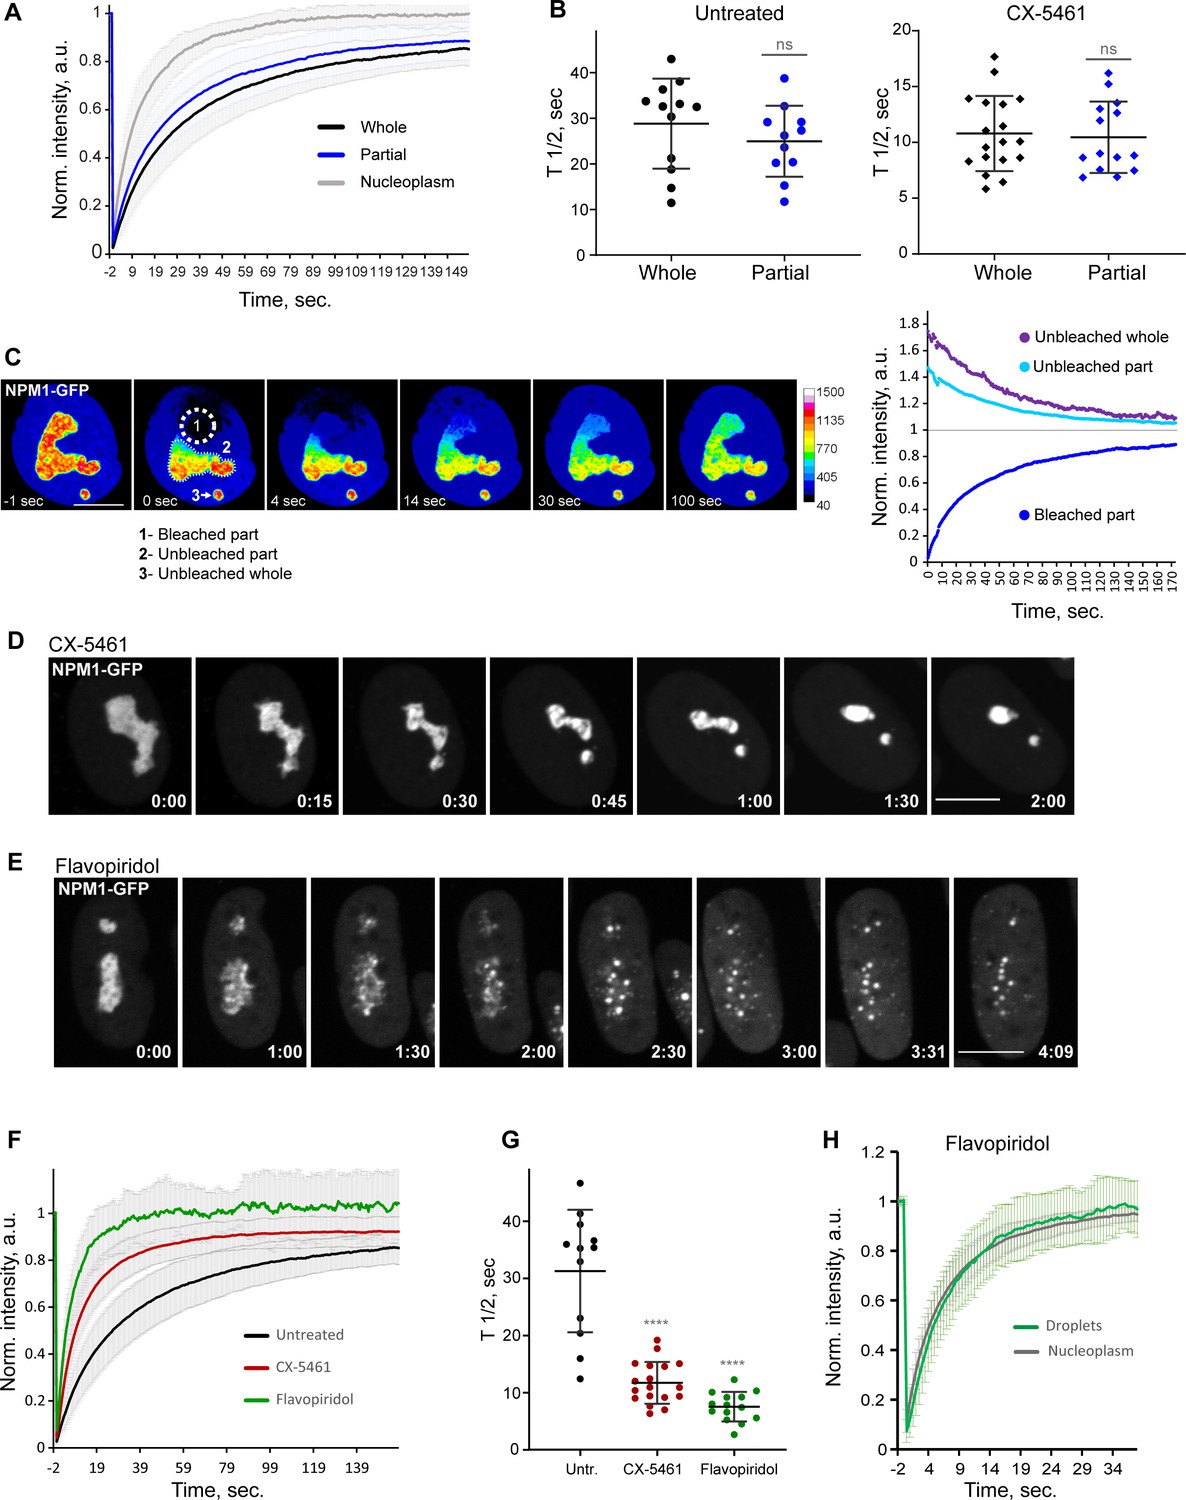
Analysis of biophysical properties of the nucleoli using endogenous NPM1 tagged with GFP.
(A) Fluorescence recovery after photobleaching (FRAP) analysis of NPM1-GFP in whole-bleached or partially bleached nucleoli in untreated cells is shown. Plots are averages of normalized fluorescence intensities of 10 cells or more. Bars denote standard deviation. (B) Individual T1/2 measurements of whole and partially bleached nucleoli are shown in untreated cells and in cells treated with 2.5 µM Pol I inhibitor CX-5461. The difference between whole and partially bleached nucleoli was not significant in both groups (t-test). (C) An example of a partially bleached nucleolus in a cell with two nucleoli is shown. The normalized intensity plot on the left shows the fluorescence recovery of the photobleached part (1), the corresponding loss of fluorescence in the unbleached part (2), and the loss of fluorescence in the separate unbleached nucleolus (3). Bar, 10 µm. (D) Time-lapse images of NPM1-GFP expressing cell treated with 2.5 µM CX-5461 at time 0 are shown. NPM1-GFP concentrated inside the nucleolar remnants over time. The complete video sequence is shown in Video 6. Bar, 10 µm. (E) Time-lapse images of NPM1-GFP expressing cell treated with 10 µM flavopiridol at time 0 are shown. NPM1-GFP dispersed into multiple small round globules, and the fluorescent intensity of the nucleoplasm pool increased. The complete video sequence is shown in Video 7. Bar, 10 µm. (F) FRAP analysis of NPM1-GFP in untreated cells (whole nucleoli) and cells treated with 2.5 µM CX-5461 (whole remnants) or 10 µM flavopiridol (whole globules) is shown. Plots are averages of normalized fluorescence intensities of more than 10 cells. Bars denote standard deviation. (G) Corresponding individual T1/2 measurements in untreated cells and cells treated with 2.5 µM CX-5461 or 10 µM flavopiridol are shown. Asterisks indicate p<0.0001 (unpaired t-test comparing treated groups to untreated). (H) FRAP analysis of NPM1-GFP in cells treated with flavopiridol is compared for droplets versus nucleoplasm. Plots are averages of normalized fluorescence intensities of more than 10 cells. Bars denote standard deviation.
-
Figure 6—source data 1
Source data for Figure 6A,B,C,F,G,H.
- https://cdn.elifesciences.org/articles/88799/elife-88799-fig6-data1-v1.zip
Figure 7
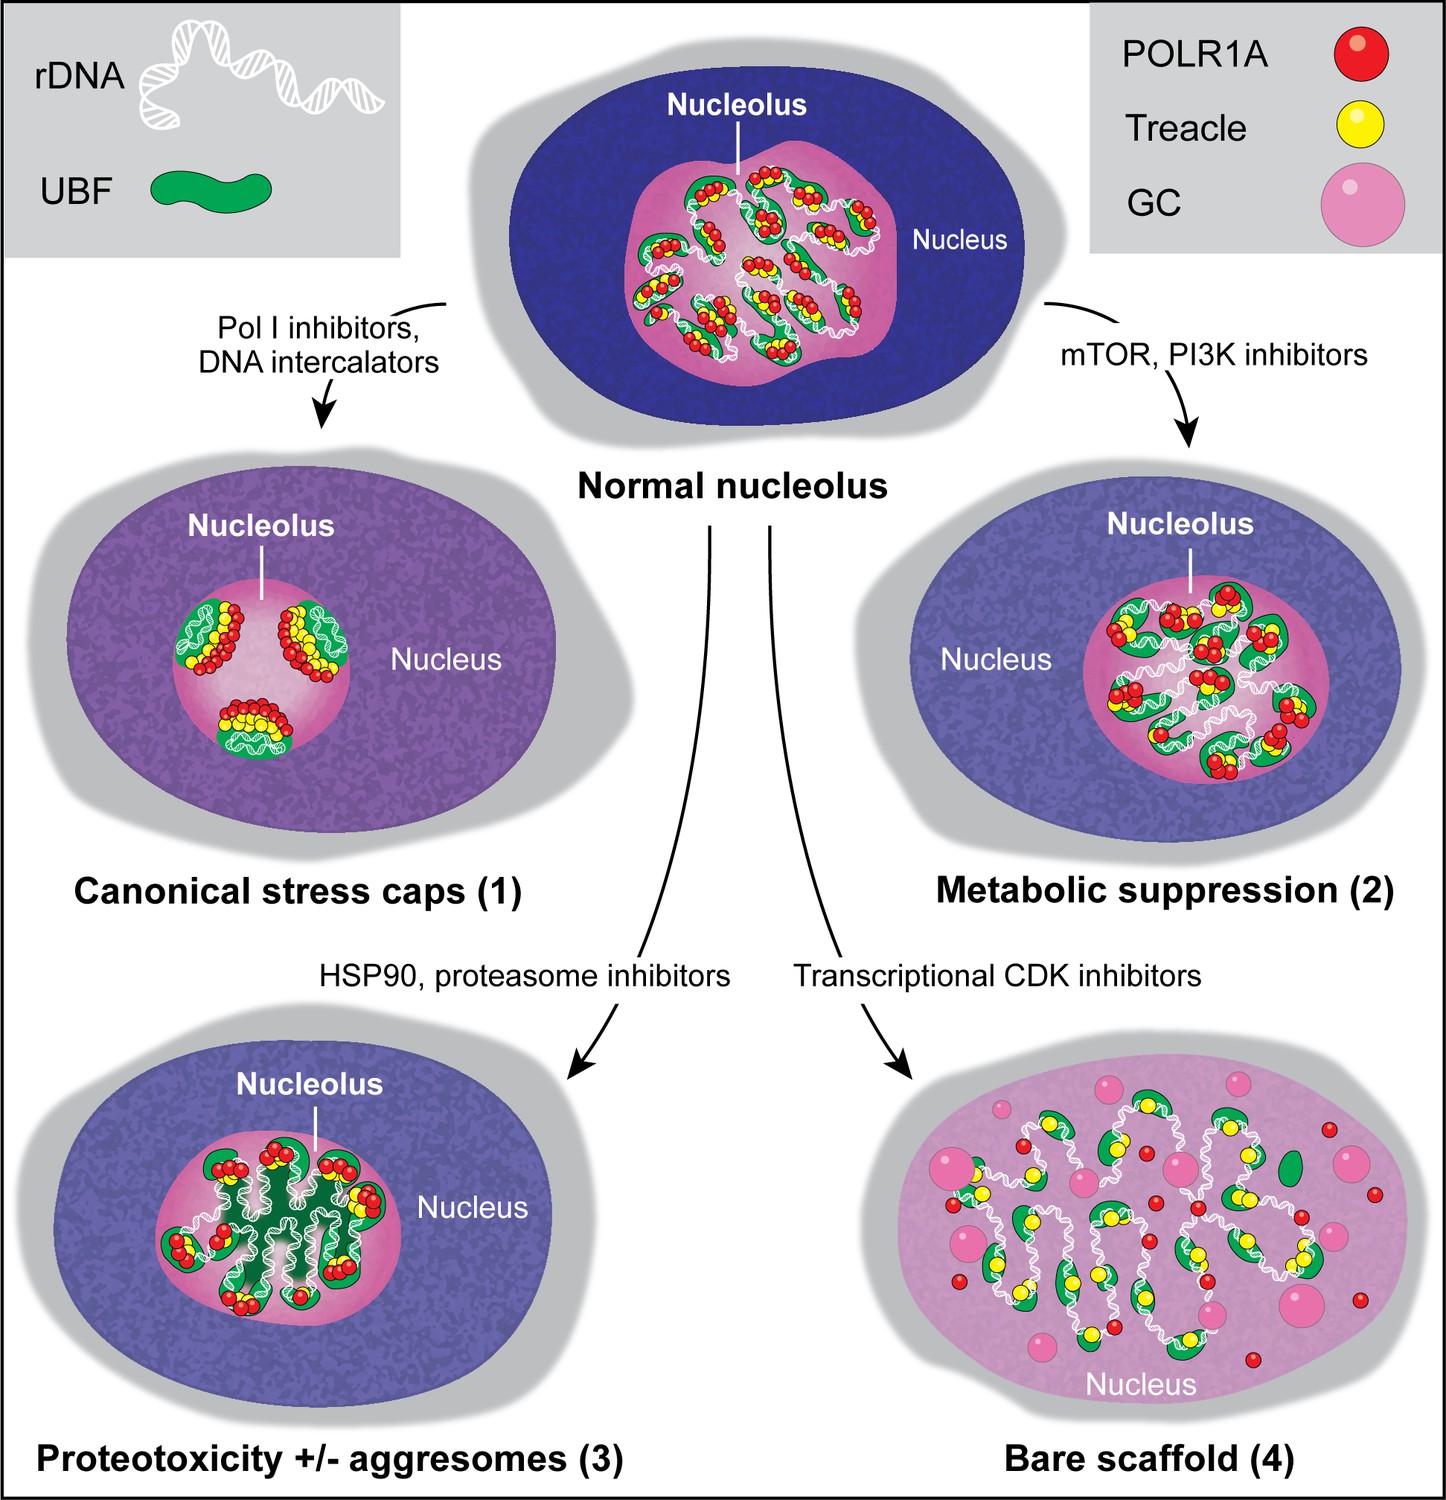
Types of nucleolar stresses identified in this study.
(1) DNA intercalators and RNA Pol I inhibitors induced canonical nucleolar stress manifested by partial dispersion of granular component (GC) and segregation of rDNA and fibrillar center (FC) components UBF, Treacle, and POLR1A within nucleolar stress caps. (2) Inhibition of mTOR and PI3K growth pathways induced a metabolic suppression of function accompanied by the decrease in nucleolar normality score, size, and rRNA production, without dramatic re-organization of nucleolar anatomy. (3) Inhibitors targeting HSP90 and the proteasome induced proteotoxicity, resulting in the disruption of protein homeostasis and the accumulation of misfolded and/or undegraded proteins. These effects were accompanied by a decrease in nucleolar normality score, rRNA output, and in some cases formation of protein aggregates (aggresomes) inside the nucleolus. (4) Inhibition of transcriptional CDK activity led to the disruption of interactions between rDNA, RNA Pol I, and GC proteins. This resulted in almost complete nucleolar dissolution, leaving behind an extended bare rDNA scaffold with only a few associated FC proteins remaining. UBF and Pol I recruiting protein Treacle remained associated with the rDNA, while POLR1A and GC dispersed in the nucleoplasm. rRNA production ceased and the nucleolar normality score was greatly reduced.
Author response image 1
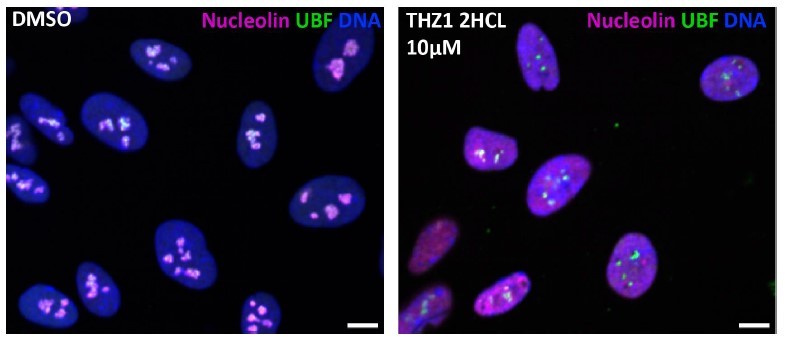
Control and THZ1 - treated RPE1 cells, images from screen plates.
Videos
Video 1
Fluorescence and phase-contrast time-lapse video of a human RPE1 cell stably expressing eGFP-nucleolin that was treated with 2.5 µM RNA Pol I inhibitor CX-5461.
Nucleoli shrink and round up forming small circular remnants. Fluorescence intensity decreases in nucleolar remnants and increases in the nucleoplasm. Time is indicated as minutes after drug addition. Bar, 10 μm.
Video 2
Fluorescence and phase-contrast time-lapse video of a human RPE1 cell stably expressing eGFP-UBF that was treated with 2.5 µM RNA Pol I inhibitor CX-5461.
UBF condenses on the periphery of nucleolar remnants forming stress caps of high fluorescence intensity. Time is indicated as minutes after drug addition. Bar, 10 μm.
Video 3
Fluorescence and phase-contrast time-lapse video of a human RPE1 cell stably expressing eGFP-nucleolin that was treated with 10 µM CDK inhibitor flavopiridol.
Nucleolin largely disperses forming small round droplets within the diffused nucleoplasmic pool. Time is indicated as minutes after drug addition. Bar, 10 μm.
Video 4
Fluorescence and phase-contrast time-lapse video of a human RPE1 cell stably expressing eGFP-UBF that was treated with 10 µM CDK inhibitor flavopiridol.
UBF de-compacts into strings with some diffusion into the nucleoplasm. Time is indicated as minutes after drug addition. Bar, 10 μm.
Video 5
Fluorescence and phase-contrast time-lapse video of a human RPE1 cell stably expressing eGFP-nucleolin after flavopiridol washout.
The cell was pretreated with 10 µM flavopiridol for 5 hr, then the drug was washed out before imaging. Nucleoli re-form within 4–6 hr. Time is indicated as minutes after drug washout and initiation of imaging. Bar, 10 μm.
Video 6
Fluorescence and phase-contrast time-lapse video of a human RPE1 cell with endogenous NPM1 tagged with eGFP treated with 2.5 µM CX-5461.
NPM1-GFP concentrates inside the nucleolar remnants over time. Time is indicated as minutes after drug addition. Bar, 10 μm.
Video 7
Fluorescence and phase-contrast time-lapse video of a human RPE1 cell with endogenous NPM1 tagged with eGFP treated with 10 µM flavopiridol.
NPM1-GFP disperses into multiple small round globules, and the fluorescent intensity of the nucleoplasm pool increases. Time is indicated as minutes after drug addition. Bar, 10 μm.
Additional files
-
Supplementary file 1
The complete list of anticancer compounds present in the library with normality scores after 1 µM and 10 µM treatments.
Normality scores for DMSO controls are also listed.
- https://cdn.elifesciences.org/articles/88799/elife-88799-supp1-v1.xlsx
-
Supplementary file 2
List of nuclear proteins selectively enriched and depleted in cells treated with CDK inhibitors.
QPROT statistics for all identified proteins are also provided.
- https://cdn.elifesciences.org/articles/88799/elife-88799-supp2-v1.xlsx
-
Supplementary file 3
List of differentially phosphorylated nuclear proteins in cells treated with CDK inhibitors.
The complete list of phosphopeptides with sites is also provided.
- https://cdn.elifesciences.org/articles/88799/elife-88799-supp3-v1.xlsx
-
MDAR checklist
- https://cdn.elifesciences.org/articles/88799/elife-88799-mdarchecklist1-v1.docx
Download links
A two-part list of links to download the article, or parts of the article, in various formats.
Downloads (link to download the article as PDF)
Open citations (links to open the citations from this article in various online reference manager services)
Cite this article (links to download the citations from this article in formats compatible with various reference manager tools)
Distinct states of nucleolar stress induced by anticancer drugs
eLife 12:RP88799.
https://doi.org/10.7554/eLife.88799.3


