Negative cell cycle regulation by calcineurin is necessary for proper beta cell regeneration in zebrafish
- Zebrafish Development and Disease Models Laboratory, GIGA-Stem Cells, University of Liège, Belgium
- GIGA-Genomics Core Facility, GIGA, University of Lièg, Belgium
Figures
Figure 1 with 1 supplement
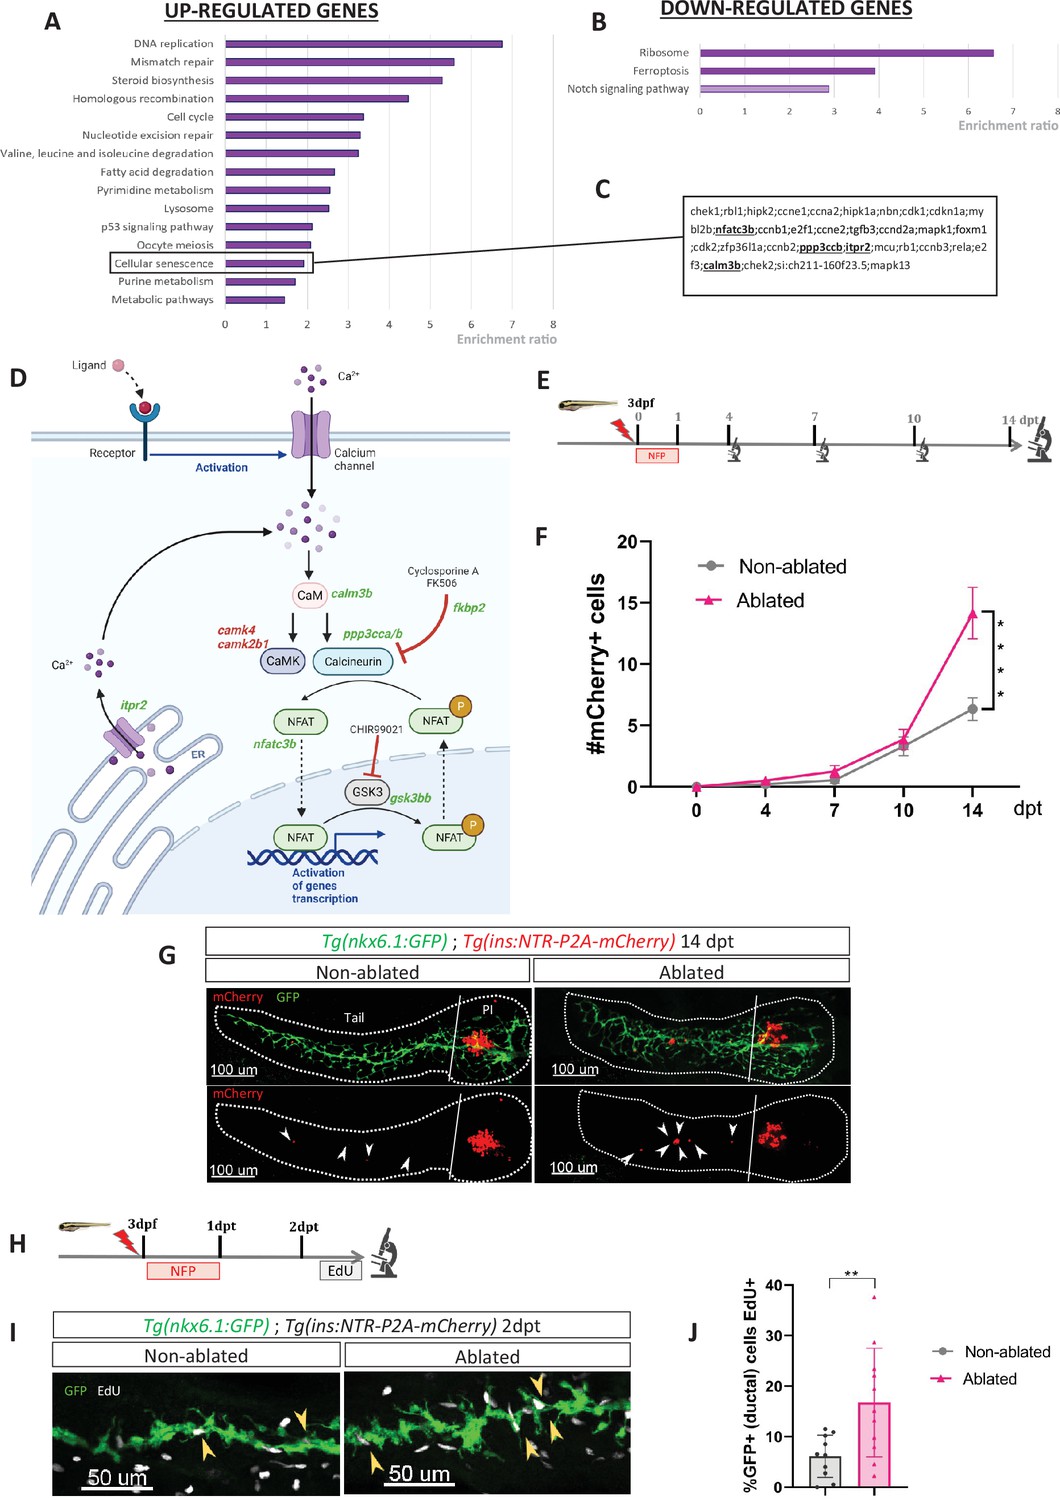
Transcriptomic profiling of ductal cells during beta cell regeneration and validation in larvae.
(A, B) Enrichment ratio of selected non-redundant signatures of Kyoto Encyclopedia of Genes and Genomes (KEGG) pathways overrepresented in ductal cells after beta cells ablation (UP – A and DOWN – B) compared to ductal cells without beta cells ablation. Gene Ontology (GO) terms were identified using over-representation analysis (ORA) analysis by WebGestalt using the list of differentially expressed (DE) genes provided by DESeq. The light color for Notch pathway means p-value = 0.11. (C) List of genes associated with the signature of cellular senescence from A and B. Genes related to calcineurin (CaN) pathway are in bold. (D) CaN canonical pathway with upregulated genes in green and downregulated genes in red in transcriptomic data from A and B. (E) Experimental design for regeneration test in larvae. Briefly, after nifurpirinol (NFP) treatment from 3 to 4 dpf, larvae were fixed and analyzed at 4–7–10 and 14 days post treatment (dpt). (F) Graph representing the mean number of mCherry+ beta cells in the pancreatic tail of Tg(ins:NTR-P2A-mCherry); Tg(nkx6.1:GFP) at 0–4–7–10 and 14 dpt. The gray spheres represent non-ablated conditions and the pink triangles the ablated condition. Data are presented as mean values ± SEM. One-way ANOVA test with Tukey’s multiple comparison test, ****p-value <0.0005. The experiment was performed at least two times and the data were combined in this graph. (G) Whole mount fluorescent immunohistochemistry (GFP and mCherry) of the pancreas of Tg(ins:NTR-P2A-mCherry); Tg(nkx6.1:GFP) larvae at 14 dpt. 3D projection (stack) of one non-ablated and one ablated representative samples. The principal islet (PI) and the pancreatic tail are shown. Arrows point out mCherry+ beta cells in the pancreatic tail. Scale 100 µM. (H) Experimental design for 5‐ethynyl‐2′‐deoxyuridine (EdU) assay in larvae. After NFP treatment for 3 to 4 dpf, larvae were exposed to EdU at 2 dpt before fixation for analysis. (I) Whole mount fluorescent immunohistochemistry (GFP and EdU) of the pancreatic tail of Tg(ins:NTR-P2A-mCherry); Tg(nkx6.1:GFP) larvae at 2 dpt. 3D projection (stack) of one non-ablated and one ablated representative samples. Arrows point out GFP+ duct cells EdU+ in the pancreatic tail. Scale 50 µM. (J) Barplot representing the percentage of GFP+ ductal cells which incorporated EdU+ in non-ablated (n=10) and ablated conditions (n=11). Data are presented as mean values ± standard deviation (SD). T-test. **p-value <0.005. The experiment was performed at least two times.
Figure 1—figure supplement 1
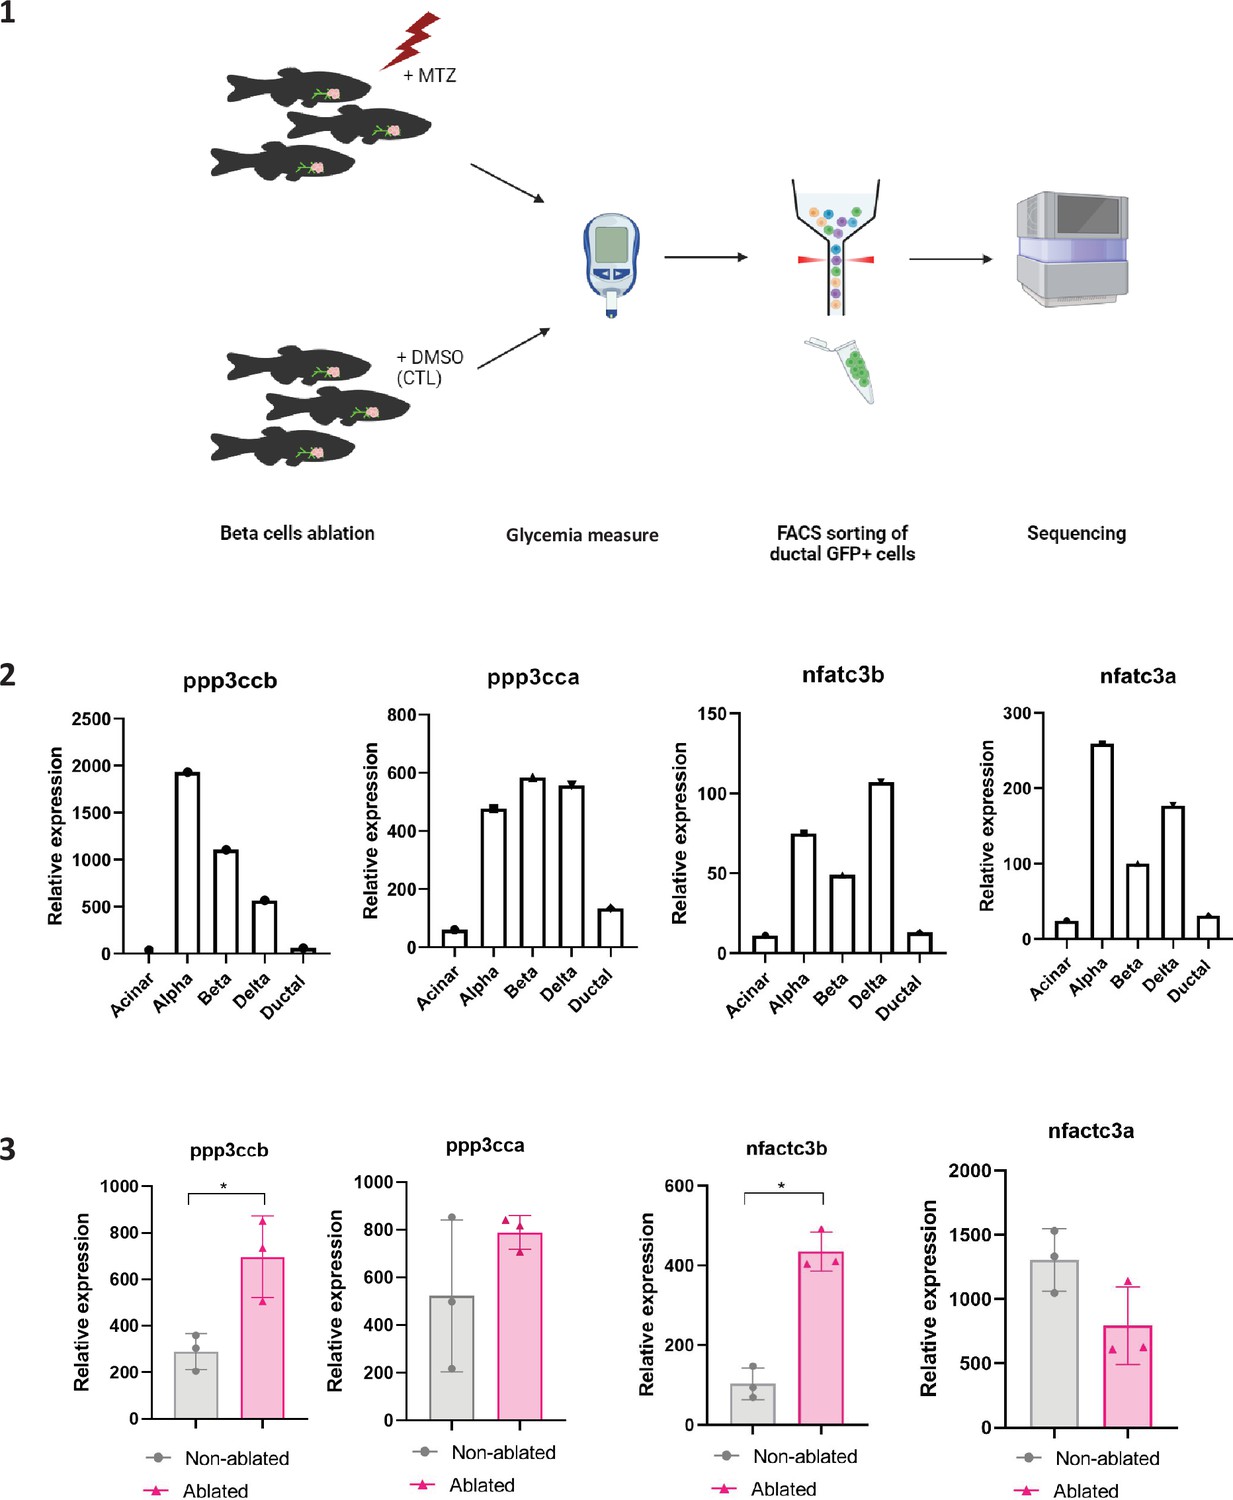
Transcriptomic profiling of ductal cells during beta cell regeneration and validation in larvae.
(1) Design of the experimental pipeline for transcriptomic experiment. (2) Expression of ppp3cca; ppp3ccb; nfatc3a; nfatc3b in acinar, alpha, beta, delta, or ductal cells population from the zebrafish pancreas (Tarifeño-Saldivia et al., 2017). (3) Calcineurin (ppp3ccb and ppp3cca) and NFATc3 (nfatc3a and nfatc3b) expression in ductal cells from zebrafish in non-ablated and ablated conditions. Data are presented as mean values ± standard deviation (SD). T-test, *p-value <0.05.
Figure 2 with 1 supplement
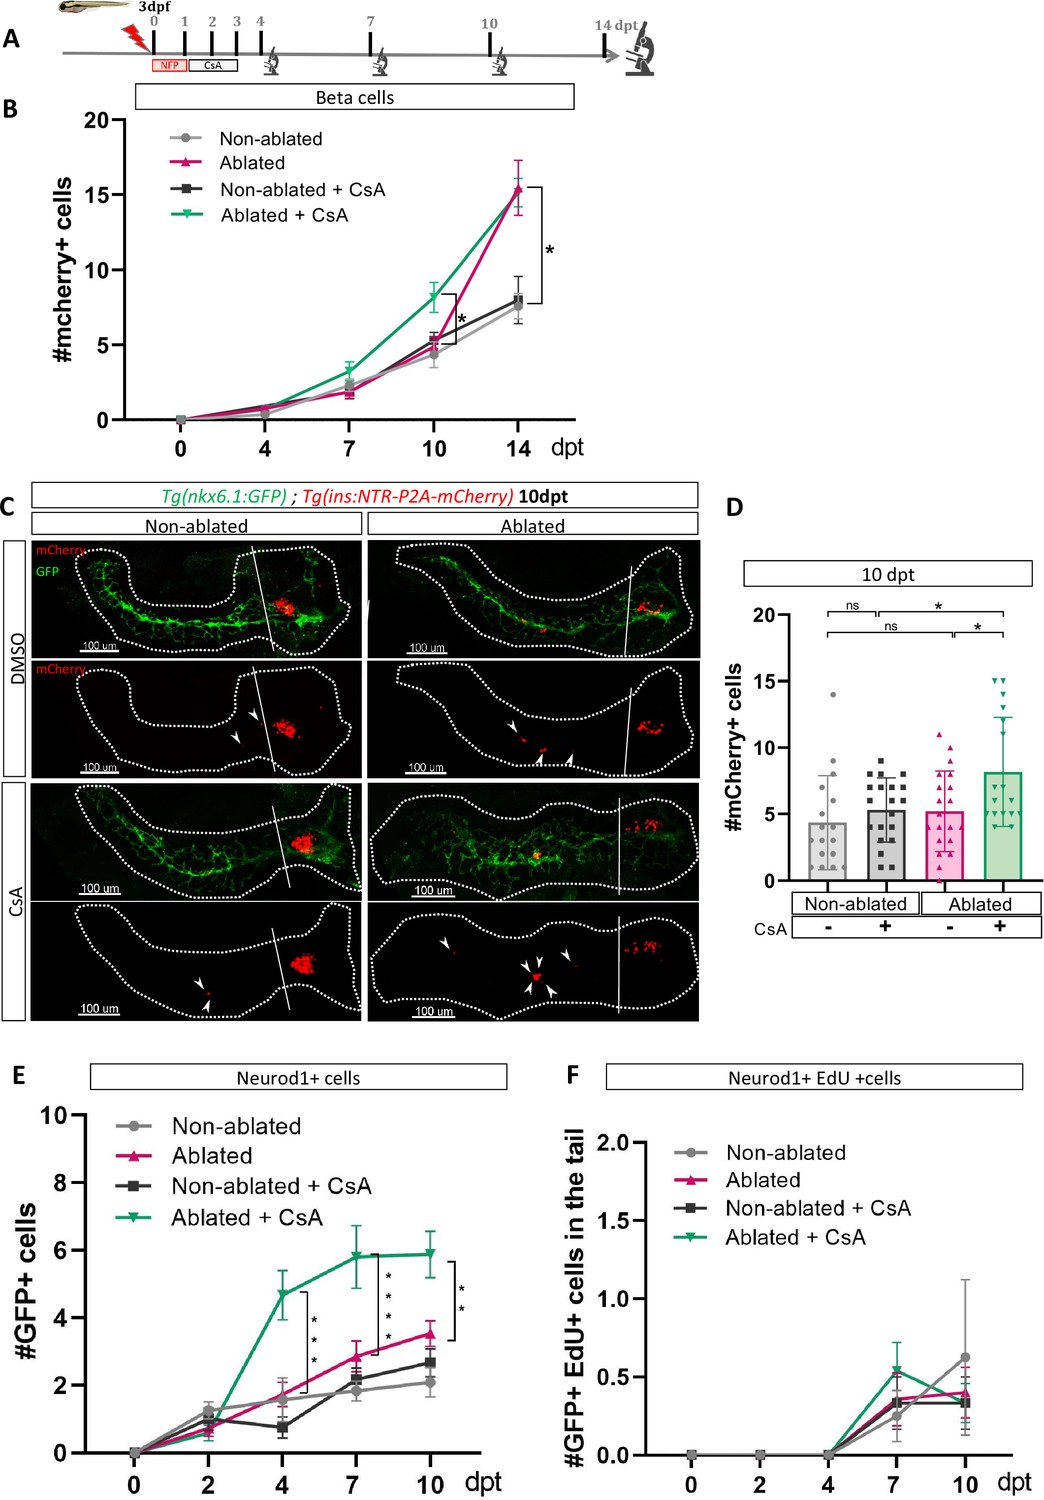
Calcineurin inhibition with Cyclosporin A (CsA) increases the ductal regenerative response.
(A) Experimental design for regeneration test in larvae with CsA treatment. Briefly, after nifurpirinol treatment from 3 to 4 dpf, larvae were treated with CsA from 1 to 3 dpt and fixed and analyzed at 4–7–10 and 14 days post treatment (dpt). The experiment was performed at least two times and the data are combined in these graphs. (B) Graph representing the mean number of mCherry+ beta cells in the pancreatic tail of Tg(ins:NTR-P2A-mCherry); Tg(nkx6.1:GFP) at 0–4–7–10 and 14 dpt. The gray spheres represent non-ablated condition; the pink triangles represent the ablated condition; the black squares CsA condition and inverted green triangles ablated + CsA condition. Data are presented as mean values ± SEM. Two-way ANOVA test with Sidak’s multiple comparisons test, *p-value <0.05. (C) Whole mount fluorescent immunohistochemistry (GFP and mCherry) of the pancreas of Tg(ins:NTR-P2A-mCherry); Tg(nkx6.1:GFP) larvae at 10 dpt. 3D projection (stack) of non-ablated and ablated larvae treated with DMSO or CsA representative samples. The principal islet (PI) and the pancreatic tail are shown. Arrows point out mCherry+ beta cells in the pancreatic tail. Scale 100 µM. (D) Barplot representing the number of number of mCherry+ beta cells in the pancreatic tail of Tg(ins:NTR-P2A-mCherry); Tg(nkx6.1:GFP) larvae at 10 dpt. The gray spheres represent non-ablated condition (n=17) ; the pink triangles represent the ablated condition (n=20); the black squares CsA condition (n=20) and inverted green triangles ablated + CsA condition (n=17). Data are presented as mean values ± standard deviation (SD). Two-way ANOVA with Tukey’s multiple comparison test, *p-value <0.05. (E) Graph representing the mean number of GFP+ neurod1+ cells in the pancreatic tail of Tg(ins:NTR-P2A-mCherry); Tg(neurod1:GFP) at 0–4–7 and 10 dpt. The gray spheres represent non-ablated condition; the pink triangles represent the ablated condition; the black squares CsA condition and inverted green triangles ablated + CsA condition. Data are presented as mean values ± SEM. Two-way ANOVA test with Sidak’s multiple comparisons test, **p-value <0.005; ***p-value <0.0005; ****p-value <0.00005. The experiment was performed at least two times and the data are combined in the graph. (F) Graph representing the mean number of GFP+ neurod1 EdU+ cells in the pancreatic tail of Tg(ins:NTR-P2A-mCherry); Tg(neurod1:GFP) at 0–4–7 and 10 dpt. The gray spheres represent non-ablated condition; the pink triangles represent the ablated condition; the black squares CsA condition and inverted green triangles ablated + CsA condition. Data are presented as mean values ± SEM.
Figure 2—figure supplement 1
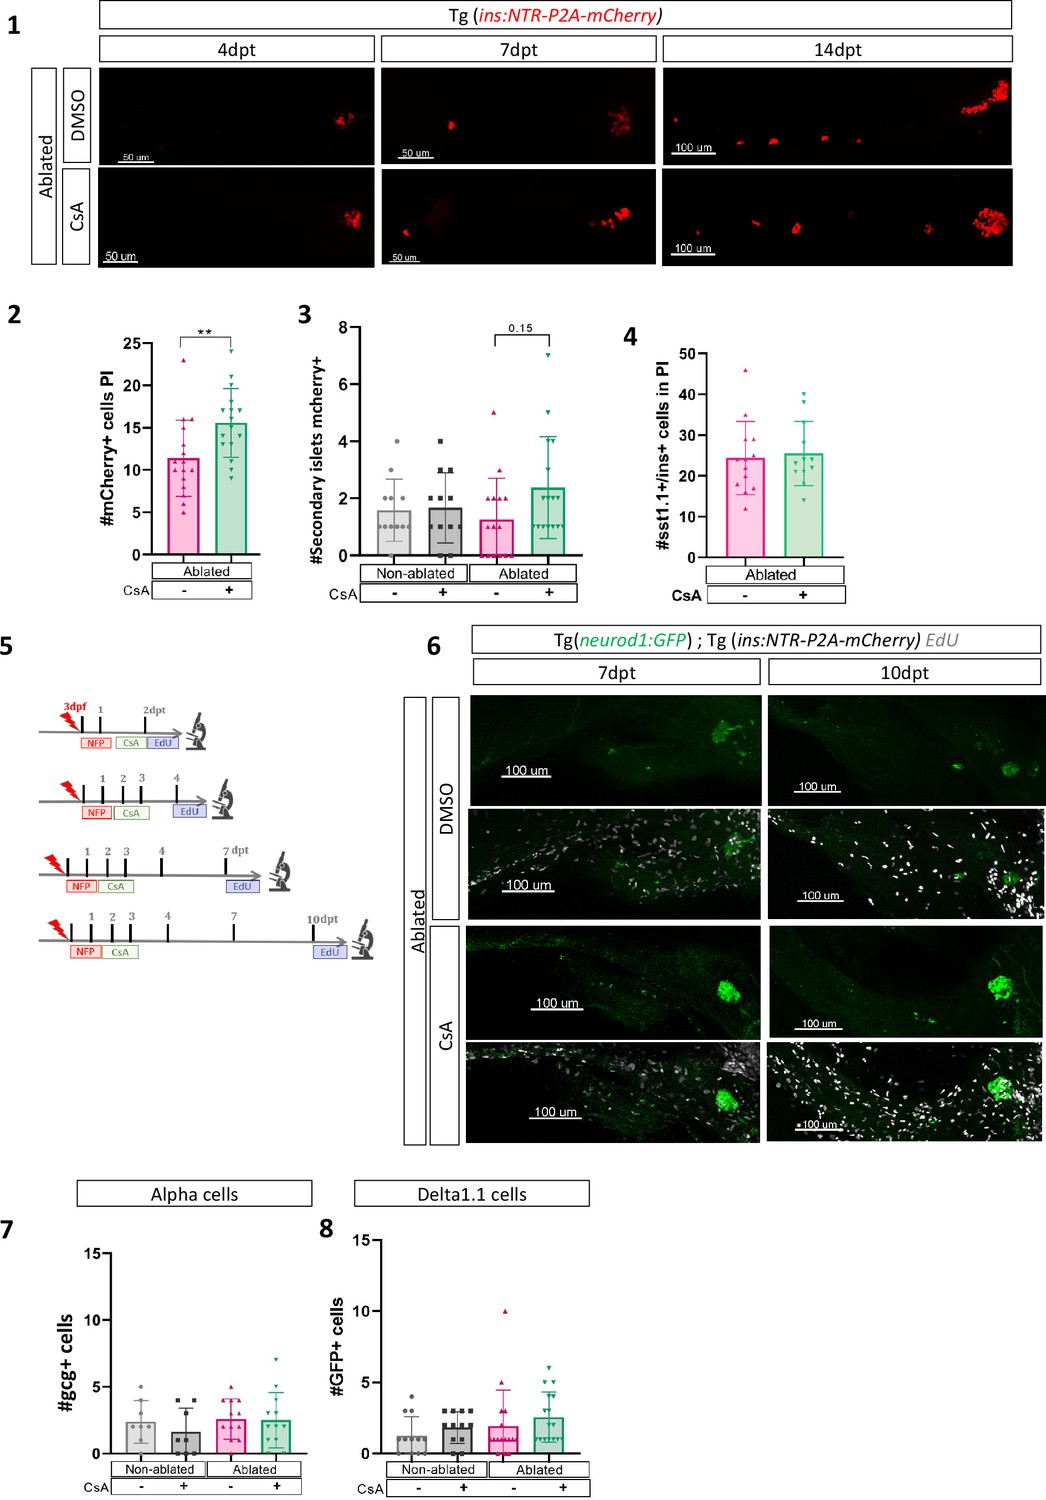
Calcineurin inhibition with Cyclosporin A (CsA) increases the ductal regenerative response.
(1) Whole mount fluorescent immunohistochemistry (mCherry) of the pancreas of Tg(ins:NTR-P2A-mCherry) larvae at 4–7 and 14 dpt. 3D projection (stack) of ablated larvae treated with DMSO or CsA representative samples. The principal islet (PI) and the pancreatic tail are shown. Scale 50 or 100 µM. Barplot representing the number of mCherry+ beta cells in the PI (n=16) (2) and the number of secondary islets of mCherry+ beta cells in the pancreatic tail (n=12 for non ablated and n=16 for ablated conditions) (3) of Tg(ins:NTR-P2A-mCherry); Tg(nkx6.1:GFP) larvae at 10 dpt. Data are presented as mean values ± standard deviation (SD). T-test or two-way ANOVA with Tukey’s multiple comparison test. **p-value <0.005. The experiment was performed at least two times. (4) Barplot representing the number of sst1.1+ mCherry+ bi-hormonal cells in the PI of Tg(ins:NTR-P2A-mCherry);Tg(sst1.1:GFP) larvae at 6 dpt (n=13). Data are presented as mean values ± SD. T-test. The experiment was performed at least two times. (5) Experimental design for 5‐ethynyl‐2′‐deoxyuridine (EdU) assay in larvae. After nifurpirinol (NFP) treatment for 3 to 4 dpf, larvae were exposed to EdU before fixation for analysis. (6) Whole mount fluorescent immunohistochemistry (GFP and EdU) of the pancreas of Tg(ins:NTR-P2A-mCherry); Tg(neurod1:GFP) larvae at 2–4–7 and 10 dpt. 3D projection (stack) of non-ablated and ablated larvae treated with DMSO or CsA representative samples. The PI and the pancreatic tail are shown. Scale 50 µM. Barplot representing the number of gcg+ alpha cells (7); the number of GFP+ sst1.1 delta cells (8); of Tg(ins:NTR-P2A-mCherry); Tg(sst1.1:GFP) larvae at 10 dpt. Gcg was detected by immunohistochemistry (IHC). The gray spheres represent non-ablated condition (n=8;12); the pink triangles represent the ablated condition (n=12;16); the black squares CsA condition (n=8,12) and inverted green triangles ablated + CsA condition. Data are presented as mean values ± SD. Two-way ANOVA with Tukey’s multiple comparison test. **p-value <0.005. The experiment was performed at least two times.
Figure 3
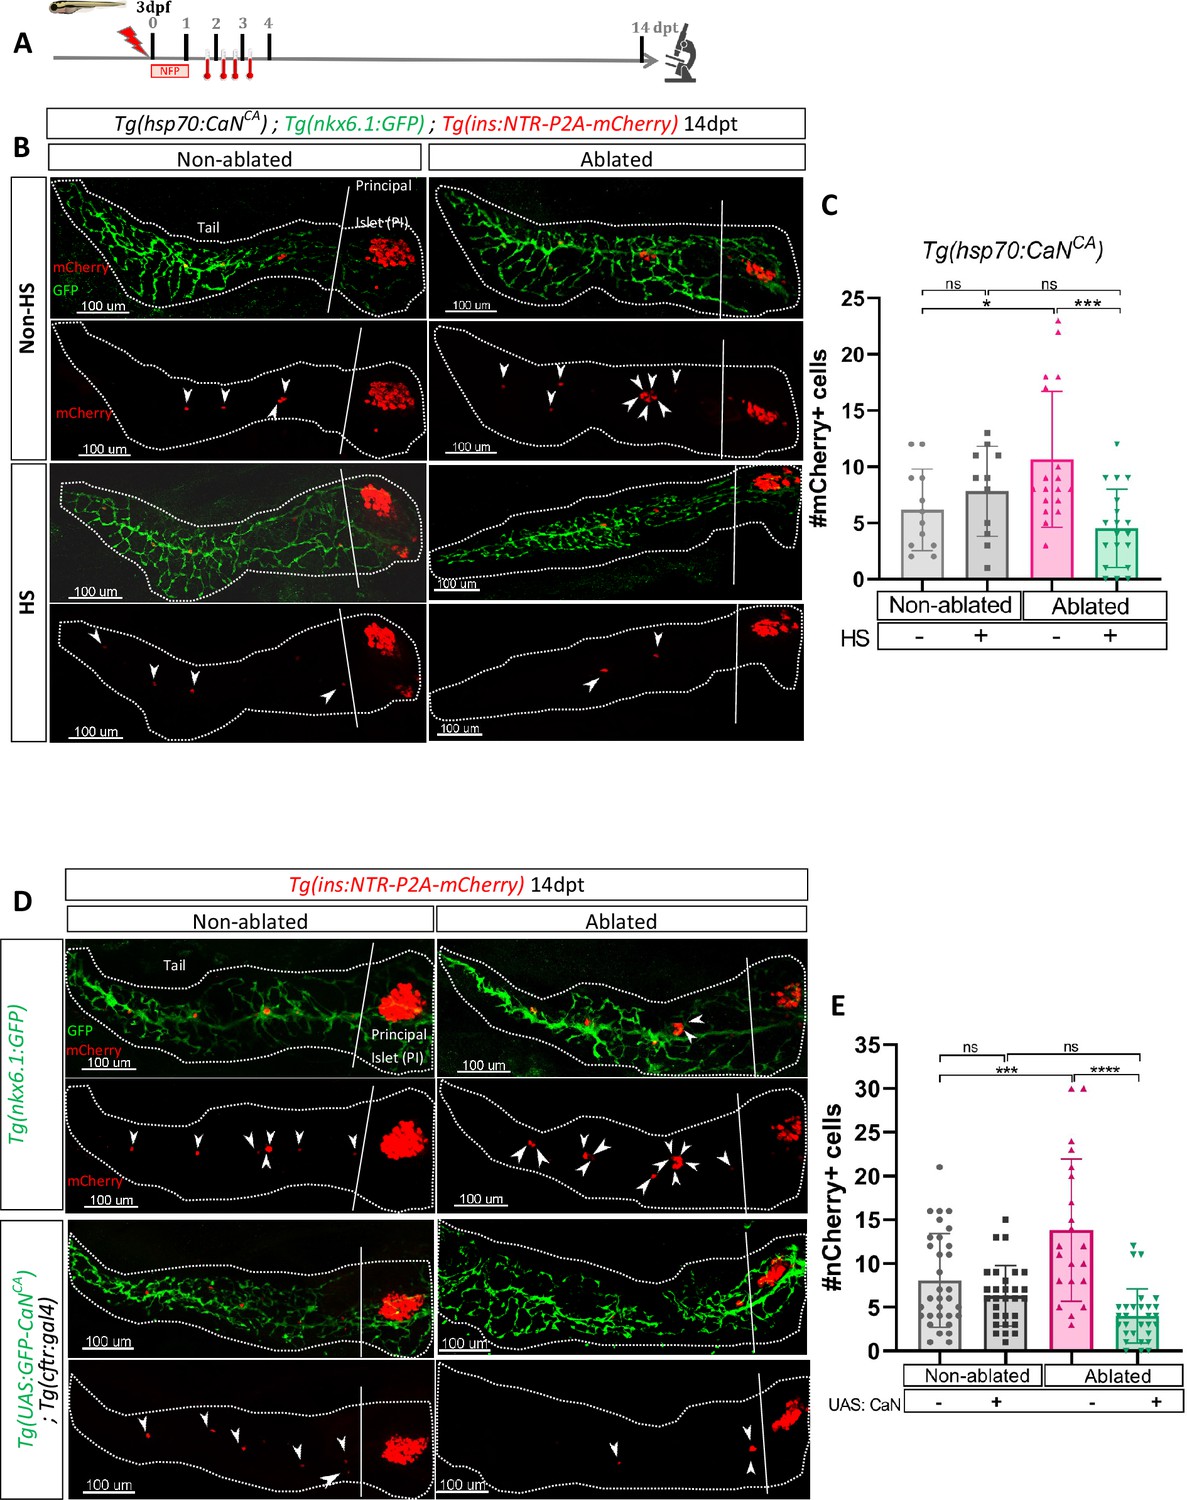
Transgenic mediated overexpression of calcineurin abolish the ductal regenerative response.
(A) Experimental design for regeneration test in larvae with heat-shocks. Briefly, after nifurpirinol treatment from 3 to 4 dpf, four heat-shock were performed from 1 to 3 dpt and larvae were fixed and analyzed at 14 dpt. (B) Whole mount fluorescent immunohistochemistry (GFP and mCherry) of the pancreas of Tg(hsp70:CaNCA); Tg(ins:NTR-P2A-mCherry); Tg(nkx6.1:GFP) larvae at 14 dpt. 3D projection (stack) of one non-ablated and one ablated with or without heat-shock representative samples. The principal islet (PI) and the pancreatic tail are showed. Arrows point out mCherry+ beta cells in the pancreatic tail. Scale 100 µM. (C) Barplot representing the mean number of mCherry+ beta cells in the pancreatic tail of Tg(hsp70:CaNCA); Tg(ins:NTR-P2A-mCherry); Tg(nkx6.1:GFP) larvae at 14 dpt. The gray spheres represent non-ablated condition (n=12); the pink triangles represent the ablated condition (n=18); the black squares heat-shock condition (n=11) and inverted green triangles ablated + heat-shock condition (n=19). Data are presented as mean values ± standard deviation (SD). Two-way ANOVA with Tukey’s multiple comparisons test, *p-value <0.05, ***p-value <0.0005, ns = non-significant. The experiment was performed at least two times and the data are combined in the graph. (D) Whole mount fluorescent immunohistochemistry (GFP and mCherry) of the pancreas of larvae at 14 dpt. 3D projection (stack) of Tg(ins:NTR-P2A-mCherry); Tg(nkx6.1:GFP) one non-ablated and one ablated representative control samples and Tg(UAS:CaNCA); Tg(ins:NTR-P2A-mCherry); Tg(cftr:gal4) one non-ablated and one ablated representative samples. The principal islet (PI) and the pancreatic tail are showed. Arrows point out mCherry+ beta cells in the pancreatic tail. Scale 100 µM. (E) Barplot representing the mean number of mCherry+ beta cells in the pancreatic tail of larvae at 14 dpt. The gray spheres represent non-ablated Tg(ins:NTR-P2A-mCherry); Tg(nkx6.1:GFP) condition (n=31); the pink triangles represent the ablated Tg(ins:NTR-P2A-mCherry); Tg(nkx6.1:GFP) condition (n=21); the black squares non-ablated Tg(UAS:CaNCA); Tg(ins:NTR-P2A-mCherry); Tg(cftr:gal4) condition (n=29) and inverted green triangles ablated Tg(UAS:CaNCA); Tg(ins:NTR-P2A-mCherry); Tg(cftr:gal4) condition. Data are presented as mean values ± SD. Two-way ANOVA with Tukey’s multiple comparison test, ***p-value <0.0005, ****p-value <0.00005, ns = non-significant. The experiment was performed at least two times and the data are combined in the graph.
Figure 4 with 1 supplement
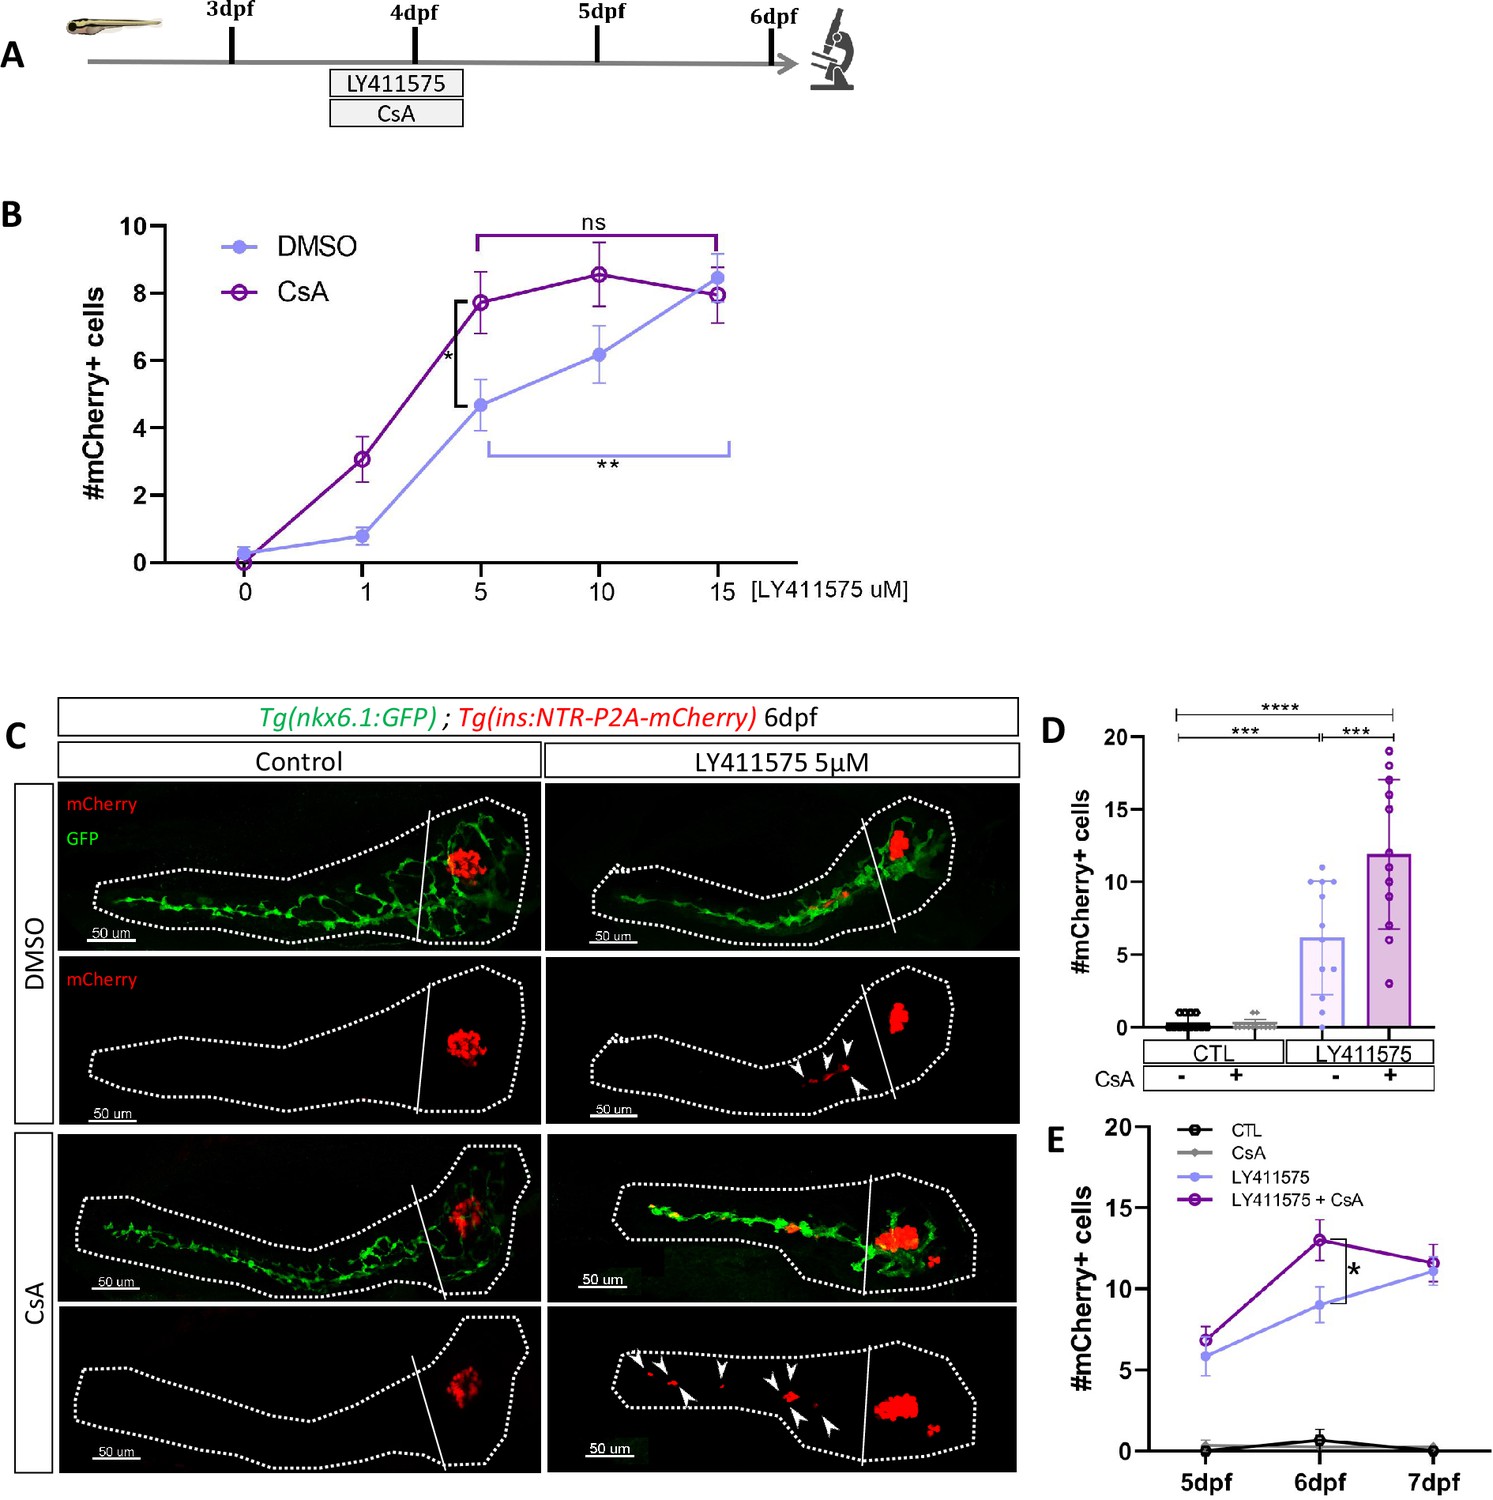
Calcineurin (CaN) repression potentializes the effect of Notch inhibition on beta cell formation.
(A) Experimental design for Notch inhibition test in non-ablated condition. Larvae were treated concomitantly with LY411575 (Notch inhibitor) and Cyclosporin A (CsA) from 3 to 4 dpf and were fixed and analyzed at 6 dpf. (B) Graph representing the mean number of mCherry+ beta cells in the pancreatic tail of Tg(ins:NTR-P2A-mCherry); Tg(nkx6.1:GFP) larvae at 6 dpf depending the concentration of LY411575. The blue dots represent LY411575; and purple combination of LY411575 and CsA. Data are presented as mean values ± SEM. Two-way ANOVA test with Sidak’s multiple comparison test, *p-value <0.05, **p-value <0.05, ns = non-significant. The experiment was performed at least two times and the data are combined in the graph. (C) Whole mount fluorescent immunohistochemistry (GFP and mCherry) of the pancreas of Tg(ins:NTR-P2A-mCherry); Tg(nkx6.1:GFP) larvae at 6 dpf. 3D projection (stack) of one control (without any treatment); one CsA-treated; one LY411757-treated and one with both CsA- and LY411575-treated larvae. The principal islet (PI) and the pancreatic tail are showed. Arrows point out mCherry+ beta cells in the pancreatic tail. Scale 50 µM. (D) Barplot representing the mean number of mCherry+ beta cells in the pancreatic tail of Tg(ins:NTR-P2A-mCherry); Tg(nkx6.1:GFP) larvae at 6 dpf. The black dots represent the control (n=12); gray CsA treatment (n=12);blue LY411575 (n=12); and purple combination of LY411575 and CsA (n=12). Data are presented as mean values ± standard deviation (SD). Two-way ANOVA with Tukey multiple comparison test, ***p-value <0.0005, ****p-value <0.00005. The experiment was performed at least two times and the data are combined in the graph. (E) Graph representing the mean number of mCherry+ beta cells in the pancreatic tail of Tg(ins:NTR-P2A-mCherry); Tg(nkx6.1:GFP) larvae at 5–6–7 dpf. The black dots represent the control; gray CsA treatment;blue LY411575; and purple combination of LY411575 and CsA. Data are presented as mean values ± SEM. Two-way ANOVA test with Sidak’s multiple comparison test, *p-value <0.05. The experiment was performed at least two times and the data are combined in the graph.
Figure 4—figure supplement 1
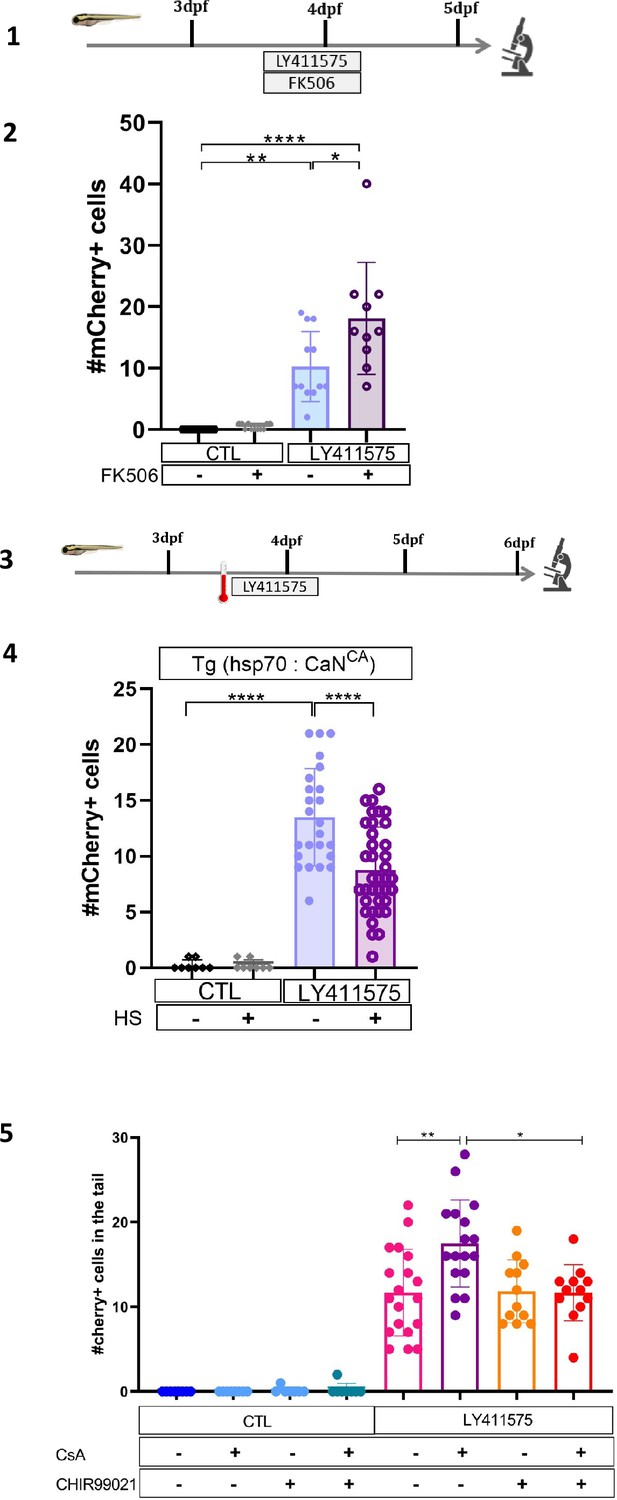
Calcineurin (CaN) repression potentializes the effect of Notch inhibition on beta cell formation.
(1) Experimental design for Notch inhibition test in non-ablated condition. Larvae were treated concomitantly with LY411575 (Notch inhibitor) and FK506 from 3 to 4 dpf and were fixed and analyzed at 5 dpf. (2) Barplot representing the mean number of mCherry+ beta cells in the pancreatic tail of Tg(ins:NTR-P2A-mCherry); Tg(nkx6.1:GFP) larvae at 5 dpf. The black dots represent the control; gray FK506 treatment; blue LY411575; and purple combination of LY411575 and FK506. Data are presented as mean values ± standard deviation (SD). Two-way ANOVA with Tukey multiple comparison test, *p-value <0.05,**p-value <0.005, ****p-value <0.00005. (3) Experimental design for Notch inhibition test in non-ablated condition. Larvae were heat-shocked and then directly treated with LY411575 (Notch inhibitor) from 3 to 4 dpf and were fixed and analyzed at 6 dpf. (4) Barplot representing the mean number of mCherry+ beta cells in the pancreatic tail of Tg(hsp70:CaNCA); Tg(ins:NTR-P2A-mCherry); Tg(nkx6.1:GFP) larvae at 5 dpf. The black dots represent the control; gray heat-shock; blue LY411575; and purple combination of LY411575 and heat-shock. Data are presented as mean values ± SD. Two-way ANOVA with Tukey multiple comparison test, ****p-value <0.00005. (5) Barplot representing the mean number of mCherry+ beta cells in the pancreatic tail of Tg(ins:NTR-P2A-mCherry); Tg(nkx6.1:GFP) larvae at 6 dpf after Notch inhibition (LY411575), CaN inhibition (Cyclosporin A, CsA), and NFATc inhibition (CHIR99021). Data are presented as mean values ± SD. Two-way ANOVA with Tukey multiple comparison test, *p-value <0.05, **p-value <0.005, ****p-value <0.00005.
Figure 5 with 1 supplement
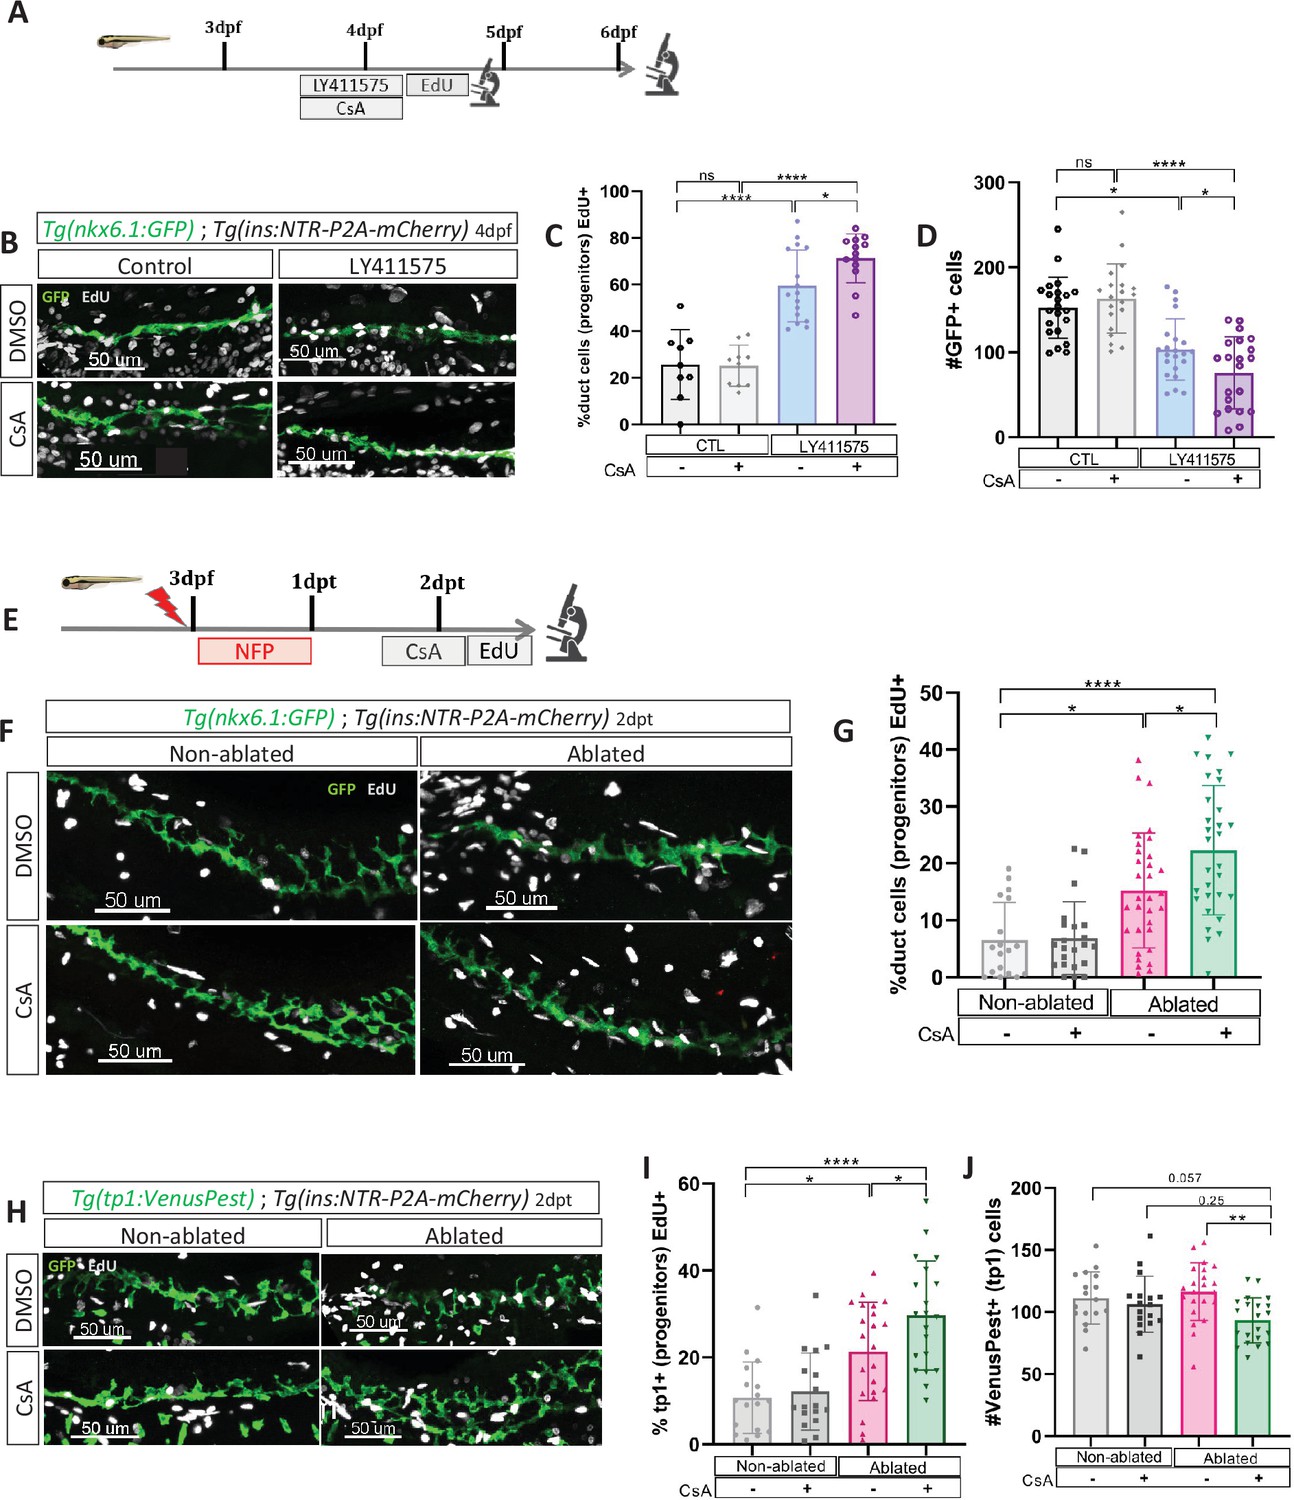
Calcineurin (CaN) repression increases the proportion of ductal proliferating cells.
(A) Experimental design for 5‐ethynyl‐2′‐deoxyuridine (EdU) assay in Notch test. Larvae were treated concomitantly with LY411575 (Notch inhibitor) and Cyclosporin A (CsA) from 3 to 4 dpf and then briefly treated with EdU before fixation and analysis at 4 or 6 dpf. (B) Whole mount fluorescent immunohistochemistry (GFP and EdU) of the pancreatic tail of Tg(ins:NTR-P2A-mCherry); Tg(nkx6.1:GFP) larvae at 4 dpf. 3D projection (stack) of one control (without any treatment), one with CsA only, one with LY411575 only and one with both CsA and LY411757 representative samples. Scale 50 µM. (C) Barplot representing the percentage of GFP+ ductal cells which incorporated EdU+ in pancreatic tail of Tg(ins:NTR-P2A-mCherry); Tg(nkx6.1:GFP) larvae for the Notch test. The black dots represent the control (n=9); gray CsA treatment (n=10); blue LY411575 (n=16); and purple combination of LY411575 and CsA (n=16). Data are presented as mean values ± standard deviation (SD). T-test. Two-way ANOVA test with Tukey’s multiple comparisons test, *p-value <0.05; ****p-value <0.00005; ns = non-significant. The experiment was performed at least two times. (D) Barplot representing the number of GFP+ ductal cells which in pancreatic tail of Tg(ins:NTR-P2A-mCherry); Tg(nkx6.1:GFP) larvae at 6 dpf for the Notch test. The black dots represent the control (n=22); gray CsA treatment (n=20); blue LY411575 (n=21); and purple combination of LY411575 and CsA (n=21). Data are presented as mean values ± SD. T-test. Two-way ANOVA test with Tukey’s multiple comparisons test, *p-value <0.05; ****p-value <0.00005; ns = non-significant. The experiment was performed at least two times and the data are combined in the graph. (E) Experimental design for EdU assay in regeneration. Larvae were treated with nifurpirinol for beta cell ablation from 3 to 4 dpf then with CsA from 4 to 5 dpf and then briefly treated with EdU before fixation and analysis. (F) Whole mount fluorescent immunohistochemistry (GFP and EdU) of the pancreatic tail of Tg(ins:NTR-P2A-mCherry); Tg(nkx6.1:GFP) larvae at 5 dpf. 3D projection (stack) of one representative sample of non-ablated or ablated with or without CsA are shown. Scale 50 µM. (G) Barplot representing the percentage of GFP+ ductal cells which incorporated EdU+ in pancreatic tail of Tg(ins:NTR-P2A-mCherry); Tg(nkx6.1:GFP) larvae at 5 dpf. The gray spheres represent non-ablated condition (n=18); the pink triangles the ablated condition (n=32); the black squares CsA condition (n=22) and inverted green triangles ablated + CsA condition (n=30). Data are presented as mean values ± SD. Two-way ANOVA test with Tukey’s multiple comparisons test, *p-value <0.05; ****p-value <0.00005; ns = non-significant. The experiment was performed at least two times and the data are combined in the graph. (H) Whole mount fluorescent immunohistochemistry (VenusPest and EdU) of the pancreatic tail of Tg(ins:NTR-P2A-mCherry); Tg(tp1:VenusPest) larvae at 5 dpf. 3D projection (stack) of one representative sample of non-ablated or ablated with or without CsA are shown. Scale 50 µM. (I) Barplot representing the percentage of GFP+ ductal cells which incorporated EdU+ in pancreatic tail of Tg(ins:NTR-P2A-mCherry); Tg(tp1:VenusPest) larvae at 5 dpf. The gray spheres represent non-ablated condition (n=17); the pink triangles the ablated condition (n=22); the black squares CsA condition (n=18) and inverted green triangles ablated + CsA condition (n=20). Data are presented as mean values ± SD. Two-way ANOVA test with Tukey multiple comparisons test, *p-value <0.05; ****p-value <0.00005; ns means non-significant. The experiment was performed at least two times and the data are combined in the graph. (J) Barplot representing the number of VenusPest+ ductal cells which incorporated EdU+ in pancreatic tail of Tg(ins:NTR-P2A-mCherry); Tg(tp1:VenusPest) larvae at 5 dpf. The gray spheres represent non-ablated condition (n=17); the pink triangles the ablated condition (n=21); the black squares CsA condition (n=17) and inverted green triangles ablated + CsA condition (n=21). Data are presented as mean values ± SD. Two-way ANOVA test with Tukey’s multiple comparisons test, **p-value <0.005. The experiment was performed at least two times and the data are combined in the graph.
Figure 5—figure supplement 1
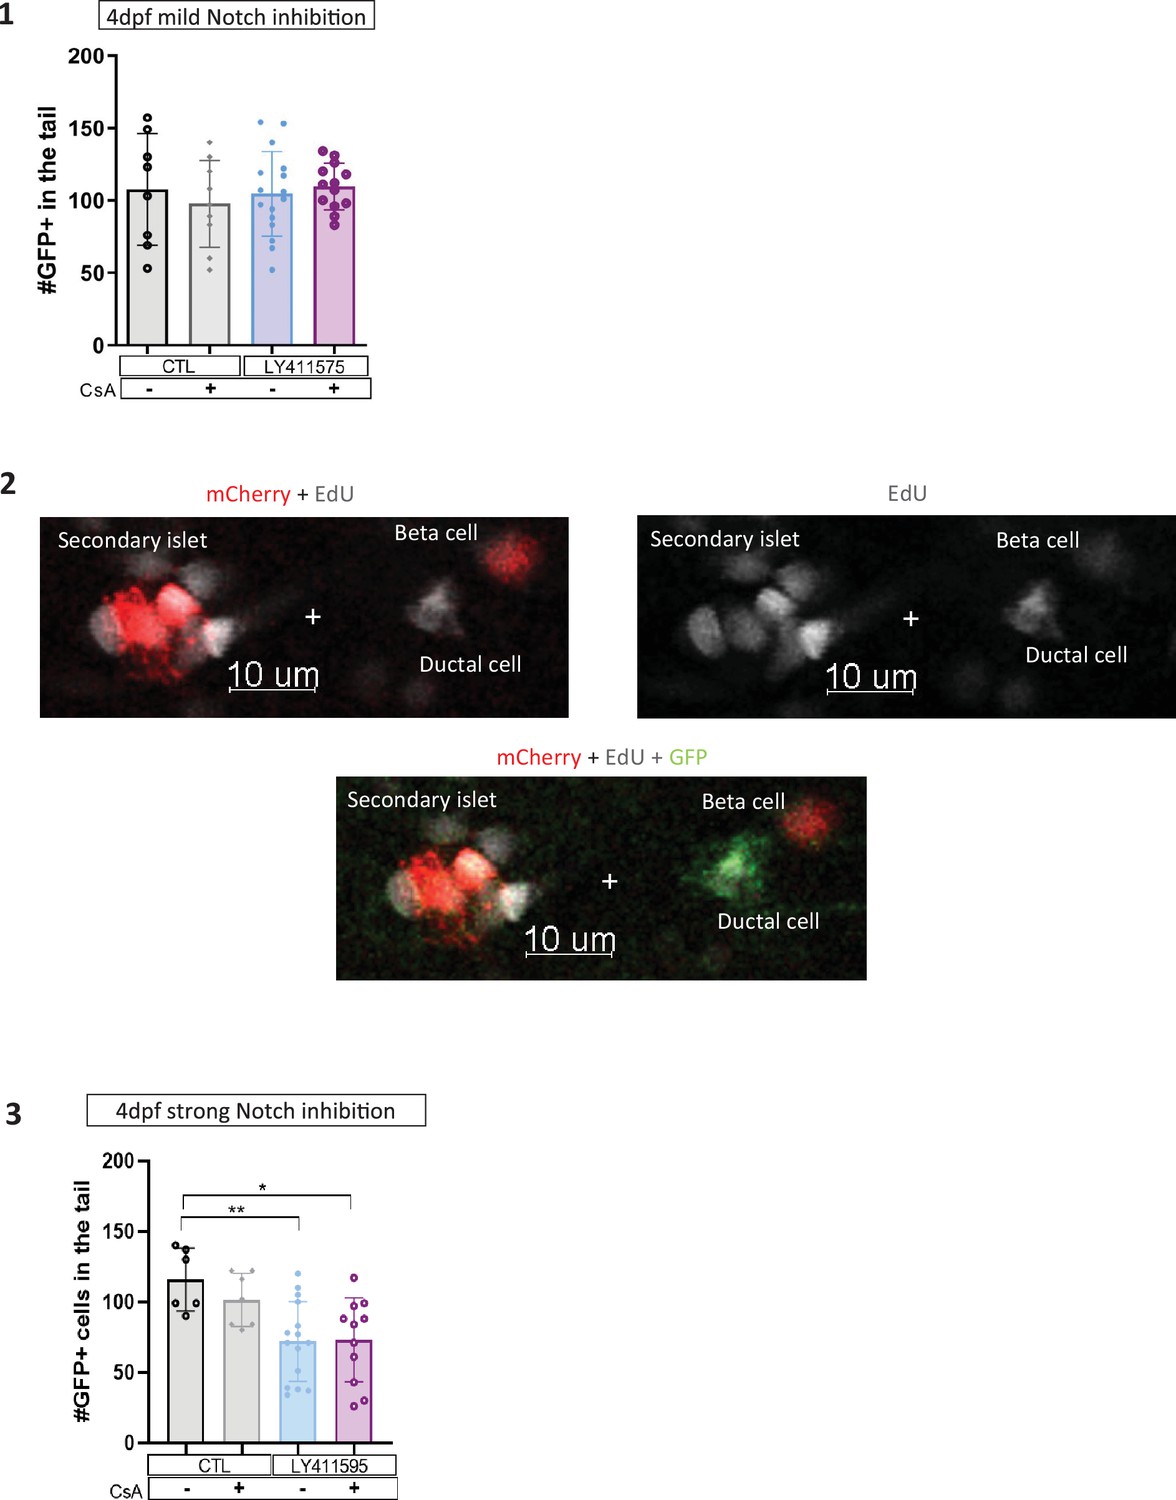
Calcineurin (CaN) repression increases the proportion of duct proliferating cells.
(1–3) Barplot representing the number of GFP+ ductal cells which in pancreatic tail of Tg(ins:NTR-P2A-mCherry); Tg(nkx6.1:GFP) larvae at 4 dpf for the Notch test. (1) Mild Notch inhibition with LY411575 5 µM and (3) stronger Notch inhibition with LY411575 15 µM. The black dots represent the control; gray Cyclosporin A (CsA) treatment; blue LY411575; and purple combination of LY411575 and CsA. Data are presented as mean values ± standard deviation (SD). Two-way ANOVA test with Tukey’s multiple comparisons test, *p-value <0.05; **p-value <0.005; ns = non-significant. (2) Z-plan pictures of Tg (nkx6.1:GFP); Tg (ins:NTR*-mCherry) larvae that were treated at 3 dpf with both CsA 1 µM and LY411575 5 µM. At 4 dpf, the larvae were exposed to 5‐ethynyl‐2′‐deoxyuridine (EdU) 4 mM during 8 hr, before analysis at 6 dpf.
Figure 6 with 1 supplement
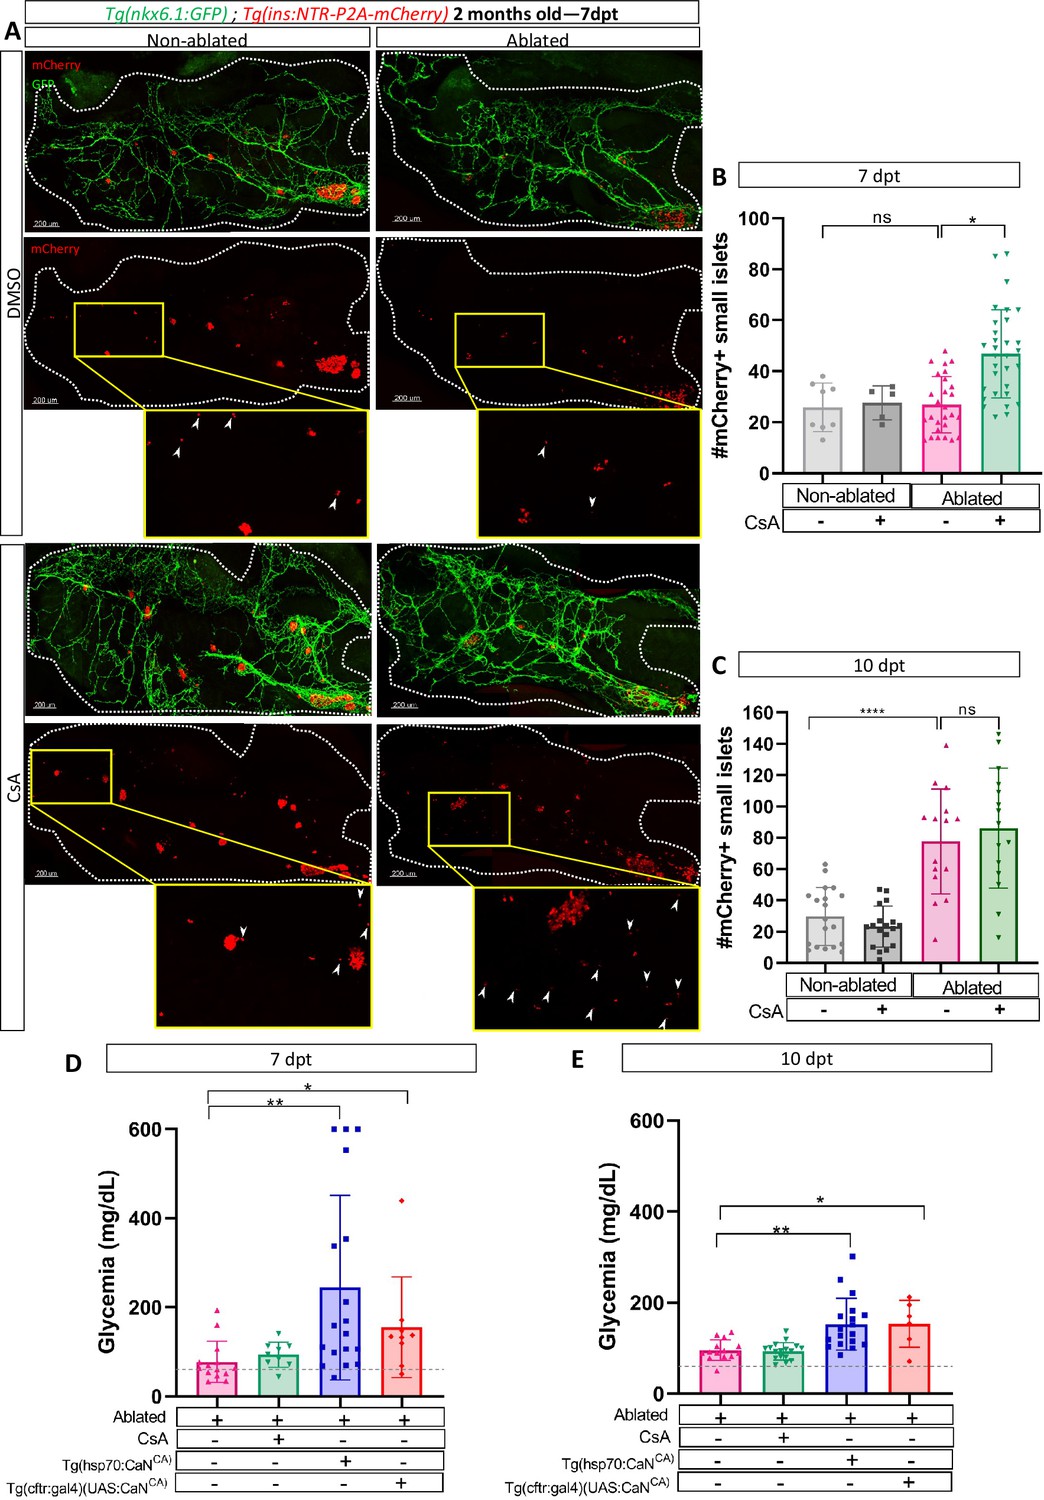
Calcineurin (CaN) regulation is important in juveniles/adults and necessary for correct glycemia recovery.
(A) Whole mount fluorescent immunohistochemistry (GFP and mCherry) of the pancreas of Tg(ins:NTR-P2A-mCherry); Tg(nkx6.1:GFP) 2-month-old zebrafish at 7 dpt. 3D projection (stack) of non-ablated and ablated larvae treated with DMSO or Cyclosporin A (CsA) representative samples. The principal islet (PI) and the pancreatic tail are shown. Zoom from section of the pancreatic tail are shown, arrows point out mCherry+ beta cells in these zoom. Scale 200 µM. (B–C) Barplot representing the number of number of mCherry+ small secondary islets (≤5 cells) in the pancreatic tail of Tg(ins:NTR-P2A-mCherry); Tg(nkx6.1:GFP) 2-month-old zebrafish at 7 (B) and 10 dpt (C). The gray spheres represent non-ablated condition (n=8; 18); the pink triangles represent the ablated condition (n=27; 15); the black squares CsA condition (n=5; 17), and inverted green triangles ablated + CsA condition (n=30; 15). Data are presented as mean values ± standard deviation (SD). Two-way ANOVA with Tukey’s multiple comparison test, *p-value <0.05, ****p-value <0.00005. The experiment was performed at least two times and the data are combined in the graph. (D–E) Barplot representing the glycemia (mg/dl) of Tg(ins:NTR-P2A-mCherry); adult zebrafish at 7 (D) and 10 dpt (E). The pink triangles represent the ablated condition (n=13; 14); the inverted green triangles ablated + CsA condition (n=9; 17); the blue squares Tg(hsp70:CaNCA) after heat-shocks (n=17; 18); the orange lozenges Tg(UAS:CaNCA); Tg(cftr:gal4) (n=9; 6). The gray line represents the mean glycemia of controls (non-ablated) fish. Data are presented as mean values ± SD. One-way ANOVA with Tukey’s multiple comparison test, *p-value <0.05; **p-value <0.005. Experiment performed in one technical replicate with several biological replicates (n visible on the graph).
Figure 6—figure supplement 1
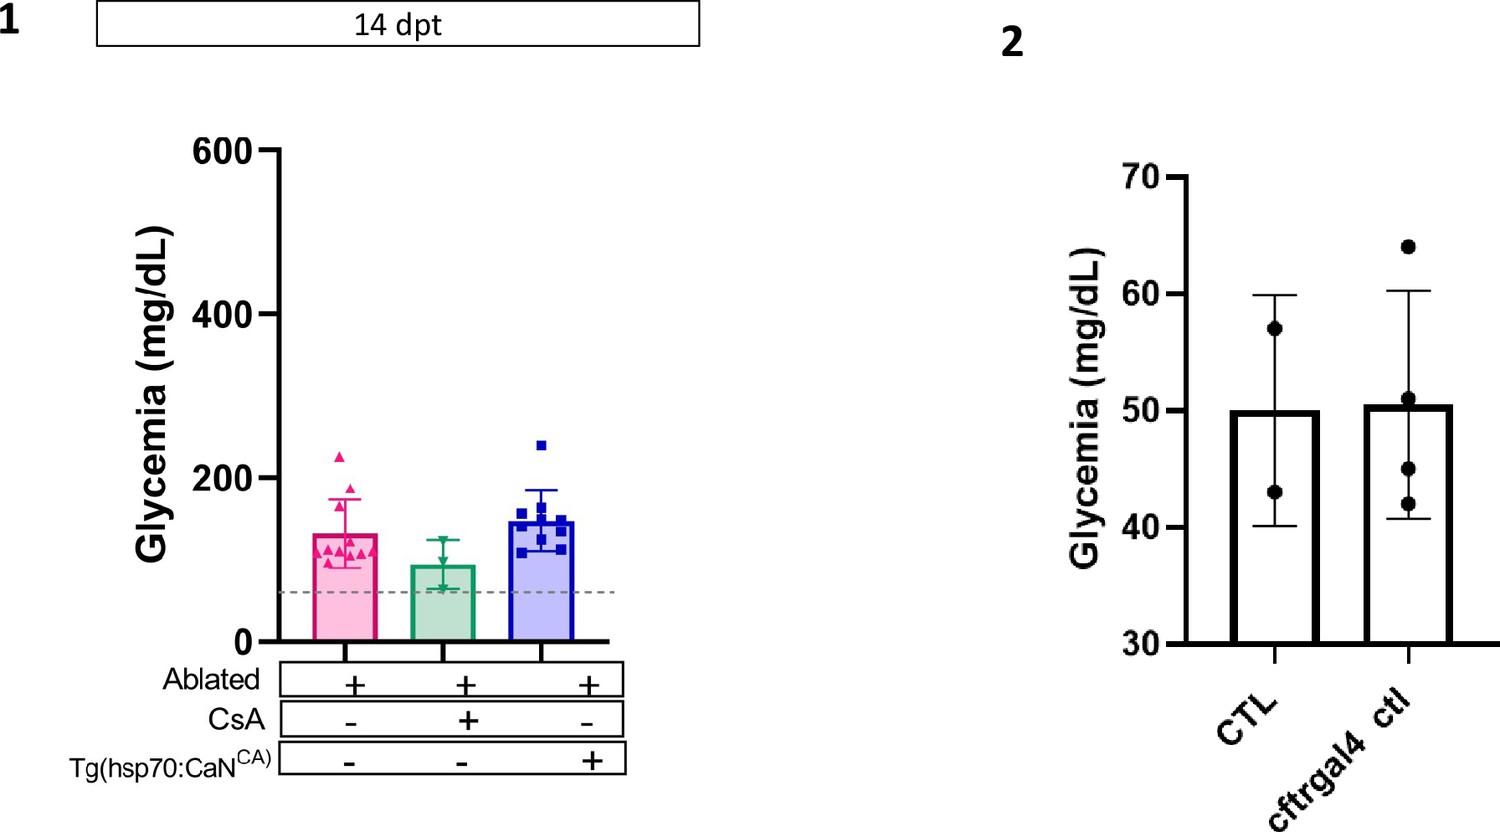
Calcineurin (CaN) regulation is important in juveniles/adults and necessary for correct glycemia recovery.
(1) Barplot representing the glycemia (mg/dl) of Tg(ins:NTR-P2A-mCherry); adult zebrafish at 14 dpt. The pink triangles represent the ablated condition; the inverted green triangles ablated + Cyclosporin A (CsA) condition; the blue squares Tg(hsp70:CaNCA) after heat-shocks. The gray line represents the mean glycemia of controls (non-ablated) fish. Data are presented as mean values ± standard deviation (SD). (2) Barplot representing the glycemia (mg/dl) of Tg(ins:NTR-P2A-mCherry); and Tg(UAS:CaNCA); Tg(cftr:gal4) in non-ablated adult zebrafish. Data are presented as mean values ± SD.
Figure 7
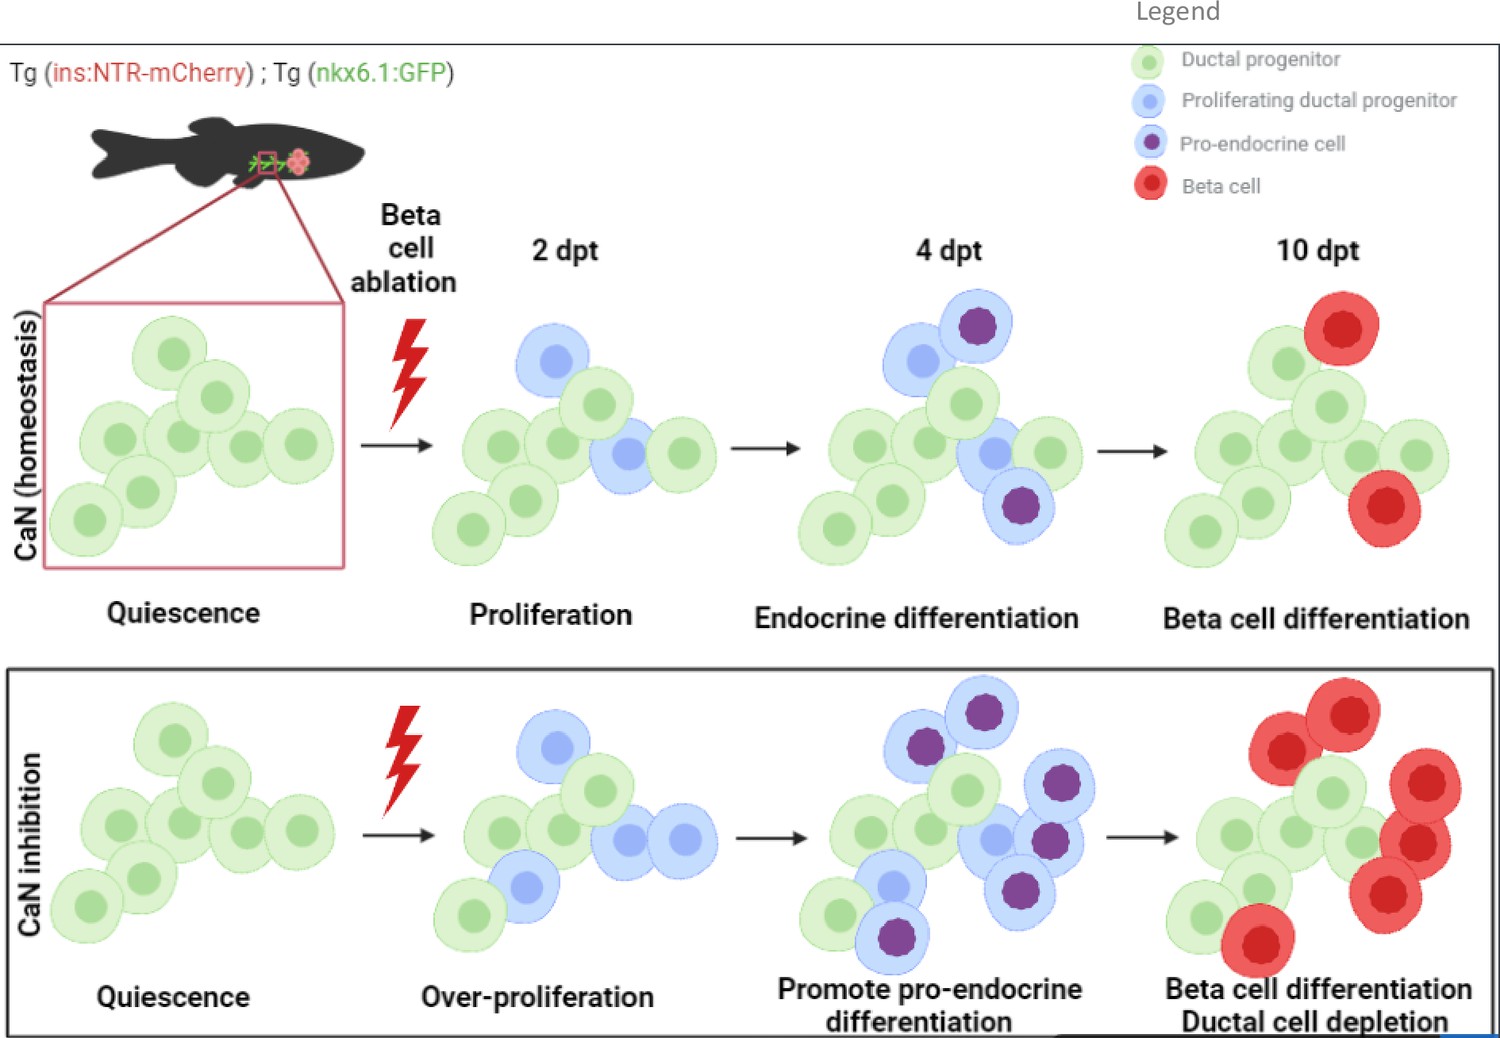
Model of calcineurin (CaN) action on ductal progenitors to regenerate beta cells.
Under physiological conditions, the behavior of the ductal progenitors is determined by Notch signaling. CaN is active in these progenitors and enable a proper control between proliferation and differentiation. When CaN in repressed, more ductal progenitors enter in the cell cycle (2 dpt) and switch to a mode of proliferation leading to differentiation of the two daughter cells (4 dpt), as more pro-endocrine cells are formed. The result is a exhaustion of the progenitors and a premature beta cell differentiation (10 dpt).
Tables
Key resources table
| Reagent type (species) or resource | Designation | Source or reference | Identifiers | Additional information |
|---|---|---|---|---|
| Genetic reagent (Danio rerio) | TgBAC(nkx6. 1:eGFP)ulg004 | PMID:26329351 | ZFIN: ZDB-ALT-160205-1 | |
| Genetic reagent (Danio rerio) | Tg(ins:NTR-P2A-mCherry)ulg034 | PMID:29663654 | ZFIN: ZDB-ALT-171122-9 | |
| Genetic reagent (Danio rerio) | Tg(cftr:gal4) | PMID:25592226 | ZFIN: ZDB-FISH-150901-25442 | |
| Genetic reagent (Danio rerio) | Tg(tp1: VenusPest) | PMID:22492351 | ZFIN: ZDB-FISH-150901-8023 | |
| Genetic reagent (Danio rerio) | Tg(hsp70:eGFP- P2A-ppp3ccaCA) ulg068 | This paper | See Zebrafish husbandry and generation of the Tg(hsp70:eGF P-P2A-ppp3ccaCA) zebrafish line | |
| Genetic reagent (Danio rerio) | Tg(UAS:eGFP-P2A-ppp3ccaCA) ulg069 | This paper | See Zebrafish husbandry and generation of the Tg(UAS:eGFP- P2A-ppp3ccaCA) zebrafish line | |
| Antibody | Anti-GFP (chicken polyclonal) | Aves Labs | GFP-1020 | 1:1000 |
| Antibody | Anti-mCherry/ds Red (rabbit polyclonal) | Clontech | 632496 | 1:500 |
| Antibody | Anti-glucagon (mouse polyclonal) | Sigma | G2654 | 1:300 |
| Antibody | Goat polyclonal anti-Chicken IgY (H+L), Alexa Fluor 488 | Invitrogen | A-11039 | 1:750 |
| Antibody | Goat polyclonal anti-dsred 568 | Invitrogen | 1:750 | |
| Antibody | Goat polyclonal anti- Mouse IgG (H+L) Cross-Adsorbed Secondary Antibody, Alexa Fluor 633 | Invitrogen | 1:750 | |
| Chemical compound | Nifurpirinol (NFP) | Sigma-Aldrich | 32439 | |
| Chemical compound | Metronidazole (MTZ) | Sigma-Aldrich | M1547 | |
| Chemical compound | Cyclosporine A (CsA) | Selleckchem | S2286 | |
| Chemical compound | LY411575 | Sigma-Aldrich | SML0506 | |
| Chemical compound | CHIR990211 | Sellekchem | CT99021 | |
| Commercial assay or kit | Gateway LR Clonase II Enzyme mix | Invitrogen | 11791020 | |
| Commercial assay or kit | Gateway BP Clonase II Enzyme mix | Invitrogen | 11789020 | |
| Sequence-based reagent | IM369 | This paper | PCR primer | gaagaaaaccccggtcctatgtcgacgaaagagccgaaag |
| Sequence-based reagent | IM380 | This paper | PCR primer | ccttacacattcccgtcagtgc |
| Sequence-based reagent | IM371 | This paper | PCR primer | CGGCTCTTTCGTCGACATAGGACCGGGGTTTTCTTCCACG |
| Sequence-based reagent | O226 | This paper | PCR primer | GCCACCATGGTGAGCAAGGGCGAGGA |
| Sequence-based reagent | IM370 | This paper | PCR primer | ttattagatcttatttctgatcacctcctt |
| Sequence-based reagent | IM459 | This paper | PCR primer | cacacgaattcgccgccaccATGGTGAGCAAGGGCGAG |
| Sequence-based reagent | IM460 | This paper | PCR primer | ggatcggtcgagatccttacGATCTTATTTCTGATCACCTCCTTACG |
| Sequence-based reagent | IM457 | This paper | PCR primer | GTAAGGATCTCGACCGATCCTG |
| Sequence-based reagent | IM458 | This paper | PCR primer | GGTGGCGGCGAATTCGTG |
| Commercial assay or kit | Nextera XT DNA Library kit | Illumina | FC-131–1024 | |
| Commercial assay or kit | Click-iT EdU Cell Proliferation Kit for Imaging, Alexa Fluor 647 dye | Invitrogen | C10340 | |
| Software, algorithm | Imaris | Bitplane (http://www.bitplane.com/imaris/imaris) | RRID:SCR_007370 | Version 9.5 |
| Software, algorithm | GraphPad Prism | GraphPad Prism (https://graphpad.com) | RRID:SCR_015807 | Version 8 |
| Software, algorithm | DESeq2 | DESeq2 (https://bioconductor.org/packages/release/bioc/html/DESeq2.html) | RRID:SCR_015687 | |
| Software, algorithm | WebGestalt | WebGestalt (http://www.webgestalt.org/) | RRID:SCR_006786 |
Additional files
-
Supplementary file 1
Table of DE (differentially expressed) genes od ductal cells 3 days after beta cell ablation compared to non-ablated controls.
- https://cdn.elifesciences.org/articles/88813/elife-88813-supp1-v1.xlsx
-
Supplementary file 2
Table of ORA analysis results with data from Supplementary file 1.
- https://cdn.elifesciences.org/articles/88813/elife-88813-supp2-v1.xlsx
-
MDAR checklist
- https://cdn.elifesciences.org/articles/88813/elife-88813-mdarchecklist1-v1.pdf
Download links
A two-part list of links to download the article, or parts of the article, in various formats.
Downloads (link to download the article as PDF)
Open citations (links to open the citations from this article in various online reference manager services)
Cite this article (links to download the citations from this article in formats compatible with various reference manager tools)
Negative cell cycle regulation by calcineurin is necessary for proper beta cell regeneration in zebrafish
eLife 12:RP88813.
https://doi.org/10.7554/eLife.88813.4


