Atypical peripheral actin band formation via overactivation of RhoA and nonmuscle myosin II in mitofusin 2-deficient cells
- Department of Biological Sciences, Purdue University West Lafayette, United States
- Cell and Molecular Physiology, Loyola University Chicago, United States
- Weldon School of Biomedical Engineering, Purdue University West Lafayette, United States
- Advanced Research Institute of Multidisciplinary Science, Beijing Institute of Technology, China
- Davidson School of Chemical Engineering, Purdue University West Lafayette, United States
- School of Mechanical Engineering, Purdue University West Lafayette, United States
- Department of Animal Sciences, Purdue University West Lafayette, United States
- Department of Agricultural and Biological Engineering, Purdue University West Lafayette, United States
- Purdue Institute for Integrative Neuroscience, Purdue University West Lafayette, United States
- Purdue Institute for Inflammation, Immunology & Infectious Disease, Purdue University West Lafayette, United States
- Purdue University Center for Cancer Research, Purdue University West Lafayette, United States
Figures
Figure 1 with 1 supplement
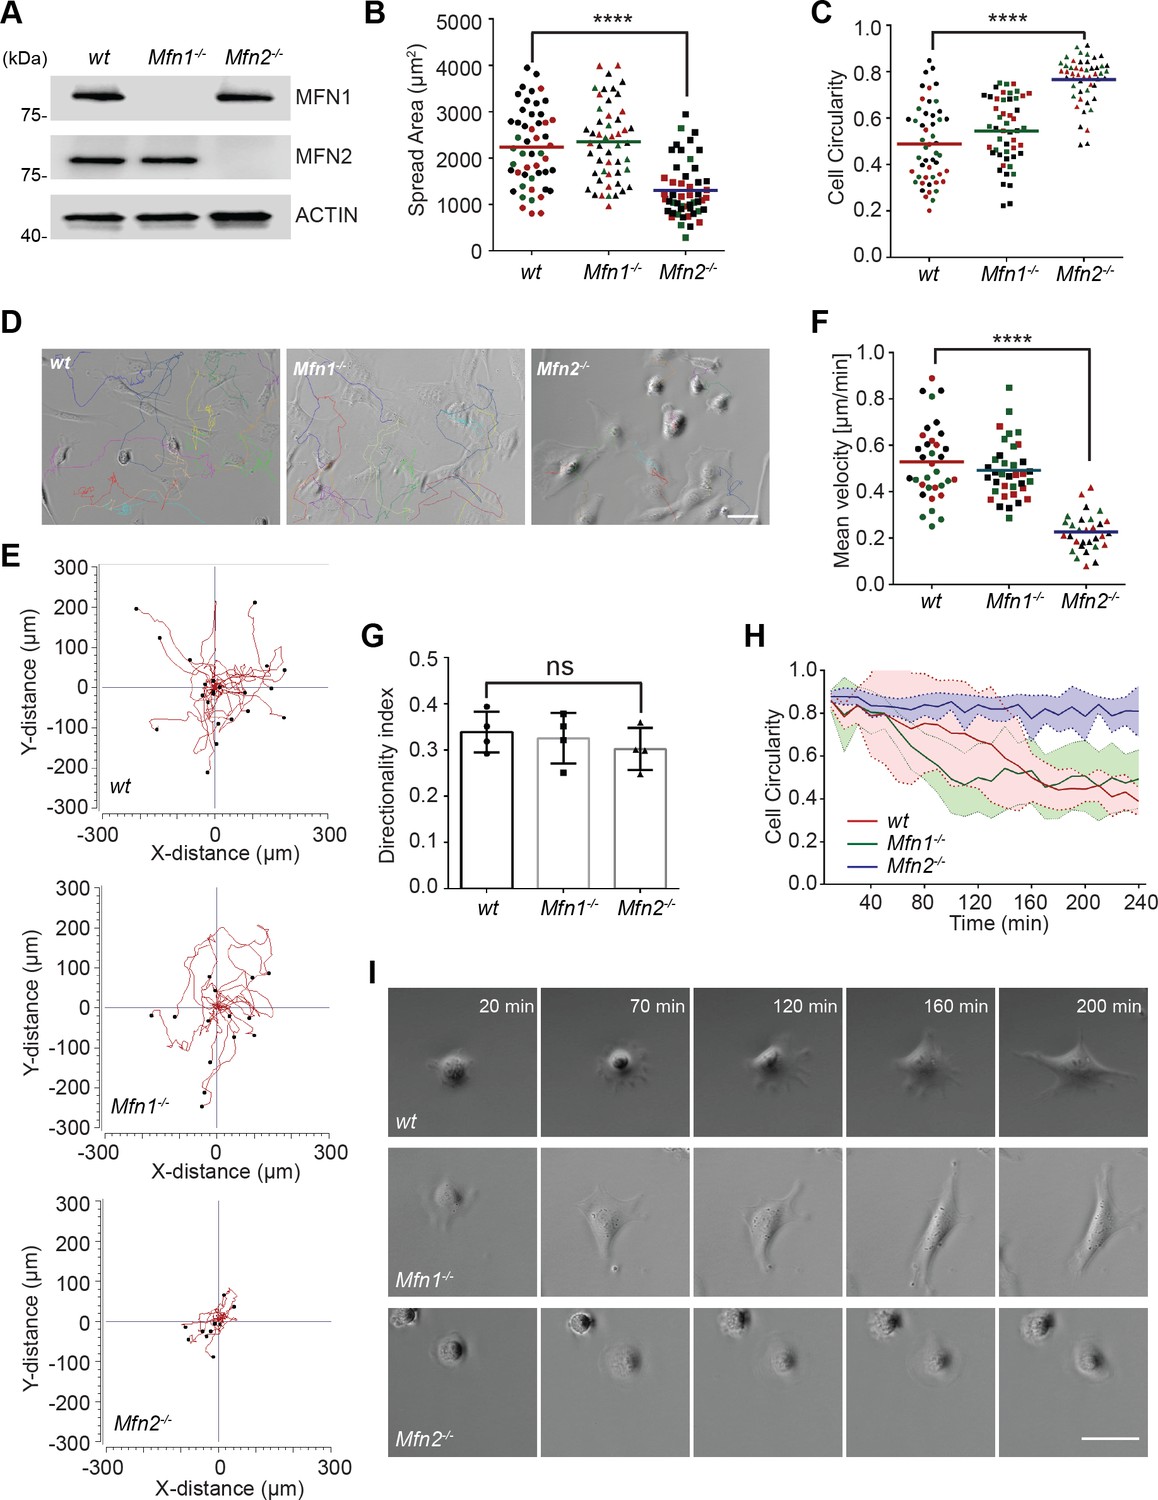
MFN2 regulates random migration and spreading in mice embryonic fibroblasts (MEFs).
(A) Western blot determining the expression levels of MFN1 and MFN2 in wt, Mfn2-null, and Mfn1-null MEFs. (B, C) Spread area (B) and circularity (C) of wt, Mfn1-null, and Mfn2-null MEFs after overnight culture. The individual points represent individual MEF cells. (D–G) representative images with individual tracks (D), Wind–Rose plots (E), quantification of velocity (F), and directionality (G) of wt, Mfn1-null, and Mfn2-null MEFs cells during random migration. (H, I) Quantification of cell circularity (H) and representative images (I) of indicated MEFs during cell spreading at indicated time points. Data are presented as mean ± SD in (F) and were pooled from a total of 18 cells in three independent experiments. Bars represent arithmetic means ± SD. One representative result of three biological repeats is shown in (A, D, E, I). Data are pooled from three independent experiments in (B, C, F, G). n = 50 cells are tracked and counted in (B, C). N = 30 cells are quantified in (D). ****p<0.0001 (one-way ANOVA). Scale bars: 50 µm.
-
Figure 1—source data 1
Original blots and figures with the bands labeled for Figure 1A.
- https://cdn.elifesciences.org/articles/88828/elife-88828-fig1-data1-v3.zip
Figure 1—figure supplement 1

MFN2 deficiency changes mice embryonic fibroblast (MEF) morphology.
(A) Immunofluorescence of F-actin (phalloidin), α-tubulin, and mitochondria (Mito Tracker) in wt, Mfn1-null, and Mfn2-null MEFs. (B–D) Cre-induced Mfn2 disruption in MEFs from Mfn2flox/flox mice displays similar cell morphology as Mfn2-null MEFs (B). (E, F) Cell spread area (E) and circularity (F) of indicated cells in Figure 2J. The individual points represent the circularity or spread area of individual MEF cells in (C–F). (G) Cells were transfected with mitochondria probes. Mfn2-null MEFs and Mfn2-null MEFs overexpressing MFN1 display large and fragmented mitochondria, while MFN2 re-expression in Mfn2-null MEFs restored mitochondria tubules. One representative result of three biological repeats is shown in (A, B). n = 25 cells in each group are quantified in (C–-F). ***p≤0.001, ****p<0.0001 (one-way ANOVA). Scale bars: 10 µm in (A, B), 20 µm in (G).
Figure 2 with 1 supplement
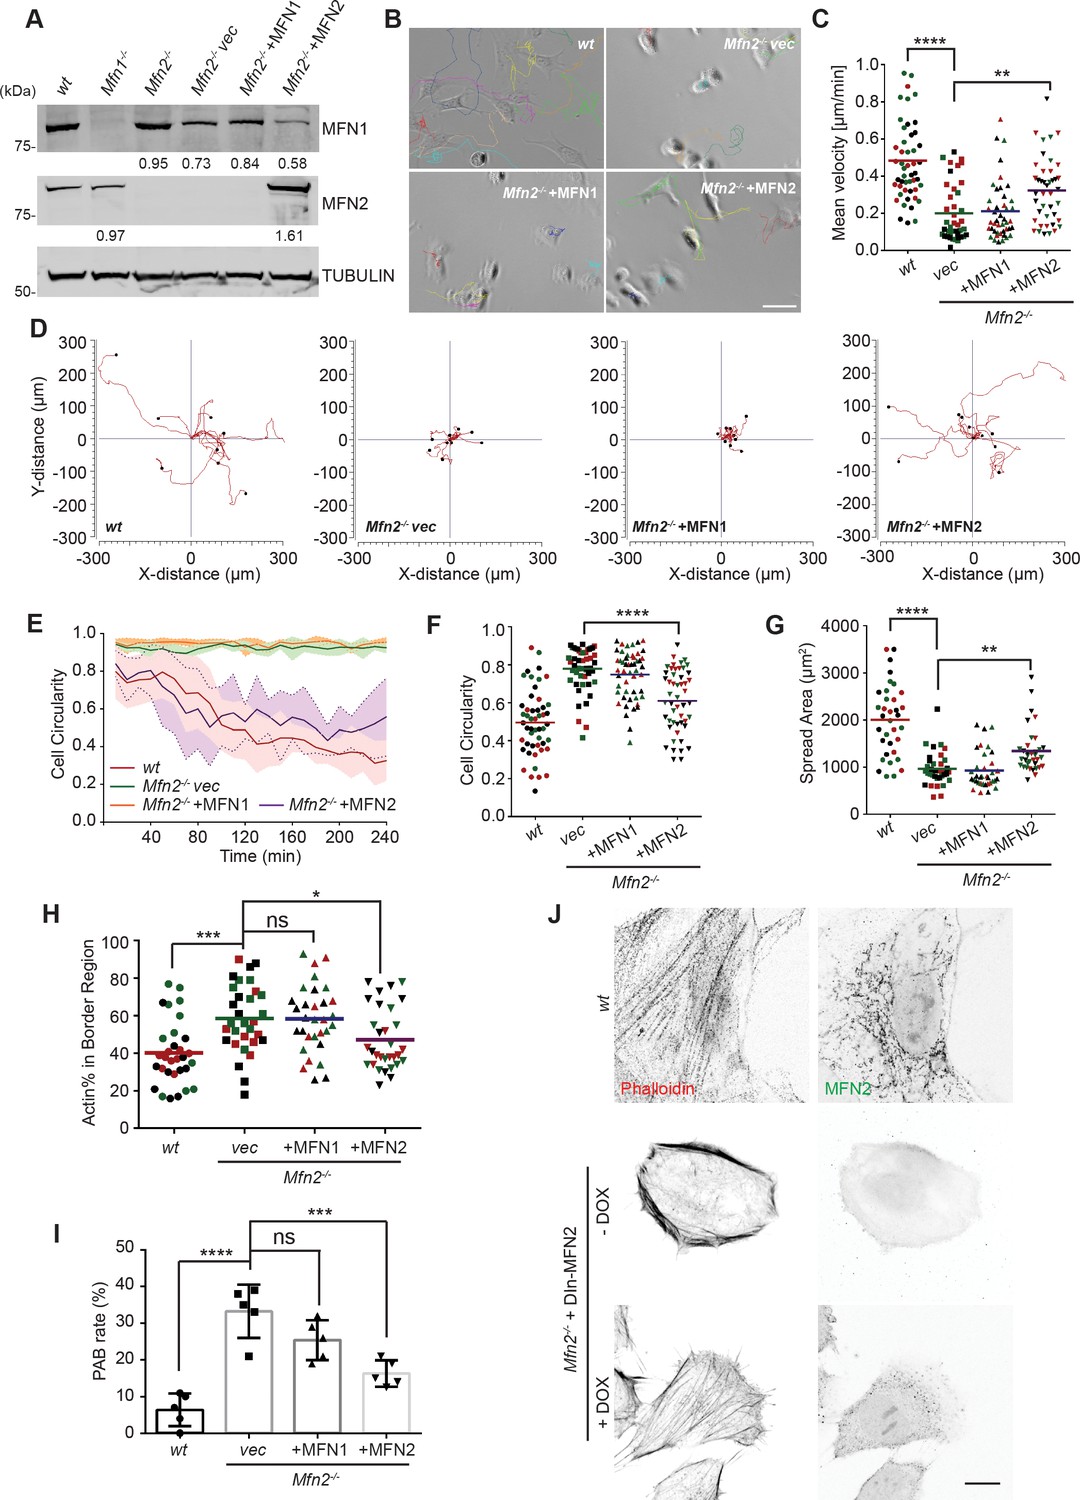
Cre expression of MFN2 rescues random migration and spreading defects in Mfn2-null mice embryonic fibroblasts (MEFs).
(A) Western blot determining the expression level of MFN1 and MFN2 in indicated MEF cells. Percentages of knockdown or re-expression were calculated by normalizing the intensity to vinculin first, then normalizing to the wt group. (B–D) Representative images with individual tracks (B), quantification of velocity (C), and Wind–Rose plots (D) of indicated MEF cells during random migration. (E) Quantification of cell circularity of wt and Mfn2-null MEFs with vec, MFN1, or MFN2 re-expressed during spreading at indicated time points. Data are presented as mean ± SD in (E) (n = 5). (F, G) Cell circularity (F) and cell spreading area (G) of indicated MEFs measured after overnight culture. (H, I) Percentage of Actin abundance in the cell border region (H) and peripheral actin band (PAB) cell percentage in each view was quantified using our custom algorism (see Figure 2-figure supplement 1). (J) Representative images of wt, Mfn2-null with doxycycline-induced MEF2 (DIn-MFN2) MEF cells treated with or without doxycycline for 48 hr. The cells are immunostained with phalloidin and MFN2. One representative result of three biological repeats is shown in (A, B, D, H). Data are pooled from three independent experiments in (C, F–I). n = 30 cells are tracked and counted in (C); n = 35 cells are quantified in (F–H). Five different views from three biological repeats are quantified in (I). *p≤0.05, **p≤0.01, ***p≤0.001, ****p<0.0001 (one-way ANOVA in C, E, F, unpaired t-test in H, I). Scale bars: 50 µm in (B), 10 µm in (J).
-
Figure 2—source data 1
Original blots and figures with the bands labeled for Figure 2A.
- https://cdn.elifesciences.org/articles/88828/elife-88828-fig2-data1-v3.zip
Figure 2—figure supplement 1

Custom algorithm to identify cells with peripheral actin band (PAB).
(A) Representative images of wt and Mfn2-null mice embryonic fibroblasts (MEFs) stained with F-actin (phalloidin) under a 40× microscope. Scale bar: 50 µm. (B) FiloQuant plugin in ImageJ was used to identify cell edges and the actin cytoskeleton. The algorithm defines a 20-pixel stroke inside the cell border as the ‘border region’ and then calculates the percentage of the actin cytoskeleton in the border region and the cell circularity. If the circularity is higher than 0.6, and more than 50% of the actin cytoskeleton is in the border region, we consider the cell a PAB cell.
Figure 3 with 2 supplements
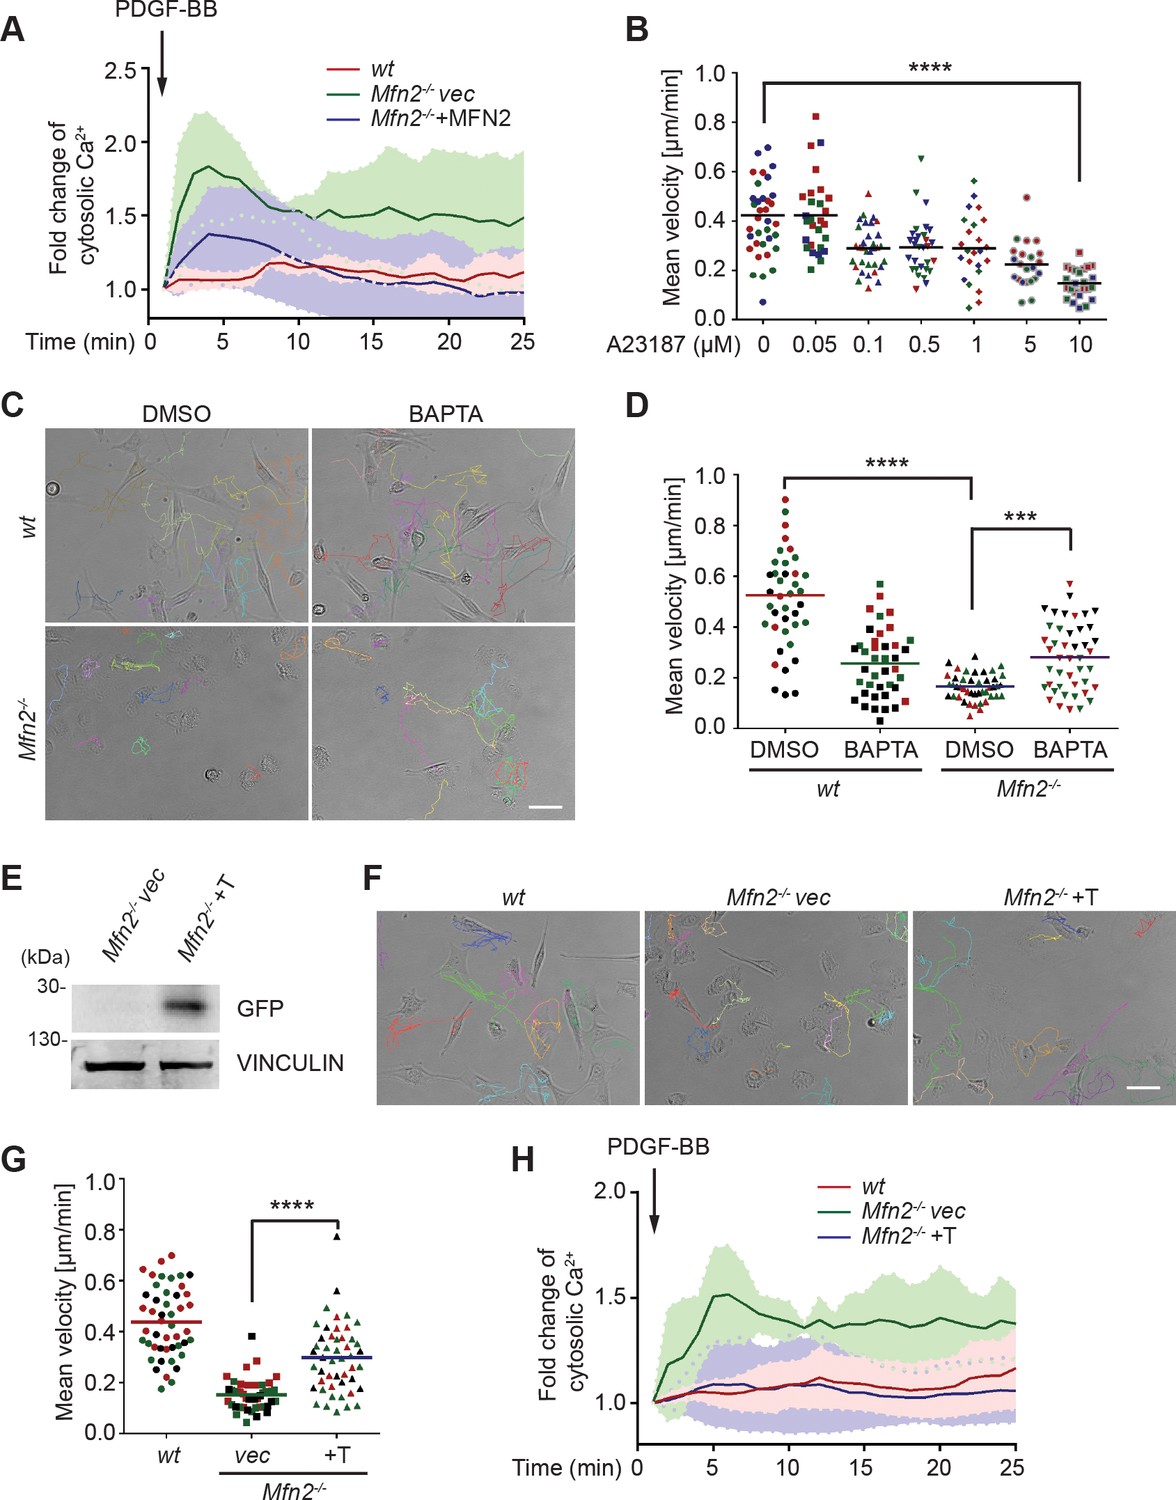
CMFN2 regulates random migration through cytosolic Ca2+ and endoplasmic reticulum (ER)-mitochondria tether.
(A) Fluo-4 recordings of cytosolic Ca2+ in the indicated cell lines after PDGF-BB stimulation. (B) Quantification of the velocity of wt mice embryonic fibroblast (MEF) random migration in the presence of vehicle or different concentrations of the Ca2+ ionophore A23187. (C, D) Representative images with individual tracks (C) and quantification of velocity (D) of wt or Mfn2-null MEFs during random migration with or without the presence of the intracellular calcium chelator BAPTA-AM. (E) Western blot of GFP in indicated cell lines. Mfn2-/-+T, Mfn2-null MEFs with synthetic ER-GFP-mitochondria tether construct. (F, G) Representative images with individual tracks (F) and quantification of velocity (G) of indicated MEF cells. (H) Fluo-4 recordings of cytosolic Ca2+ in the indicated cell lines after PDGF-BB stimulation. The individual points in (B, D, G) are the mean speeds for individual MEF cells. Data are presented as mean ± SD in (A, H). Data are pooled from three independent experiments in (A, H). One representative result of three biological repeats is shown in (C–G). n = 30 cells are tracked and counted in (B, G). n = 35 cells are tracked and measured in (D). ***p<0.001, ****p<0.0001 (one-way ANOVA in B, G and two-way ANOVA in D). Scale bars: 50 µm.
-
Figure 3—source data 1
Original blots and figures with the bands labeled for Figure 3E.
- https://cdn.elifesciences.org/articles/88828/elife-88828-fig3-data1-v3.zip
Figure 3—figure supplement 1

Excessive cytosolic Ca2+ is insufficient to phenocopy the peripheral actin band (‘PAB’) structure in wt mice embryonic fibroblasts (MEFs), while the cytosolic Ca2+ inhibitor BAPTA rescues ‘PAB’ structure in Mfn2-null MEFs.
(A, B) Fluo-4 recordings of cytosolic Ca2+ in the indicated cell lines after PDGF-BB stimulation. (C) Immunofluorescence of F-actin (phalloidin) in wt MEFs treated with DMSO or A23187, and Mfn2-null MEFs treated with DMSO or BAPTA. (D, E) Percentage of actin abundance in the cell border region (D) and the percentage of PAB cells (E) identified by our custom algorism in indicated cell lines. Data are pooled from three independent experiments and presented as mean ± SD in (A, B). n = 28 cells are measured in (D). Five different views from two biological repeats are quantified in (E). *p≤0.1, ****p<0.0001 (two-way ANOVA in D, E). Scale bars: 20 µm.
Figure 3—figure supplement 2

Expression of MEF2 or an endoplasmic reticulum (ER)-mitochondria tether construct restores ER-mitochondria contacts and mitochondria morphology.
(A, B) Cells were co-transfected with the ER probe and SPLICSL Mt-ER long P2A probe. Representative images of SPLICSL probe (green) and ER (red) (A) and quantification (B) of SPLICSL contacts by 3D rendering of complete z-stacks. (C) Peripheral actin band (PAB) cell percentage was quantified using our custom algorithm in Mfn2-null mice embryonic fibroblasts (MEFs) with vec or ER-mito tethering construct. n = 7 cells from two independent experiments. Five different views from two biological repeats are quantified in (C). *p≤0.1, ***p≤0.001 (one-way ANOVA in B, Student’s t-test in C). Scale bars: 20 µm.
Figure 4
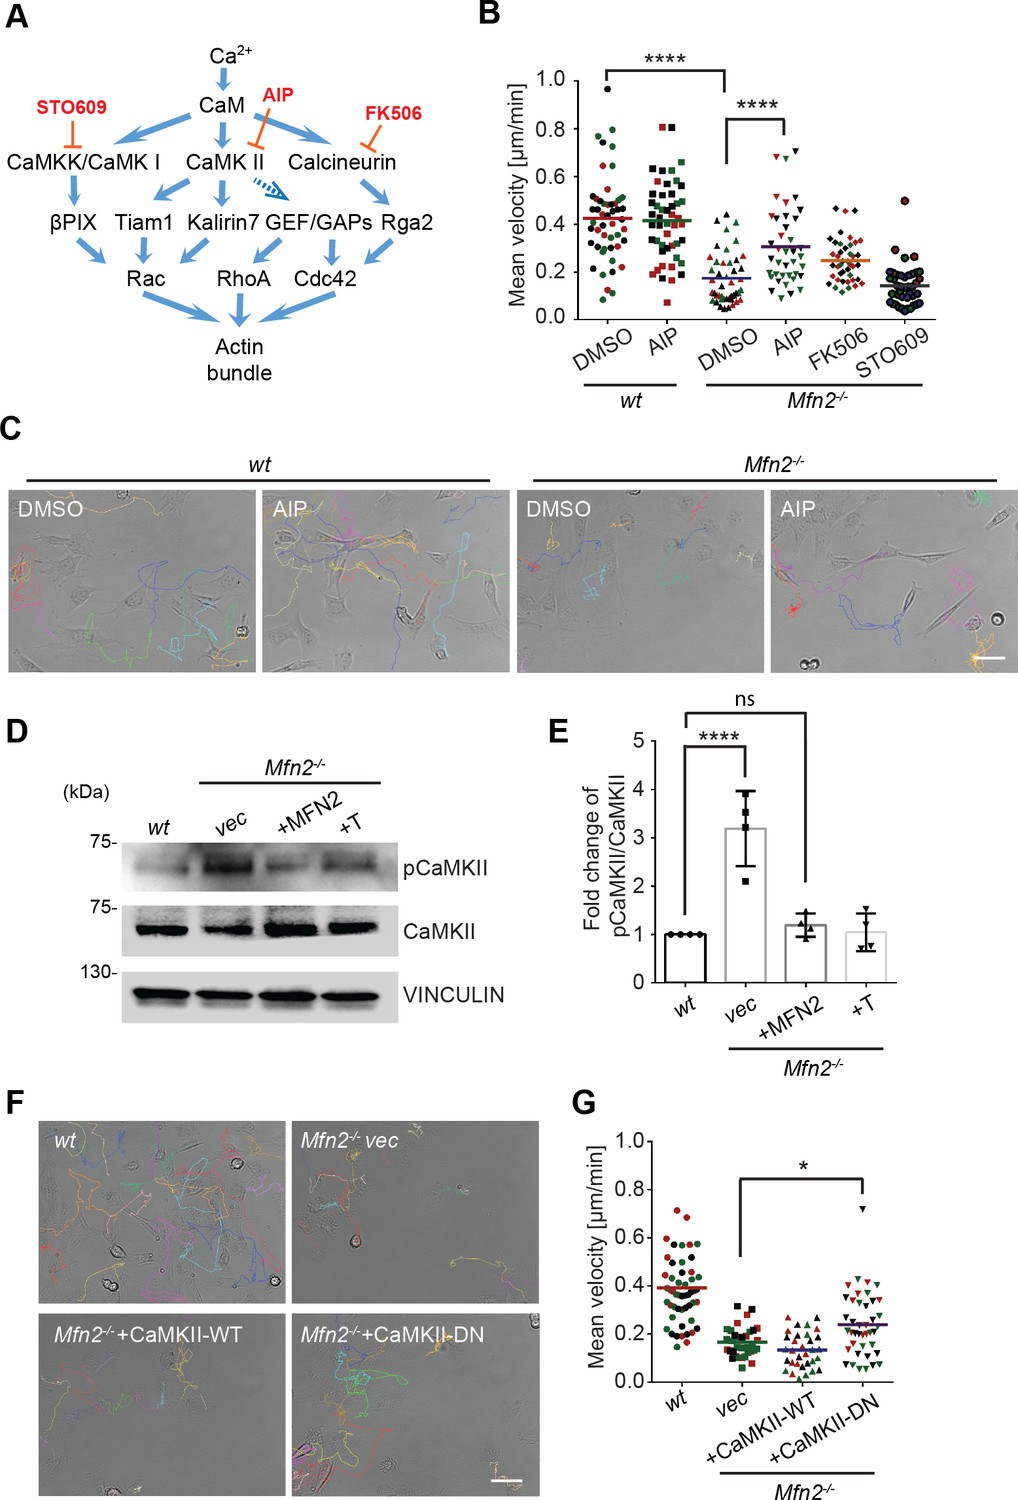
CaMKII activation mediates Mfn2 deficiency-induced inhibition in mice embryonic fibroblast (MEF) migration.
(A) Selected signaling cascades involved in the regulation of the actin cytoskeleton via Ca2+. Blue arrows indicate positive regulation. Dashed blue arrows indicate positive regulation with unclear mechanisms. Orange T-shaped bars indicate negative regulation of the pharmacological inhibitors. (B) Quantification of the velocity of indicated MEF cells treated with DMSO, the CaMKII inhibitor AIP, the Calcineurin inhibitor FK506, or the CaMKK inhibitor STO609. (C) Representative images with individual tracks of wt or Mfn2-null MEFs treated with the CaMKII inhibitor AIP. (D, E) Western blot (E) and quantification (F) determining the amount of pCaMKII and pan-CaMKII in wt, Mfn2-null MEFs with vec, CaMKII-WT, or CaMKII-DN overexpressed after treating with 25 µM PDGF-BB for 4 min. (F, G) Quantification of velocity (G) and representative images with individual tracks (F) of wt, Mfn2-null MEFs with vec, CaMKII-WT, or CaMKII-DN overexpressed during random migration. One representative result of three biological repeats is shown in (B, C, F, G). Four biological repeats are shown in (E). n = 40 cells are quantified in (B, G). *p≤0.05, ***p≤0.001, ****p<0.0001 (one-way ANOVA in E, G and two-way ANOVA in B). Scale bars: 50 µm.
-
Figure 4—source data 1
Original blots and figures with the bands labeled for Figure 4D.
- https://cdn.elifesciences.org/articles/88828/elife-88828-fig4-data1-v3.zip
Figure 5 with 1 supplement
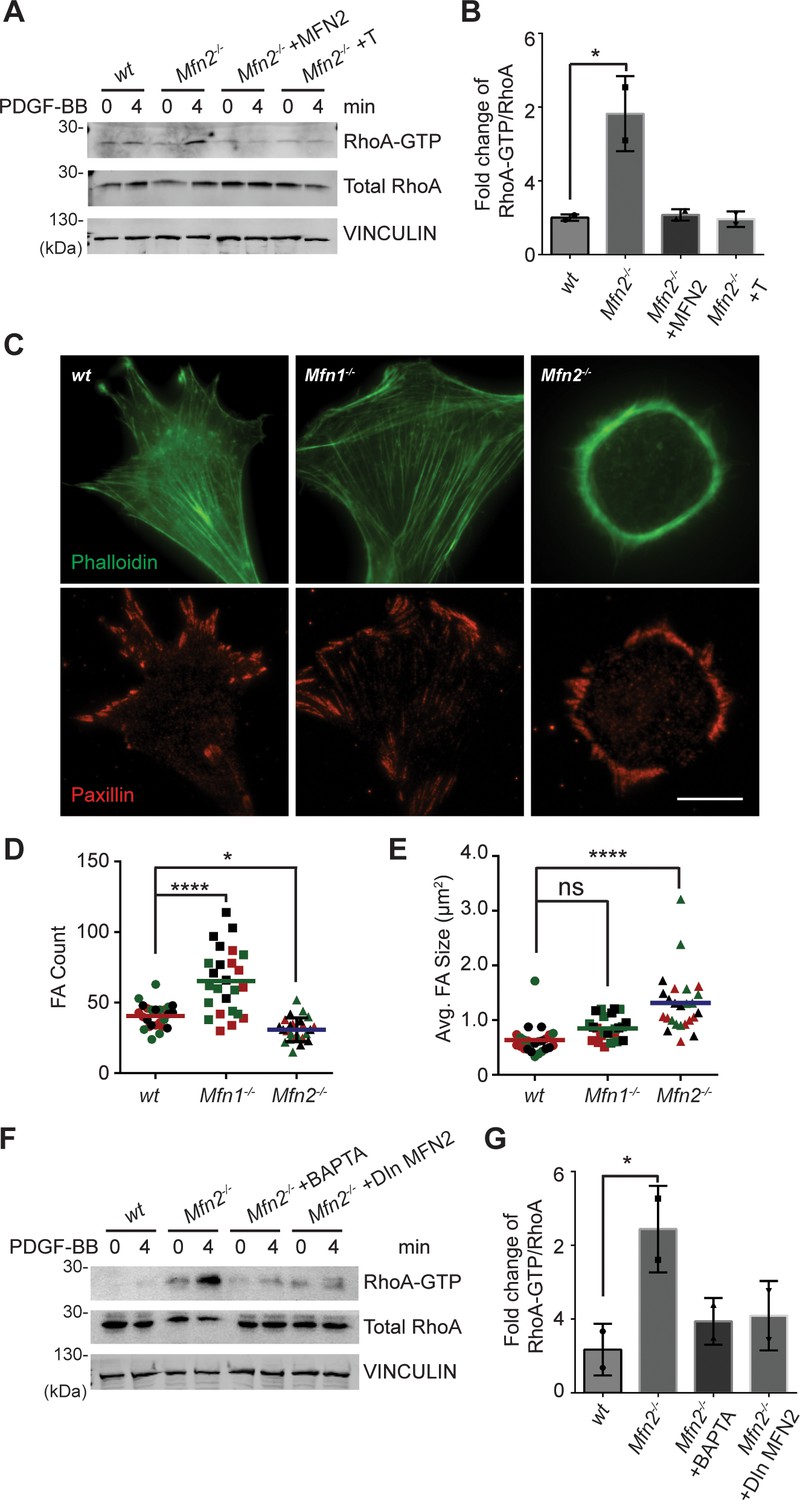
Loss of MFN2 induces heightened RhoA activation in mice embryonic fibroblasts (MEFs).
(A, B) RhoA pulldown activation assay demonstrates increased RhoA-GTP in Mfn2-null MEFs, which can be corrected by re-expressing MFN2 or inducing a mitochondria-endoplasmic reticulum (ER) tether. (A) Western blot and (B) quantification determining the amount of RhoA-GTP and total RhoA protein in wt, Mfn2-null MEFs, Mfn2-null MEFs with MFN2 re-expression, or with an artificial ER-mitochondria tether; the indicated cell lines were treated with 25 ng/ml PDGF-BB for 0 or 4 min. (C) Immunofluorescence of F-actin (phalloidin) and Paxillin in wt, Mfn1-null, and Mfn2-null MEFs after overnight culture. (D, E) Mfn2-null MEFs display slightly decreased FA numbers (D) but significantly larger FA sizes (E). (F, G) RhoA pulldown activation assay demonstrates cytosolic Ca2+ inhibition corrects RhoA-GTP level in Mfn2-null MEFs. (F) Western blot and (G) quantification showing the amount of RhoA-GTP protein in wt, Mfn2-null MEFs, Mfn2-null MEFs treated with BAPTA, or Mfn2-null MEFs with doxycycline (DOX)-induced MFN2 re-expression for 48 hr; the indicated cells were treated with 25 ng/ml PDGF-BB for the indicated time. RhoA-GTP/total RhoA ratios at 4 min were normalized to 0 min to show the fold changes in (B, G). n = 30 cells were quantified in (D, E). One representative result of two biological repeats is shown in (A, B, F, G). *p≤0.05 (one-way ANOVA comparing each group with the average of the wt group). Scale bar: 50 µm.
-
Figure 5—source data 1
Original blots and figures with the bands labeled for Figure 5A.
- https://cdn.elifesciences.org/articles/88828/elife-88828-fig5-data1-v3.zip
-
Figure 5—source data 2
Original blots and figures with the bands labeled for Figure 5F.
- https://cdn.elifesciences.org/articles/88828/elife-88828-fig5-data2-v3.zip
Figure 5—figure supplement 1

Activities of Rac and Cdc42 are not increased in MFN2-deficient mice embryonic fibroblasts (MEFs).
(A) Western blot and (B) quantification of the amount of RAC-GTP and total RAC protein in wt, Mfn2-null MEFs, Mfn2-null MEFs with MFN2 re-expressed, or with an artificial endoplasmic reticulum (ER)-mitochondria tether. The indicated cell lines were treated with 25 ng/ml PDGF-BB for 0 or 4 min. (C) Quantification of the velocity of indicated MEF cells treated with DMSO or Rac inhibitor CAS1090893 (50 µM) overnight. (D, E) Cdc42 pulldown activation assay demonstrates no difference in Cdc42-GTP in wt and Mfn2-null MEFs. (D) Western blot and (E) quantification of the amount of CDC42-GTP and total CDC42 protein in wt, Mfn2-null MEFs treated with 25 ng/ml PDGF-BB 0 or 4 min. One representative result of three biological repeats is shown in (A, D). Data are pooled from three independent experiments in (B, C, E). n > 25 cells were quantified in C. Error bars represent SD. NS, nonsignificant (two-way ANOVA in C, one-way ANOVA in B, unpaired t-test in E).
-
Figure 5—figure supplement 1—source data 1
Original blots and figures with the bands labeled for Figure 5—figure supplement 1A.
- https://cdn.elifesciences.org/articles/88828/elife-88828-fig5-figsupp1-data1-v3.zip
-
Figure 5—figure supplement 1—source data 2
Original blots and figures with the bands labeled for Figure 5—figure supplement 1D.
- https://cdn.elifesciences.org/articles/88828/elife-88828-fig5-figsupp1-data2-v3.zip
Figure 6 with 1 supplement
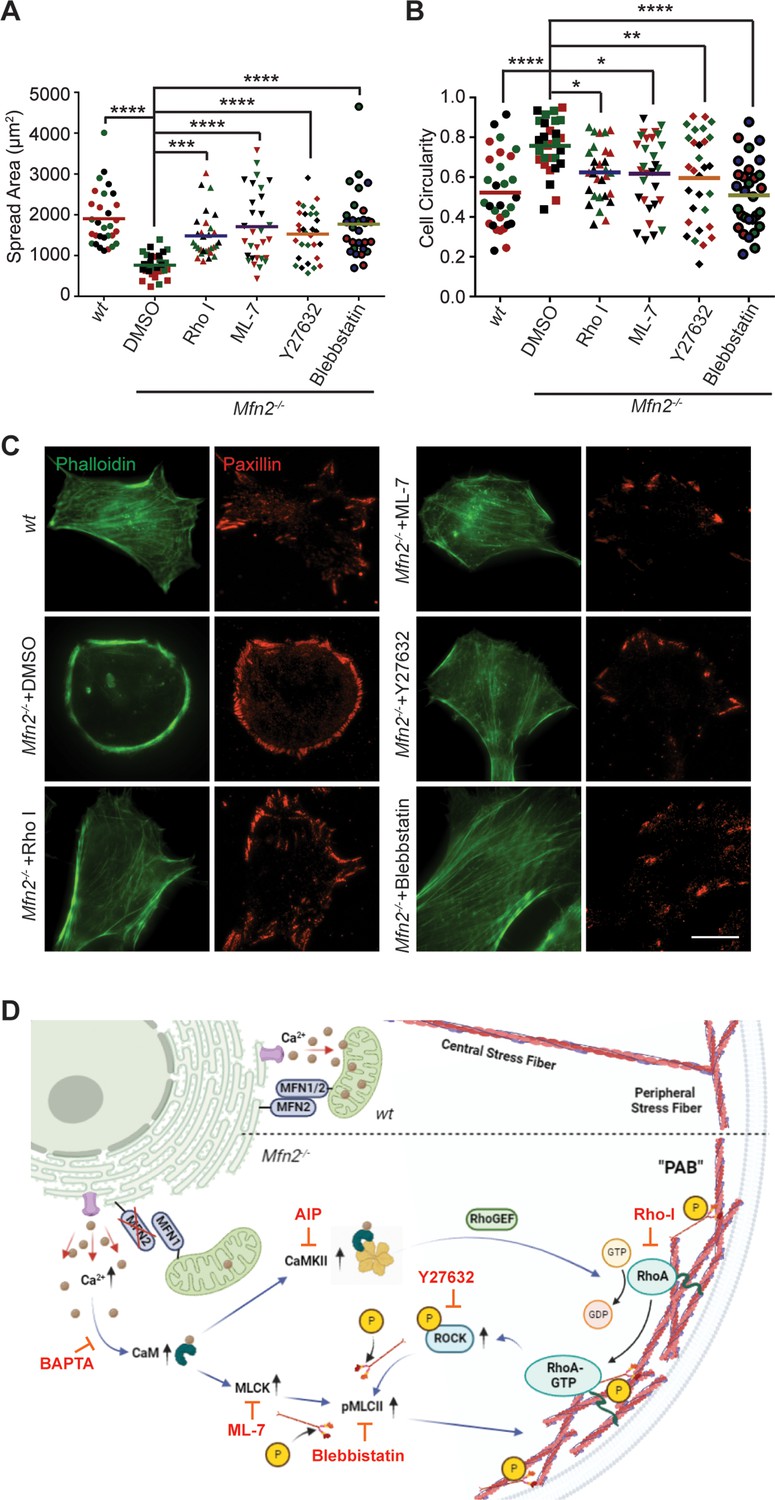
Small-molecule inhibitors targeting RhoA- and MLCK-related signaling pathways rescue MFN2 deficiency-induced phenotypes.
(A, B) Cellular spread area (A) and circularity (B) of wt and Mfn2-null mice embryonic fibroblasts (MEFs) treated with indicated inhibitors overnight. (C) Immunofluorescence of F-actin (phalloidin) and Paxillin in wt and Mfn2-null MEFs treated with indicated inhibitors overnight. (D) Schematic of the effectors and their inhibitors (red) in MFN2-regulated signaling network leading to Actin bundle. Increased cytosolic Ca2+ may activate MLCK, CaMKII, and RhoA-ROCK, which activate MLC and affect actin bundle formation. One representative result of three biological repeats is shown in (C). Data are pooled from three independent experiments, and n = 30 cells are quantified in (A, B). *p≤0.05, **p≤0.01, ***p≤0.001, ****p<0.0001 (one-way ANOVA comparing each group to the average of Mfn2-/- DMSO group). Scale bars: 50 µm.
Figure 6—figure supplement 1

RhoA and MLC drive peripheral actin band (‘PAB’) structure in MFN2-deficient mice embryonic fibroblasts (MEFs).
(A) Immunofluorescence of F-actin (phalloidin) and Paxillin in wt and Mfn2-null MEFs cultured on uncoated, collagen-coated, or fibrinogen-coated cover glasses. (B) Velocity quantification of indicated MEF cells treated with DMSO, the Rho inhibitor-I, the MLCK inhibitor ML-7, the ROCK inhibitor Y27632, the myosin inhibitor Blebbistatin, FAK inhibitor-14, the LIM kinase inhibitor BMS-5, or the Arp2/3 inhibitor CK666. (C) Representative images with individual tracks of indicated MEF cells treated with DMSO or indicated inhibitors. (D) A small-molecular inhibitor screen revealed the schematic of the effectors and their inhibitors (red) in the MFN2-regulated signaling network leading to the Actin bundle. Data are pooled from three independent experiments in (B) and n>30 cells are quantified. ***p≤0.001, ****p<0.0001 (one-way ANOVA comparing each group to the average of Mfn2-/- DMSO group). Scale bars: 50 µm.
Figure 7 with 1 supplement
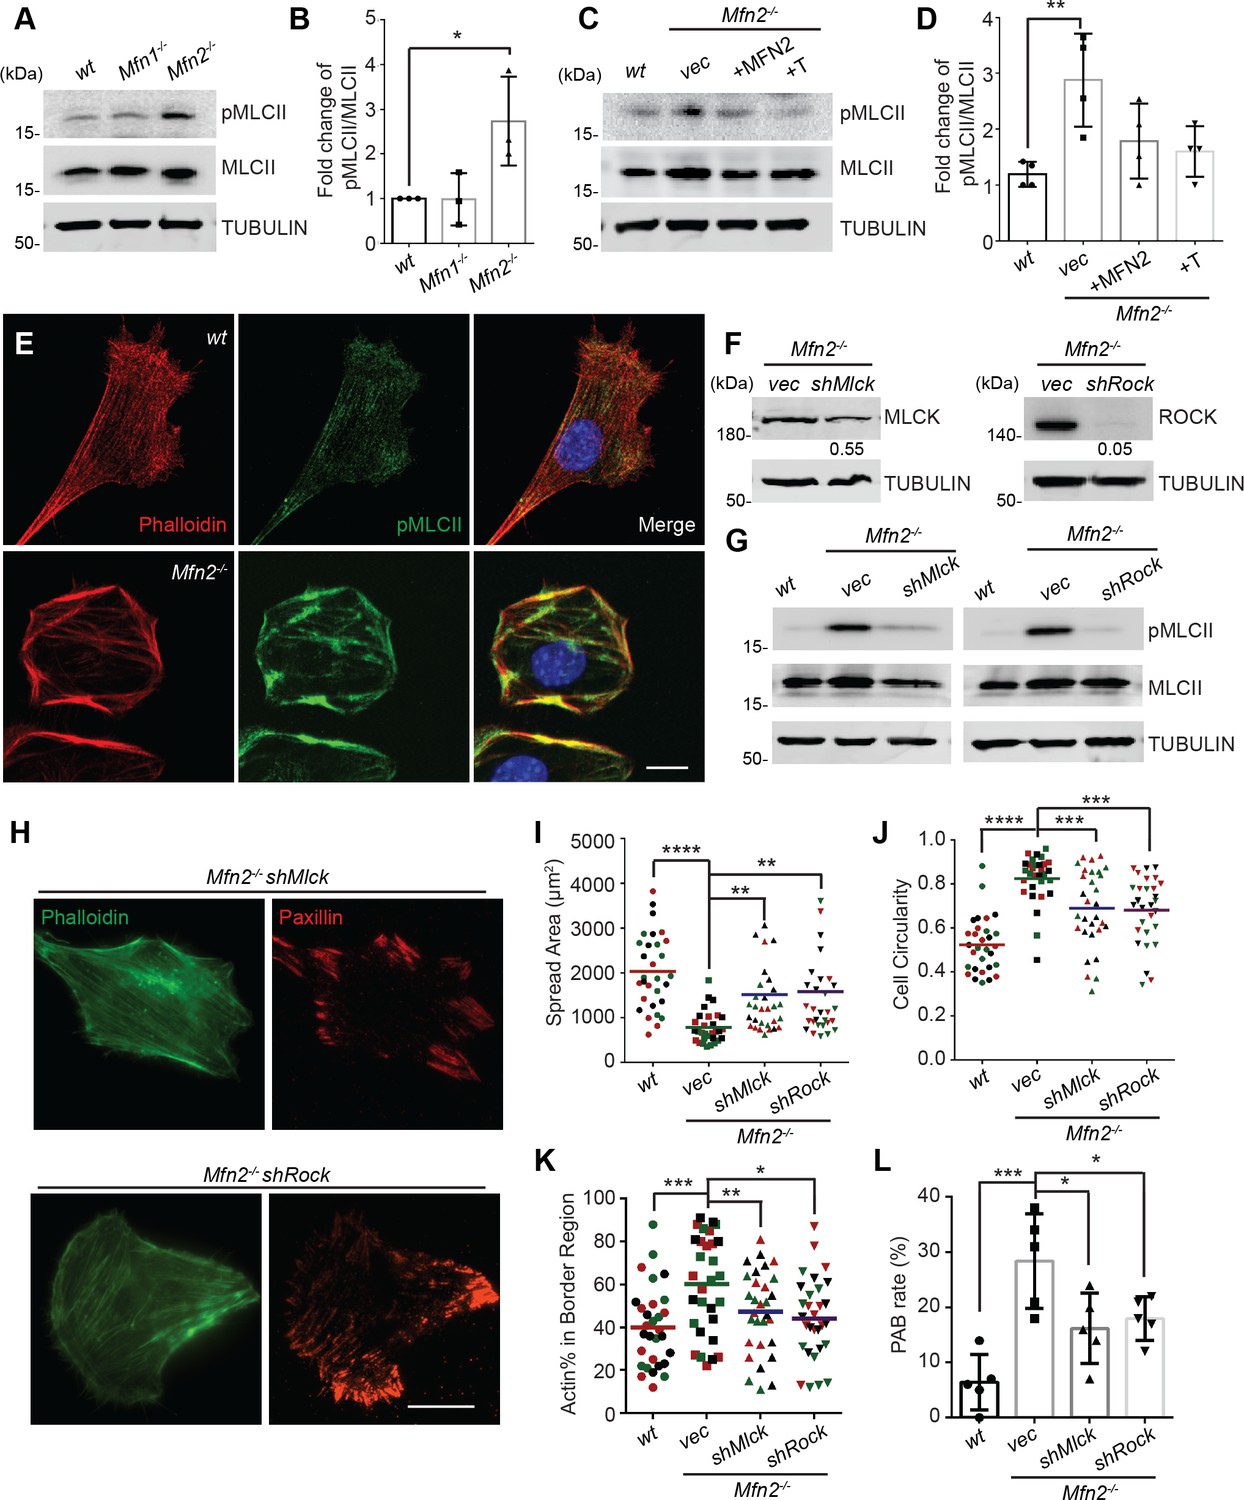
Heightened MLC activity promotes the peripheral actin band (‘PAB’) structure in MFN2-deficient mice embryonic fibroblasts (MEFs).
(A, B) Western blot (A) and quantification (B) of the amount of pMLCII and total MLCII in wt, Mfn1-null, and Mfn2-null MEFs. (C, D) Increased pMLCII in Mfn2-null MEFs can be corrected by re-expressing MFN2 or inducing a mitochondria-endoplasmic reticulum (ER) tether. (C) Western blot and (D) quantification determining the amount of pMLCII and total MLCII protein in wt, Mfn2-null MEFs, Mfn2-null MEFs with MFN2 re-expressed, or with an artificial ER-mitochondria tether. (E) Representative images of wt and Mfn2-null MEFs immunostained for F-actin (phalloidin), pMLCII, and DAPI. (F) Western blot determining the expression levels of MLCK or ROCK in Mfn2-null MEFs with shMLCK or shROCK. (G) Western blot of pMLCII and total MLCII Mfn2-null MEFs with shMLCK or shROCK. (H) Representative images of Mfn2-null MEFs with shMLCK or shROCK immunostained for F-actin (green) and paxillin (red). (I, J) Cellular spread area and circularity of wt, Mfn2-null MEFs with vec, shMLCK, or shROCK were measured after overnight culture. (K) Percentage of actin abundance in the cell border region in wt, Mfn2-null MEFs, Mfn2-null MEFs with shMLCK or shROCK. (L) Percentage of PAB cells identified by a custom algorithm in wt, Mfn2-null MEFs, Mfn2-null MEFs with shMLCK or shROCK. The individual points stand for the size or circularity of individual MEF cells. One representative result of three biological repeats is shown in (A, B, F, G). Four biological repeats were done in (C, D). Data are pooled from three independent experiments in (I, J). n = 30 cells are quantified in (I, K). Five different views from three biological repeats are quantified in (L). *p≤0.05, **p≤0.01, ***p≤0.001, ****p<0.0001 (one-way ANOVA, comparing each group to the average of Mfn2-/- vec group in I, K). Scale bars: 20 µm in (H), 10 µm in (E).
-
Figure 7—source data 1
Original blots and figures with the bands labeled for Figure 7A.
- https://cdn.elifesciences.org/articles/88828/elife-88828-fig7-data1-v3.zip
-
Figure 7—source data 2
Original blots and figures with the bands labeled for Figure 7C.
- https://cdn.elifesciences.org/articles/88828/elife-88828-fig7-data2-v3.zip
-
Figure 7—source data 3
Original blots and figures with the bands labeled for Figure 7F.
- https://cdn.elifesciences.org/articles/88828/elife-88828-fig7-data3-v3.zip
-
Figure 7—source data 4
Original blots and figures with the bands labeled for Figure 7G.
- https://cdn.elifesciences.org/articles/88828/elife-88828-fig7-data4-v3.zip
Figure 7—figure supplement 1

The cell lines with restored motility show different oxygen consumption rates.
(A, C, E) Representative graph showing oxygen consumption rate (OCR) of indicated mice embryonic fibroblast (MEF) cells. (B, D, F) Basal respiration, ATP-linked respiration, maximal respiratory, and spare capacity of indicated cell lines. One representative result of three biological repeats in (A–F). Error bars represent SD. *p≤0.05, **p≤0.01, ***p≤0.001, ****p<0.0001 (two-way ANOVA).
Figure 8
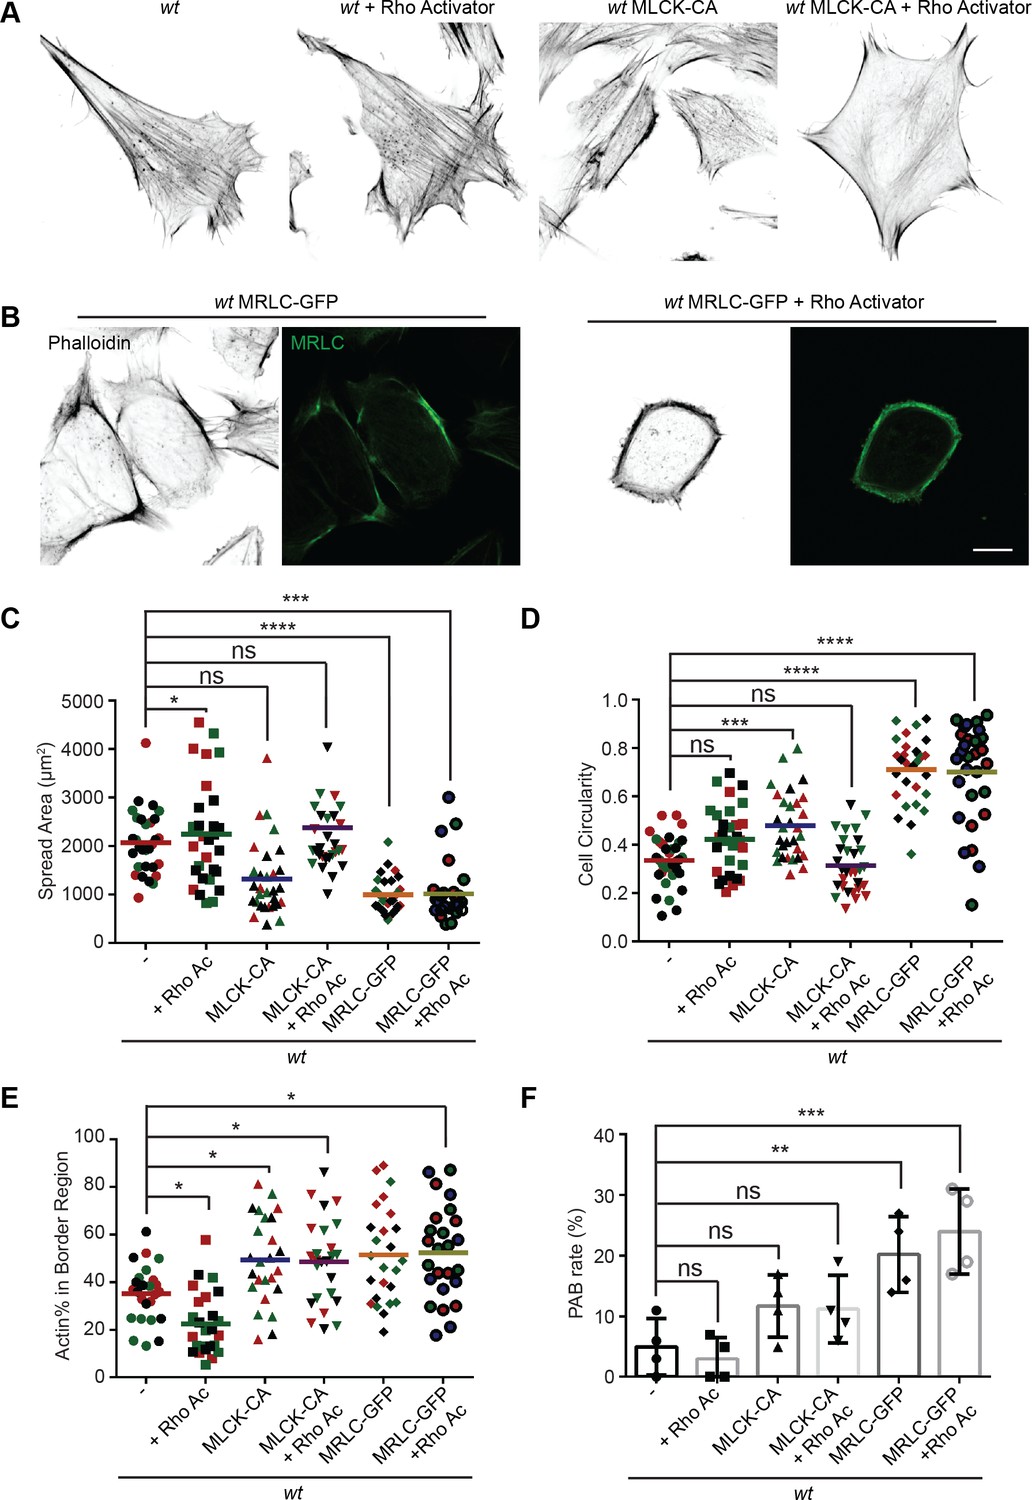
MRLC overexpression and Rho activation in wt mice embryonic fibroblasts (MEFs) recapitulates the peripheral actin band (‘PAB’) structure.
(A) Immunofluorescence of F-actin (phalloidin) in wt MEFs with or Rho activator treatment or introducing MLCK-CA expression. (B) Representative images of wt MEFs expressing MRLC-GFP with or without the Rho Activator, immunostained for F-actin (phalloidin). (C, D) Spread area and circularity of wt MEFs with the indicated overexpression or drug treatment. The individual points stand for the size or circularity of individual MEF cells. (E, F) Percentage of actin abundance in the cell border region (E) and the percentage of PAB cells (F) identified by our custom algorism in indicated cell lines. One representative result of three biological repeats is shown in (A, B). Data are pooled from three independent experiments in (C–E). n = 30 cells are tracked and counted in (C–E). Four different views from three biological repeats are quantified in (F). *p≤0.05, **p≤0.01, ***p≤0.001, ****p<0.0001 (one-way ANOVA, comparing each column with the mean of the wt group). Scale bars: 10 µm.
Figure 9 with 1 supplement
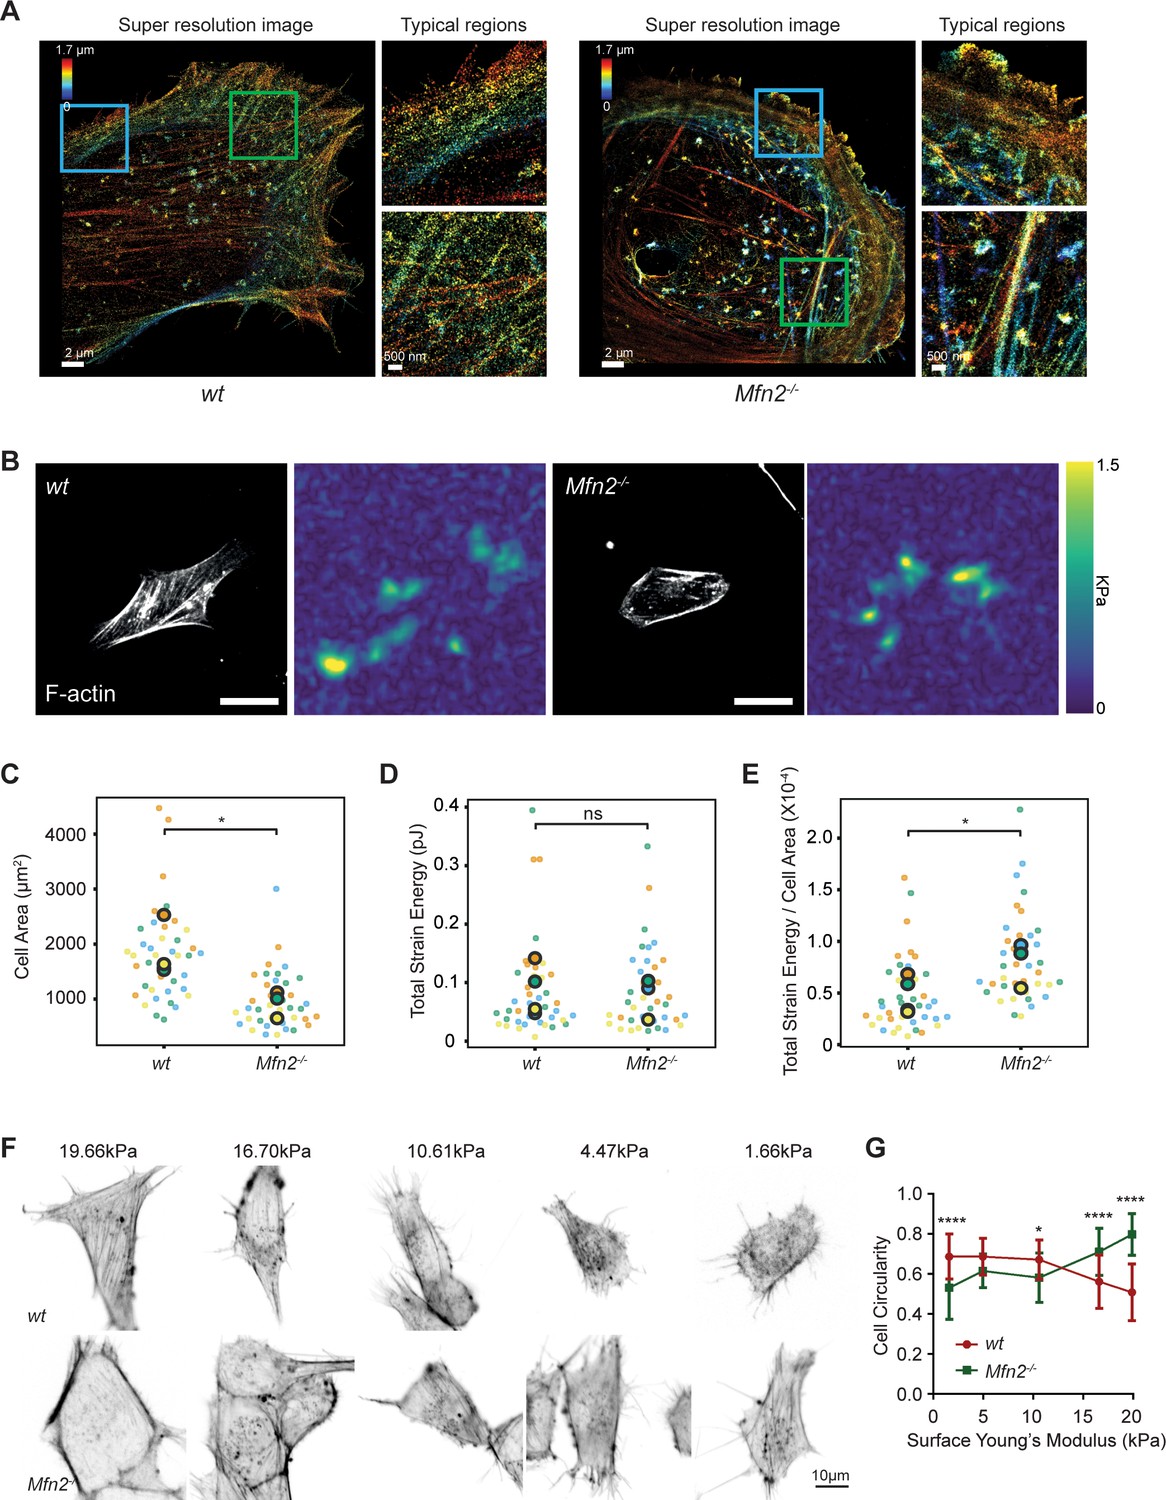
Mfn2-null mice embryonic fibroblasts (MEFs) exhibit altered actin organization and cell stiffness.
(A) 3D super-resolution reconstructions of immunofluorescence-labeled F-actin in wt or Mfn2-null MEFs. x–y overview of a 1.7-µm-thick volume of the cells. (B) Morphology of indicated MEF cells on polyacrylamide (PAA) substrates after overnight culture immunostained with Alexa-488 phalloidin. A traction stress map with color values corresponding to different stress values is shown on the right. Scale bars: 50 μm. Quantification of the corresponding cell spreading areas (C), total strain energy (D), and total strain energy normalized to cell area (E). (F) Representative images of indicated MEF cells on polyacrylamide (PAA) substrates of different stiffness after overnight culture. The cells are immunostained with Alexa-488 phalloidin. (G) The cell circularity of the indicated cells is measured. The individual points stand for the circularity of individual MEF cells. One representative result of three biological repeats is shown in (C, F). Data are pooled from three independent experiments in (C–E, G). n > 40 cells are counted in (B–E). *p≤0.05, ****p<0.0001 (unpaired t-test). Scale bars: 2 µm in (A), 50 µm in (B), and 10 µm in (F).
Figure 9—figure supplement 1

Mfn2-null mice embryonic fibroblasts (MEFs) exhibit altered cell stiffness and membrane tension.
(A) Schematic of the cantilever probe indenting cells at cell center during atomic force microscopy (AFM) process. (B) Measurement of effective cell modulus (mean ± SEM) of wt or Mfn2-null MEFs (n ≥ 15 for each group). (C) Representative AFM force curves of the cantilever probe wt or Mfn2-null MEFs. (D) Representative FLIM images and (E) quantification of the Flipper-TR probe’s lifetime on wt MEFs under regular and hypertonic conditions. (F) Representative FLIM images and (G) quantification of the Flipper-TR probe’s lifetime on wt and Mfn2-null MEFs. One representative result of three biological repeats in (A, D, F). Data are pooled from three independent experiments in (B). Error bars represent SD. **p≤0.01, ****p<0.0001 (unpaired t-test in B, E, G).
Videos
Video 1
MFN2 regulates the migration and spreading of mice embryonic fibroblasts (MEFs).
Cell spreading and random migration of wt, Mfn2-null, and Mfn1-null MEFs in the µ-slide 15 min after plating. Time-lapse images were taken every 10 min for 16 hr and 40 min. Individual MEFs were tracked for velocity quantification. Scale bar: 50 m.
Video 2
MFN2 re-expression, but not MFN1, restores migratory defects in Mfn2-null mice embryonic fibroblasts (MEFs).
Cell spreading and random migration of wt and Mfn2-null MEFs with vec, MFN1, or MFN2 re-expressed in the µ-slide. Time-lapse images were taken every 10 min for 14 hr and 50 min. Individual MEFs were tracked for velocity quantification. Scale bar: 50 m.
Video 3
Cytosolic Ca2+ inhibition restores the migration defects in Mfn2-null mice embryonic fibroblast (MEF) cells.
Cell spreading and random migration of wt and Mfn2-null MEFs treated with DMSO or BAPTA-AM (20 μM) in the μ-slide. Time-lapse images were taken every 10 min for 14 hr and 30 min. MEFs were tracked for velocity quantification. Scale bar: 50 μm.
Video 4
Restoring the endoplasmic reticulum (ER)-mitochondrial tether rescues the migration defects in Mfn2-null mice embryonic fibroblast (MEF) cells.
Cell spreading and random migration of wt, Mfn2-null MEFs with vec or synthetic tether construct in the µ-slide. Time-lapse images were taken every 10 min for 17 hr and 50 min. Individual MEFs were tracked for velocity quantification. Scale bar: 50 m.
Video 5
CaMKII inhibition rescues the migration defects in Mfn2-null mice embryonic fibroblast (MEF) cells.
Cell spreading and random migration of wt and Mfn2-null MEFs treated with DMSO or AIP (40 μM) in the μ-slide. Time-lapse images were taken every 10 min for 17 hr and 50 min. MEFs were tracked for velocity quantification. Scale bar: 50 μm.
Video 6
Expression of CaMKII-DN rescues the migration defects in Mfn2-null mice embryonic fibroblast (MEF) cells.
Cell spreading and random migration of wt, Mfn2-null MEFs with vec, CaMKII-WT, or CaMKII-DN in the μ-slide. Time-lapse images were taken every 10 min for 17 hr and 50 min. MEFs were tracked for velocity quantification. Scale bar: 50 μm.
Video 7
Small-molecule inhibitors targeting RhoA and MLCK downstream signaling pathways rescue the migration defects in Mfn2-null mice embryonic fibroblast (MEF) cells.
Cell spreading and random migration of wt treated with DMSO and Mfn2-null MEFs treated with DMSO, RhoA inhibitor-I (0.1 µg/ml), ML-7 (2 µM), Y29632 (5 µM), or Blebbistatin (4 µM) in the μ-slide. Time-lapse images were taken every 10 min for 14 hr and 30 min. MEFs were tracked for velocity quantification. Scale bar: 50 μm.
Tables
Appendix 1—key resources table
| Reagent type (species) or resource | Designation | Source or reference | Identifiers | Additional information |
|---|---|---|---|---|
| Cell line (Mus musculus) | Wild-type MEF | ATCC | CRL-2991 | |
| Cell line (M. musculus) | Mfn1-null MEF | ATCC | CRL-2992 | |
| Cell line (M. musculus) | Mfn2-null MEF | ATCC | CRL-2993 | |
| Cell line (human) | HEK 293T/17 | ATCC | CRL-11268 | |
| Transfected construct (human) | MSCV-puro-Mfn1 | This paper | MFN1 overexpression | |
| Transfected construct (human) | MSCV-puro-Mfn2 | This paper | MFN2 rescue | |
| Transfected construct (human) | MSCV-puro-mito-GFP-ER | This paper | Expressing the artificial tethering structure in MEFs | |
| Transfected construct (human) | SPLICS Mt-ER Long P2A | Addgene | #164107 | |
| Transfected construct (M. musculus) | MSCV-puro-CaMKII-WT | This paper | CaMKIIalpha expression | |
| Transfected construct (M. musculus) | MSCV-puro-CaMKII-DN | This paper | Dominant negative CaMKIIalpha expression | |
| Transfected construct (M. musculus) | MSCV-puro-MLCK-CA | This paper | Constitutive active MLCK expression | |
| Transfected construct (M. musculus) | MSCV-puro-MRLC-GFP | This paper | MRLC-GFP expression | |
| Transfected construct | pCMV-dR8.2 dvpr | Addgene | #8455 | |
| Transfected construct | pCMV-VSV-G | Addgene | #8454 | |
| Transfected construct (human) | Lipofectamine 3000 | Invitrogen | L3000015 | Transfection reagent |
| Recombinant DNA reagent | PLKO.1-Puro-ctrl (SHC003) (plasmid) | Sigma-Aldrich | SHC 003 | Control plasmid for knock-down MEF lines |
| Recombinant DNA reagent | PLKO.1-Puro-shROCK (plasmid) | Sigma-Aldrich | TRCN0000022903 | Knockdown ROCK in MEFs |
| Recombinant DNA reagent | PLKO.1-Puro-shMLCK (plasmid) | Sigma-Aldrich | TRCN0000024037 | Knockdown MLCK in MEFs |
| Sequence-based reagent | MSCV-mfn2 insert F | This paper | PCR primers | CACGATAATACCATGGGCCACCATGTCCCTGCTC |
| Sequence-based reagent | MSCV-mfn2 insert R | This paper | PCR primers | TCTAGAGTCGCGGCCGCTTACTTGTACAGCTCGTCCATGCC |
| Sequence-based reagent | MSCV-mfn1 insert R | This paper | PCR primers | TCGACTCTAGAGTCGCGGCCGCTTACTTGTACAGCTCGTCCATGCC |
| Sequence-based reagent | Mfn2 into plix-Nsil-F | This paper | PCR primers | AAAACCCCGGTCCTATGCATATGTCCCTGCTCTTCTCTCGA |
| Sequence-based reagent | Mfn2 into plix-BamHI-R | This paper | PCR primers | CCCCAACCCCGGATCCTTATCTGCTGGGCTGCAGGT |
| Sequence-based reagent | Camk2a-MSCV-F | This paper | PCR primers | AATTAGATCTCTCGAGGCCACCATGGTGAGCAAGG |
| Sequence-based reagent | Camk2a-MSCV-R | This paper | PCR primers | CTACCCGGTAGAATTCATTCGGCGAAGCAAGAGCG |
| Sequence-based reagent | ER-mito F | This paper | PCR primers | AATTAGATCTCTCGAGATGGCAATCCAGTTGCGTTCG |
| Sequence-based reagent | ER-mito R | This paper | PCR primers | ATTTACGTAGCGGCCGCTTAAGATACATTGATGAGTTTGG |
| Sequence-based reagent | MRLC-GFP F | This paper | PCR primers | AATTAGATCTCTCGAGGCCACCATGGTGAGCAAGG |
| Sequence-based reagent | MRLC-GFP R | This paper | PCR primers | CTACCCGGTAGAATTCGCCCGCGGTCAGTCATCTTTG |
| Sequence-based reagent | MLCK-CA F | This paper | PCR primers | attagatctctcgagactagtcgactggatcc |
| Sequence-based reagent | MLCK-CA R | This paper | PCR primers | ccggtagaattcagatcttgggtgggttaattaa |
| Chemical compound, drug | BAPTA | Cayman Chemical | #11706 | |
| Chemical compound, drug | Y27632 | Cayman Chemical | #10005583 | |
| Chemical compound, drug | CK666 | Cayman Chemical | #29038 | |
| Chemical compound, drug | STO-609 acetate | Biotechne | #1551 | |
| Chemical compound, drug | A23187 | Cayman Chemical | #11016 | |
| Chemical compound, drug | Blebbistatin | Cayman Chemical | #13013 | |
| Chemical compound, drug | Oligomycin | Sigma-Aldrich | #495455 | |
| Chemical compound, drug | FCCP | Sigma-Aldrich | C2920 | |
| Chemical compound, drug | Rotenone | Sigma-Aldrich | #557368 | |
| Chemical compound, drug | Antimycin A | Sigma-Aldrich | A8674 | |
| Chemical compound, drug | CAS 1090893 | Millipore | #553511 | |
| Chemical compound, drug | RhoA inhibitor-I | Cytoskeleton, Inc | #CT-04 | |
| Chemical compound, drug | FK-506 | Cayman Chemical | #10007965 | |
| Chemical compound, drug | FAK14 | Cayman Chemical | #14485 | |
| Chemical compound, drug | BMS-5 | Cayman Chemical | #21072 | |
| Chemical compound, drug | ML-7 | Cayman Chemical | #11801 | |
| Chemical compound, drug | DAPI | Invitrogen | D1306 | 1 µg/ml for IF staining |
| Antibody | Anti-Mfn2 (rabbit polyclonal) | Cell Signaling Technology | 9482S | IF(1:200), WB (1:1000) |
| Antibody | Anti-Mfn1 (rabbit polyclonal) | Abcam | ab126575 | WB (1:1000) |
| Antibody | Anti-pan-CaMKII (rabbit polyclonal) | Cell Signaling Technology | #3362 | WB (1:1000) |
| Antibody | Anti-phosphor-CaMKII (Thr286) (rabbit polyclonal) | Cell Signaling Technology | #12716 | WB (1:1000) |
| Antibody | Anti-phosphor-myosin light chain 2 (Ser19) (rabbit polyclonal) | Cell Signaling Technology | #3671 | WB (1:1000) |
| Antibody | Anti-myosin light chain 2 (rabbit polyclonal) | Cell Signaling Technology | #3672 | IF (1:200), WB (1:1000) |
| Antibody | Anti-phospho-PAK (rabbit polyclonal) | Cell Signaling Technology | #2605S | WB (1:1000) |
| Antibody | Anti-PAK1/2/3 (rabbit polyclonal) | Cell Signaling Technology | #2604 | WB (1:1000) |
| Antibody | Anti-Vinculin (mouse monoclonal) | Sigma-Aldrich | #V9131 | WB (1:1000) |
| Antibody | HRP AffiniPure anti-rabbit IgG (goat polyclonal) | Jackson ImmunoResearch | #111-035-003 | WB (1:2500) |
| Antibody | Anti-mouse IgG Alexa Fluor 680 (goat polyclonal) | Invitrogen | #A28183 | WB (1:2500) |
| Antibody | Anti-rabbit IgG Alexa Fluor Plus 800 (goat polyclonal) | Invitrogen | #A32735 | WB (1:2500) |
| Antibody | Anti-rabbit Alexa Fluor 488, (chicken polyclonal) | Invitrogen | #A-21441 | IF (1:500) |
| Antibody | Anti-mouse Alexa Fluor 568, (Goat polyclonal) | Invitrogen | #A-11004 | IF (1:500) |
| Recombinant DNA reagent | PLKO.1-Puro (plasmid) | Sigma-Aldrich | RRID:Addgene_10878 | |
| Peptide, recombinant protein | Platelet-Derived Growth Factor-BB human | Sigma-Aldrich | P3201 | |
| Peptide, recombinant protein | AIP | R&D Systems | #5959/1 | |
| Sequence-based reagent | siRNA: nontargeting control | Thermo Fisher | 4390843 | Silencer Select |
| Commercial assay or kit | Rac1 Pull-Down Activation Assay Biochem Kit (Bead Pull-Down Format) | Cytoskeleton, Inc | #BK035 | |
| Commercial assay or kit | RhoA Pull-Down Activation Assay Biochem Kit (Bead Pull-Down Format) | Cytoskeleton, Inc | #BK036 | |
| Commercial assay or kit | Fluo-4 Calcium Imaging Kit | Invitrogen | F10489 | |
| Commercial assay or kit | Seahorse XF Cell Mito Stress Test Kit | Agilent Technologies | #103015-100 | |
| Commercial assay or kit | Flipper-TR | Cytoskeleton | CY-SC020 | |
| Commercial assay or kit | In-Fusion HD Cloning | Clontech | 639647 | |
| Software, algorithm | Python | This study | See “Immunostaning and confocal imaging” and “traction force microscopy and analysis” | |
| Software, algorithm | ImageJ software | ImageJ (http://imagej.nih.gov/ij/) | ||
| Software, algorithm | GraphPad Prism 6 | GraphPad Prism (https://graphpad.com) |
Additional files
Download links
A two-part list of links to download the article, or parts of the article, in various formats.
Downloads (link to download the article as PDF)
Open citations (links to open the citations from this article in various online reference manager services)
Cite this article (links to download the citations from this article in formats compatible with various reference manager tools)
Atypical peripheral actin band formation via overactivation of RhoA and nonmuscle myosin II in mitofusin 2-deficient cells
eLife 12:e88828.
https://doi.org/10.7554/eLife.88828


