Saccharomyces cerevisiae DJ-1 paralogs maintain genome integrity through glycation repair of nucleic acids and proteins
- Department of Biochemistry, Indian Institute of Science, India
Figures
Figure 1 with 1 supplement

Deletion of Hsp31 paralogs induces protein glycation.
(A) Yeast phenotypic analysis. Cells were grown until the mid-log phase and harvested, subsequently treated with 10 mM MG before being spotted or spotted on YPD medium plates containing 15 mM GO. The plates were incubated at 30 °C and imaged at 36 hr. (B, C) Proteome glycation profile. Yeast strains were treated with 15 mM GO in the YPD culture medium and allowed to grow for 12 hr, followed by western analysis with anti-CML antibody. (D, E) MAGE detection by western blotting. Cells from the mid-log phase were incubated with 10 mM MG for 12 hr, and MAGE levels were estimated using an anti-MAGE antibody. Protein glycation levels were determined by measuring the whole lane intensities by densitometry and plotted with respect to WT. The blots stained with Ponceau S were used as the loading control. One-way ANOVA with Dunnet’s multiple comparisons test was used to determine significance from three independent biological replicates, *, p≤0.05; **, p≤0.01; ***, p≤0.001; NS, not significant.
-
Figure 1—source data 1
Source data for Figure 1B contains raw image of western blot and densitometric values for graph.
- https://cdn.elifesciences.org/articles/88875/elife-88875-fig1-data1-v2.zip
-
Figure 1—source data 2
Source data for Figure 1C contains raw image of western blot and densitometric values for graph.
- https://cdn.elifesciences.org/articles/88875/elife-88875-fig1-data2-v2.zip
-
Figure 1—source data 3
Source data for Figure 1D contains raw image of western blot and densitometric values for graph.
- https://cdn.elifesciences.org/articles/88875/elife-88875-fig1-data3-v2.zip
-
Figure 1—source data 4
Source data for Figure 1E contains raw image of western blot and densitometric values for graph.
- https://cdn.elifesciences.org/articles/88875/elife-88875-fig1-data4-v2.zip
Figure 1—figure supplement 1
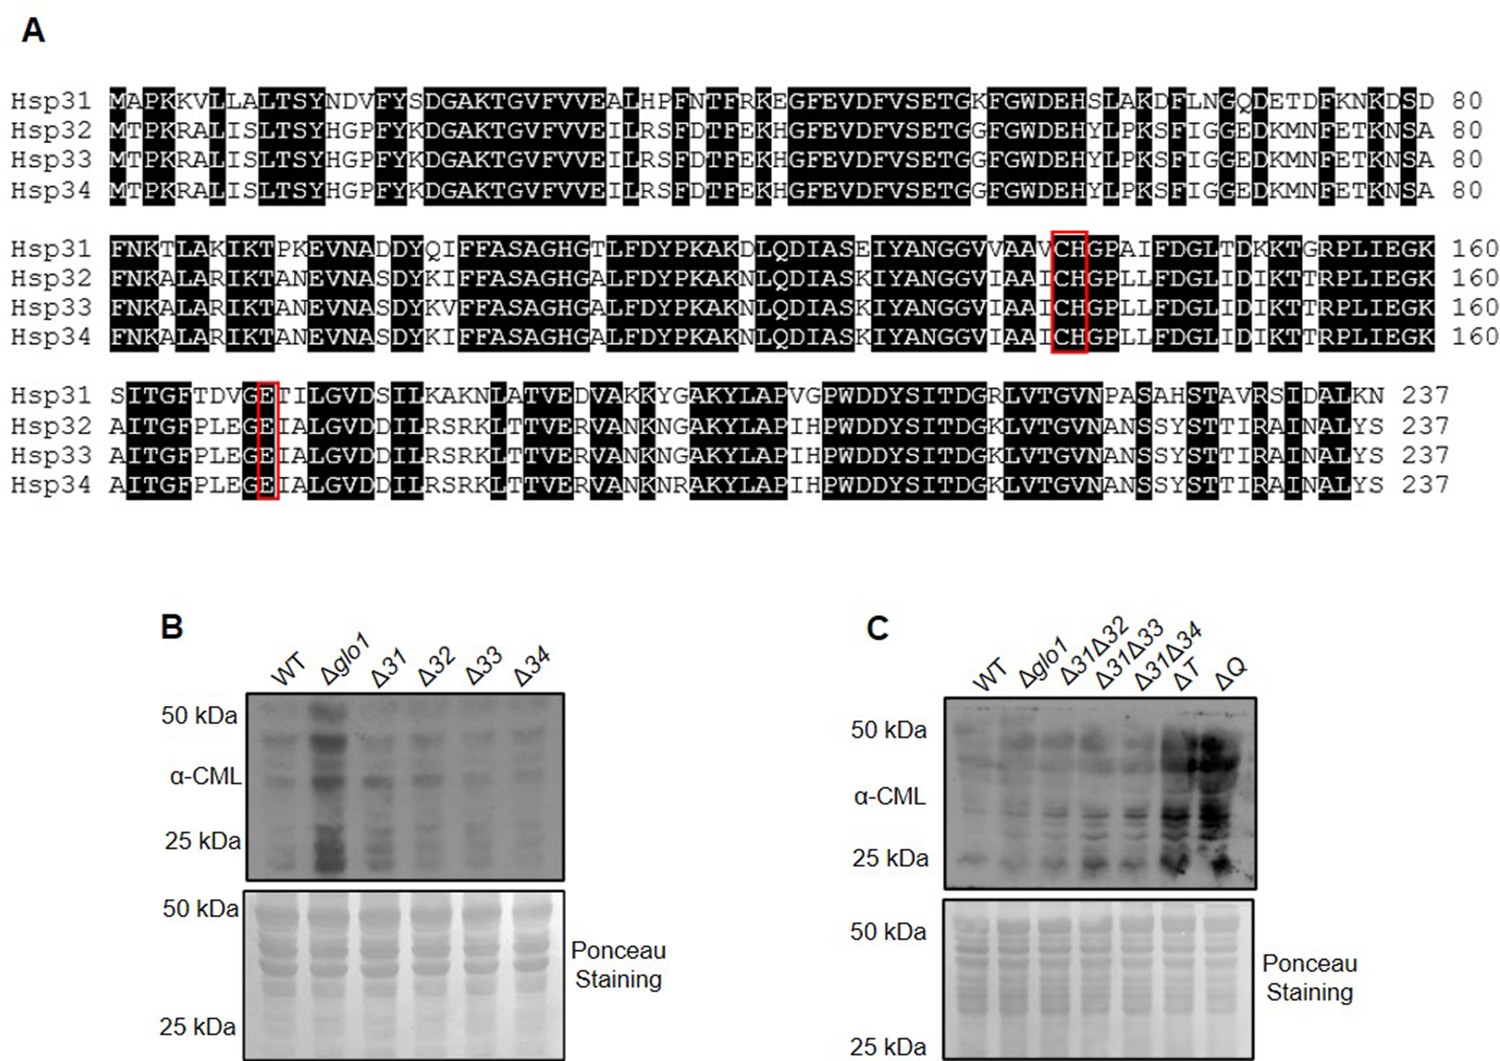
Amino acid sequence alignment of Hsp31 paralogs and protein glycation profile in the absence of GO stress.
(A) Amino acid sequences of Hsp31 paralogs were aligned using the online tool Clustal Omega. Black shade indicates identical amino acids. Red boxes indicate amino acids of the catalytic triad. (B, C) Respective strains were grown till the stationary phase and subsequently lysed. The protein glycation levels were estimated by immunodetection using anti-CML antibody.
-
Figure 1—figure supplement 1—source data 1
Source data for Figure 1—figure supplement 1B contains raw image of western blot.
- https://cdn.elifesciences.org/articles/88875/elife-88875-fig1-figsupp1-data1-v2.zip
-
Figure 1—figure supplement 1—source data 2
Source data for Figure 1—figure supplement 1C contains raw image of western blot.
- https://cdn.elifesciences.org/articles/88875/elife-88875-fig1-figsupp1-data2-v2.zip
Figure 2 with 1 supplement

Loss of Hsp31 paralogs aggravates the glycation of DNA and RNA, affecting translational activity.
(A, B) Immunodetection of DNA using dot-blot assay. Three µg of total genomic DNA from respective strains treated overnight with 15 mM GO was dotted on nitrocellulose membrane and probed with anti-CML antibody. (C, D) RNA glycation profile. Global RNA extracted from cells incubated with 15 mM GO were dotted and analyzed using anti-CML antibody. (E) Polysome profiling. Untreated (-GO) and treated (+GO) WT and ΔQ cells with GO were subjected to polysome profiling. (F) Ratio of polysomes to monosomes (P/M). The area occupied by the polysome and the monosome peak was determined using Origin 8.0 for the respective samples, and the ratios were plotted. WT (+GO) was compared with WT (-GO), and ΔQ (-GO) was compared with ΔQ (+GO). (G–J) Estimation of MAGE-modified nucleic acids. Strains lacking Hsp31 paralogs were treated with 10 mM MG for 12 hr, and the genomic DNA and RNA were dotted on the membrane and probed with anti-MAGE antibody. The relative intensity of dots representing the glycation levels was calculated and compared to WT. One-way ANOVA with Dunnet’s multiple comparisons test was used to determine significance from three independent biological replicates, *, p≤0.05; **, p≤0.01; ***, p≤0.001; NS, not significant.
-
Figure 2—source data 1
Source data for Figure 2A contains raw image of western blot and densitometric values for graph.
- https://cdn.elifesciences.org/articles/88875/elife-88875-fig2-data1-v2.zip
-
Figure 2—source data 2
Source data for Figure 2B contains raw image of western blot and densitometric values for graph.
- https://cdn.elifesciences.org/articles/88875/elife-88875-fig2-data2-v2.zip
-
Figure 2—source data 3
Source data for Figure 2C contains raw image of western blot and densitometric values for graph.
- https://cdn.elifesciences.org/articles/88875/elife-88875-fig2-data3-v2.zip
-
Figure 2—source data 4
Source data for Figure 2D contains raw image of western blot and densitometric values for graph.
- https://cdn.elifesciences.org/articles/88875/elife-88875-fig2-data4-v2.zip
-
Figure 2—source data 5
Source data for Figure 2E contains densitometric values for graph.
- https://cdn.elifesciences.org/articles/88875/elife-88875-fig2-data5-v2.zip
-
Figure 2—source data 6
Source data for Figure 2F contains densitometric values for graph.
- https://cdn.elifesciences.org/articles/88875/elife-88875-fig2-data6-v2.zip
-
Figure 2—source data 7
Source data for Figure 2G contains raw image of western blot and densitometric values for graph.
- https://cdn.elifesciences.org/articles/88875/elife-88875-fig2-data7-v2.zip
-
Figure 2—source data 8
Source data for Figure 2H contains raw image of western blot and densitometric values for graph.
- https://cdn.elifesciences.org/articles/88875/elife-88875-fig2-data8-v2.zip
-
Figure 2—source data 9
Source data for Figure 2I contains raw image of western blot and densitometric values for graph.
- https://cdn.elifesciences.org/articles/88875/elife-88875-fig2-data9-v2.zip
-
Figure 2—source data 10
Source data for Figure 2J contains raw image of western blot and densitometric values for graph.
- https://cdn.elifesciences.org/articles/88875/elife-88875-fig2-data10-v2.zip
Figure 2—figure supplement 1
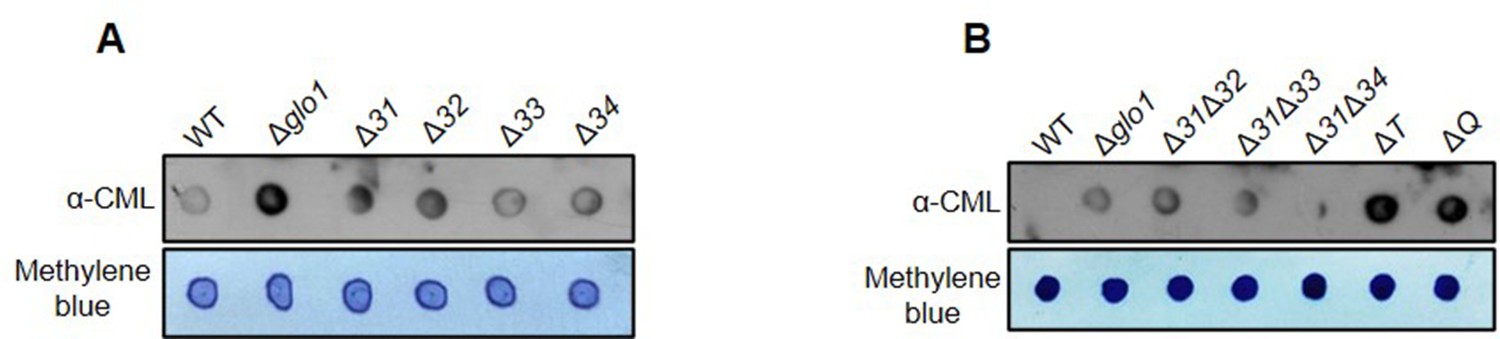
Glycation profile of DNA in the absence of GO stress.
(A, B) DNA extracted from stationary phase cells was dotted (3 µg) on nitrocellulose membrane and probed with anti-CML to determine the glycation status.
-
Figure 2—figure supplement 1—source data 1
Source data for Figure 2—figure supplement 1A contains raw image of western blot.
- https://cdn.elifesciences.org/articles/88875/elife-88875-fig2-figsupp1-data1-v2.zip
-
Figure 2—figure supplement 1—source data 2
Source data for Figure 2—figure supplement 1B contains raw image of western blot.
- https://cdn.elifesciences.org/articles/88875/elife-88875-fig2-figsupp1-data2-v2.zip
Figure 3 with 1 supplement

Hsp31 paralogs prevent glyoxal toxicity.
(A) Measurement of the glyoxalase activity in vitro. 5 µg of purified Hsp31 paralogs were incubated with 0.5 mM GO, and the absorbance was monitored at 570 nm. (B) Estimating the kinetic parameters of the enzyme. The kinetic efficiency was determined by calculating their relative velocities against multiple GO concentrations. (C) Growth phenotypic analysis. WT and ΔQ overexpressing Hsp31 paralogs were grown until the mid-log phase, spotted on SD Leu- media plates containing 15 mM GO, and incubated at 30 °C. (D) Yeast DJ-1 homologs alleviate proteome glycation. Respective strains were grown in SD Leu- culture tubes and treated with 15 mM GO for 12 hr, and the whole cell lysates were processed and probed for CML modifications. (E, F) Analysis of nucleic acid modifications by dot-blot assay. Genomic DNA and global RNA extracted from cells treated with 15 mM GO were dotted on the membrane and detected with anti-CML antibody. (G) C138 amino acid residue is essential for glyoxalase activity. All the proteins were purified and incubated (5 µg) with 0.5 mM GO; subsequently, the absorbance was monitored at 570 nm. BSA was used as negative control in enzymatic assay. Glycation levels represent the relative intensities of the dots and lanes compared with WT. Data from three independent biological replicates was used to determine significance through one-way ANOVA with Dunnet’s multiple comparisons test *, p≤0.05; **, p≤0.01; ***, p≤0.001; NS, not significant.
-
Figure 3—source data 1
Source data for Figure 3A contains densitometric values for graph.
- https://cdn.elifesciences.org/articles/88875/elife-88875-fig3-data1-v2.zip
-
Figure 3—source data 2
Source data for Figure 3B contains densitometric values for graph.
- https://cdn.elifesciences.org/articles/88875/elife-88875-fig3-data2-v2.zip
-
Figure 3—source data 3
Source data for Figure 3D contains raw image of western blot and densitometric values for graph.
- https://cdn.elifesciences.org/articles/88875/elife-88875-fig3-data3-v2.zip
-
Figure 3—source data 4
Source data for Figure 3E contains raw image of western blot and densitometric values for graph.
- https://cdn.elifesciences.org/articles/88875/elife-88875-fig3-data4-v2.zip
-
Figure 3—source data 5
Source data for Figure 3F contains raw image of western blot and densitometric values for graph.
- https://cdn.elifesciences.org/articles/88875/elife-88875-fig3-data5-v2.zip
-
Figure 3—source data 6
Source data for Figure 3G contains densitometric values for graph.
- https://cdn.elifesciences.org/articles/88875/elife-88875-fig3-data6-v2.zip
Figure 3—figure supplement 1
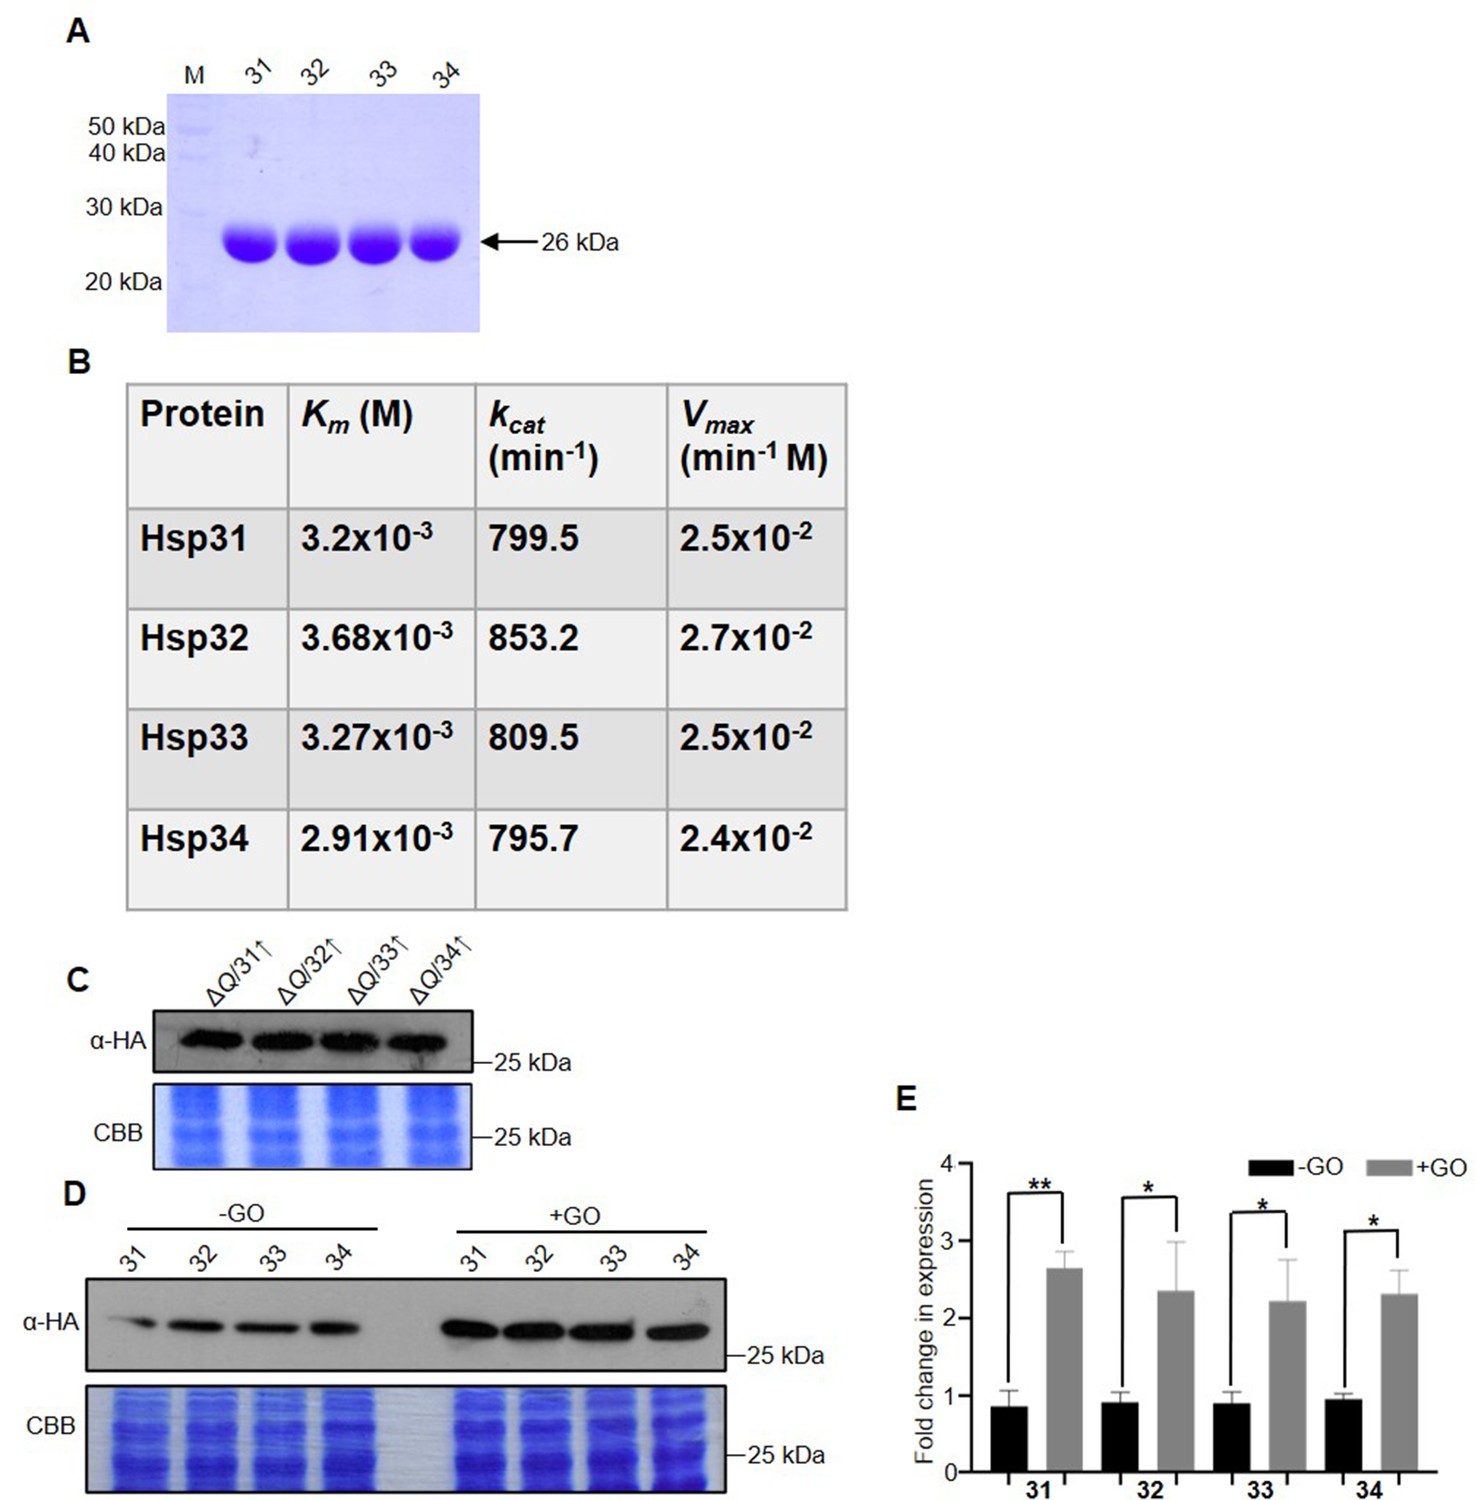
Enzyme kinetics of yeast DJ-1 orthologs and their expression under GO stress.
(A) SDS-PAGE of purified Hsp31 paralogs. 7 µg of Hsp31 paralogs were loaded on SDS-PAGE gel along with the protein marker (M). (B) Raw values of enzyme kinetics. GO was incubated at various concentrations with 5 µg Hsp31 paralogs, and the reaction was terminated at different time intervals. The corresponding readings were plotted on Prism GraphPad 5.0 and calculated for Km, kcat, and Vmax. (C) Hsp31 members expressed under the plasmid pRS415GPD in ΔQ, confirmed with western analysis. (D, E) GO-induced expression of Hsp31 paralogs. Cells expressing Hsp31 members with genomic tagged HA were incubated without or with 15 mM GO for 12 hr, and the expression was determined by immunoblotting with an anti-HA antibody. Gel stained with Coomassie brilliant blue (CBB) was used as a loading control. The fold change in the expression was calculated using Multi-Gauge V3.0 and plotted in Prism GraphPad 5.0. The experiments were performed in three independent biological replicates and statistically analysed by paired t-test, *, p≤0.05; **, p≤0.01; ***, p≤0.001; NS, not significant.
-
Figure 3—figure supplement 1—source data 1
Source data for Figure 3—figure supplement 1A contains raw image of SDS-PAGE.
- https://cdn.elifesciences.org/articles/88875/elife-88875-fig3-figsupp1-data1-v2.zip
-
Figure 3—figure supplement 1—source data 2
Source data for Figure 3—figure supplement 1C contains raw image of western blot.
- https://cdn.elifesciences.org/articles/88875/elife-88875-fig3-figsupp1-data2-v2.zip
-
Figure 3—figure supplement 1—source data 3
Source data for Figure 3—figure supplement 1D contains raw image of western blot.
- https://cdn.elifesciences.org/articles/88875/elife-88875-fig3-figsupp1-data3-v2.zip
-
Figure 3—figure supplement 1—source data 4
Source data for Figure 3—figure supplement 1E contains densitometric values for graph.
- https://cdn.elifesciences.org/articles/88875/elife-88875-fig3-figsupp1-data4-v2.zip
Figure 4
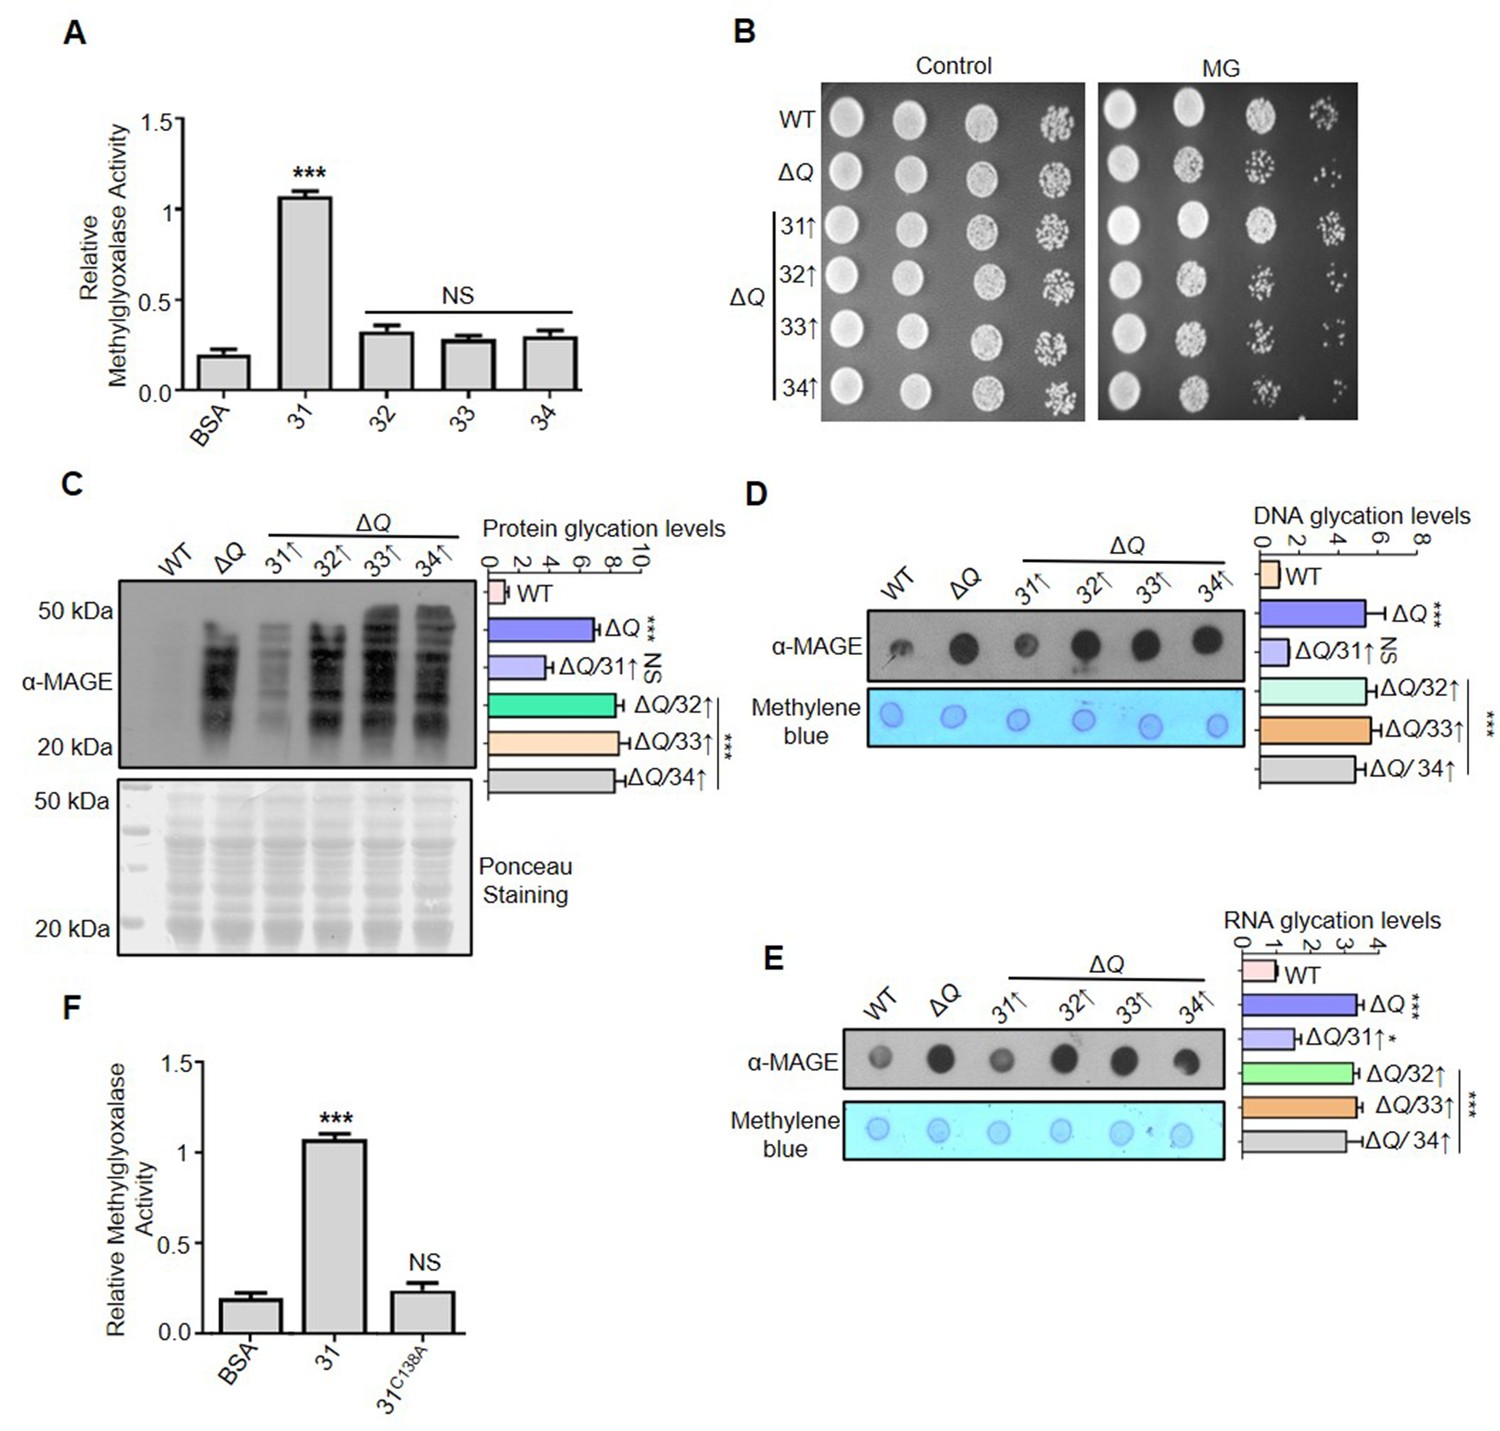
Hsp31 is a potent scavenger of methylglyoxal.
(A) In vitro methylglyoxalase activity. Purified Hsp31 members 5 µg each were incubated with 0.5 mM MG, and the absorbance at 530 nm was monitored. (B) Spot assay. Respective strains grown till the mid-log phase were harvested and treated with 10 mM MG for 5 hr before spotting on SD Leu- plates. Images were captured at 36 hr. (C–E) Hsp31 reduces MG-derived AGE modifications. Individual strains were treated with 10 mM MG in the culture tubes for 12 hr, and the macromolecule glycation was analyzed using an anti-MAGE antibody. (F) C138 amino acid residue is critical for methylglyoxalase activity. 5 µg of Hsp31-WT and Hsp31C138A mutant were incubated with MG, and the activity was examined at 530 nm. BSA was used as negative control in enzymatic assay. Glycation levels represent the relative intensities of the dots and lanes compared with WT. One-way ANOVA with Dunnett’s multiple comparisons test was used to determine significance from three independent biological replicates, *, p≤0.05; **, p≤0.01; ***, p≤0.001; NS, not significant.
-
Figure 4—source data 1
Source data for Figure 4A contains densitometric values for graph.
- https://cdn.elifesciences.org/articles/88875/elife-88875-fig4-data1-v2.zip
-
Figure 4—source data 2
Source data for Figure 4C contains raw image of western blot and densitometric values for graph.
- https://cdn.elifesciences.org/articles/88875/elife-88875-fig4-data2-v2.zip
-
Figure 4—source data 3
Source data for Figure 4D contains raw image of western blot and densitometric values for graph.
- https://cdn.elifesciences.org/articles/88875/elife-88875-fig4-data3-v2.zip
-
Figure 4—source data 4
Source data for Figure 4E contains raw image of western blot and densitometric values for graph.
- https://cdn.elifesciences.org/articles/88875/elife-88875-fig4-data4-v2.zip
-
Figure 4—source data 5
Source data for Figure 4F densitometric values for graph.
- https://cdn.elifesciences.org/articles/88875/elife-88875-fig4-data5-v2.zip
Figure 5 with 1 supplement
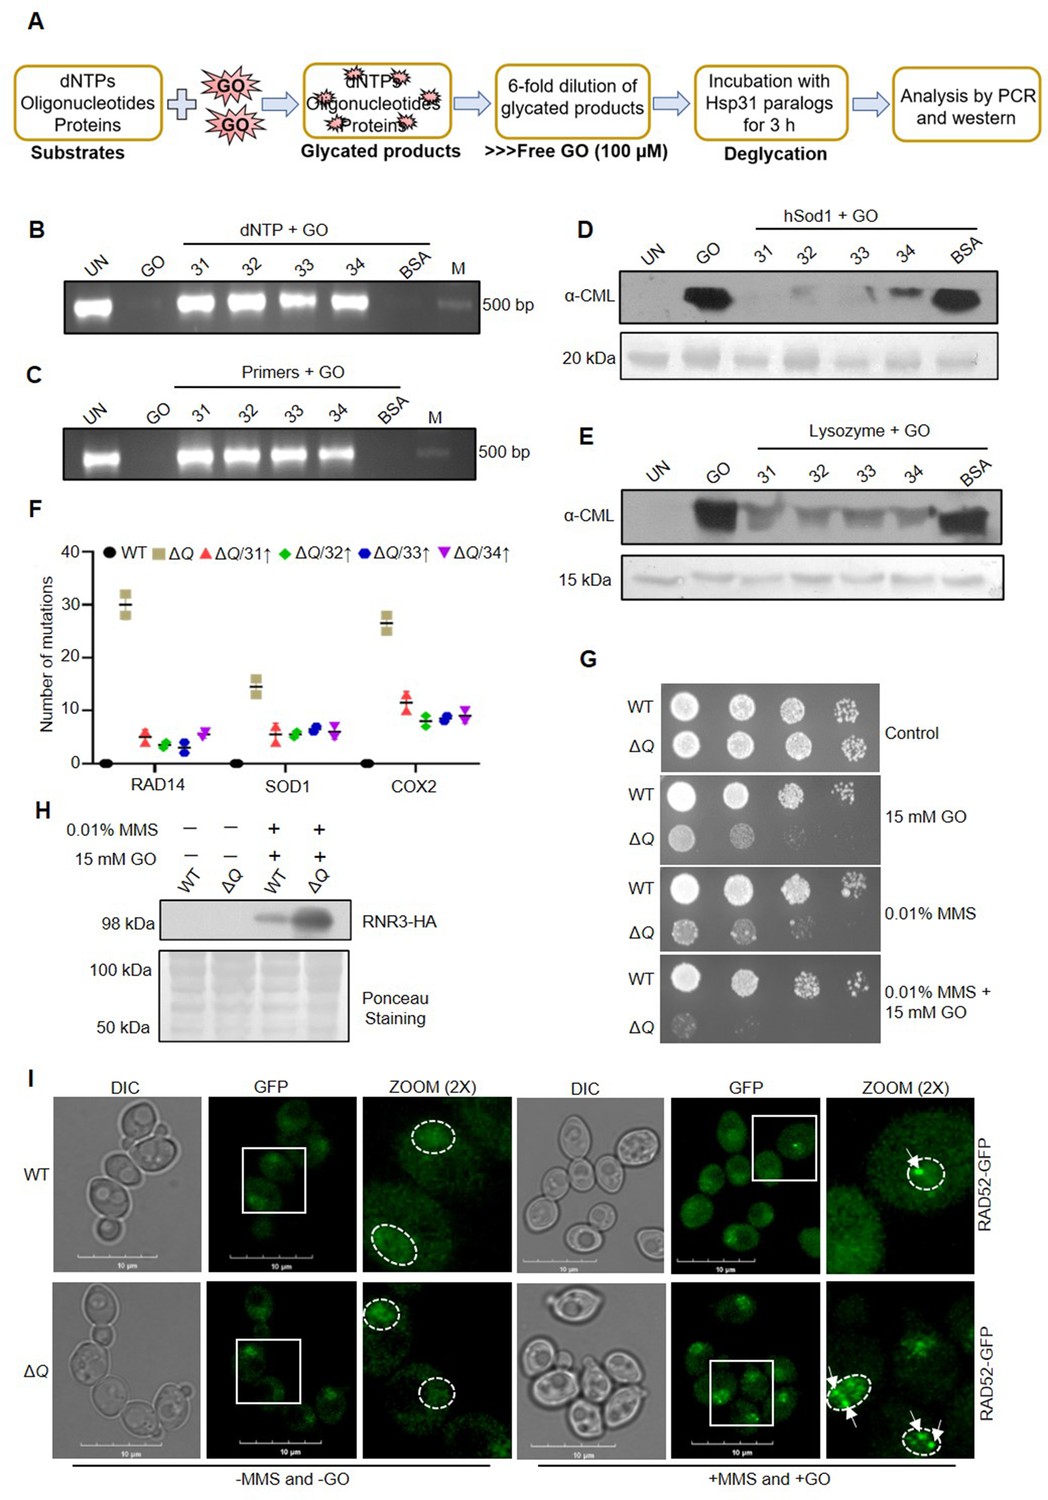
In vitro deglycation of DNA and proteins, and genotoxic sensitivity in the absence of yeast DJ-1 orthologs.
(A) Schematic representation of the experimental procedure followed for DNA and protein deglycation reactions. (B, C) Hsp31 paralogs deglycate DNA. 500 µM dNTPs (B) or 150 µM forward and reverse primers (C) were incubated without (UN) or with 2 mM GO for 2 hr, followed by 3 hr incubation with 5 µg Hsp31 paralogs. The samples were examined for deglycation through PCR. (D, E) Yeast DJ-1 members repair glycated proteins. 2 µg of purified protein hSod1 (D) or Lysozyme (E) were treated without (UN) or with 2 mM GO for 2 hr, and the reactions were further incubated for 3 hr with Hsp31 paralogs. Anti-CML antibody was used to determine glycation levels. BSA was used as a negative control in all experiments. 10 kb DNA ladder was used as a marker (M) for DNA gels, and the Ponceau S stain indicates the equal loading of protein samples. (F) Hsp31 paralogs attenuate genetic mutations. Individual genes were PCR amplified, and Sanger sequenced from the isolated genome of strains treated with 15 mM GO. The number of genetic mutations was calculated and plotted on GraphPad prism 5.0 (n=2). (G) Growth phenotypic analysis. Cells grown until the mid-log phase were spotted on plates containing 0.01% MMS or 15 mM GO or 0.01% MMS and 15 mM GO. The plates were incubated at 30 °C and imaged at 36 hr. (H) Western analysis of RNR3 levels. WT and ΔQ grown till the mid-log phase were supplemented with 0.01% MMS, and 15 mM GO in the culture media and further incubated for 3 hr. Subsequently, RNR3 levels were probed using an anti-HA antibody. (I) RAD52 foci formation. Cells were grown until the mid-exponential phase and were treated without (-) or with 0.03% MMS and 15 mM GO for 1 hr. Subsequently, cells were imaged using a confocal microscope (Olympus FV3000). Representative images have a 10 µm scale. All the experiments were performed in three independent biological replicates.
-
Figure 5—source data 1
Source data for Figure 5B contains raw image of agarose gel.
- https://cdn.elifesciences.org/articles/88875/elife-88875-fig5-data1-v2.zip
-
Figure 5—source data 2
Source data for Figure 5C contains raw image of agarose gel.
- https://cdn.elifesciences.org/articles/88875/elife-88875-fig5-data2-v2.zip
-
Figure 5—source data 3
Source data for Figure 5D contains raw image of western blot.
- https://cdn.elifesciences.org/articles/88875/elife-88875-fig5-data3-v2.zip
-
Figure 5—source data 4
Source data for Figure 5E contains raw image of western blot.
- https://cdn.elifesciences.org/articles/88875/elife-88875-fig5-data4-v2.zip
-
Figure 5—source data 5
Source data for Figure 5H contains raw image of western blot.
- https://cdn.elifesciences.org/articles/88875/elife-88875-fig5-data5-v2.zip
-
Figure 5—source data 6
Source data for Figure 5F contains multiple sequence alignment highlighting the mutations.
- https://cdn.elifesciences.org/articles/88875/elife-88875-fig5-data6-v2.zip
Figure 5—figure supplement 1
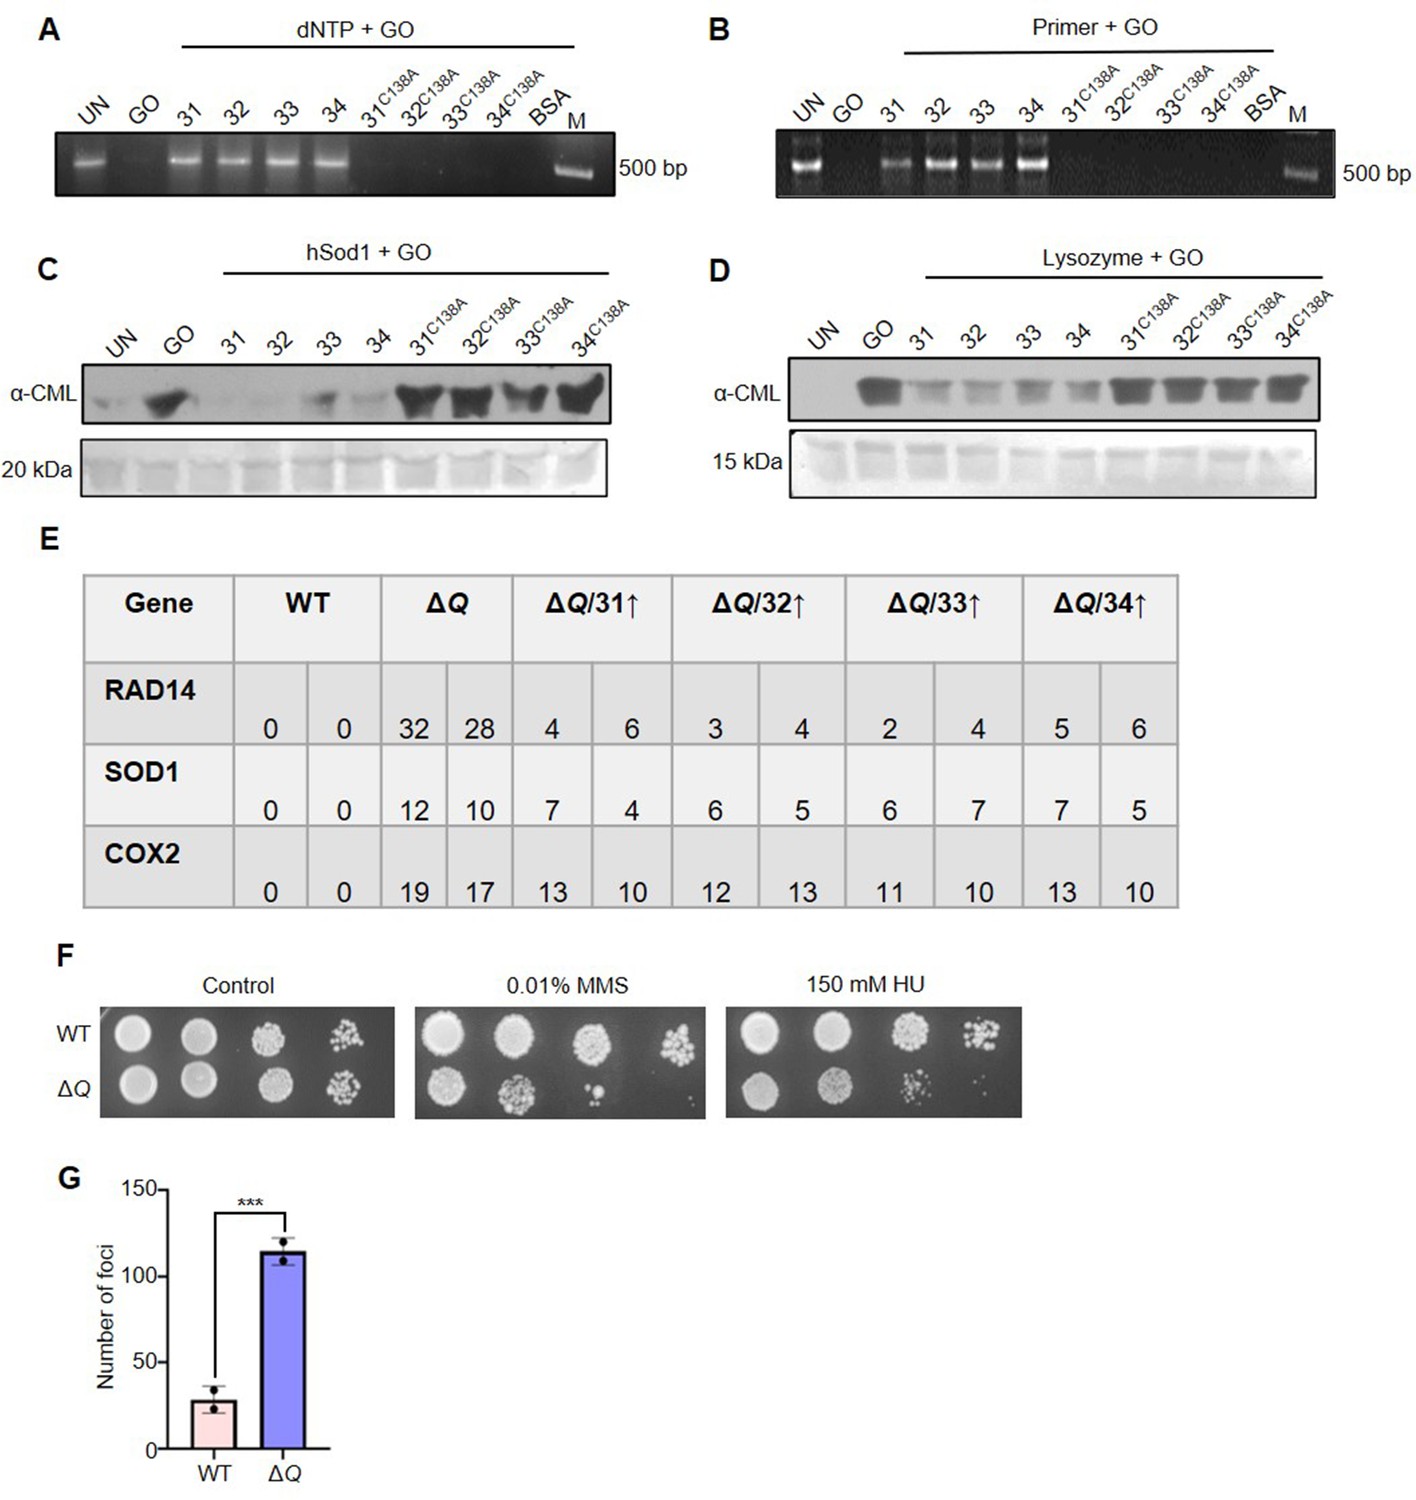
GO-associated macromolecular deglycation, mutation frequency profile, and genotoxic damage.
(A, B) Deglycation of DNA by C138A mutants of Hsp31 paralogs. dNTPs (500 µM) and DNA oligonucleotides (150 µM) were incubated for 2 hr in the absence and presence of 2 mM GO, followed by deglycation with Hsp31 paralogs and C138A mutants for 3 hr. (C, D) C138 amino acid residue is crucial for protein deglycase activity. 2 µg glycated hSod1 and Lysozyme were individually supplemented with 5 µg of Hsp31 paralogs (WT), or mutant paralogs (C138A) and subjected to western analysis to determine the glycation status (E) Respective genes were PCR amplified from cells treated with 15 mM GO for 16 hr and Sanger sequenced. The number of genetic mutations from various genes is represented here. (F) Phenotypic analysis under DNA damaging agents. The cells harvested from the mid-log phase were spotted on plates containing 0.01% MMS or 150 mM HU. Plates were incubated at 30 °C and imaged at 36 hr. (G) Quantitation of RAD52 foci formation. Foci of individual strains were quantitated from three independent biological replicates, statically analysed through paired t-test and plotted on Prism GraphPad 5.0.
-
Figure 5—figure supplement 1—source data 1
Source data for Figure 5—figure supplement 1A contains raw image of agarose gel.
- https://cdn.elifesciences.org/articles/88875/elife-88875-fig5-figsupp1-data1-v2.zip
-
Figure 5—figure supplement 1—source data 2
Source data for Figure 5—figure supplement 1B contains raw image of agarose gel.
- https://cdn.elifesciences.org/articles/88875/elife-88875-fig5-figsupp1-data2-v2.zip
-
Figure 5—figure supplement 1—source data 3
Source data for Figure 5—figure supplement 1C contains raw image of western blot.
- https://cdn.elifesciences.org/articles/88875/elife-88875-fig5-figsupp1-data3-v2.zip
-
Figure 5—figure supplement 1—source data 4
Source data for Figure 5—figure supplement 1D contains raw image of western blot.
- https://cdn.elifesciences.org/articles/88875/elife-88875-fig5-figsupp1-data4-v2.zip
-
Figure 5—figure supplement 1—source data 5
Source data for Figure 5—figure supplement 1G contains densitometric values of graph.
- https://cdn.elifesciences.org/articles/88875/elife-88875-fig5-figsupp1-data5-v2.zip
Figure 6 with 1 supplement
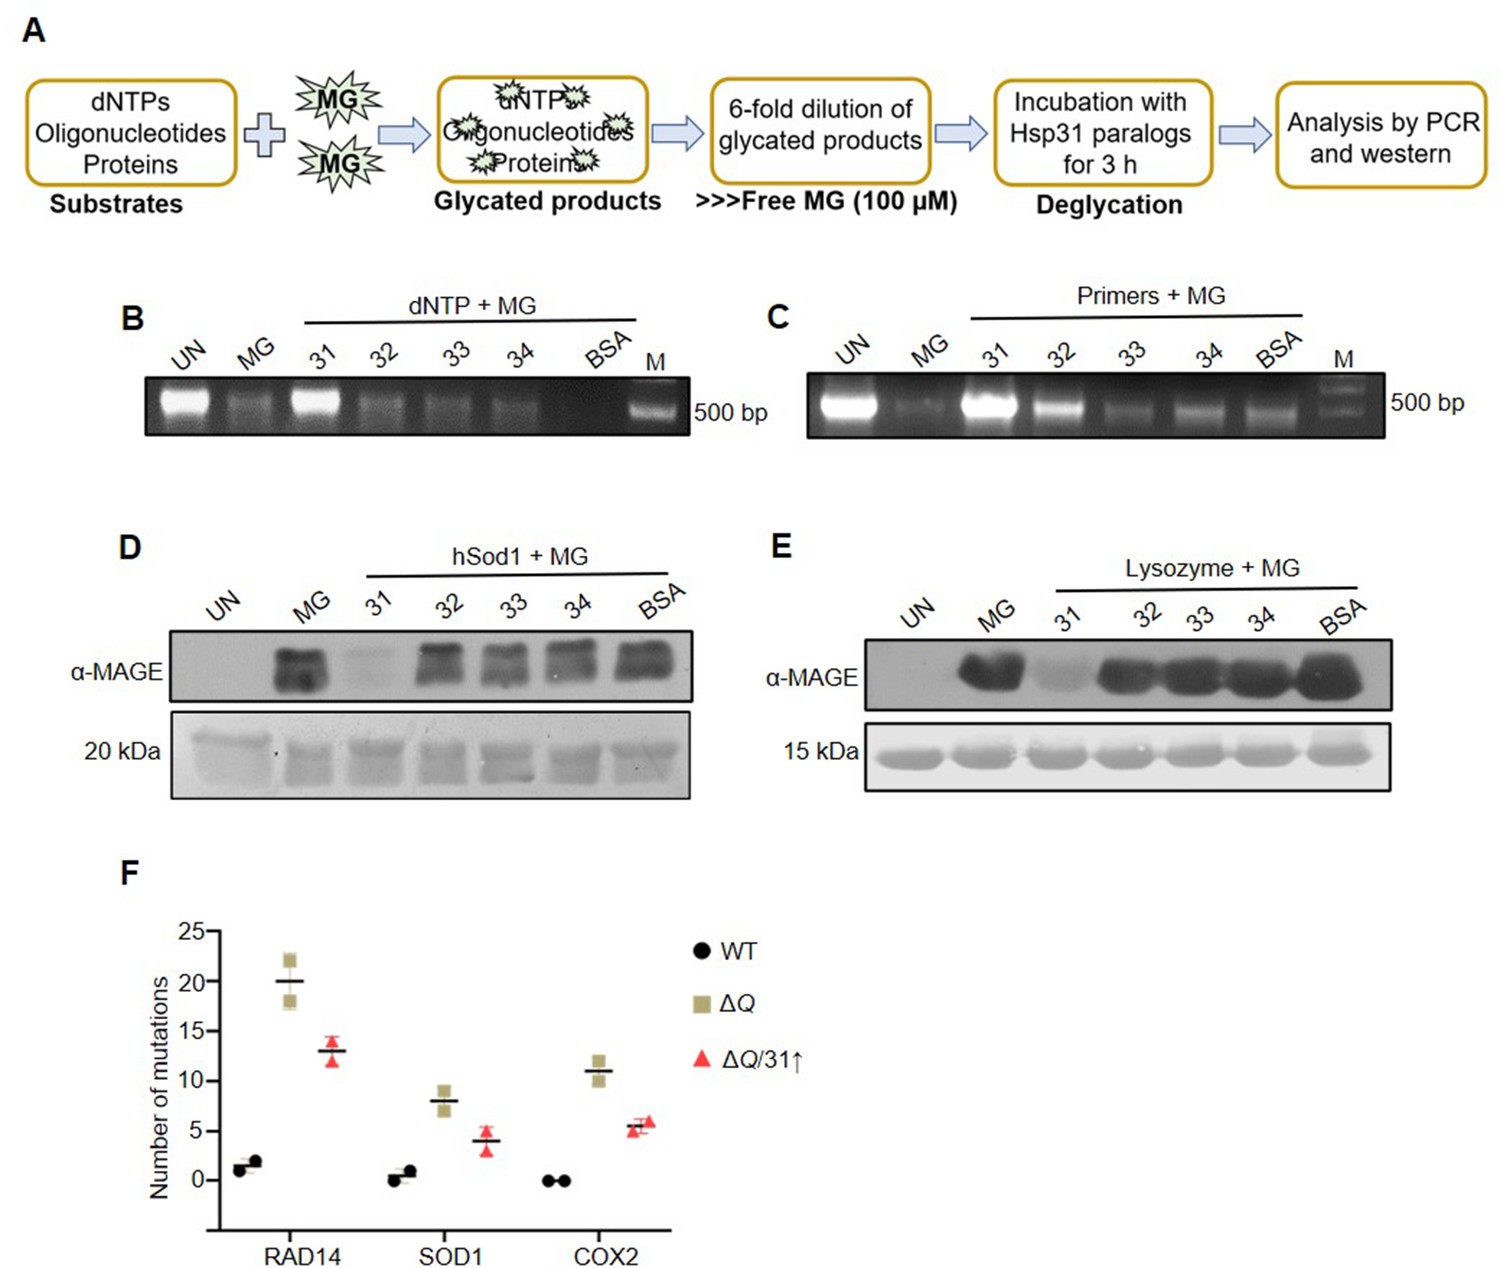
Hsp31 repairs MG-derived AGE modifications on DNA and proteins.
(A) Schematic representation of the experimental procedure used for DNA and protein deglycation reactions. (B, C) DNA deglycation by Hsp31. 500 µM dNTPs (B) or 150 µM forward and reverse primers (C) were incubated without (UN) or with 2 mM MG for 2 hr. Subsequently, 5 µg Hsp31 paralogs were added and incubated for 3 hr. The samples were subjected for PCR analysis. (D, E) Hsp31 reverts MG modification on proteins. hSod1 (D) and Lysozyme (E) were glycated for 2 hr with 2 mM MG and incubated with Hsp31 paralogs. The glycation status was determined through western analysis against anti-MAGE antibody. 10 kb DNA ladder was used as a marker (M) for DNA gels, and the Ponceau S stain indicates the equal loading of protein samples. BSA was used as a negative control in all experiments. The experiments were performed in three independent biological replicates. (F) The dual role of Hsp31 reduces MG-induced DNA mutations. Respective genes were PCR amplified, and Sanger sequenced from strains treated with 10 mM MG. The number of genetic mutations was plotted on GraphPad prism 5.0 (n=2).
-
Figure 6—source data 1
Source data for Figure 6B contains raw image of agarose gel.
- https://cdn.elifesciences.org/articles/88875/elife-88875-fig6-data1-v2.zip
-
Figure 6—source data 2
Source data for Figure 6C contains raw image of agarose gel.
- https://cdn.elifesciences.org/articles/88875/elife-88875-fig6-data2-v2.zip
-
Figure 6—source data 3
Source data for Figure 6D contains raw image of western blot.
- https://cdn.elifesciences.org/articles/88875/elife-88875-fig6-data3-v2.zip
-
Figure 6—source data 4
Source data for Figure 6E contains raw image of western blot.
- https://cdn.elifesciences.org/articles/88875/elife-88875-fig6-data4-v2.zip
-
Figure 6—source data 5
Source data for Figure 6F contains multiple sequence alignment highlighting the mutations.
- https://cdn.elifesciences.org/articles/88875/elife-88875-fig6-data5-v2.zip
Figure 6—figure supplement 1
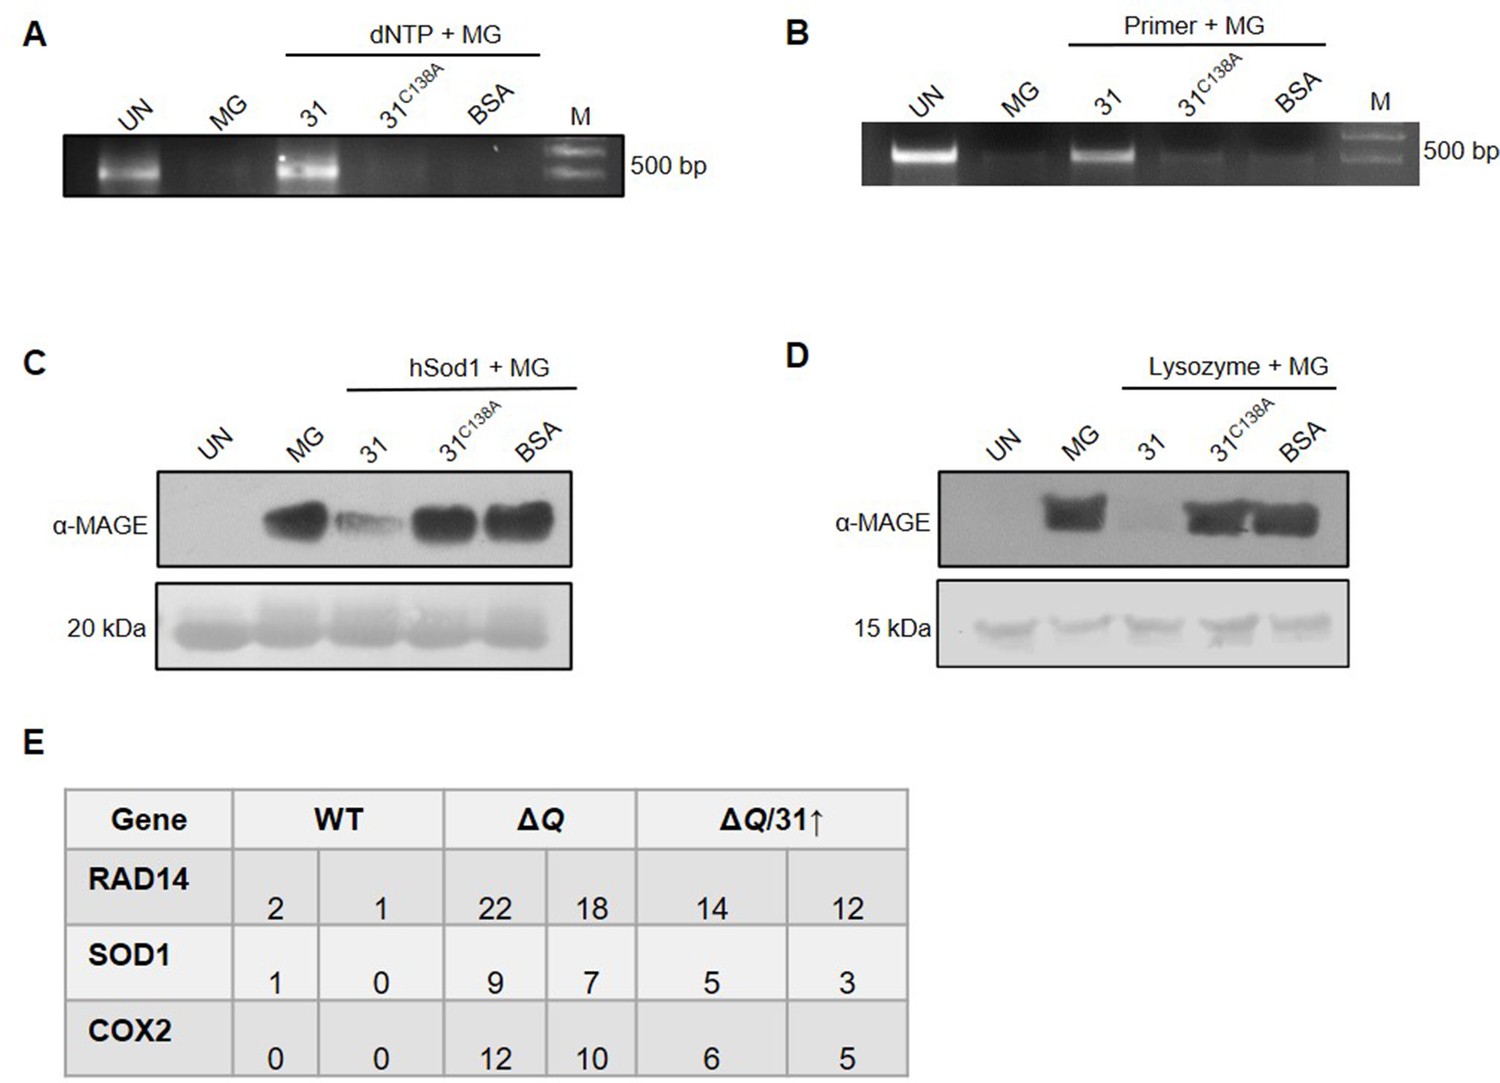
Hsp31C138A fails to repair glycated DNA and proteins.
(A–D) Hsp31C138A mutant lacks deglycase activity. Macromolecules were treated with 2 mM MG for 2 hr and incubated with Hsp31-WT and Hsp31C138A mutant (2 µg each). The glycation status was determined through PCR and western analysis. (E) Individual genes, as indicated, were PCR amplified from various strains incubated with 10 mM MG for 16 hr and Sanger sequenced. The number of genetic mutations was determined and represented here.
-
Figure 6—figure supplement 1—source data 1
Source data for Figure 6—figure supplement 1A contains raw image of agarose gel.
- https://cdn.elifesciences.org/articles/88875/elife-88875-fig6-figsupp1-data1-v2.zip
-
Figure 6—figure supplement 1—source data 2
Source data for Figure 6—figure supplement 1B contains raw image of agarose gel.
- https://cdn.elifesciences.org/articles/88875/elife-88875-fig6-figsupp1-data2-v2.zip
-
Figure 6—figure supplement 1—source data 3
Source data for Figure 6—figure supplement 1C contains raw image of western blot.
- https://cdn.elifesciences.org/articles/88875/elife-88875-fig6-figsupp1-data3-v2.zip
-
Figure 6—figure supplement 1—source data 4
Source data for Figure 6—figure supplement 1D contains raw image of western blot.
- https://cdn.elifesciences.org/articles/88875/elife-88875-fig6-figsupp1-data4-v2.zip
Figure 7 with 1 supplement

Dicarbonyl-induced translocation of yeast DJ-1 orthologs into mitochondria.
(A–E) Mitochondrial translocation of Hsp31 paralogs. WT strain expressing genomic GFP tagged Hsp31 paralogs, and MTS-mCherry (decorates mitochondria) plasmid were treated with either buffer (-GO/-MG) or 15 mM GO (+GO) or 10 mM MG (+MG) for 3 hr. Consequently, images were captured in a confocal microscope (Olympus FV3000) and represented with 10 µm scale. (F–G) Mitochondrial protein and DNA glycation levels. WT and ΔQ overexpressing Hsp31 class of proteins were treated with 15 mM GO stress, followed by isolation of mitochondria and western analysis to determine glyoxal modifications using anti-CML antibody. The intensity of each lane and dot was quantitated densitometrically and plotted in the graph. One-way ANOVA with Dunnett’s multiple comparisons test was used to determine significance from three independent biological replicates, *, p≤0.05; **, p≤0.01; ***, p≤0.001; NS, not significant.
-
Figure 7—source data 1
Source data for Figure 7F contains raw image of western blot and densitometric values for graph.
- https://cdn.elifesciences.org/articles/88875/elife-88875-fig7-data1-v2.zip
-
Figure 7—source data 2
Source data for Figure 7G contains raw image of western blot and densitometric values for graph.
- https://cdn.elifesciences.org/articles/88875/elife-88875-fig7-data2-v2.zip
Figure 7—figure supplement 1
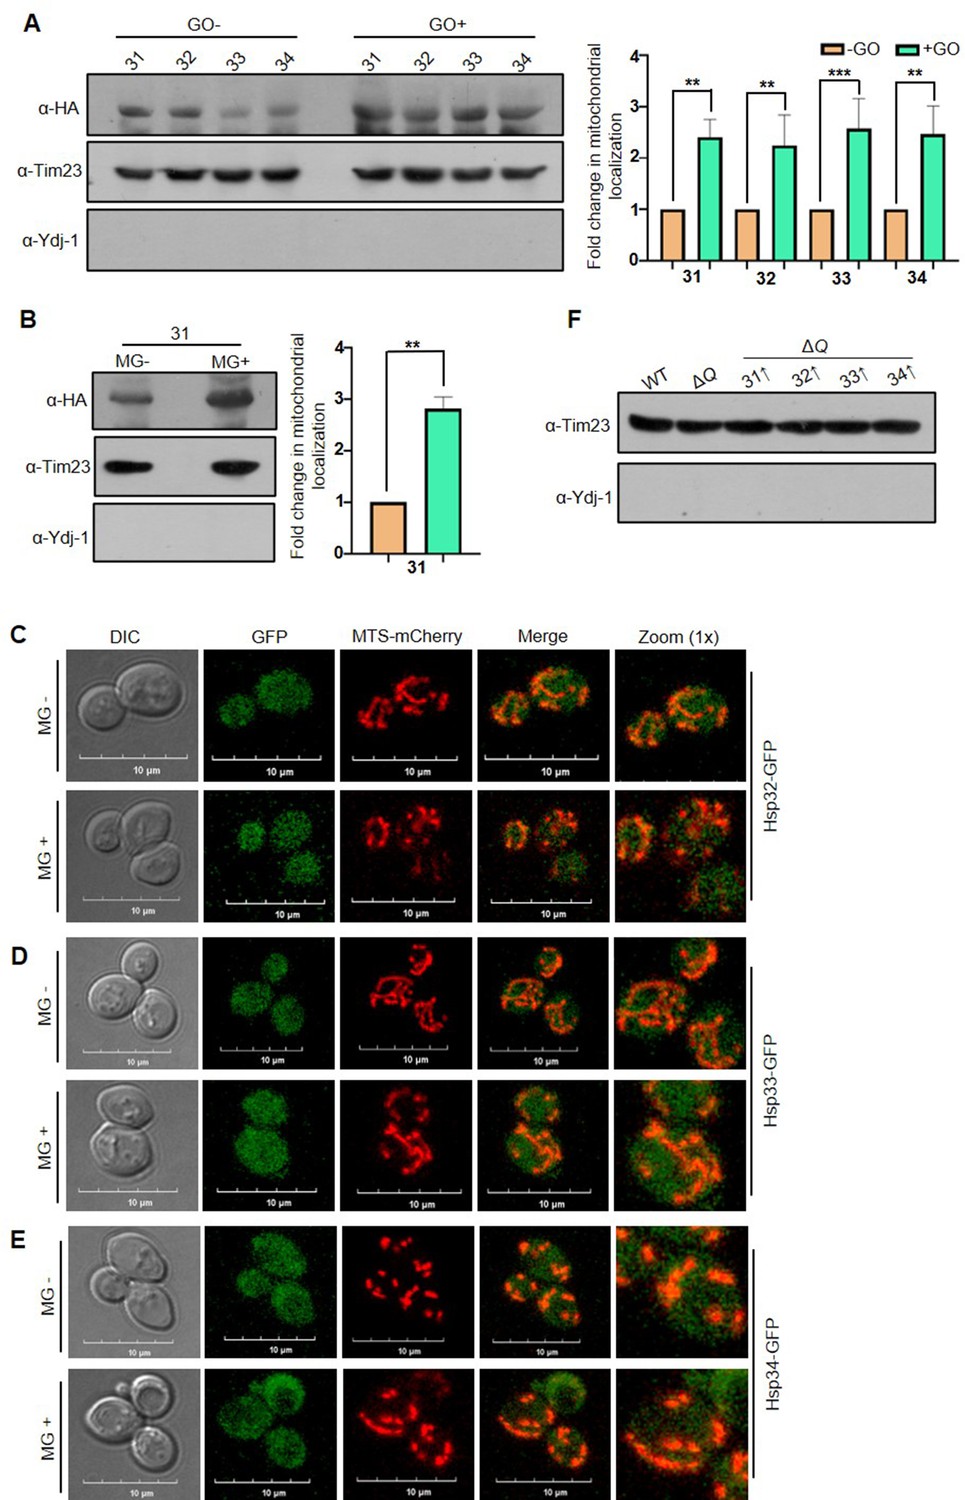
Western and microscopic analysis of mitochondrial translocated Hsp31 paralogs.
(A) Hsp31 paralogs genomically tagged with HA were treated with GO at log phase, and their levels were probed from fractionated mitochondria. For fold change, the band intensities were quantified and normalized with no treatment (-GO). The purity is indicated by the mitochondrial and cytosol control proteins, Tim23 and Ydj-1, respectively. (B) Probing mitochondrial translocated Hsp31. Mitochondria were isolated from MG-treated cells expressing Hsp31-HA. and subjected to immunoblotting to determine the levels. The band intensities from respective lanes were quantified and normalized with –MG. (C–E) MG does not affect the localization of Hsp32, Hsp33, and Hsp34. Cells containing genomic GFP-tagged Hsp31 paralogs and MTS-mCherry were incubated without (-MG) or with MG (+MG) and visualized under the microscope. (F) Purity of isolated mitochondria used in the study (Figure 7F, G) were analyzed for quality by probing with mitochondrial control, Tim23, and cytosol control Ydj-1 proteins. Paired t-test was used to determine significance of three independent biological replicates, *, p≤0.05; **, p≤0.01; ***, p≤0.001; NS, not significant.
-
Figure 7—figure supplement 1—source data 1
Source data for Figure 7—figure supplement 1A contains raw image of western blot and densitometric values for graph.
- https://cdn.elifesciences.org/articles/88875/elife-88875-fig7-figsupp1-data1-v2.zip
-
Figure 7—figure supplement 1—source data 2
Source data for Figure 7—figure supplement 1B contains raw image of western blot and densitometric values for graph.
- https://cdn.elifesciences.org/articles/88875/elife-88875-fig7-figsupp1-data2-v2.zip
-
Figure 7—figure supplement 1—source data 3
Source data for Figure 7—figure supplement 1F contains raw image of western blot.
- https://cdn.elifesciences.org/articles/88875/elife-88875-fig7-figsupp1-data3-v2.zip
Figure 8 with 1 supplement
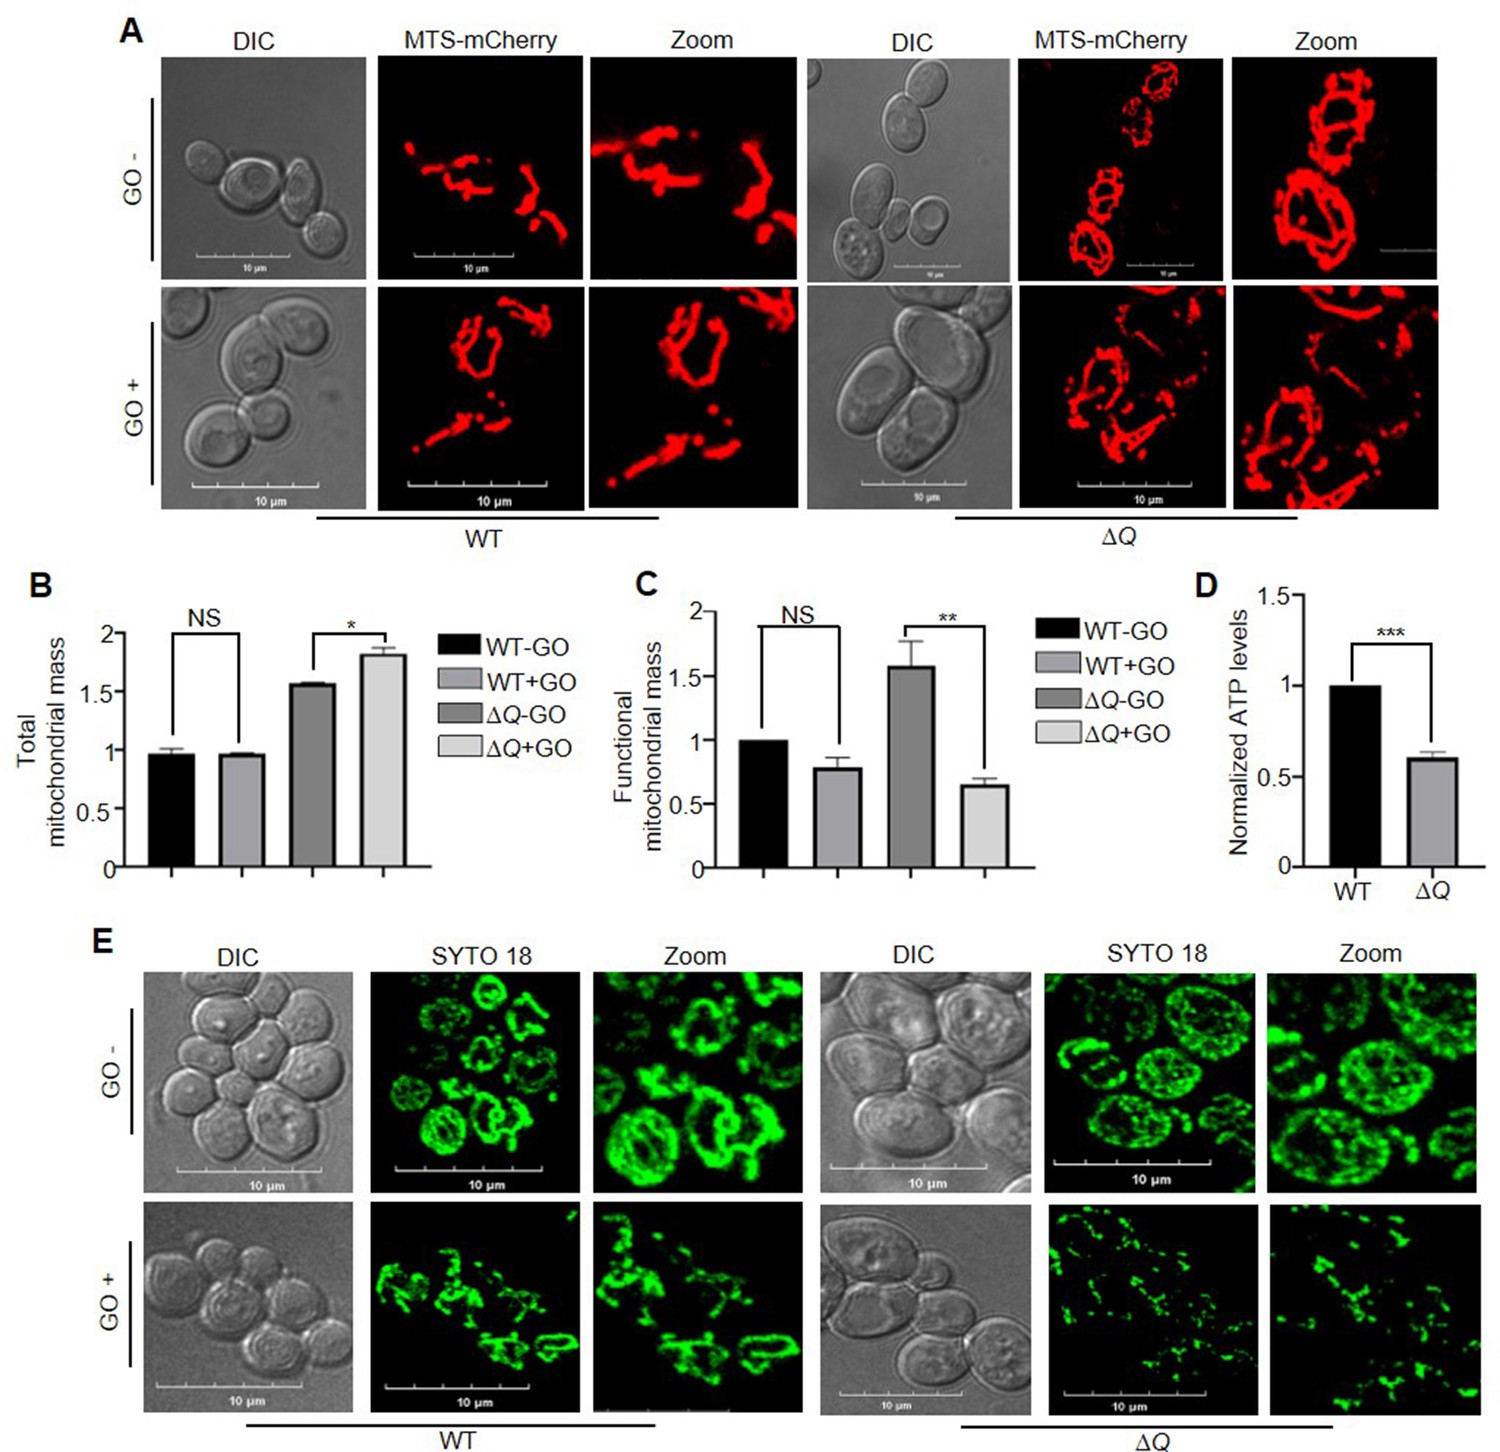
Loss of yeast DJ-1 members induces mitochondrial dysfunction.
(A) Visualization of mitochondrial morphology. WT and ∆Q strains expressing MTS-mCherry (decorates mitochondria) were either treated with buffer (-GO) or 15 mM GO (+GO), followed by imaging. (B, C) FACS analysis to estimate total and functional mitochondrial mass. Respective strains were grown till the early log phase, followed by incubation with GO. Later, the cells were stained with Nonyl Acridine Orange (NAO) for total mass and TetraMethylRhodamine ethyl ester (TMRE) for determining functional mass. (D) Measurement of ATP levels. Selected strains were exposed to GO treatment at the mid-log phase. Consequently, the mitochondria were isolated, and the ATP levels were estimated through a fluorescence assay. (E) mtDNA staining by SYTO18. Following the treatment with GO, WT, and ∆Q were stained with SYTO18 dye. The microscopic analysis was performed in a confocal microscope (Olympus FV3000), with10 µm scale in images. All experiments were performed in three independent biological replicates and analysed through paired t-test to determine significance, *, p≤0.05; **, p≤0.01; ***, p≤0.001; NS, not significant.
-
Figure 8—source data 1
Source data for Figure 8B contains densitometric values for graph.
- https://cdn.elifesciences.org/articles/88875/elife-88875-fig8-data1-v2.zip
-
Figure 8—source data 2
Source data for Figure 8C contains densitometric values for graph.
- https://cdn.elifesciences.org/articles/88875/elife-88875-fig8-data2-v2.zip
-
Figure 8—source data 3
Source data for Figure 8D contains densitometric values for graph.
- https://cdn.elifesciences.org/articles/88875/elife-88875-fig8-data3-v2.zip
Figure 8—figure supplement 1
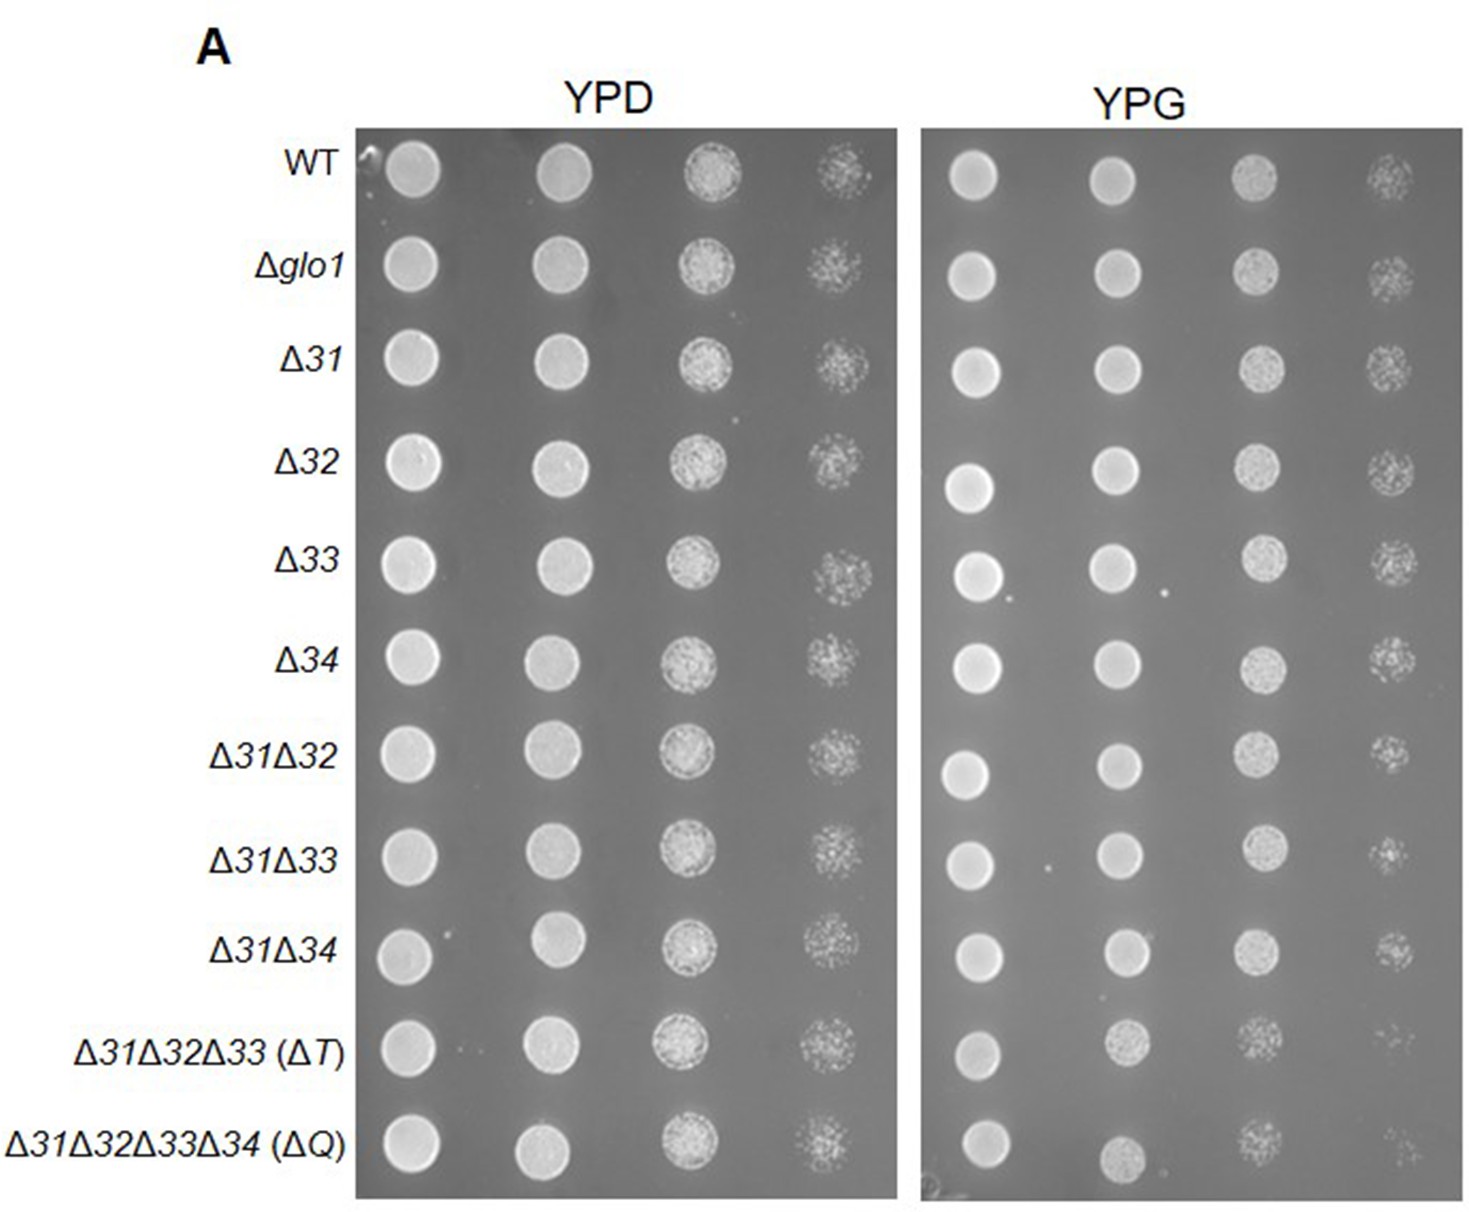
Phenotypic analysis of Hsp31 deletion strains in non-fermentable carbon source.
(A) Selected strains were grown till the early log phase and spotted on media plates containing YP dextrose (2%) or YP glycerol (2%). Plates were incubated at 30 °C, and images were acquired at 36 hr.
Figure 9

Model depicting the role of yeast DJ-1 orthologs in the maintenance and protection against carbonyls.
Various metabolic pathways generate MG and GO that spontaneously glycate cytosol and organellar macromolecules (1). Hsp31 paralogs scavenge excess endogenous RCS and regulate their levels (2). The dual role of paralogs provides nucleic acid protection by efficiently detoxifing the carbonyls and reversing of damaged molecules (3). Deglycation of proteins preserves the functional integrity of proteins (4). Dicarbonyl stress-induced translocation of Hsp31 paralogs into mitochondria confers enhanced organellar protection by attenuating damage to mitochondrial biomolecules (5). Created with BioRender.
Author response image 1

Author response image 2

Estimating mitochondrial mass through MitoTracker deep red.
WT and ∆Q cells from the mid-log phase were incubated without or with GO, and cells were stained with MitoTracker deep red, followed by flow cytometric analysis.
Additional files
-
Supplementary file 1
List of strains, primers, and plasmids used in this study.
- https://cdn.elifesciences.org/articles/88875/elife-88875-supp1-v2.docx
-
MDAR checklist
- https://cdn.elifesciences.org/articles/88875/elife-88875-mdarchecklist1-v2.docx
Download links
A two-part list of links to download the article, or parts of the article, in various formats.
Downloads (link to download the article as PDF)
Open citations (links to open the citations from this article in various online reference manager services)
Cite this article (links to download the citations from this article in formats compatible with various reference manager tools)
Saccharomyces cerevisiae DJ-1 paralogs maintain genome integrity through glycation repair of nucleic acids and proteins
eLife 12:e88875.
https://doi.org/10.7554/eLife.88875


