The importance of individual beliefs in assessing treatment efficacy
- MRC Cognition and Brain Sciences Unit, University of Cambridge, United Kingdom
- Department of Psychiatry, University of Cambridge, United Kingdom
- Department of Experimental Psychology, University of Oxford, United Kingdom
- School of Psychology, University of Surrey, United Kingdom
- Department of Psychiatry, University of California, San Diego, United States
- Temerty Centre for Therapeutic Brain Intervention at the Centre for Addiction and Mental Health and Department of Psychiatry, Temerty Faculty of Medicine, University of Toronto, Canada
Figures
Figure 1
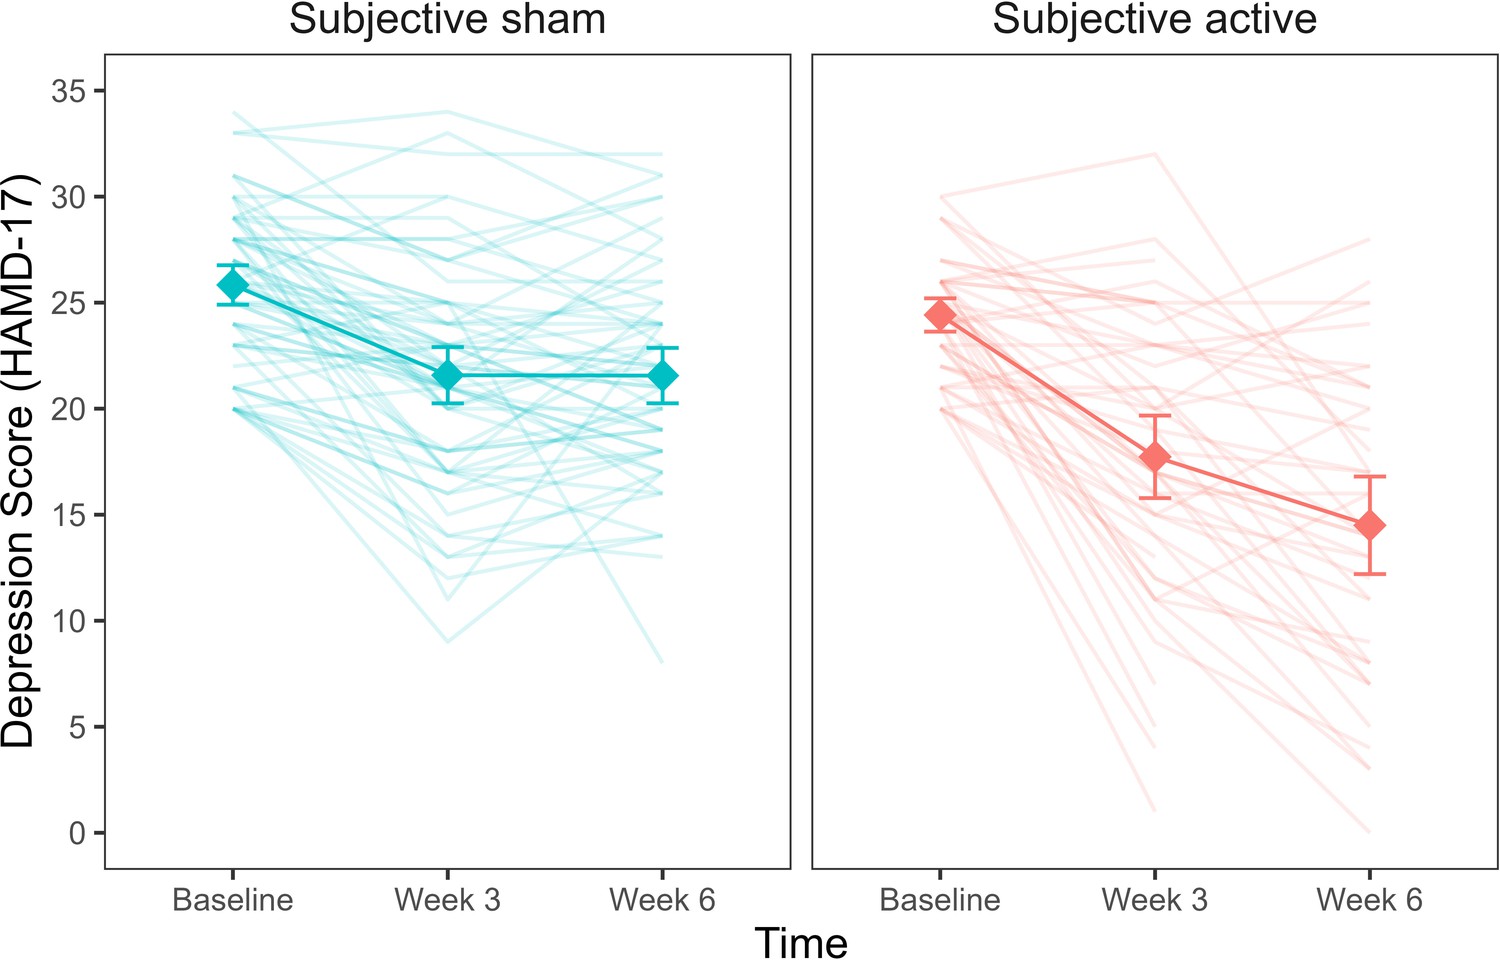
Depression scores as a function of subjective treatment over time.
Each diamond represents the mean depression score (HAMD-17) for the time points (baseline, week 3, week 6), and each line in the background represents a patient. Error bars represent ±1 standard error of the mean.
-
Figure 1—source data 1
Table with sample size (n) for objective and subjective treatment.
- https://cdn.elifesciences.org/articles/88889/elife-88889-fig1-data1-v1.xlsx
-
Figure 1—source data 2
Table with summary statistics for the model comparison with HAMD-17 depressive symptoms as outcome.
The table reports model comparison between the baseline (objective treatment), additive (objective treatment + subjective treatment), and interaction (objective treatment * subjective treatment) models. All models account for time.
- https://cdn.elifesciences.org/articles/88889/elife-88889-fig1-data2-v1.xlsx
-
Figure 1—source data 3
Table with summary statistics for the model comparison with HAMD-17 depressive symptoms as outcome.
The table reports model comparison between the baseline (subjective treatment), additive (subjective treatment + objective treatment), and interaction (subjective treatment * objective treatment) models. All models account for time.
- https://cdn.elifesciences.org/articles/88889/elife-88889-fig1-data3-v1.xlsx
Figure 2
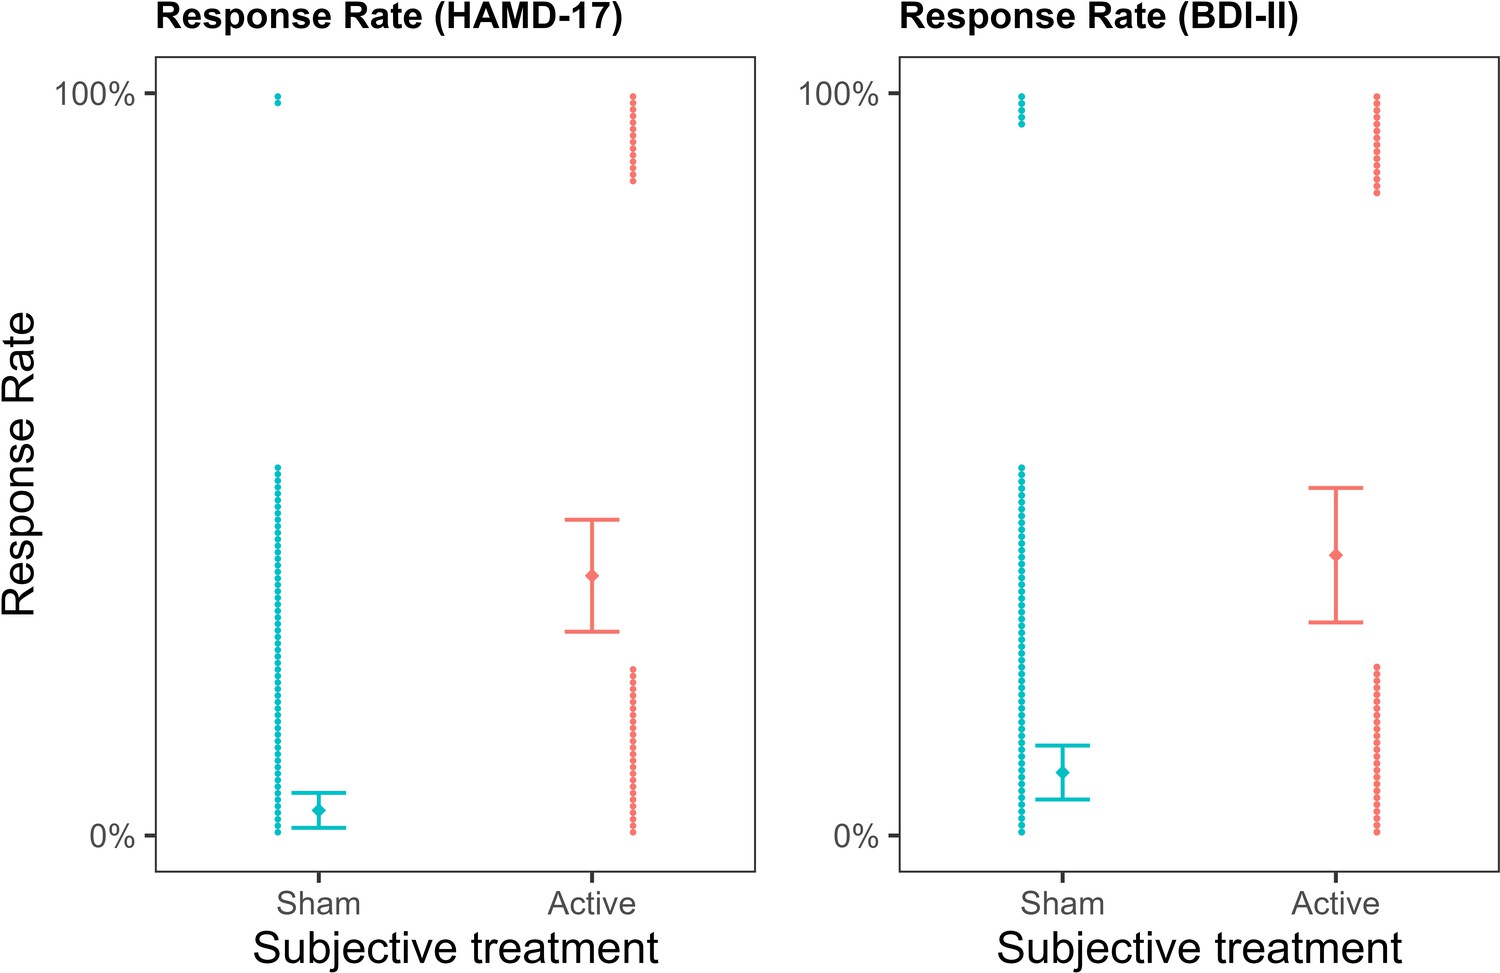
Depression response rates as a function of subjective treatment.
The left plot presents the contribution of subjective treatment on the response rate of the Hamilton Depression Rating Scale (HAMD-17), and the right plot presents the contribution of subjective treatment on the Beck Depression Inventory II (BDI-II). Each dot represents an individual patient, stacked towards 100% representing a response or 0% representing no response. Error bars represent ±1 standard error of the mean.
-
Figure 2—source data 1
Table with summary statistics for the model comparison with HAMD response rates as outcome.
The table reportsmodel comparison between the baseline (objective treatment), additive (objective treatment + subjective treatment), and interaction (objective treatment * subjective treatment) models.
- https://cdn.elifesciences.org/articles/88889/elife-88889-fig2-data1-v1.xlsx
-
Figure 2—source data 2
Table with summary statistics for the model comparison with HAMD response rates as outcome.
The table reportsmodel comparison between the baseline (subjective treatment), additive (subjective treatment + objective treatment), and interaction (subjective treatment * objective treatment) models.
- https://cdn.elifesciences.org/articles/88889/elife-88889-fig2-data2-v1.xlsx
-
Figure 2—source data 3
Table with summary statistics for the model comparison with BDI-II response rates as outcome.
The table reports model comparison between the baseline (objective treatment), additive (objective treatment + subjective treatment), and interaction (objective treatment * subjective treatment) models.
- https://cdn.elifesciences.org/articles/88889/elife-88889-fig2-data3-v1.xlsx
-
Figure 2—source data 4
Table with summary statistics for the model comparison with BDI-II response rates as outcome.
The table reports model comparison between the baseline (subjective treatment), additive (subjective treatment + objective treatment), and interaction (subjective treatment * objective treatment) models.
- https://cdn.elifesciences.org/articles/88889/elife-88889-fig2-data4-v1.xlsx
Figure 3
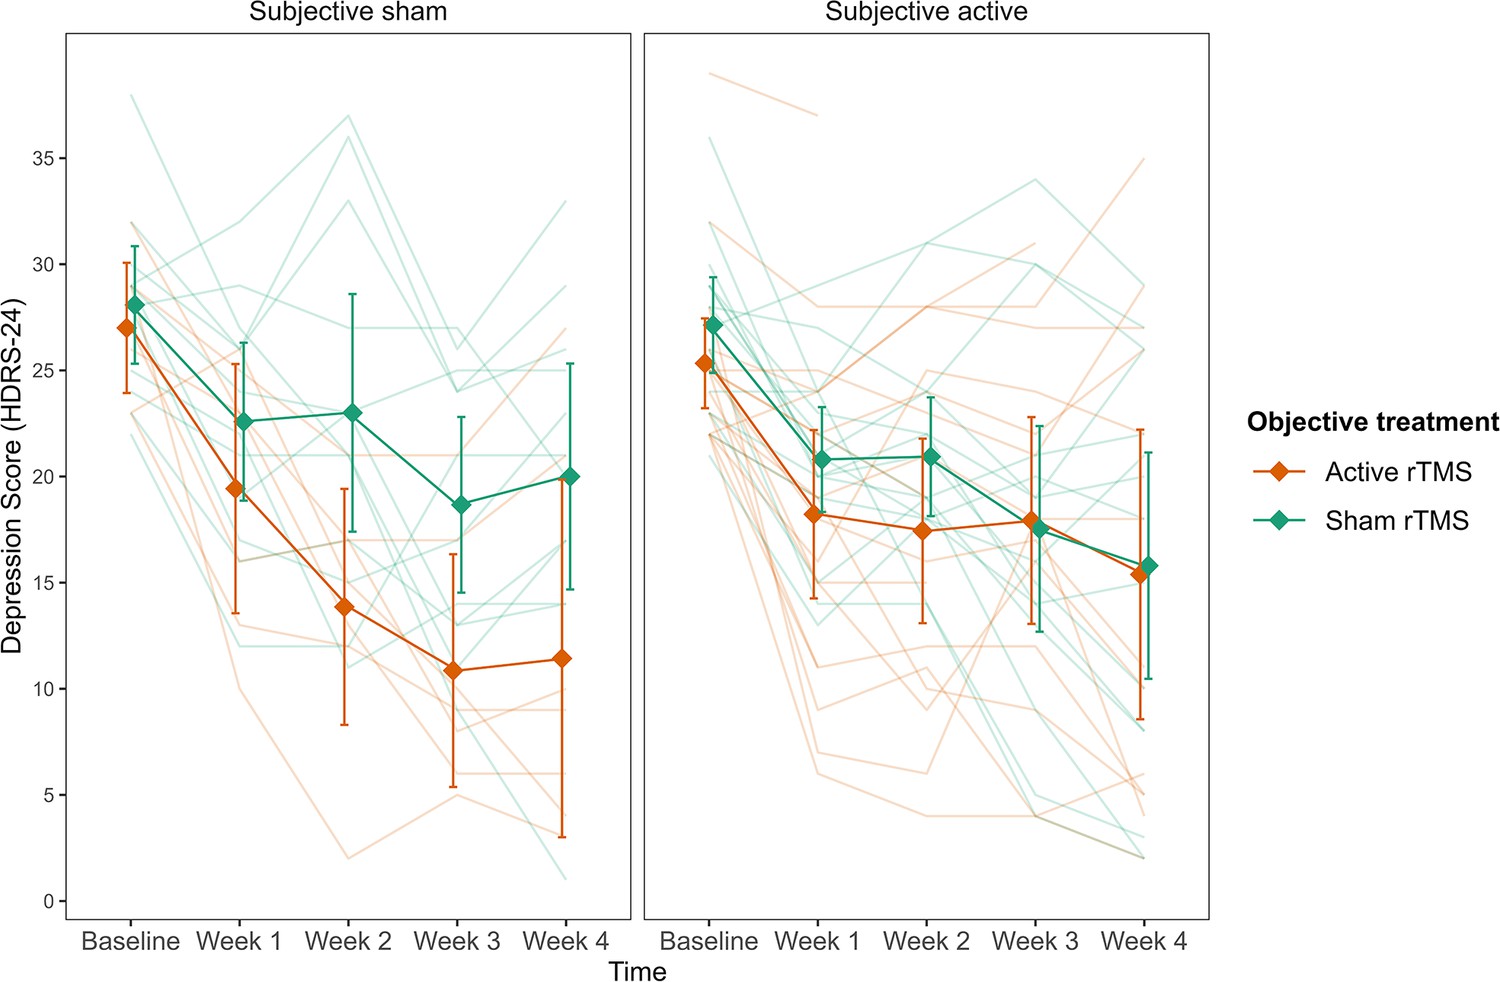
Depression scores as a function of the three-way interaction between subjective treatment, objective treatment, and time.
Subjective sham treatment drives the difference between objective treatments in depression scores.The left plot shows subjective sham treatment, and the right plot shows subjective active treatment. Each line in the background represents a patient. Error bars represent ±1 standard error of the mean.
-
Figure 3—source data 1
Table with sample size (n) for objective and subjective treatment.
- https://cdn.elifesciences.org/articles/88889/elife-88889-fig3-data1-v1.xlsx
-
Figure 3—source data 2
Table with summary statistics for the model comparison with HDRS-24depressive symptoms as outcome.
The table reports the BIC and AIC for model comparison between the baseline (objective treatment), additive (objective treatment + subjective treatment), and interaction (objective treatment * subjective treatment) models. All models account for time.
- https://cdn.elifesciences.org/articles/88889/elife-88889-fig3-data2-v1.xlsx
-
Figure 3—source data 3
Table with summary statistics for the model comparison with HDRS-24depressive symptoms as outcome.
The table reports the BIC and AIC for model comparison between the baseline (subjective treatment), additive (subjective treatment + objective treatment), and interaction (subjective treatment * objective treatment) models. All models account for time.
- https://cdn.elifesciences.org/articles/88889/elife-88889-fig3-data3-v1.xlsx
Figure 4
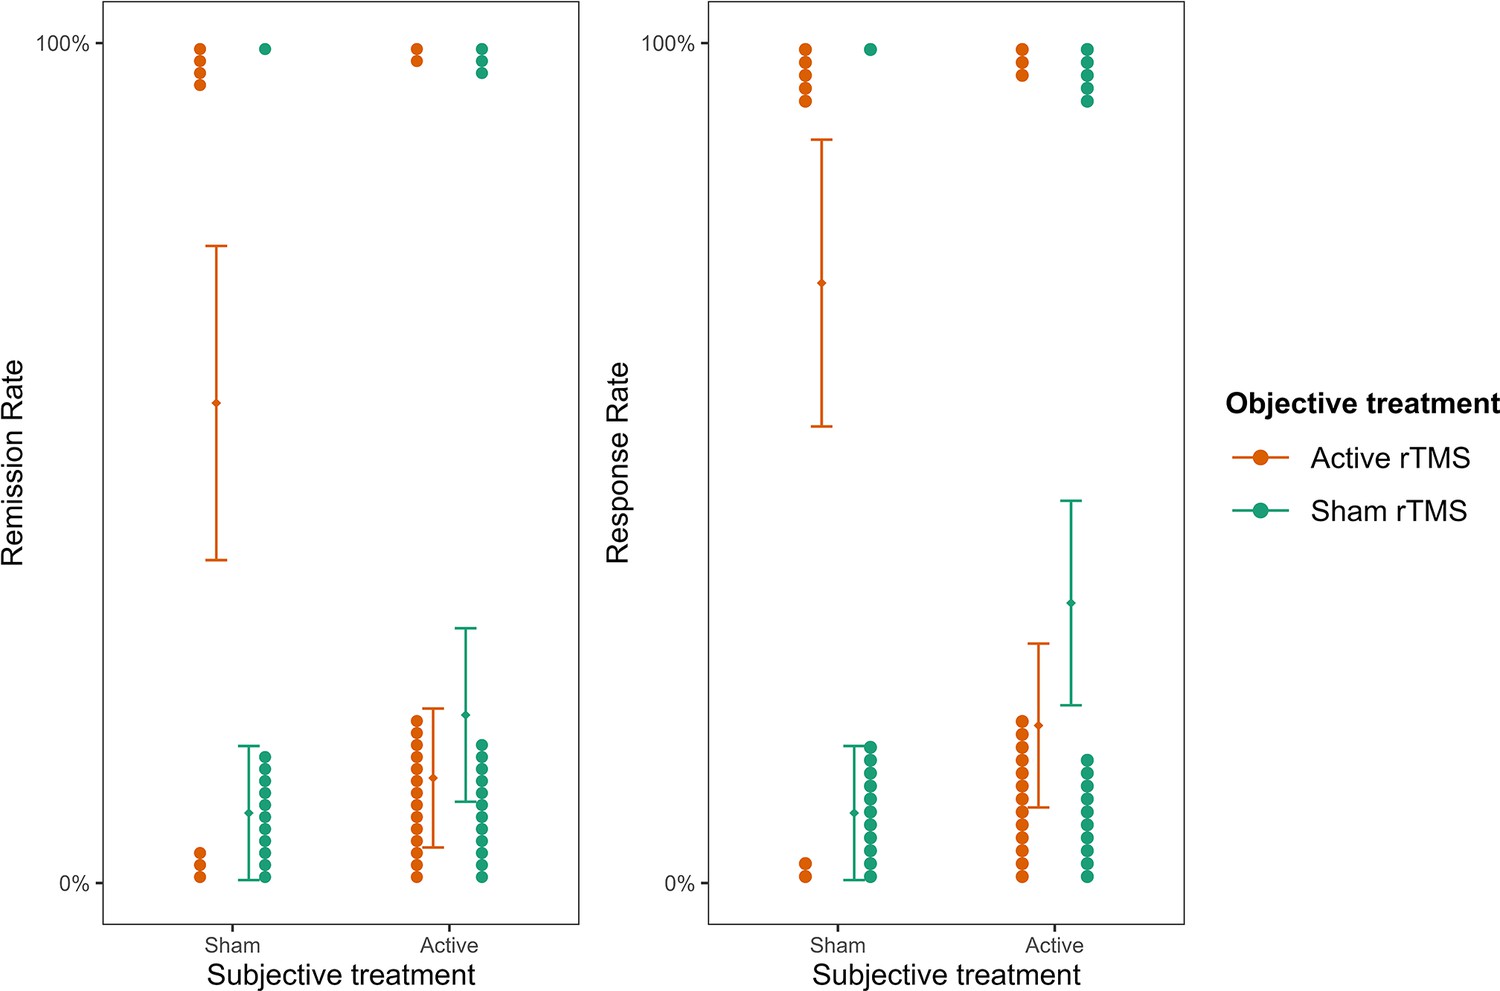
Remission and response rates as a function of subjective and objective treatment.
The plots present the contribution of subjective and objective treatment on the HDRS-24 remission and response rates. Within each plot, the left columns present the contribution of objective active treatment and the right columns the contribution of objective sham treatment, separately for the two levels of subjective treatment. Each dot represents an individual patient and is stacked towards 100% representing a response or 0% representing no response. Error bars represent ±1 standard error of the mean.
-
Figure 4—source data 1
Table with summary statistics for the model comparison with HDRS-24 remission rates as outcome.
The table reports model comparison between the baseline (objective treatment), additive (objective treatment + subjective treatment), and interaction (objective treatment * subjective treatment) models.
- https://cdn.elifesciences.org/articles/88889/elife-88889-fig4-data1-v1.xlsx
-
Figure 4—source data 2
Table with summary statistics for the model comparison with HDRS-24 remission rates as outcome.
The table reports model comparison between the baseline (subjective treatment), additive (subjective treatment + objective treatment), and interaction (subjective treatment * objective treatment) models.
- https://cdn.elifesciences.org/articles/88889/elife-88889-fig4-data2-v1.xlsx
-
Figure 4—source data 3
Table with summary statistics for the model comparison with HDRS-24response rates as outcome.
The table reports model comparison betweenthe baseline (objective treatment), additive (objective treatment + subjective treatment), and interaction (objective treatment * subjective treatment) models.
- https://cdn.elifesciences.org/articles/88889/elife-88889-fig4-data3-v1.xlsx
-
Figure 4—source data 4
Table with summary statistics for the model comparison with HDRS-24response rates as outcome.
The table reports model comparison betweenthe baseline (subjective treatment), additive (subjective treatment + objective treatment), and interaction (subjective treatment * objective treatment) models.
- https://cdn.elifesciences.org/articles/88889/elife-88889-fig4-data4-v1.xlsx
Figure 5
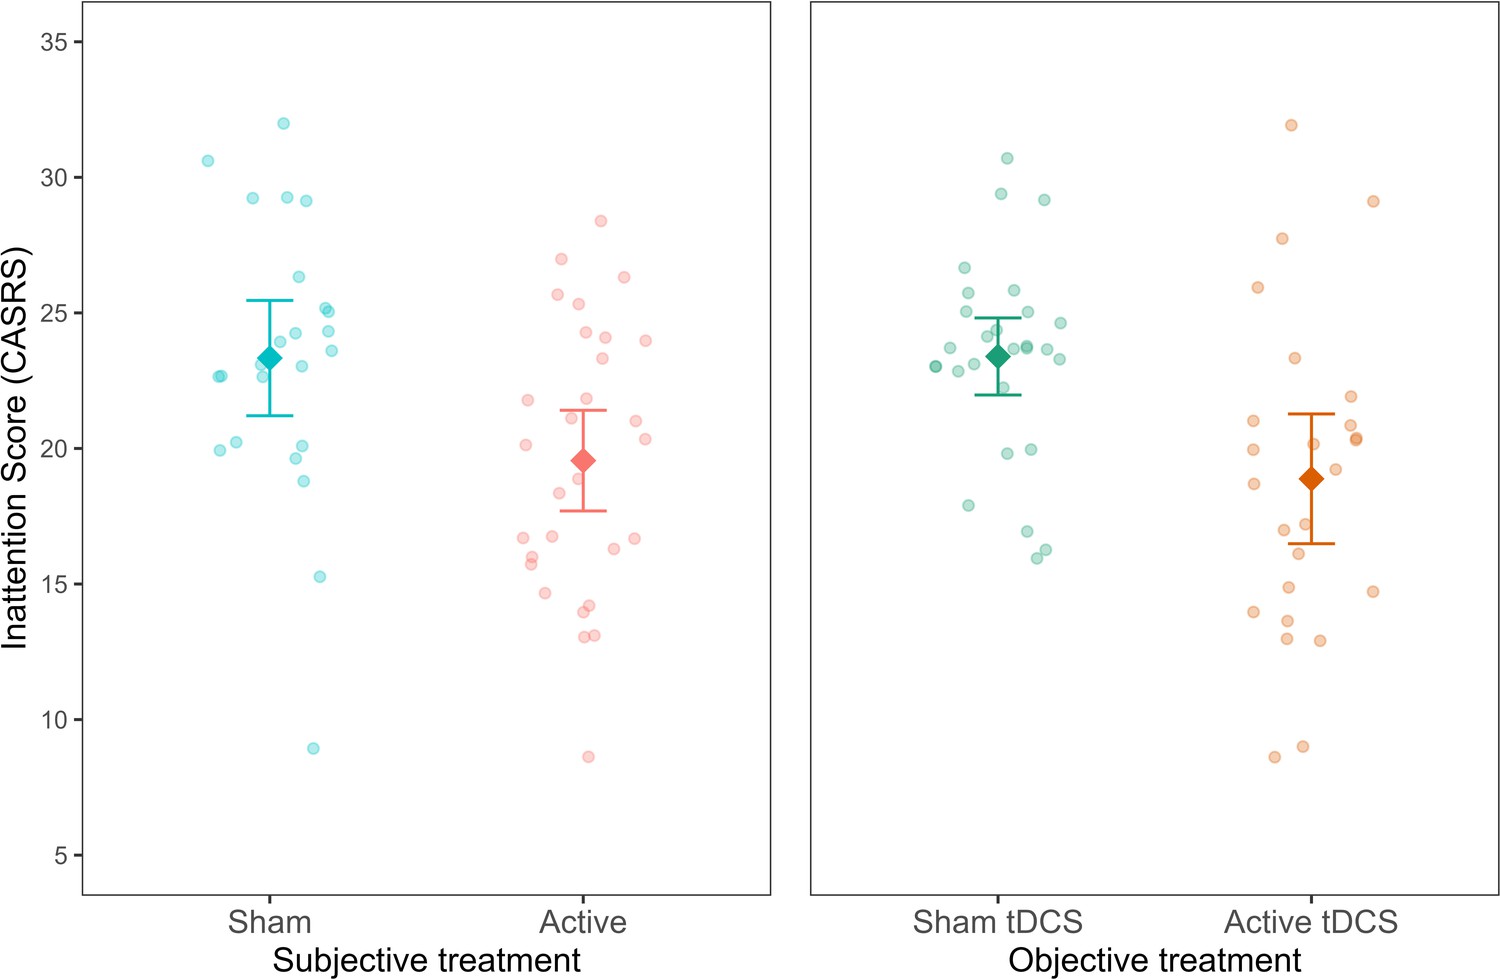
Inattention symptoms as a function of subjective and objective treatment.
The left plot shows the contribution of subjective treatment, and the right plot shows the contribution of objective treatment. Each dot represents an individual patient. Error bars represent ±1 standard error of the mean.
-
Figure 5—source data 1
Table with sample size (n) for objective and subjective treatment.
- https://cdn.elifesciences.org/articles/88889/elife-88889-fig5-data1-v1.xlsx
-
Figure 5—source data 2
Table with summary statistics for the model comparison with CASRSinattention symptoms as outcome.
The table reports the BIC and AIC for model comparison between the baseline (objective treatment), additive (objective treatment + subjective treatment), and interaction (objective treatment * subjective treatment) models. All models account for time.
- https://cdn.elifesciences.org/articles/88889/elife-88889-fig5-data2-v1.xlsx
-
Figure 5—source data 3
Table with summary statistics for the model comparison with CASRSinattention symptoms as outcome.
The table reports the BIC and AIC for model comparison between the baseline (subjective treatment), additive (subjective treatment + objective treatment), and interaction (subjective treatment * objective treatment) models. All models account for time.
- https://cdn.elifesciences.org/articles/88889/elife-88889-fig5-data3-v1.xlsx
Figure 6
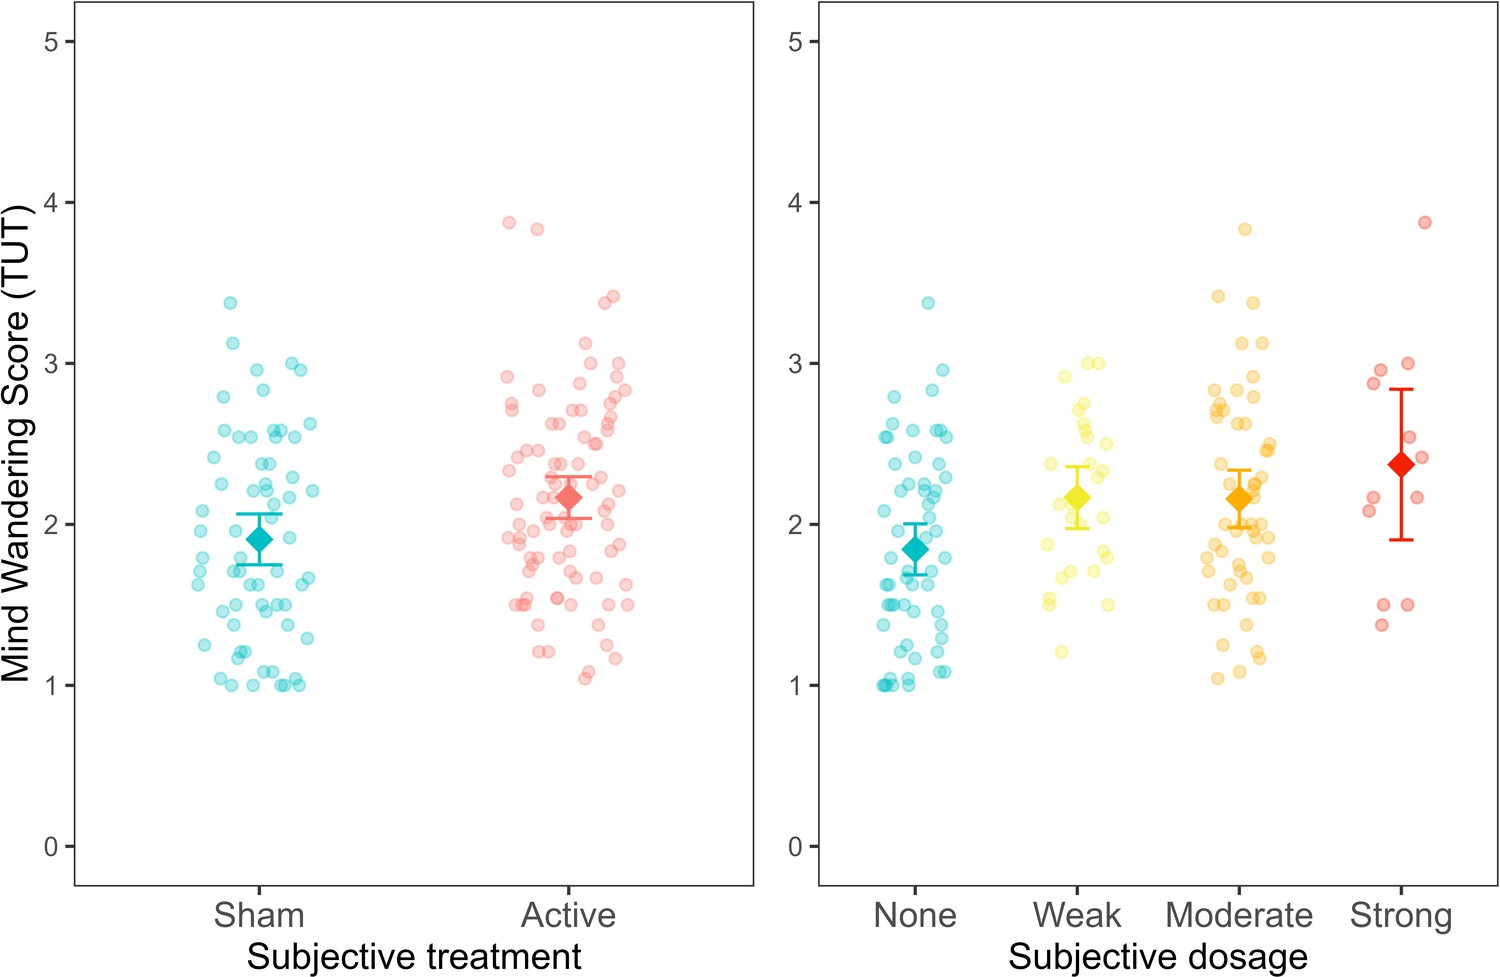
Mind wandering scores, based on the task-unrelated thought (TUT) average across experimental trials, as a function of subjective treatment and subjective dosage.
Each dot represents a participant. Error bars represent ±1 standard error of the mean.
-
Figure 6—source data 1
Table with sample size (n) for objective and subjective treatment.
- https://cdn.elifesciences.org/articles/88889/elife-88889-fig6-data1-v1.xlsx
-
Figure 6—source data 2
Table with summary statistics for the model comparison with mind wandering scores as outcome.
The table reports the model comparison between the baseline (objective treatment), additive (objective treatment + subjective treatment) and interaction (objective treatment * subjective treatment) models.
- https://cdn.elifesciences.org/articles/88889/elife-88889-fig6-data2-v1.xlsx
-
Figure 6—source data 3
Table with summary statistics for the model comparison with mind wandering scores as outcome.
The table reports the model comparison between the baseline (subjective treatment), additive (subjective treatment + objective treatment) and interaction (subjective treatment * objective treatment) models.
- https://cdn.elifesciences.org/articles/88889/elife-88889-fig6-data3-v1.xlsx
-
Figure 6—source data 4
Table with summary statistics for the model comparison with mind wandering scores as outcome.
The table reports the model comparison between the baseline (objective treatment), additive (objective treatment + subjective dosage) and interaction (objective treatment * subjective dosage) models.
- https://cdn.elifesciences.org/articles/88889/elife-88889-fig6-data4-v1.xlsx
-
Figure 6—source data 5
Table with summary statistics for the model comparison with mind wandering scores as outcome.
The table reports the model comparison between the baseline (subjective dosage), additive (subjective dosage + objective treatment) and interaction (subjective dosage * objective treatment) models.
- https://cdn.elifesciences.org/articles/88889/elife-88889-fig6-data5-v1.xlsx
Additional files
Download links
A two-part list of links to download the article, or parts of the article, in various formats.
Downloads (link to download the article as PDF)
Open citations (links to open the citations from this article in various online reference manager services)
Cite this article (links to download the citations from this article in formats compatible with various reference manager tools)
The importance of individual beliefs in assessing treatment efficacy
eLife 12:RP88889.
https://doi.org/10.7554/eLife.88889.3


