Molecular tuning of sea anemone stinging
- Department of Molecular and Cellular Biology, Harvard University, United States
- Machine Learning Center Genoa (MalGa), Department of Civil, Chemical and Environmental Engineering (DICCA), University of Genoa, Italy
- Department of Organismic and Evolutionary Biology and Museum of Comparative Zoology, Harvard University, United States
Figures
Figure 1
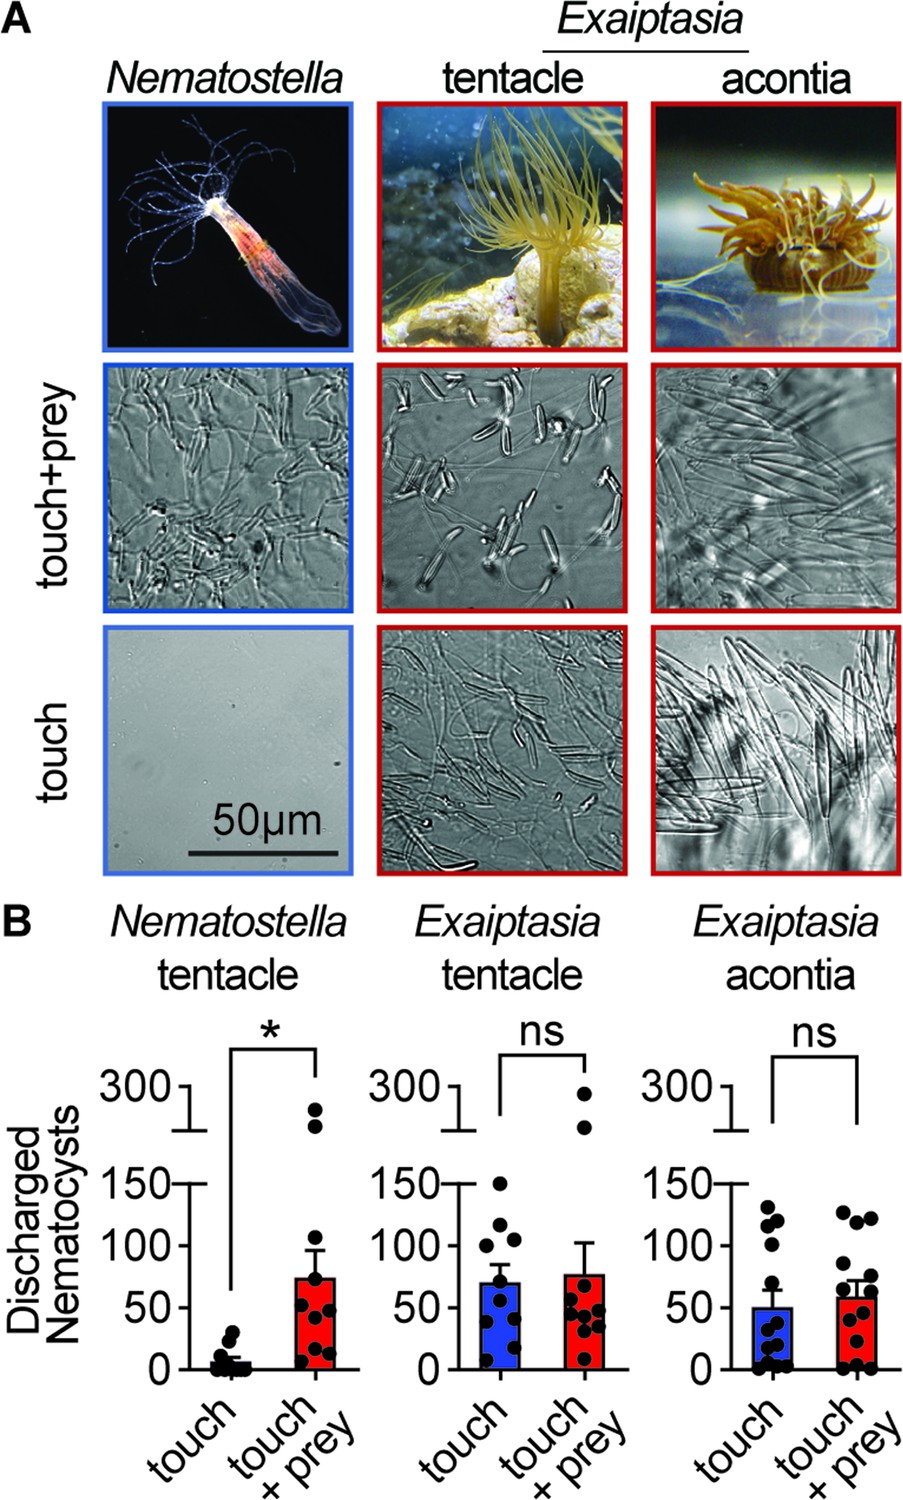
Comparative sea anemone stinging behavior.
(A) Nematostella vectensis stings with tentacles while Exaiptasia diaphana also stings with acontia filaments that are ejected from its body for defense. Left: Nematostella nematocyte discharge was only observed in response to simultaneous prey chemicals and touch stimuli. Middle, Right: Exaiptasia nematocyte discharge from tentacles and acontia occurred irrespective of prey cues (touch alone). Scale bar = 50 μm. (B) Nematostella nematocyte discharge was elicited by simultaneous touch and prey chemical stimuli (n=10 trials). Exaiptasia tentacle (n=10) and acontia (n=13) nematocytes discharged only to touch, with or without prey chemicals. p<0.05 for Nematostella, paired two-tailed student’s t-test. Data represented as mean ± sem.
Figure 2 with 5 supplements
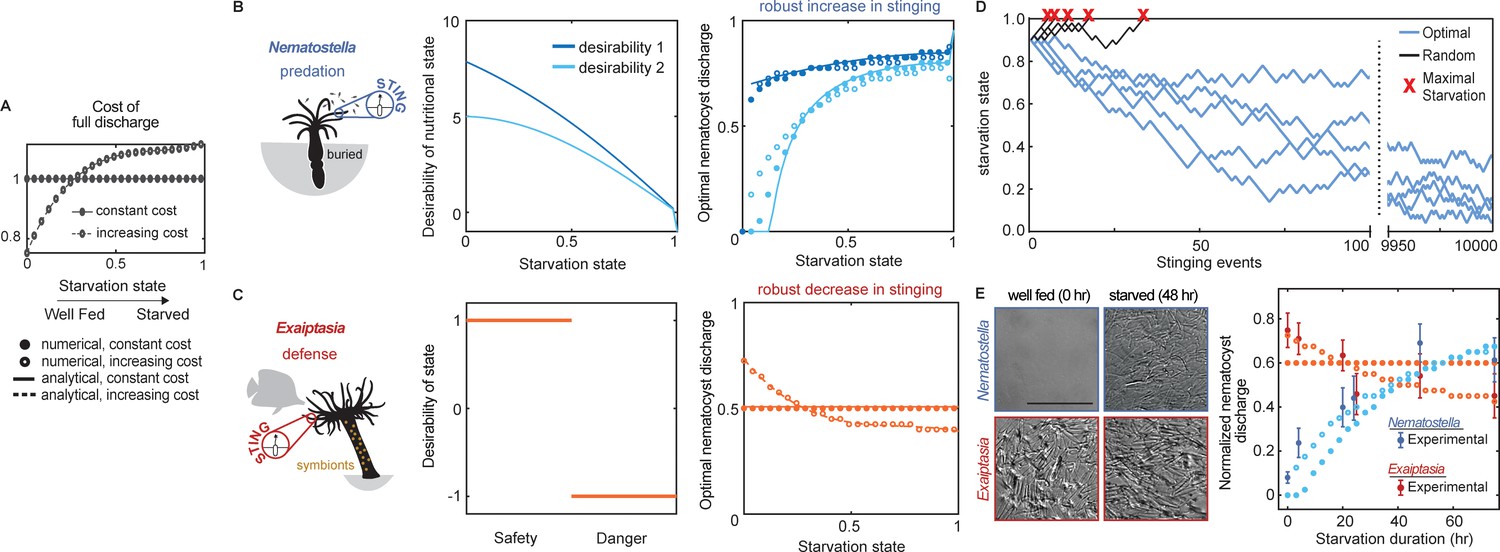
Nematostella stinging is regulated by predation while Exaiptasia stings for defense.
(A) The cost of stinging is , where is the cost for full nematocyte discharge and it either does not change (solid lines filled circles) or increases slightly (dashed lines empty circles) with starvation state. These symbols are used throughout the figure to represent each cost function. The increasing cost is obtained by fitting the Exaiptasia behavior (see fitting procedure in Materials and methods). (B) Left: Nematostella burrows in the substrate and stings for predation. Center: Desirability of nutritional state, or reward, decreases with starvation. Two examples are shown: example 1, ; example 2, . Right: Predicted optimal stinging obtained by solving equation (1) with numerical simulations (circles) and approximate analytical solutions (lines) assuming: and ; with cost for full discharge matching panel A (full circles and solid lines for constant cost; empty circles for increasing cost); reward in Left panels (colors match). For all reward and cost functions, optimal predatory stinging increases with starvation under broad assumptions (see Materials and methods). (C) Left: Exaiptasia diaphana relies heavily on endosymbiotic algae for nutrients and stings primarily for defense. Center: We assumed there are two states, safety (L), and danger (D). The state of safety can transition to danger, but not the other way around. We assumed the agent obtains reward 1 in state L and penalty –1 in state D. Right: Predicted optimal stinging obtained by solving equation (2) with numerical simulations (circles) and analytical solutions (lines). Styles match the costs in panel A; we assume and as before. Optimal defensive stinging is constant or decreases with starvation under broad assumptions (see Materials and methods). (D) Examples of optimal (blue) versus random (black) predatory stinging. Each agent (anemone) starts with , and stings sequentially for many events (represented on the x axis). The random agent almost always reaches maximal starvation before 50 events (grey lines, five examples shown). In comparison, the optimal agent effectively never starves due to a successful stinging strategy optimized for predation (blue lines, five examples shown, parameters as in panel B, curve with matching color). (E) Left: Nematostella nematocyte discharge was affected by prey availability while Exaiptasia stung at a similar rate regardless of feeding. p<0.0001 for Nematostella, two-way ANOVA with post hoc Bonferroni test (n=10 animals, data represented as mean ± sem). Right: Experimental data (circles with error bars representing standard deviation) are well fit by normalized optimal nematocyst discharge predicted from MDP models for both Exaiptasia (orange full and empty circles for constant and increasing cost, panel A) and Nematostella (light blue full and empty circles for constant and increasing cost, panel A and desirability 2 in panel B). We match the last experimental data point to , the precise value of this parameter is irrelevant as long as it is smaller than 1, representing that animals are not severely starved during the experiment.
Figure 2—figure supplement 1
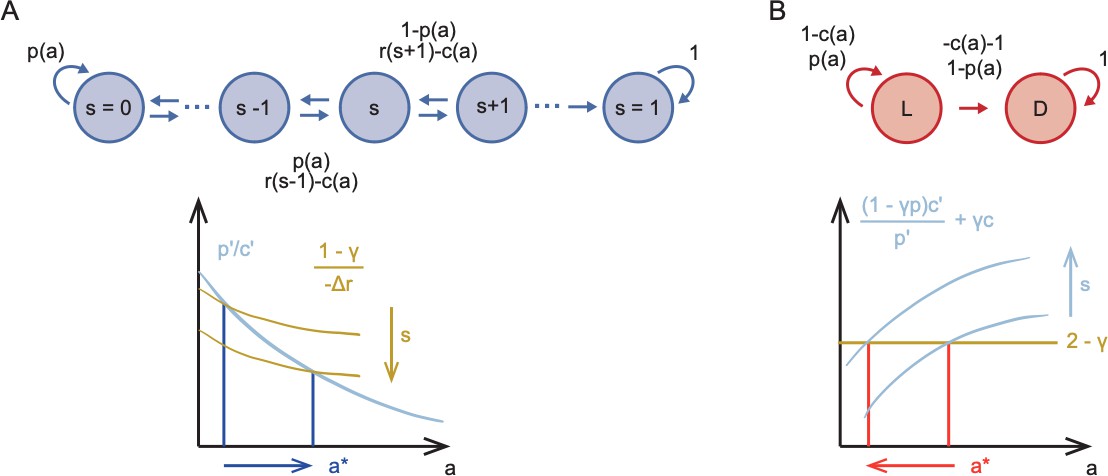
Sketch of Markov Decision Processes model and predictions for stinging.
(A) Directed graph representing the Markov Decision Process for predatory stinging (top) including states of starvation , actions , and transitions to adjacent states depending on the probability to catch prey . Graphical representation of the result that optimal predatory stinging increases with starvation (bottom). (B) Directed graph representing the Markov Decision Process for defensive stinging (top) including states of safety and danger and , actions , and transitions between and depending on the probability to successfully stinging the predator . Graphical representation of the result that the optimal defensive stinging decreases with starvation (bottom).
Figure 2—figure supplement 2

Optimal policy predicted by Bellman’s theory for the MDP sketched in Figure 2—figure supplement 1A.
Left: three choices of concave reward functions : , upper left; , middle left; , lower left. Solid and dashed lines correspond to two choices of the parameter for each reward as in the legend. The cost of full dischare is constant and the likelihood of successful discharge is with . Right: the asymptotic solution for the optimal policy (solid and dashed lines matching the corresponding reward on the left) reproduces well the numerical solution obtained from solving Bellman’s Equation (1) with the value iteration algorithm (crosses and circles correspond to the solid and dashed rewards on the left). Optimal nematocyst discharge increases with the starvation state, independently on the shape of the reward function.
Figure 2—figure supplement 3

Sketch of theoretical prediction for predatory stinging with increasing cost.
Similar to Figure 2—figure supplement 1A bottom, for the case where the cost per nematocyte varies with starvation . Moderate increase in the cost per starvation (dashed light-blue line) do not affect the qualitative results as the green curve still intersects the light-blue curve for increasing values of (marked by dashed dark-blue line). More dramatic increases of cost with starvation (light-blue dotted line) do lead to a decrease in predatory stinging with starvation as the intercept now moves backward with increasing (marked by dark-blue dotted line).
Figure 2—figure supplement 4

Effects of a moderately vs dramatically increasing cost with starvation.
For a constant cost of full discharge or moderately increasing cost with starvation, predatory stinging always increases, whereas defensive stinging decreases or stays constant (results discussed in main text, Figure 2, and reproduced here for comparison, red and blue curves in Panels A-C. For predation, we use desirability 2 from Figure 2B). When the cost function increases dramatically with starvation (panel A, yellow and green lines), defensive stinging keeps decreasing with starvation (panel C, right), but now also predatory stinging decreases with starvation (panel B, right, yellow and green lines). Results are obtained with numerical simulations.
Figure 2—figure supplement 5

Modulation of Nematostella and Exaiptasia stinging is not due to changes in the abundance of nematocytes.
Nematocytes were highly abundant in tentacles from Nematostella (top) and Exaiptasia (bottom) before and after starvation. Representative of n=3 animals. Scale bar = 50 μm.
Figure 3
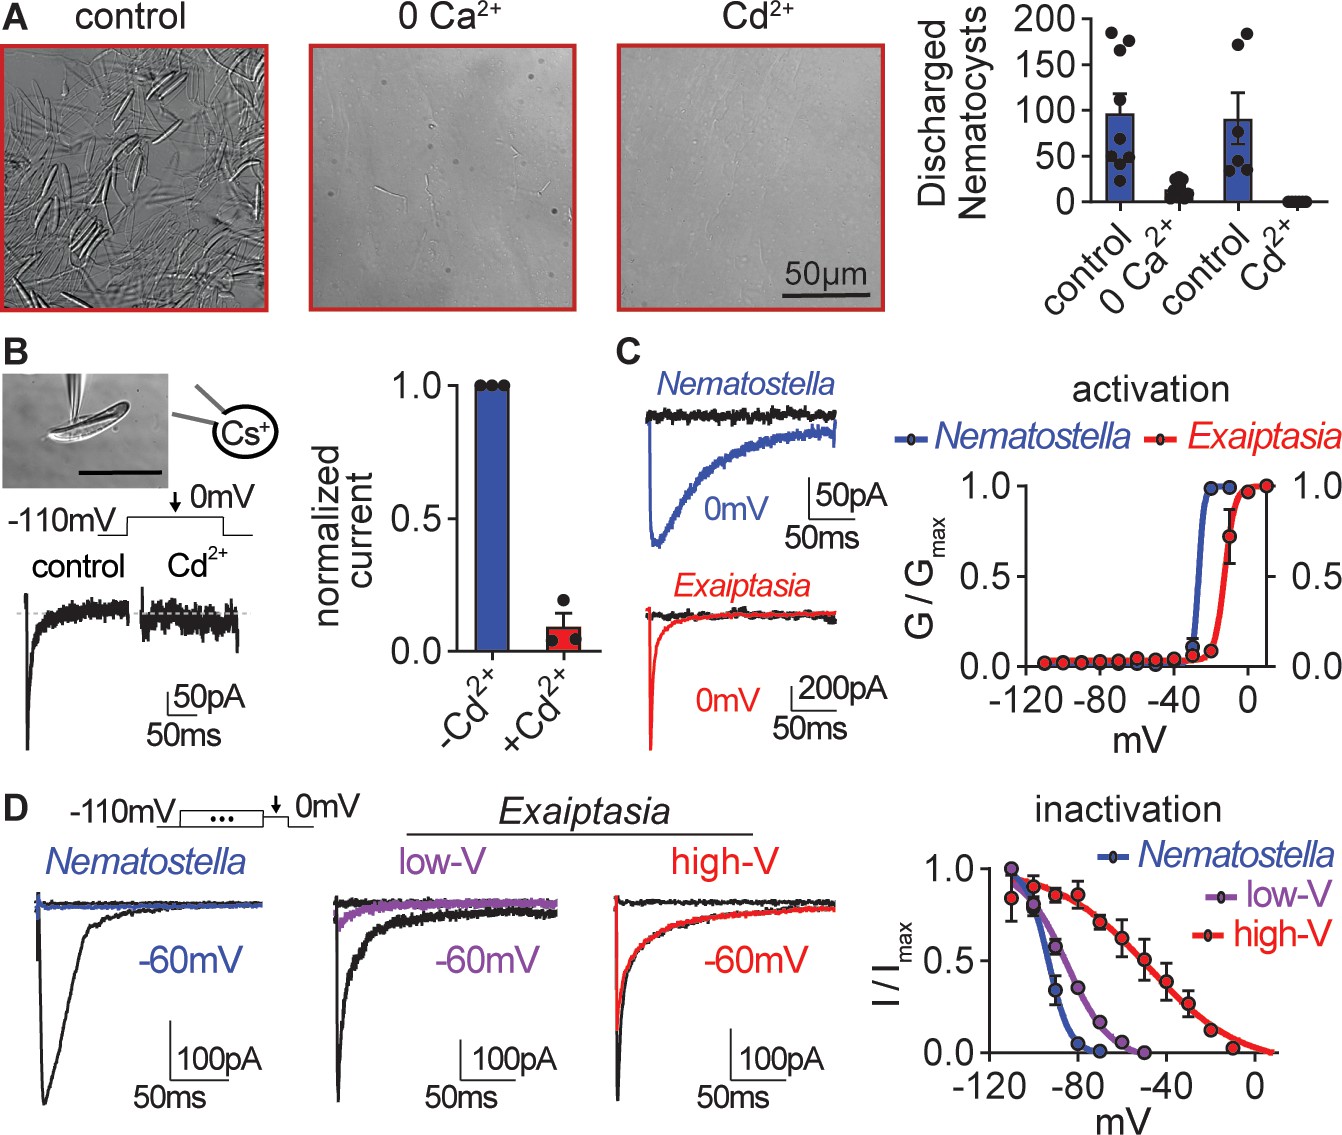
Exaiptasia nematocyte voltage-gated Ca2+ currents exhibit minimal steady-state inactivation compared with Nematostella.
(A) Touch-elicited Exaiptasia tentacle nematocyte discharge was blocked in the absence of Ca2+ (p<0.01, paired two-tailed student’s t-test, n=9 animals) or by addition of the CaV channel blocker Cd2+ (500 μM, p<0.05, paired two-tailed student’s t-test, n=6 animals). Scale bar = 50 μm. (B) Top: Representative patch clamp experiment from an Exaiptasia nematocyte. Scale bar = 20 μm. Bottom: Nematocyte voltage-gated currents elicited by a maximally activating 0 mV pulse were blocked by Cd2+ (n=3 cells, p<0.01, paired two-tailed student’s t-test). (C) Nematocyte voltage-gated currents elicited by –120 mV (black) or 0 mV pulses (colored). Conductance-voltage curves for Nematostella nematocyte (Va1/2 = -26.54 ± 0.78mV, n=3) and Exaiptasia nematocyte (Va1/2 = -12.47 ± 0.70mV, n=3). (D) Nematocyte voltage-gated currents elicited by a maximally activating voltage pulse following 1 s pre-pulses to −110 mV (max current, black), −50 mV (colored), or 20 mV (inactivated, no current). Nematostella nematocytes inactivated at very negative voltages (Vi1/2 = -93.22 ± 0.42mV, n=7) while Exaiptasia contained two populations of nematocytes: low-voltage threshold (Vi1/2 = -84.94 ± 0.70mV, n=4), and high-voltage threshold (Vi1/2 = -48.17 ± 3.32mV, n=3). Data represented as mean ± sem.
Figure 4 with 1 supplement
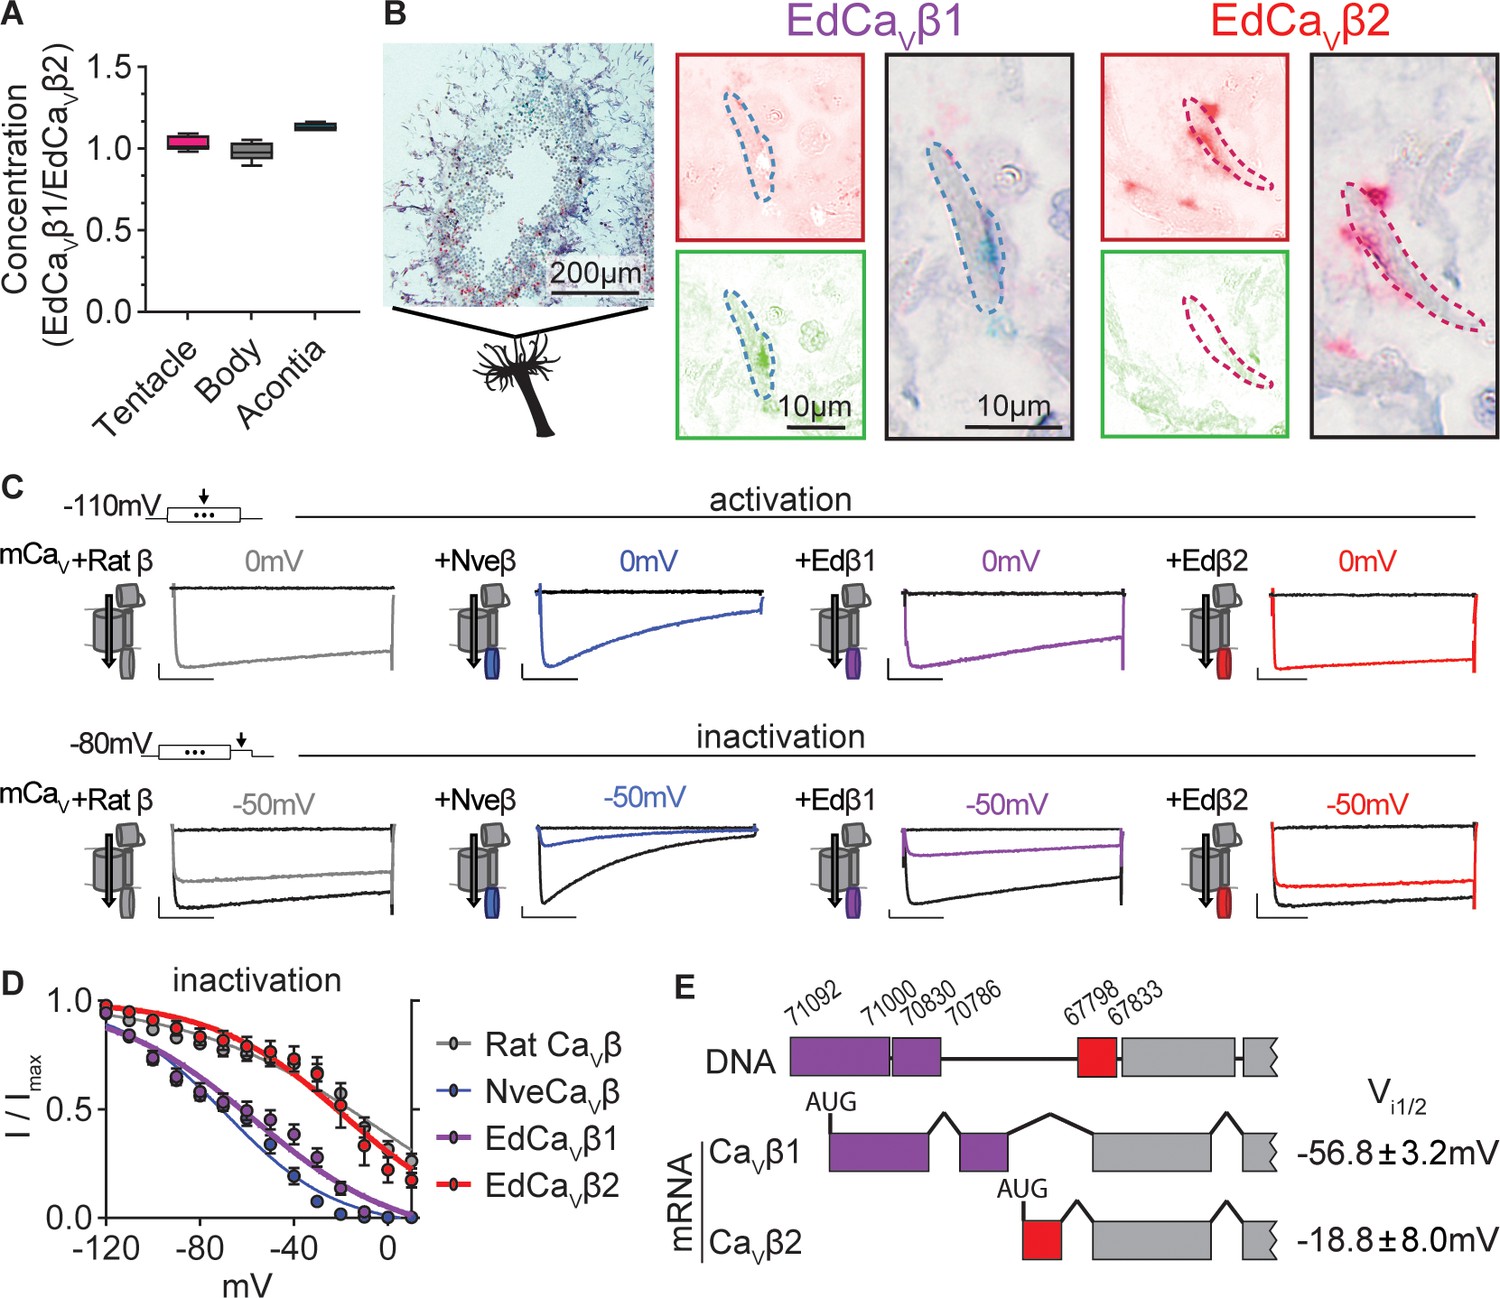
Exaiptasia expresses a CaV β subunit splice isoform that confers weak voltage-dependent inactivation.
(A) ddPCR ratio of concentrations of CaV β subunit 1 and 2 mRNAs was similar in tentacle (n=5), body (n=5), and acontia (n=4 animals) tissue samples. (B) EdCaVβ1 and EdCaVβ2 localized to distinct nematocytes in Exaiptasia tentacle cross section, as visualized by BaseScope in situ hybridization. Representative nematocyte expressing EdCaVβ1 (green) or EdCaVβ2 (red). Representative of three animals. (C) Voltage-gated currents from heterologously-expressed chimeric mammalian CaV (mCaV) with different β subunits: rat (Rattus norvegicus), Nematostella (Nve), Exaiptasia EdCaVβ1 or EdCaVβ2. Top: Currents elicited by voltage pulses to –120 mV (no current, black) and maximally activating 0 mV (colored). Bottom: Voltage-gated currents elicited by a maximally activating voltage pulse following 1 s pre-pulses to −110 mV (max current, black), −50 mV (colored), or 20 mV (inactivated, no current, black). Scale bars = 100 pA, 50ms. (D) Exaiptasia CaV β subunit splice isoforms confer distinct inactivation: Nematostella β subunit (Vi1/2 = -68.93 ± 1.53mV, n=5) and Rat β2a subunit (Vi1/2 = -2.98 ± 13.51mV, n=12) and EdCaVβ1 (Vi1/2 = -56.76 ± 3.18mV, n=8), and EdCaVβ2 (Vi1/2 = -18.84 ± 8.00mV, n=5 cells). Data represented as mean ± sem. (E) Genomic alignment of Exaiptasia β subunit isoforms showed that alternative splicing of the N-terminus region was associated with distinct inactivation: CaVβ1 (long N-term) had low-voltage steady-state inactivation similar to Nematostella, while CaVβ2 (short N-term) exhibited more depolarized steady-state inactivation, matching its mammalian orthologue. Genomic loci listed above sequence.
Figure 4—figure supplement 1
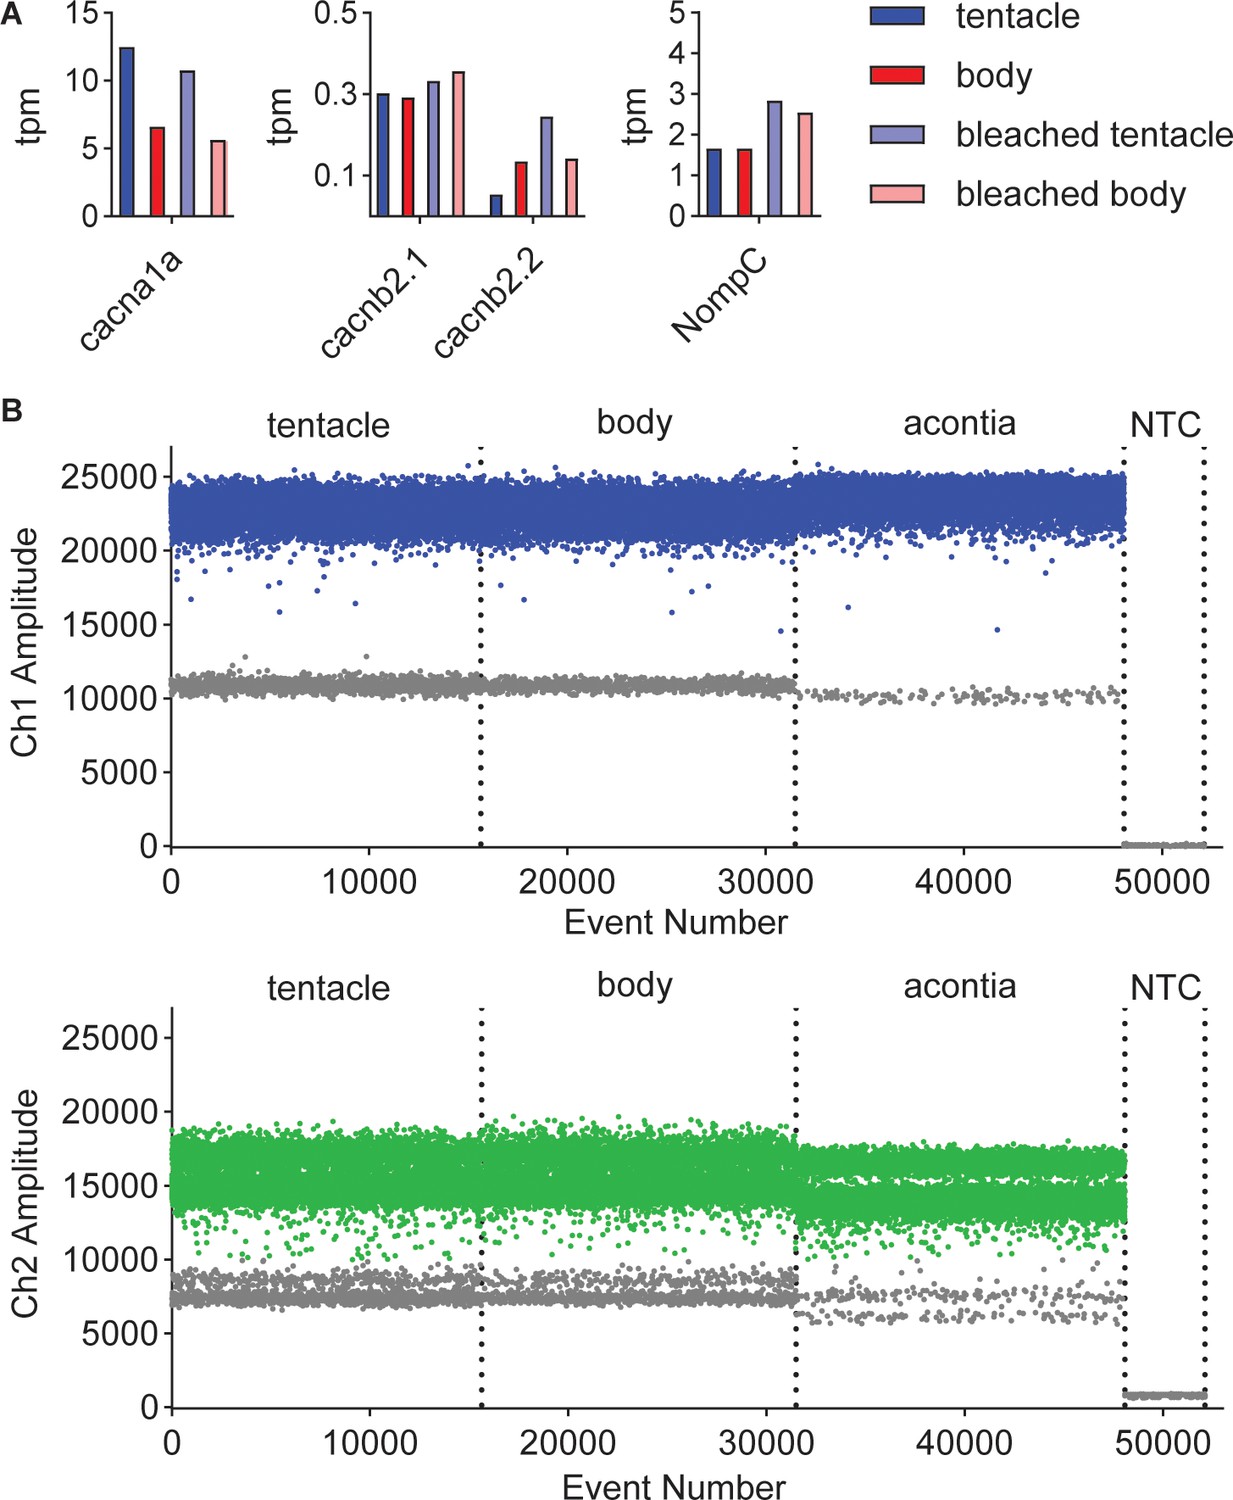
Transcriptomic and molecular analyses of Exaiptasia β subunit isoforms.
(A) mRNA expression (transcripts per million, TPM) of voltage-gated calcium (CaV) channel α and β subunits in Exaiptasia tentacle (nematocyte abundant, blue), body (nematocyte non-abundant, red), bleached (minimal symbionts) tentacle (light blue), bleached body (light red) tissues. The CaV α subunit was identified by homology to the sequence of the cnidarian CaV2.1 homolog found enriched in Nematostella nematocyte-rich tissues (Weir et al., 2020). NompC, the putative mechanoreceptor in Nematostella nematocytes (Schüler et al., 2015; Weir et al., 2020), was also detected in Exaiptasia tentacles. (B) Representative plots of fluorescent amplitude across event number (droplet events) from amplification of unique regions of EdCaVβ1 (Ch1, Top) and EdCaVβ2 (Ch2, Bottom) sequences using droplet digital PCR (ddPCR, Bio-Rad Laboratories). Individual lanes correspond to tentacle RNA, body RNA, acontia RNA, and no template control (NTC). Blue and green points indicate positive PCR droplets after thresholding and gray points indicate negative droplets.
Figure 5 with 1 supplement
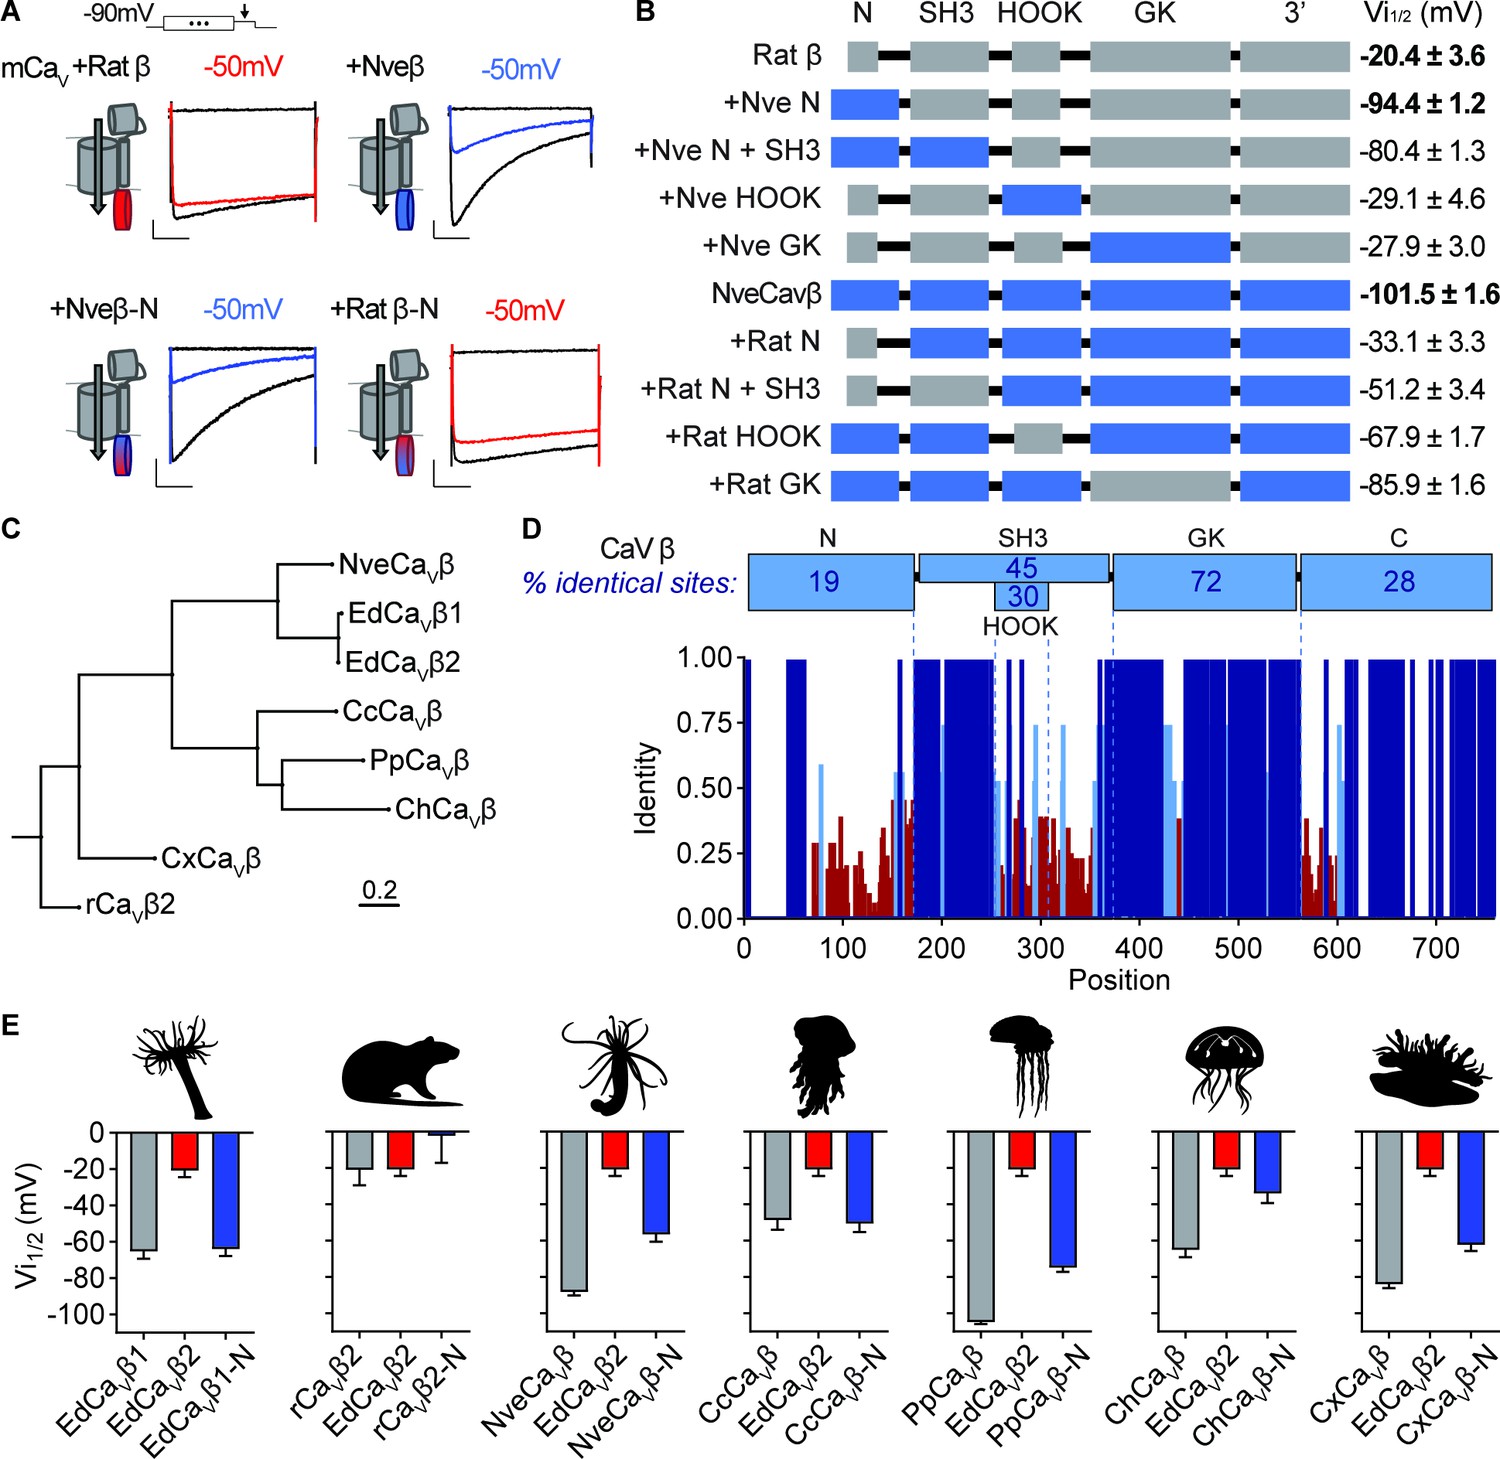
Cnidarian CaV β subunit N-termini confer unique inactivation properties.
(A) Voltage-gated currents from heterologously expressed CaV channels with Nematostella-rat chimeric β subunits demonstrate that the Nematostella N-terminus is sufficient to drive inactivation at negative voltages. Currents shown in response to 10 mV voltage pulses following 1 s pre-pulses to −130 mV (max current, black), −50 mV (colored), or 0 mV (inactivated, no current, black). Scale bars = 100 pA, 50ms. (B) Diagram of CaV Nematostella-rat β subunit domain swaps and resulting Vi1/2 values. The Nematostella β subunit N-terminus is required and sufficient for uniquely hyperpolarized CaV inactivation properties (p<0.001 for average Vi1/2 values across mutant beta subunits, one-way ANOVA with post-hoc Tukey test, n=2–8 cells). (C) Phylogenetic tree of β subunit sequences obtained from several species of cnidarians. Abbreviations of species: Nve, Nematostella vectensis; Ed, Exaiptasia diaphana; Cc, Cyanea capillata (jellyfish); Pp, Physalia physalis (siphonophore); Ch, Clytia hemisphaerica (jellyfish); Cx, Cassiopea xamachana (jellyfish); r, Rattus norvegicus. (D) Top: Percentage of identity between amino acid sequences across β subunit protein domains for NveCaVβ, EdCaVβ1, EdCaVβ2, CcCaVβ, PpCaVβ, ChCaVβ, CxCaVβ2, rCaVβ2. Bottom: Fraction of identity of amino acids across sites of the β subunit protein. (E) Cnidarian CaV β N-termini shift depolarized, weak voltage-dependent inactivation of CaV channels containing EdCaVβ2 to more negative voltages. Voltage-dependent inactivation (Vi1/2) of heterologously-expressed CaVs with WT EdCaVβ2, β subunits from the indicated cnidarians, and chimeras with their N-termini on EdCaVβ2 (p<0.0001 for average Vi1/2 values with multiple comparisons against WT EdCaVβ2 mean, one-way ANOVA with Bartlett’s test and post-hoc Tukey test, n=4–9 cells). Data represented as mean ± sem.
-
Figure 5—source data 1
Amino acid sequences of beta subunits.
- https://cdn.elifesciences.org/articles/88900/elife-88900-fig5-data1-v1.docx
Figure 5—figure supplement 1
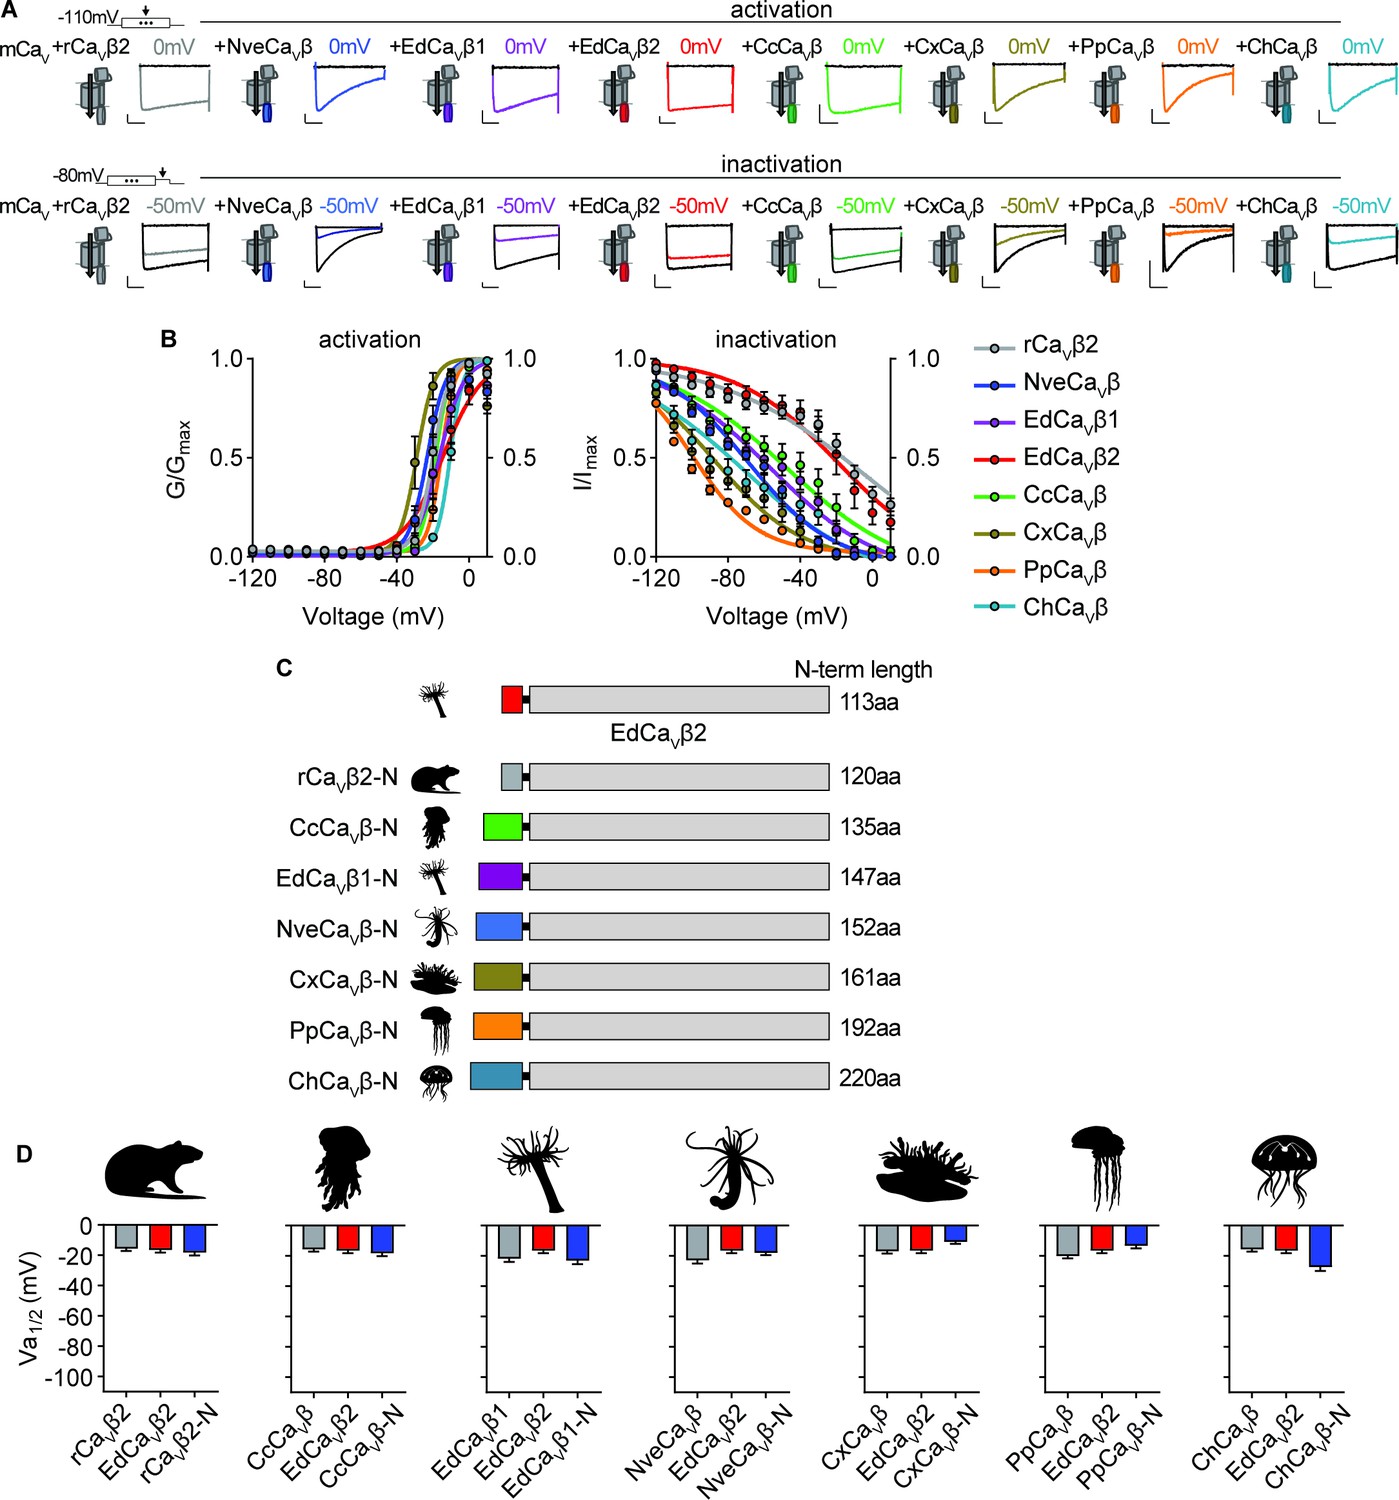
Voltage-dependent activation of CaV channels is conserved across cnidarian β subunits.
(A) Top: Voltage-gated currents from heterologously-expressed chimeric CaVs with the indicated β subunits elicited by voltage pulses to –120 mV (no current, black) and 0 mV (colored). Abbreviations of species: Nve, Nematostella vectensis; Ed, Exaiptasia diaphana; Cc, Cyanea capillata (jellyfish); Pp, Physalia physalis (siphonophore); Ch, Clytia hemisphaerica (jellyfish); Cx, Cassiopea xamachana (jellyfish); r, Rattus norvegicus. Bottom: Voltage-gated currents elicited by a maximally activating voltage pulse following 1 s pre-pulses to −110 mV (max current, black), −50 mV (colored), or 20 mV (inactivated, no current, black). Scalebars = 100 pA, 50ms. (B) Activation and inactivation curves for heterologously-expressed chimeric CaVs with different β subunits. Activation: rCaVβ2 Va1/2 = -19.76 ± 1.16mV, n=12; NveCaVβ Va1/2 = -23.07 ± 1.16mV, n=5; EdCaVβ1 Va1/2 = -18.27 ± 1.08mV, n=8; EdCaVβ2 Va1/2 = -14.22 ± 1.46mV, n=5; CcCaVβ Va1/2 = -18.47 ± 1.59mV, n=6; CxCaVβ Va1/2 = -28.89 ± 1.54mV, n=15; PpCaVβ Va1/2 = -15.29 ± 1.23mV, n=10; ChCaVβ Va1/2 = -10.30 ± 1.04mV, n=12. rCaVβ2 Vi1/2 = -2.98 ± 13.51mV, n=12; NveCaVβ Vi1/2 = -68.93 ± 1.53mV, n=5; EdCaVβ1 Vi1/2 = -56.76 ± 3.18mV, n=8; EdCaVβ2 Vi1/2 = -18.84 ± 8.00mV, n=5; CcCaVβ subunit Vi1/2 = -47.81 ± 5.57mV, n=6; CxCaVβ Vi1/2 = -87.75 ± 1.72mV, n=15; PpCaVβ Vi1/2 = -99.80 ± 0.92mV, n=10; ChCaVβ Vi1/2 = -70.25 ± 4.67mV, n=12 cells. (C) Diagram of CaV β subunit domain swaps and the length of the N-terminus swapped in amino acids. (D) Cnidarian CaV β N-termini do not greatly affect voltage-dependent activation of CaV channels containing EdCaVβ2. Voltage-dependent activation (Va1/2) of heterologously-expressed CaVs with WT EdCaVβ2, β subunits from the indicated cnidarians, and chimeras with their N-termini on EdCaVβ2, p=0.5830 for average Vi1/2 values across mutant beta subunits, one-way ANOVA with Bartlett’s test and post-hoc Tukey test, n=4–7 cells. Data represented as mean ± sem.
Tables
Key resources table
| Reagent type (species) or resource | Designation | Source or reference | Identifiers | Additional information |
|---|---|---|---|---|
| Strain, strain background (Nematostella vectensis, adult, male and female) | Nematostella | Woods Hole Marine Biological Laboratory | ||
| Strain, strain background (Exaiptasia diaphana, adult, male and female) | Exaiptasia | Carolina Biological Supply Company | Item #162865 | https://www.carolina.com/marine-and-saltwater-animals/sea-anemone-aiptasia-living/162865.pr |
| Strain, strain background (Cassiopea spp., adult, male and female) | Cassiopea xamachana | Carolina Biological Supply Company | Item #162936 | https://www.carolina.com/marine-and-saltwater-animals/mangrove-jellyfish-living-pack-of-5/162936.pr?question=mangrove |
| Cell line (Homo-sapiens) | HEK293T | ATCC | CRL-3216 | |
| Recombinant DNA reagent | nCaV: cacnb2 (plasmid) | Weir et al., 2020 | NveCaVβ | |
| Recombinant DNA reagent | Rat cacna2d1 | Lin et al., 2004 | Addgene Plasmid #26575 | rCaVα2δ |
| Recombinant DNA reagent | Mouse cacna1a | Richards et al., 2007 | Addgene Plasmid #26578 | mCaVα |
| Recombinant DNA reagent | Rat cacnb2a | Wyatt et al., 1998 | Addgene Plasmid #107424 | rCaVβ |
| Recombinant DNA reagent | Exaiptasia diaphana cacnb1 (plasmid) | This paper | EdCaVβ1 | |
| Recombinant DNA reagent | Exaiptasia diaphana cacnb2 (plasmid) | This paper | EdCaVβ2 | |
| Recombinant DNA reagent | Physalia physalis cacnb (plasmid) | This paper | PpCaVβ | |
| Recombinant DNA reagent | Cyanea capillata cacnb (plasmid) | This paper | CcCaVβ | |
| Recombinant DNA reagent | Cassiopea xamachana cacnb (plasmid) | This paper | CxCaVβ | |
| Recombinant DNA reagent | Clytia hemisphaerica cacnb (plasmid) | This paper | ChCaVβ | |
| Recombinant DNA reagent | EdCaVβ2 with NveCaVβ NTerm (plasmid) | This paper | NveCaVβ-N | |
| Recombinant DNA reagent | EdCaVβ2 with rCaVβ NTerm (plasmid) | This paper | rCaVβ-N | |
| Recombinant DNA reagent | EdCaVβ2 with EdCaVβ1 NTerm (plasmid) | This paper | EdCaVβ1-N | |
| Recombinant DNA reagent | EdCaVβ2 with PpCaVβ NTerm (plasmid) | This paper | PpCaVβ-N | |
| Recombinant DNA reagent | EdCaVβ2 with CcCaVβ NTerm (plasmid) | This paper | CcCaVβ-N | |
| Recombinant DNA reagent | EdCaVβ2 with CxCaVβ NTerm (plasmid) | This paper | CxCaVβ-N | |
| Recombinant DNA reagent | EdCaVβ2 with ChCaVβ NTerm (plasmid) | This paper | ChCaVβ-N | |
| Recombinant DNA reagent | NveCaVβ with Mouse CaVβ HOOK domain (plasmid) | This paper | NVE_cacnb2_mus_hook | |
| Recombinant DNA reagent | Mouse CaVβ with NveCaVβ HOOK domain (plasmid) | This paper | Mus_cacnb2_NVE_hook | |
| Recombinant DNA reagent | NveCaVβ with Mouse CaVβ GK domain (plasmid) | This paper | NVE_cacnb2_mus_GK_domain | |
| Recombinant DNA reagent | Mouse CaVβ with NveCaVβ GK domain (plasmid) | This paper | Mus_cacnb2_NVE_GK_domain | |
| Recombinant DNA reagent | NveCaVβ with rCaVβ NTerm domain (plasmid) | This paper | Rat_Nterm_NVE_cacnb2a | |
| Recombinant DNA reagent | NveCaVβ with rCaVβ NTerm and SH3 domains (plasmid) | This paper | Rat_Nterm_SH3_NVE_cacnb2a | |
| Recombinant DNA reagent | rCaVβ with NveCaVβ NTerm and SH3 domains domain (plasmid) | This paper | NVE_Nterm_SH3_rat_cacnb2a | |
| Recombinant DNA reagent | rCaVβ with NveCaVβ NTerm domain (plasmid) | This paper | NVE_Nterm_rat_cacnb2a | |
| Sequence-based reagent | EdCaVβ1 primer F | This paper | Custom PCR primer | GGATTTCGCCCTGAGCAA |
| Sequence-based reagent | EdCaVβ1 primer R | This paper | Custom PCR primer | TGGATCTCCGAAGGAGTTGA |
| Sequence-based reagent | EdCaVβ1 probe | This paper | Custom probe | FAM-ACATAGAACTTGATAGTCTCGAGCACG-BHQ-1 |
| Sequence-based reagent | EdCaVβ2 primer F | This paper | Custom PCR primer | TGTCCAGAGCTTCACAAAGG |
| Sequence-based reagent | EdCaVβ2 primer R | This paper | Custom PCR primer | TCTTCGTCAACACTACTTGTATCA |
| Sequence-based reagent | EdCaVβ2 probe | This paper | Custom probe | HEX-ACTCAGAACCTGCTTACAGAGCCT-BHQ-1 |
| Commercial assay or kit | One-Step RT-ddPCR Advanced Kit for Probes | Bio-Rad Laboratories | Cat #1864021 | |
| Commercial assay or kit | Droplet Gen Oil for Probes | Bio-Rad Laboratories | Cat #1863005 | |
| Chemical compound, drug | CdCl2 | Sigma | Cat #202908 | |
| Software, algorithm | Rcorrector | Song and Florea, 2015 | https://github.com/mourisl/Rcorrector | |
| Software, algorithm | FilterUncorrectablePEfastq.py | Harvard Informatics | https://github.com/harvardinformatics/TranscriptomeAssemblyTools | |
| Software, algorithm | Trimgalore | The Babraham Institute Bioinformatics Group | https://github.com/FelixKrueger/TrimGalore | |
| Software, algorithm | Bowtie2 | Langmead and Salzberg, 2012 | https://bowtie-bio.sourceforge.net/bowtie2/index.shtml | |
| Software, algorithm | Fastqc | The Babraham Institute Bioinformatics Group | https://www.bioinformatics.babraham.ac.uk/projects/fastqc/ | |
| Software, algorithm | Trinity | Grabherr et al., 2011 | https://github.com/trinityrnaseq | |
| Software, algorithm | Transdecoder | Haas, BJ. https://github.com/TransDecoder/TransDecoder | https://github.com/TransDecoder/TransDecoder | |
| Software, algorithm | DIAMOND | Buchfink et al., 2015 | https://github.com/bbuchfink/diamond | |
| Software, algorithm | Kallisto | Bray et al., 2016 | https://github.com/pachterlab/kallisto | |
| Software, algorithm | Clustal Omega | Madeira et al., 2022 | https://www.ebi.ac.uk/Tools/msa/clustalo/ | |
| Software, algorithm | Geneious Prime | Geneious | RRID: SCR_010519 | https://www.geneious.com |
| Software, algorithm | MAFFT v.7 | Katoh and Standley, 2013 | https://mafft.cbrc.jp/alignment/server/ | |
| Software, algorithm | ModelFinder | Kalyaanamoorthy et al., 2017 | http://www.iqtree.org/ModelFinder/ | |
| Software, algorithm | IQ-TREE v2.0 | Minh et al., 2020 | http://www.iqtree.org/ | |
| Software, algorithm | UFBoot2 | Hoang et al., 2018 | https://bio.tools/ufboot2 | |
| Software, algorithm | QuantaSoft | Bio-Rad Laboratories | https://www.bio-rad.com/en-us/life-science/digital-pcr/qx200-droplet-digital-pcr-system/quantasoft-software-regulatory-edition | |
| Software, algorithm | pClamp 11 Software Suite | Molecular Devices | https://www.moleculardevices.com/products/axon-patch-clamp-system/acquisition-and-analysis-software/pclamp-software-suite | |
| Software, algorithm | MetaMorph Microscopy Automation and Image Analysis Software | Molecular Devices | https://www.moleculardevices.com/products/cellular-imaging-systems/acquisition-and-analysis-software/metamorph-microscopy | |
| Software, algorithm | Fiji (ImageJ) | Schindelin et al., 2012 | RRID: SCR_002285 | |
| Software, algorithm | GraphPad Prism | GraphPad Software | RRID: SCR_002798 | http://www.graphpad.com/ |
| Software, algorithm | Cell Sens | Olympus | https://www.olympus-lifescience.com/en/software/cellsens/ | |
| Commercial assay or kit | BaseScope Duplex Reagent Kit | Advanced Cell Diagnostics | Cat #323800 | |
| Sequence-based reagent | BaseScope Probe-BA-Epa- LOC110232233-tvX3- 1zz-st-C1 (EdCaVβ1) | Advanced Cell Diagnostics | Custom probe 1162801 C1 | |
| Sequence-based reagent | BaseScope Probe-BA-Epa- LOC110232233-tvX6- 1zz-st-C2 (EdCaVβ2) | Advanced Cell Diagnostics | Custom probe 1162811 C2 | |
| Sequence-based reagent | BaseScope Duplex Positive Control Probe-Human [Hs]-C1- Hs-PPIB-1zz/C2-POLR2A-1zz | Advanced Cell Diagnostics | Cat #700101 | |
| Sequence-based reagent | BaseScope Duplex Negative Control Probe-C1-DapB-1zz/C2- DapB-1zz | Advanced Cell Diagnostics | Cat #700141 |
Additional files
Download links
A two-part list of links to download the article, or parts of the article, in various formats.
Downloads (link to download the article as PDF)
Open citations (links to open the citations from this article in various online reference manager services)
Cite this article (links to download the citations from this article in formats compatible with various reference manager tools)
Molecular tuning of sea anemone stinging
eLife 12:RP88900.
https://doi.org/10.7554/eLife.88900.3


