Complex aneuploidy triggers autophagy and p53-mediated apoptosis and impairs the second lineage segregation in human preimplantation embryos
- Brussels Health Campus/Faculty of Medicine and Pharmacy, Research Group Genetics Reproduction and Development, Vrije Universiteit Brussel, Belgium
- Brussels Health Campus, Brussels IVF, Universitair Ziekenhuis Brussel (UZ Brussel), Belgium
- Brussels Health Campus, Medical Genetics, Universitair Ziekenhuis Brussel (UZ Brussel), Belgium
Figures
Figure 1 with 1 supplement
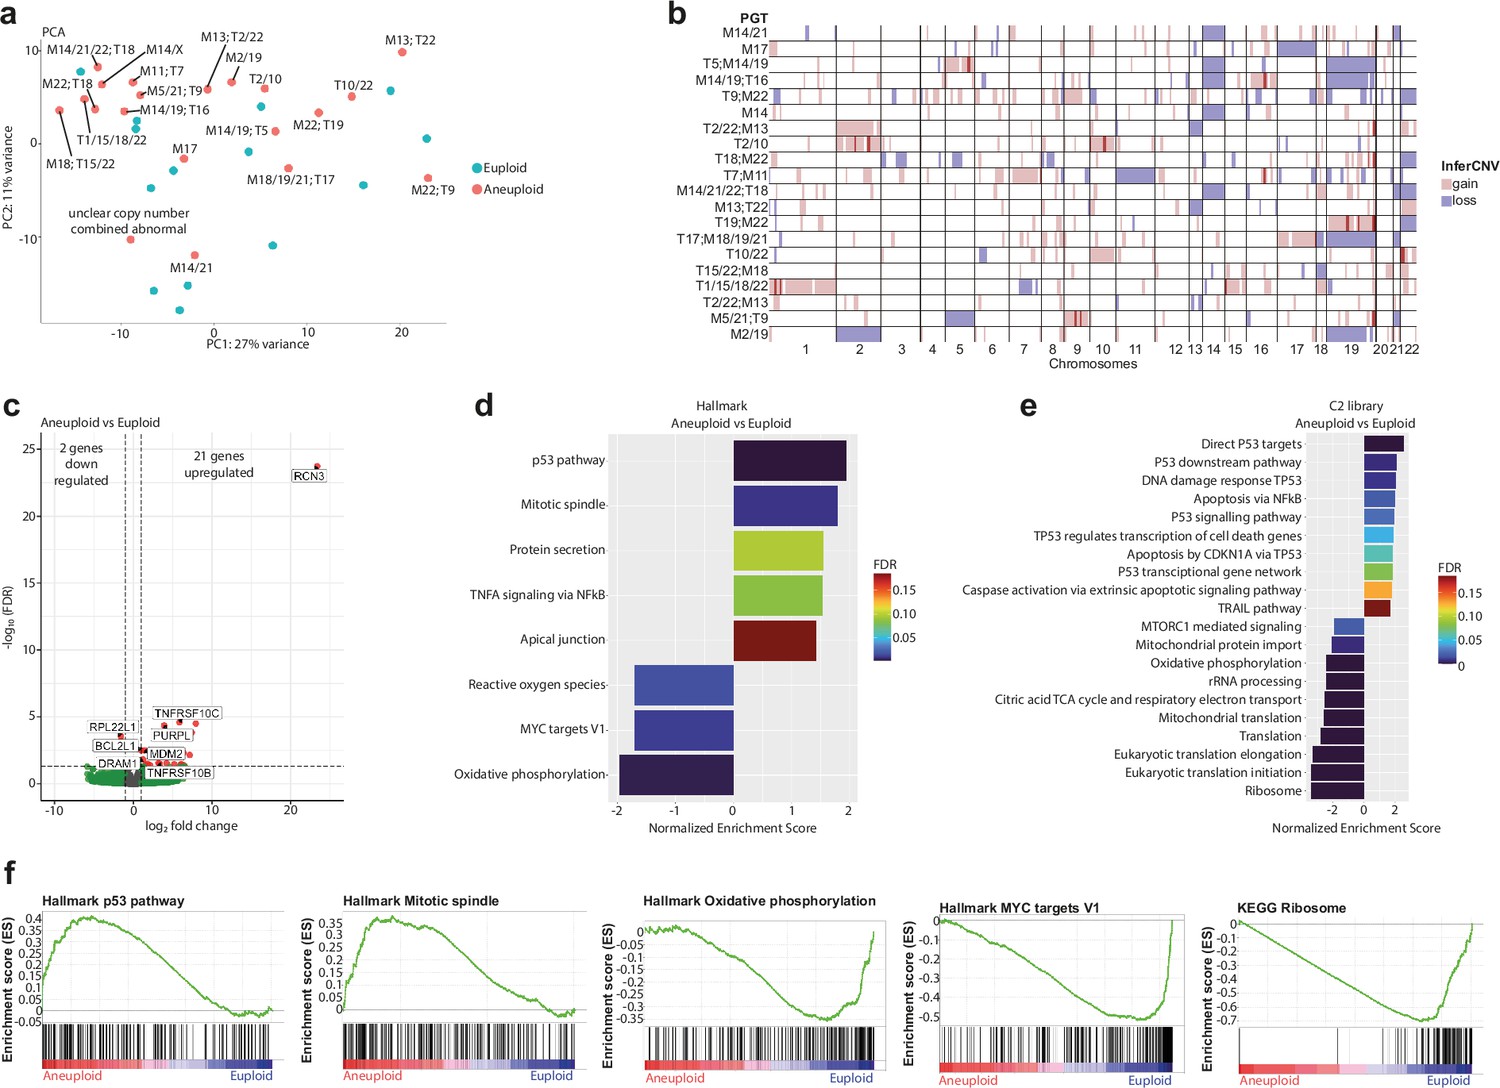
RNA-sequencing of trophectoderm cells reveals gene dosage defects and transcriptomic signatures of p53 activation and apoptosis.
(a) Principal component analysis after transcriptome analysis of aneuploid versus euploid embryos. T=Trisomy, M=Monosomy. (b) Comparison between the diagnosis of aneuploid embryos obtained after Preimplantation Genetic Testing (PGT) (list on the left) and the results obtained after using InferCNV after RNA-sequencing (plot on the right). Red and blue indicate gain or loss of the chromosome, respectively. (c) Volcano plot after differential gene expression analysis with a cutoff value of |log2 fold change|>1 and -log10(FDR)<0.05 for aneuploid versus euploid embryos showing 21 upregulated and two downregulated genes. (d) Barplot of enriched Hallmark pathways after gene set enrichment analysis of aneuploid versus euploid embryos using a cut-off value of 25% FDR. (e) Barplot of TOP20 enriched C2 library pathways after gene set enrichment analysis of aneuploid versus euploid embryos using a cut-off value of 25% FDR. (f) Enrichment plots of p53-pathway, mitotic spindle, oxidative phosphorylation, MYC targets V1 and ribosome, showing up- or downregulation of genes that are part of the corresponding pathway. Source of all embryos: Experiment 1.
-
Figure 1—source data 1
Count table of RNA-sequencing data.
- https://cdn.elifesciences.org/articles/88916/elife-88916-fig1-data1-v1.zip
Figure 1—figure supplement 1
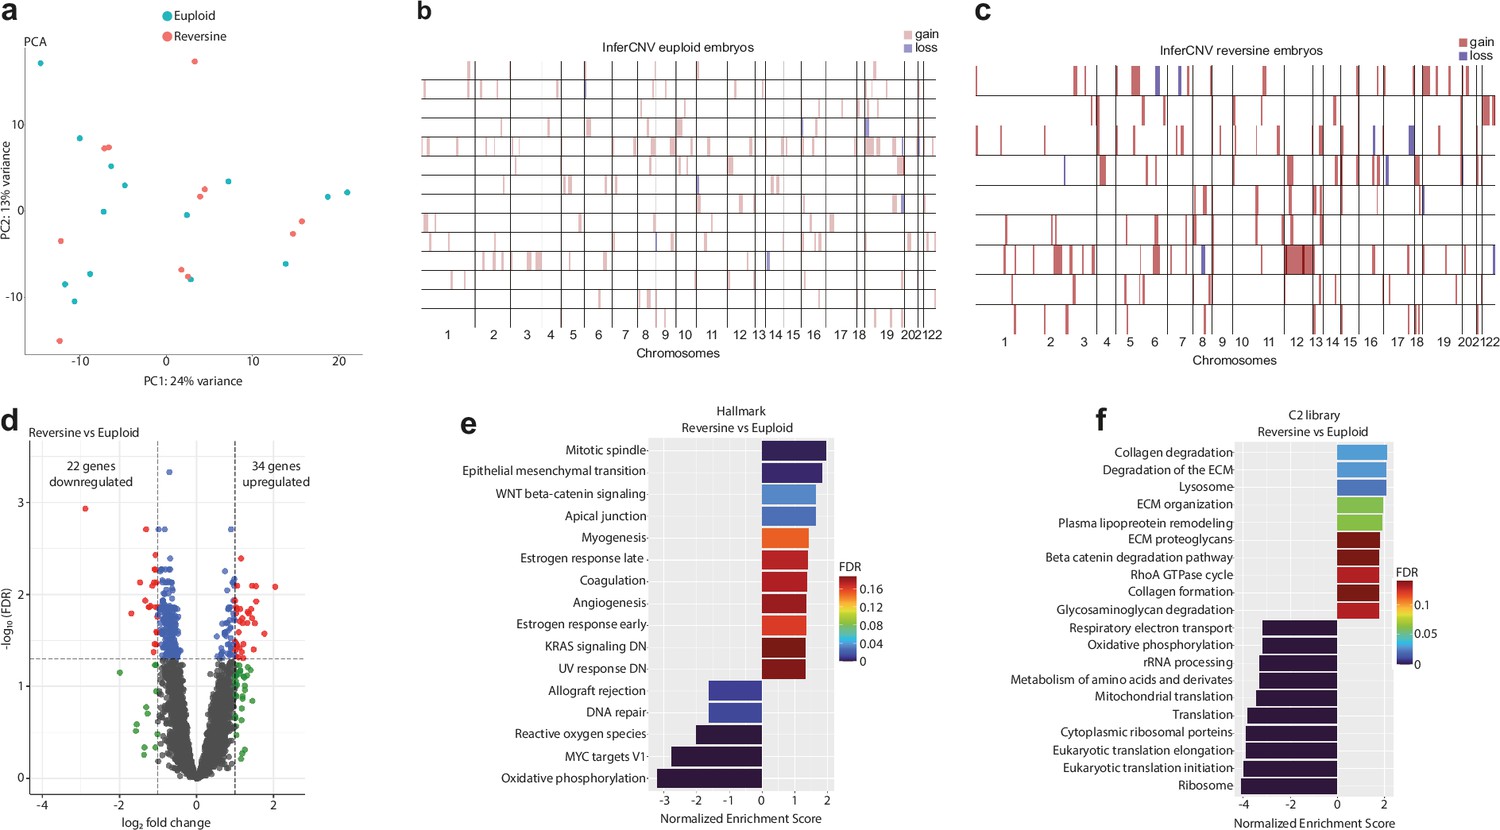
Expanded RNA-sequencing analysis.
(a) Principal component analysis of reversine versus euploid embryos. (b) InferCNV analysis of individual euploid samples compared to the reference set. (c) InferCNV analysis of individual reversine samples compared to the reference set. (d) Volcano plot after differential gene expression analysis with a cutoff value of |log2 fold change|>1 and -log10(FDR)<0.05 for reversine versus euploid embryos showing 34 upregulated and 22 downregulated genes. (e) Barplot of enriched Hallmark pathways after gene set enrichment analysis of reversine versus euploid embryos using a cut-off value of 25% FDR. (f) Barplot of TOP20 enriched C2 library pathways after gene set enrichment analysis of reversine versus euploid embryos using a cut-off value of 25% FDR. Source of all embryos: Experiment 1.
Figure 2
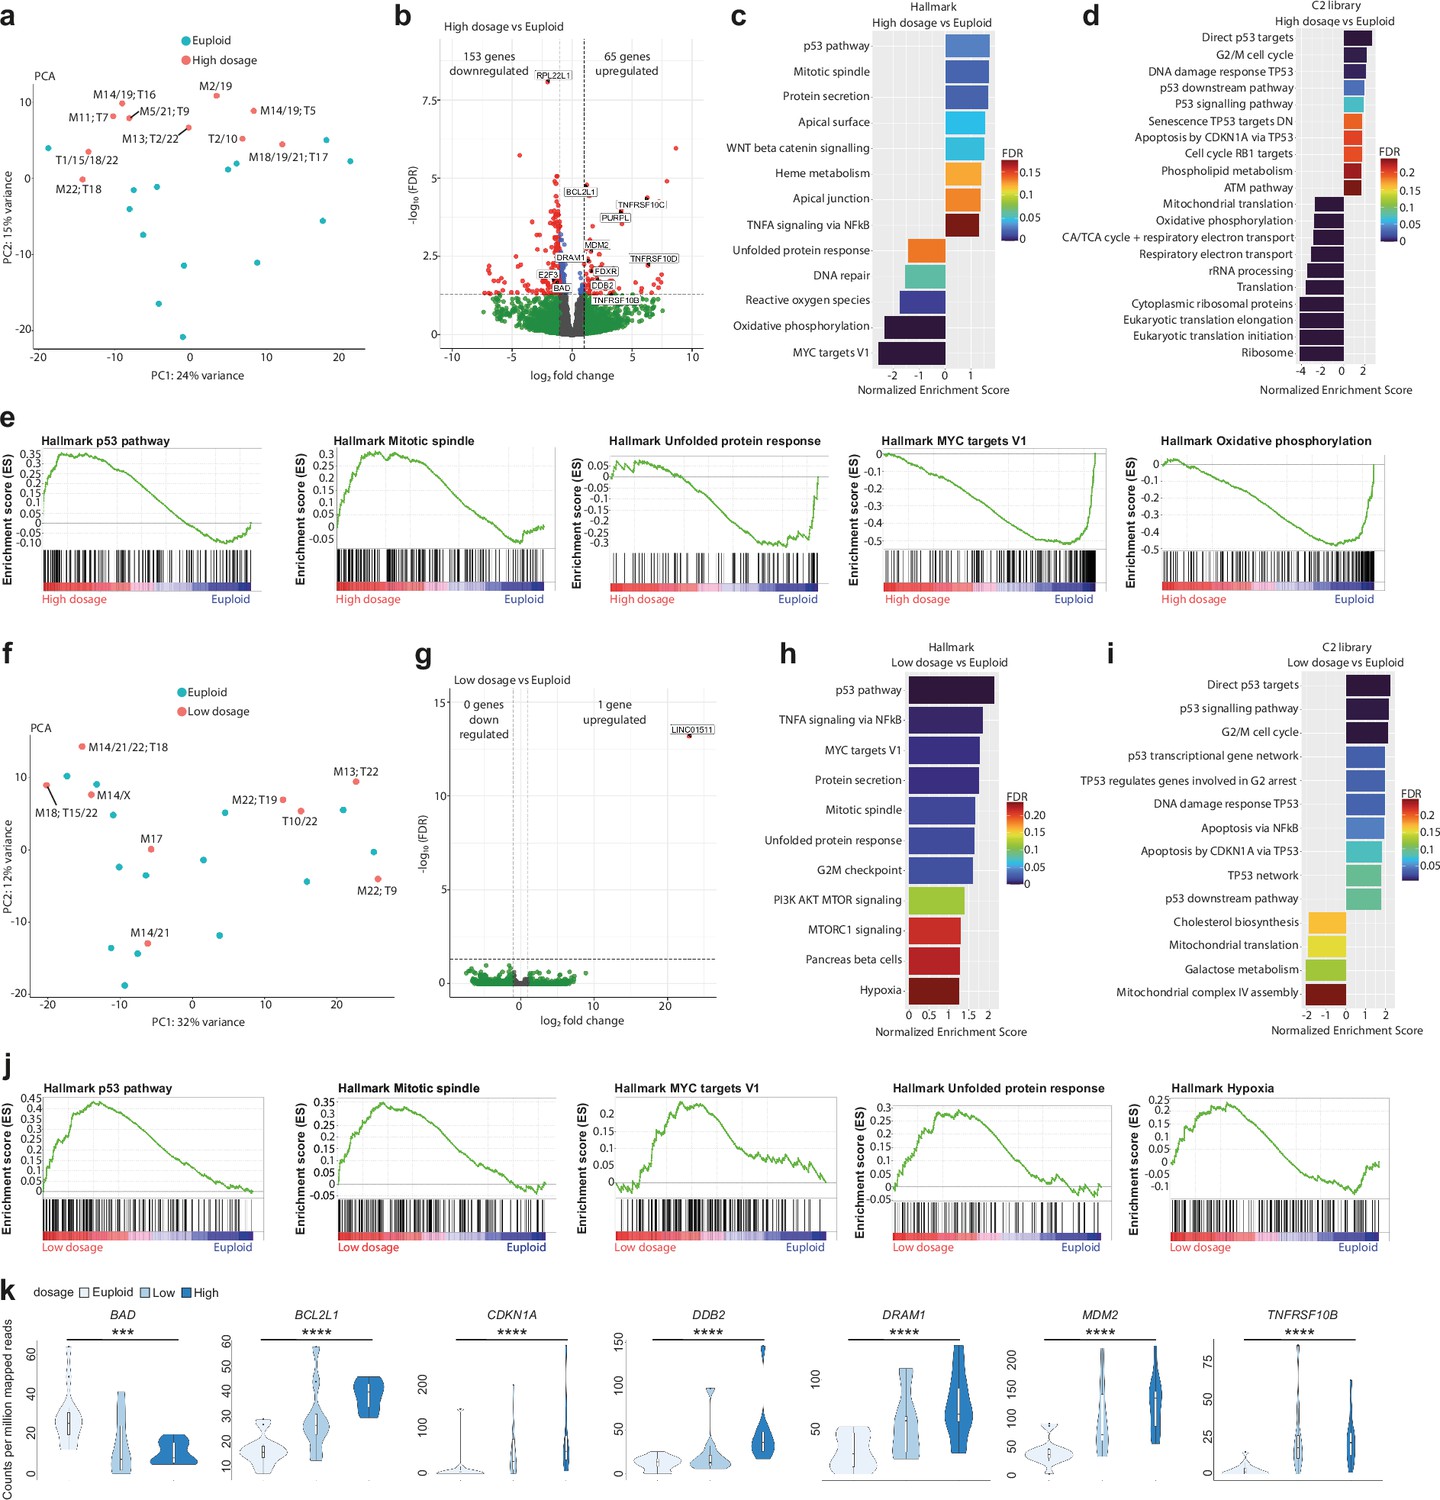
Human embryos with the highest number of genes with abnormal copy number show stronger p53 pathway and apoptosis response.
(a) Principal component analysis after transcriptome analysis of high-dosage aneuploid versus euploid embryos. T=Trisomy, M=Monosomy. (b) Volcano plot after differential gene expression analysis with a cutoff value of |log2 fold change|>1 and -log10(FDR)<0.05 for high-dosage aneuploid versus euploid embryos showing 65 upregulated and 153 downregulated genes. (c) Barplot of enriched Hallmark pathways after gene set enrichment analysis of high-dosage aneuploid versus euploid embryos using a cut-off value of 25% FDR. (d) Barplot of TOP20 enriched C2 library pathways after gene set enrichment analysis of high-dosage aneuploid versus euploid embryos using a cut-off value of 25% FDR. (e) Enrichment plots of p53-pathway, mitotic spindle, unfolded protein response, MYC targets V1 and oxidative phosphorylation, showing up- or downregulation of genes that are part of the corresponding pathway. (f) Principal component analysis after transcriptome analysis of low-dosage aneuploid versus euploid embryos. T=Trisomy, M=Monosomy. (g) Volcano plot after differential gene expression analysis with a cutoff value of |log2 fold change|>1 and -log10(FDR)<0.05 for low-dosage aneuploid versus euploid embryos showing 1 upregulated and 0 downregulated genes. (h) Barplot of enriched Hallmark pathways after gene set enrichment analysis of low-dosage aneuploid versus euploid embryos using a cut-off value of 25% FDR. (i) Barplot of enriched C2 library pathways after gene set enrichment analysis of low-dosage aneuploid versus euploid embryos using a cut-off value of 25% FDR. (j) Enrichment plots of p53-pathway, mitotic spindle, MYC targets V1, unfolded protein response, and hypoxia showing upregulation of genes that are part of the corresponding pathway. (k) Violin plots with box and whisker plots of the counts per million mapped reads of a supervised set of 10 that are part of apoptosis (BAD, BCL2L1, TNFRSF10B), p53 pathway (DRAM1, MDM2, CDKN1A), and DNA-damage (DDB2). *p=0.027, **p=0.010, ***p=0.004, ****p<0.001 using the Jonkheere-Terpstra test. Box and whisker plots show median and minimum to maximum values. Source of all embryos: Experiment 1.
Figure 3 with 1 supplement
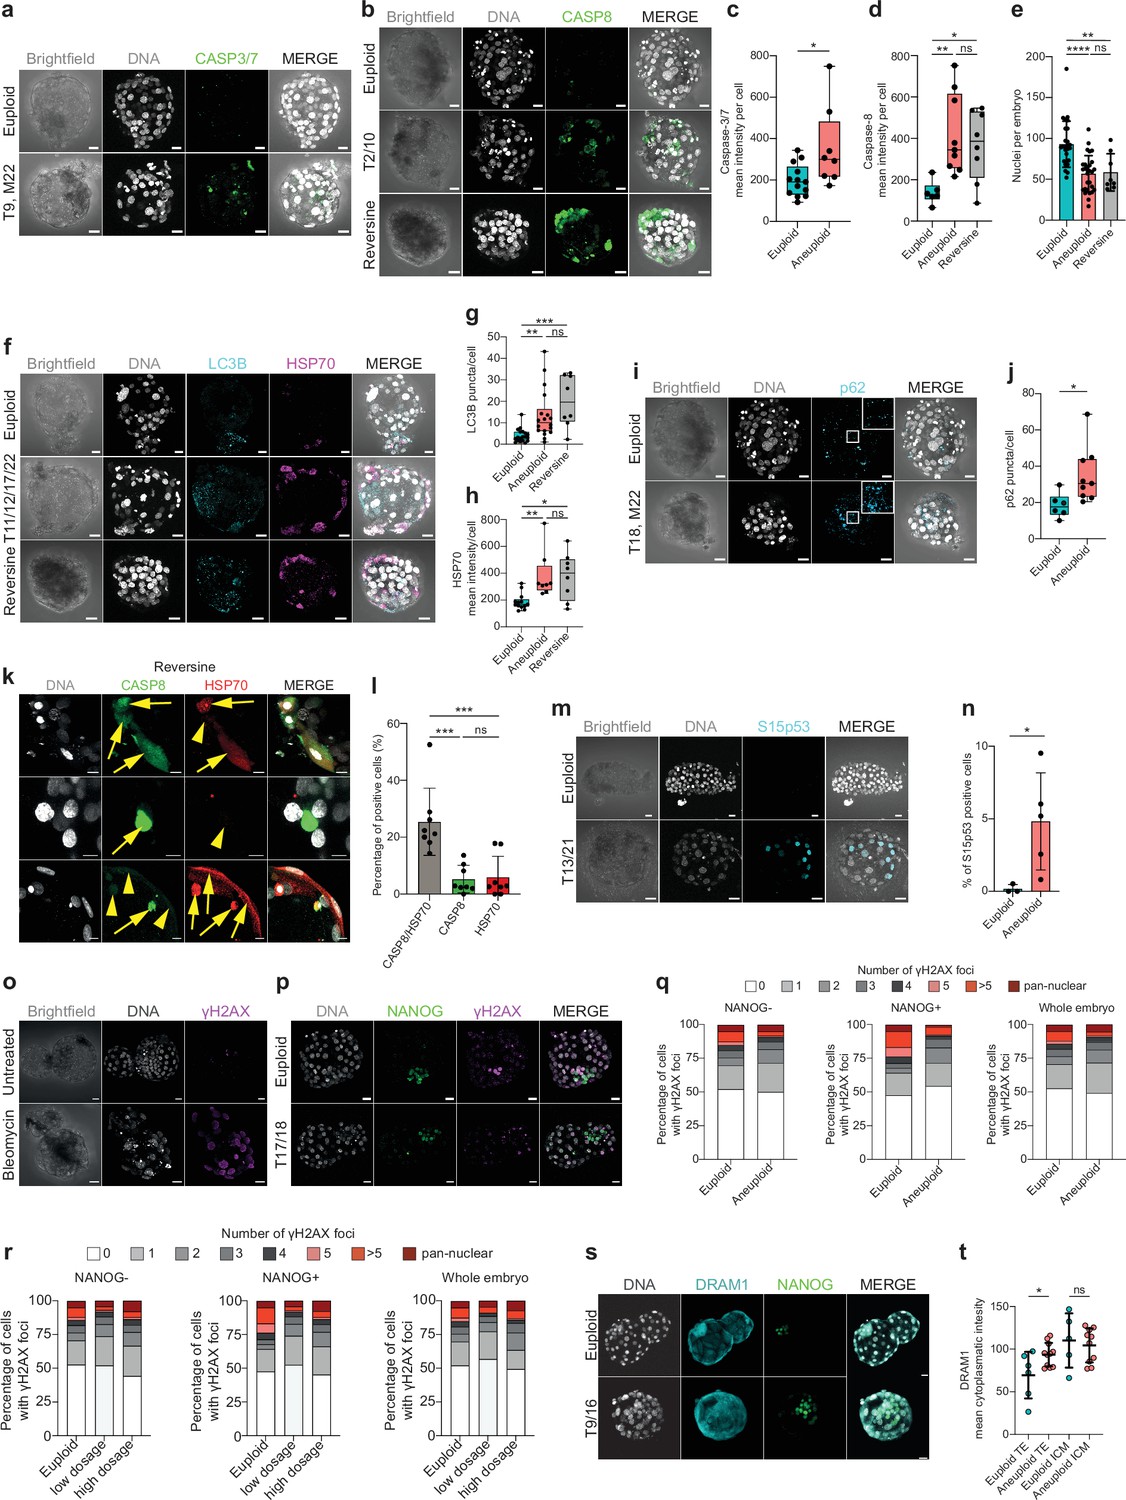
Immunostaining reveals increased proteotoxic stress, DNA-damage independent p53-activation, autophagy, and apoptosis.
(a) Orthogonal projections after immunostaining of euploid and aneuploid embryos for DNA (white) and CASP3/7 (green). T=Trisomy, M=Monosomy. Source: Experiment 1. (b) Orthogonal projections after immunostaining of euploid, aneuploid, and reversine-treated embryos for DNA (white) and CASP8 (green). T=Trisomy. Source: Experiment 1. (c) CASP3/7 mean intensity per cell. Euploid n=13, Aneuploid n=8 embryos. Unpaired t-test, *p=0.0177. Source: Experiment 1. (d) CASP8 mean intensity per cell. Euploid n=6, Aneuploid n=9, Reversine-treated n=8 embryos. One-way ANOVA, *p=0.04, **p=0.0098, ns=non-significant. Source: Experiment 1. (e) Number of nuclei per embryo. Euploid n=26, Aneuploid n=29, Reversine-treated n=8 embryos. One-way ANOVA, ****p<0.0001, **p=0.0033, ns = non-significant. Source: Experiment 1 and 3. (f) Orthogonal projections after immunostaining of euploid, aneuploid, and reversine-treated embryos for DNA (white), LC3B (turquoise), and HSP70 (magenta). T=Trisomy. Source: Experiment 1. (g) LC3B puncta per cell. Euploid n=19, Aneuploid n=22 embryos, Reversine-treated n=8 embryos. One-way ANOVA, **p=0.0069, ***p=0.0003, ns=non-significant. Source: Experiment 1. (h) HSP70 mean intensity per cell. Euploid n=13, Aneuploid n=8, Reversine-treated n=8 embryos. One-way ANOVA, *p=0.0121, **p=0.0096, ns = non-significant. Source: Experiment 1. (i) Orthogonal projections after immunostaining of euploid, aneuploid for DNA (white), and p62 (turquoise). White square shows a zoom of a representative area. T=Trisomy, M=Monosomy. Source: Experiment 1. (j) p62 puncta per cell. Euploid n=6, Aneuploid n=9 embryos. Unpaired t-test, *p=0.0284. Source: Experiment 1. (k) Optical sections of reversine treated embryos for DNA (white), CASP8 (green), HSP70 (red) showing cells with presence (yellow arrow) or absence (yellow arrowhead) of the proteins to investigate co-localization. Source: Experiment 1. (l) Percentage of cells of reversine embryos positive for either CASP8/HSP70, CASP8, or HSP70. One-way ANOVA, CASP8/HSP70 vs CASP8 ***p=0.0003, CASP8/HSP70 vs HSP70 ***p=0.0005, ns = non-significant. Source: Experiment 1. (m) Orthogonal projections after immunostaining of euploid, aneuploid for DNA (white), and Serine (S) 15 p53 (turquoise). Source: Experiment 4. (n) Percentage of Serine 15 p53 positive cells per embryo. Euploid n=3, Aneuploid n=5. Unpaired t-test with Welch’s correction, *p=0.0356. T=Trisomy. Source: Experiment 4. (o) Orthogonal projections of immunostained untreated (n=6) and Bleomycin treated (n=6) embryos for DNA (white) and gH2AX (magenta) showing few foci in the untreated and pan-nuclear expression of gH2AX. Source: Experiment: 2. (p) Orthogonal projections of immunostained euploid (n=7) and aneuploid (n=11) embryos for DNA (white), NANOG (green) and gH2AX (magenta). T=Trisomy. Source: Experiment 3. (q) Percentage of cells with gH2AX foci or pan nuclear expression of euploid (n=7) and aneuploid (n=11) embryos in NANOG-negative, NANOG positive cells and whole embryos. Source: Experiment 3. (r) Percentage of cells with gH2AX foci or pan nuclear expression of euploid (n=7), low-dosage (n=5), and high-dosage (n=6) aneuploid embryos in NANOG-negative, NANOG positive cells and whole embryos. Source: Experiment 3. (s) Orthogonal projections of immunostained euploid (n=6) and aneuploid (n=11) embryos for DNA (white), DRAM1 (turquoise), and NANOG (green). T=Trisomy. Source: Experiment 3. (t) DRAM1 mean cytoplasmatic intensity in TE and ICM of euploid and aneuploid cells. Euploid TE (n=312 cells from 6 embryos). Aneuploid TE (n=434 cells from 11 embryos). Euploid ICM (n=43 cells from five embryos). Aneuploid ICM (n=70 cells from 10 embryos). Each dot represents the mean of all cells per embryo. Unpaired t-test, *p=0.0267, ns = non-significant. Source: Experiment 3. Embryo sources are indicated in each section. Brightfield pictures were obtained during confocal imaging. All scale bars are 20 µm. Box and whisker plots show median, and whiskers show minimum to maximum values. Bar plots and scatter plots show mean ± s.d.
-
Figure 3—source data 1
Raw data of figures.
- https://cdn.elifesciences.org/articles/88916/elife-88916-fig3-data1-v1.xlsx
Figure 3—figure supplement 1
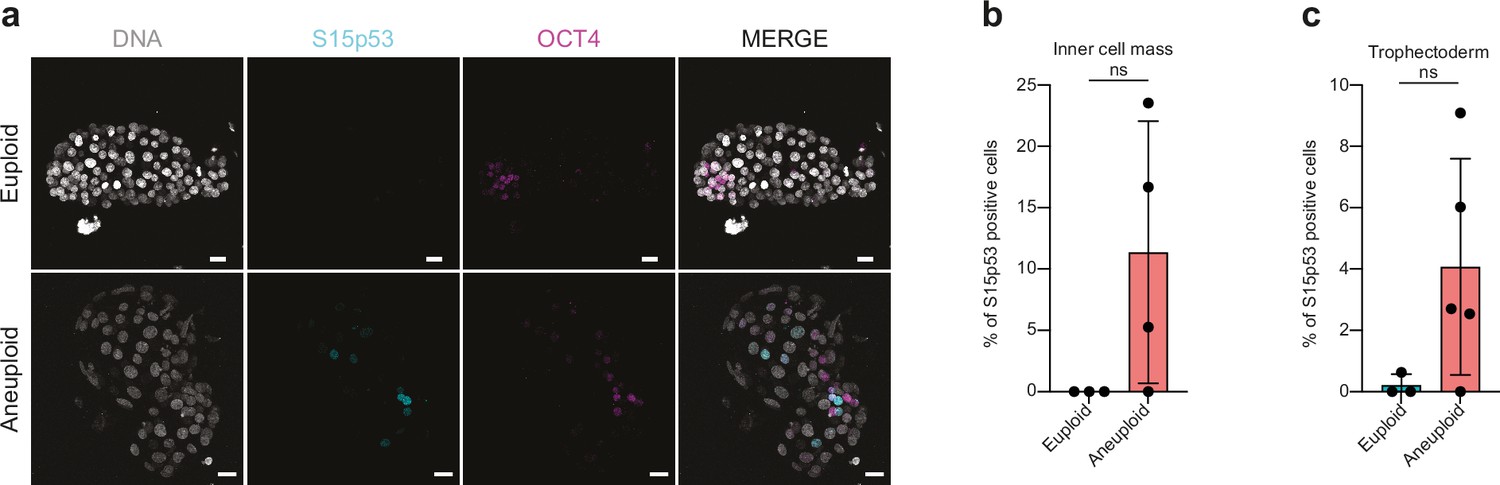
S15-p53 expression in trophectoderm (TE) vs OCT4-positive cells (inner cell mass, ICM/epiblast, EPI) in aneuploid embryos.
(a) Orthogonal projections after immunostaining of euploid and aneuploid embryos for DNA (white), S15p53 (turquoise), and OCT4 (magenta). (b) Percentages of nuclei positive for S15p53 per embryo in euploid (n=3) and aneuploid (n=4) embryos in the ICM. (c) Percentages of nuclei positive for S15p53 per embryo in euploid (n=3) and aneuploid (n=5) embryos in the TE. Brightfield pictures were obtained during confocal imaging. All scale bars are 20 µm. Box and plots show median and minimum to maximum values. Bar plots show mean ± s.d. For all plots each dot represents a single embryo. Source of all embryos: Experiment 4.
Figure 4
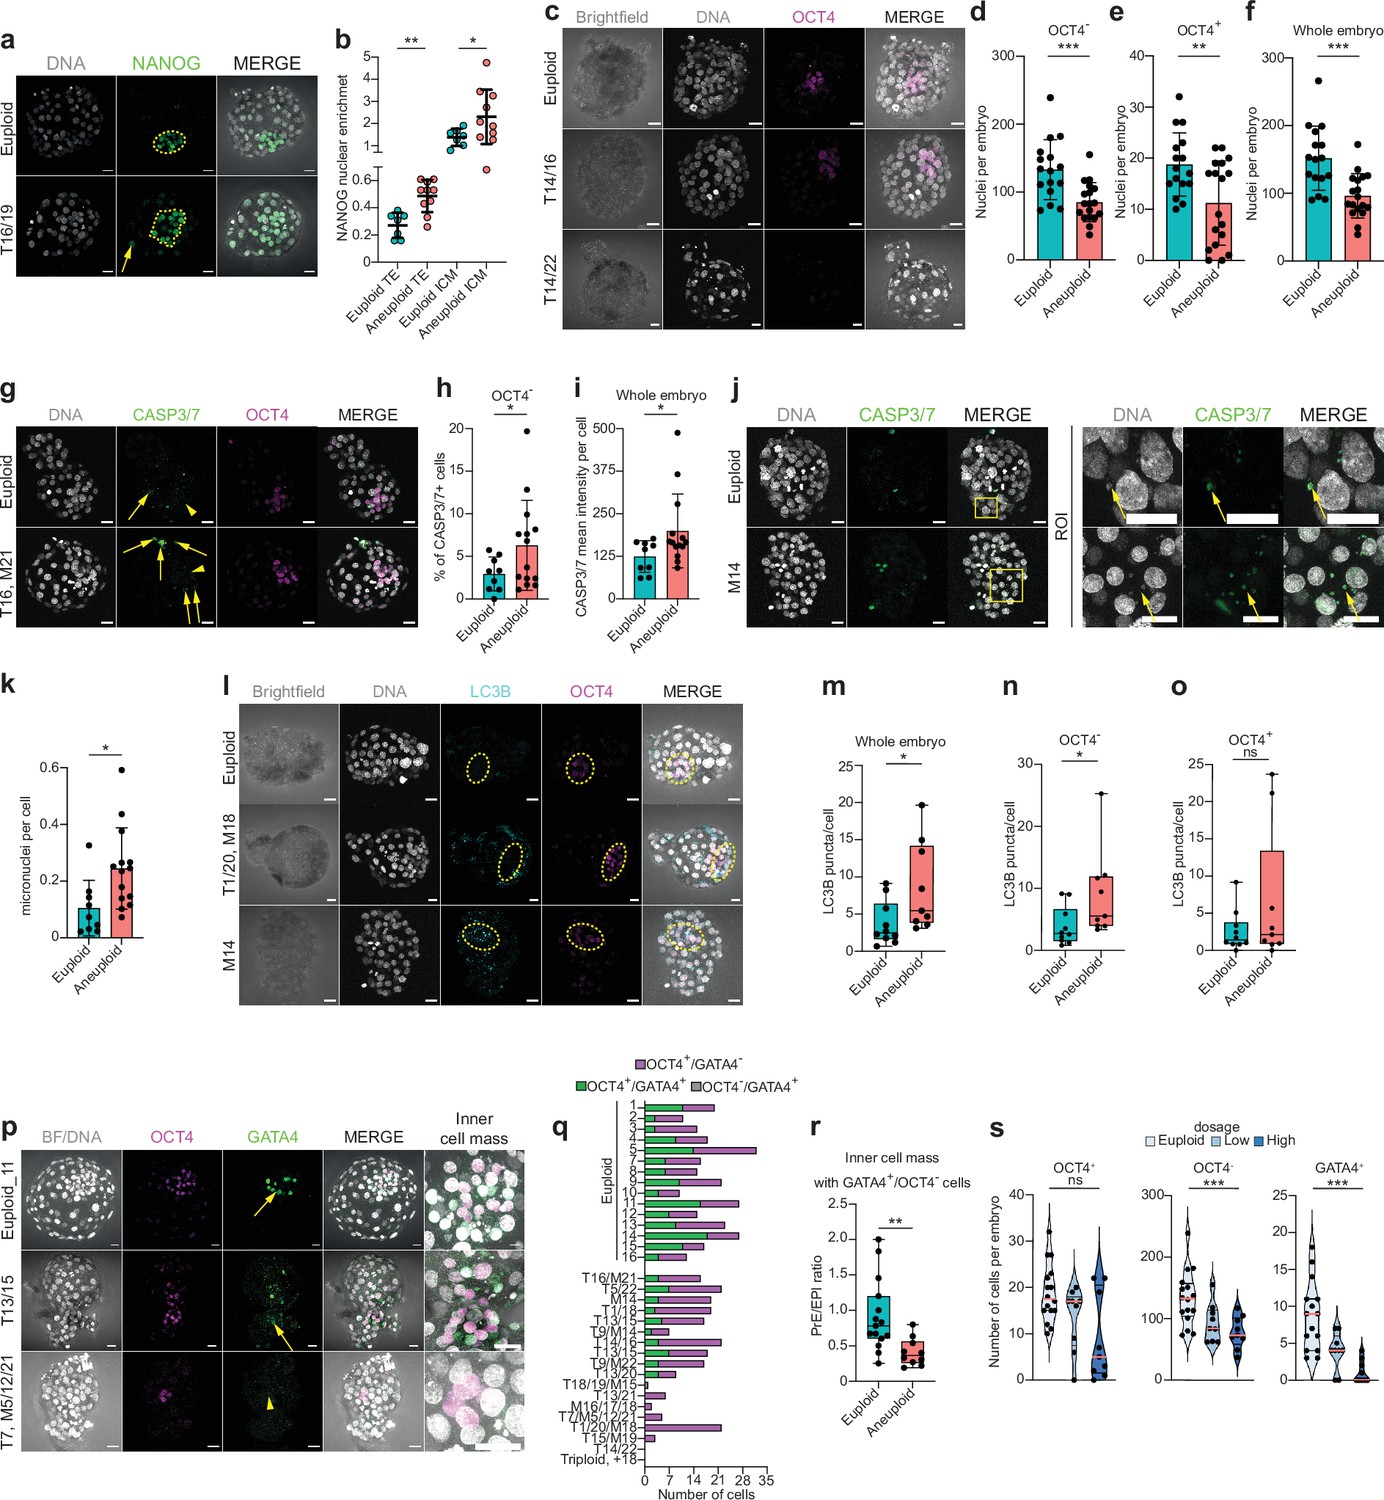
Aneuploid human embryos show less cells in trophectoderm and OCT4-positive cells and impaired lineage segregation events.
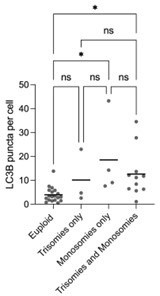
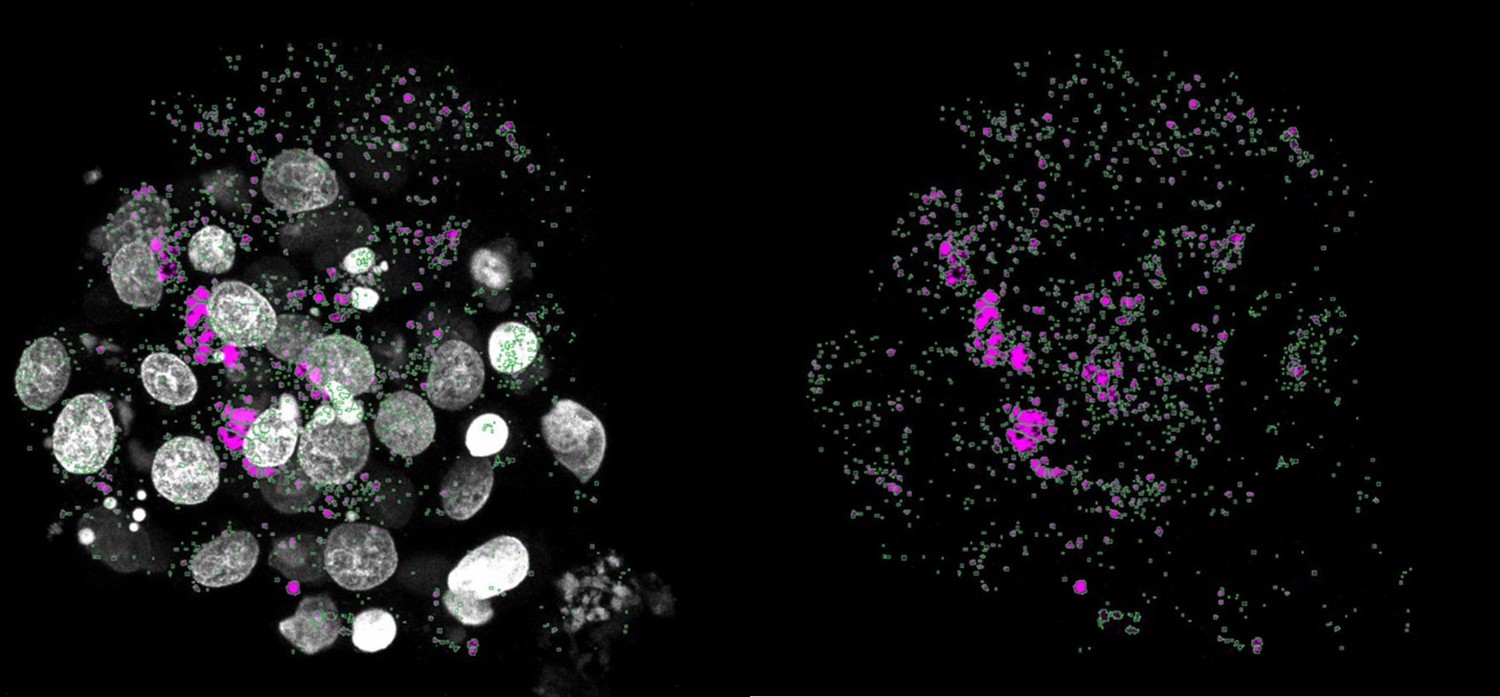
(a) Orthogonal projections after immunostaining of euploid (n=7) and aneuploid embryos (n=10) for DNA (white) and NANOG (green). T=Trisomy. Source: Experiment 3. (b) NANOG nuclear enrichment in cells of the trophectoderm (TE) and inner cell mass (ICM) of euploid and aneuploid embryos. Each dot represents the mean of all cells per embryo. Euploid TE (n=718 cells from seven embryos). Aneuploid TE (n=708 cells from 10 embryos). Euploid ICM (n=77 cells from seven embryos). Aneuploid ICM (n=77 cells from 10 embryos). For euploid TE versus aneuploid TE: Unpaired t-test, **p=0.0011. For euploid versus aneuploid ICM: Unpaired t-test with Welch’s correction, *p=0.0474. (c) Orthogonal projections after immunostaining of euploid and aneuploid embryos for DNA (white) and OCT4 (magenta). The first aneuploid panel (Trisomy 14 and 16) shows a similar number of ICM cells compared to the euploid embryo. The second aneuploid panel (Trisomy 14 and 22) shows an embryo without an ICM. T=Trisomy. Source: Experiment 4. (d,e,f) Differences in number of nuclei per embryo between euploid and aneuploid embryos in the (d) OCT4-negative cells (trophectoderm) ***p=0.0006, (e) OCT4-positive cells (ICM/epiblast, EPI), **p=0.0055 and (f) whole embryo ***p=0.0003. Euploid n=16, Aneuploid n=18. Unpaired t-test. Source: Experiment 4. (g) Orthogonal projections after immunostaining of euploid and aneuploid embryos for DNA (white), CASP3/7 (green), and OCT4 (magenta). c. T=Trisomy, M=Monosomy. Yellow arrows indicate presence of the signal and yellow arrow heads indicate absence of signal. (h) Percentage (%) of CASP3/7 positive (+) cells in the trophectoderm lineage (OCT4-negative cells). Euploid n=9, Aneuploid n=14. Unpaired t-test with Welch’s correction, *p=0.0453. Source: Experiment 4. (i) CASP3/7 mean intensity per cell of whole embryos. Euploid n=9, Aneuploid n=14. Unpaired t-test with Welch’s correction, *p=0.0332. Source: Experiment 4. (j) Left panel: Orthogonal projections after immunostaining of euploid and aneuploid embryos for DNA (white) and CASP3/7 (green) showing micronuclei. Yellow box indicates zoomed-in region of interest (ROI). Yellow arrows indicate presence of micronuclei and overlap between DNA and CASP3/7. Source: Experiment 4. (k) Number of micronuclei per cell in euploid and aneuploid whole embryos. Euploid n=9, Aneuploid n=14. Unpaired t-test with Welch’s correction, *p=0.0115. Source: Experiment 4. (l) Orthogonal projections after immunostaining of euploid and aneuploid embryos for DNA (white), LC3B (turquoise), and OCT4 (magenta). Yellow circle indicates the ICM. The first aneuploid panel (Trisomy 1 and 20 and monosomy 18) shows OCT4-positive cells (ICM/EPI) with low levels of autophagy. The second aneuploid panel (Monosomy 14) shows an embryo with high levels of autophagy in the ICM. Source: Experiment 4. (m, n, o) Differences in LC3B puncta per cell between euploid (n=10) and aneuploid (n=9) embryos in the (m) whole embryo, *p=0.0220, (n) OCT4-negative cells (trophectoderm),*P=0.0172 and (o) OCT4-positive cells (ICM/EPI) ns = non-significant. Mann-Whitney test. Source: Experiment 4. (p) Orthogonal projections after immunostaining of euploid and aneuploid embryos for DNA (white), OCT4 (magenta), and GATA4 (green). The first aneuploid panel (trisomy 13 and 15) shows an embryo with presence of GATA4 positive cell (PrE). The second aneuploid panel (Trisomy 7 and monosomies 5, 12, and 21) shows an embryo that did not contain GATA4 positive cells. Source: Experiment 4. (q) Differences in the number of cells per embryo that were OCT4 positive and either GATA4 negative (magenta) or positive (green) or OCT4 negative and GATA4 positive (gray) between euploid (n=15) and aneuploid (n=18) embryos. In case GATA4-positive cells (PrE) were present we considered the GATA4-negative cells to be epiblast (EPI). All euploid embryos contained GATA4-positive cells, 7/18 aneuploid embryos had an ICM completely lacking GATA4-positive cells (Fisher-exact test, p=0.009). (r) Differences in the PrE/EPI ratio between euploid and aneuploid embryos that had an ICM containing GATA4-positive cells. Euploid n=15, Aneuploid n=10. Unpaired t-test, **p=0.0068. Source: Experiment 4. (s) Violin plots with box plots of OCT4-positive-cells (ICM/EPI) per embryo (left, ns), OCT4-negative cells (trophectoderm) per embryo (center, ***p<0.001), and GATA4-positive-cells (PrE) per embryo (right, ***p<0.001, Jonkheere-Terpstra test) depending on gene dosage. Euploid (light blue), Low-dosage (middle blue), and High-dosage (darkest blue). Source: Experiment 4. Brightfield pictures were obtained during confocal imaging. All scale bars are 20 µm. Box and whisker plots show median and minimum to maximum values. Bar plots show mean ± s.d. Besides (b) all dots represent one embryo.
-
Figure 4—source data 1
Raw data of figures.
- https://cdn.elifesciences.org/articles/88916/elife-88916-fig4-data1-v1.xlsx
Author response image 1

Author response image 2
Author response image 3
Tables
Key resources table
| Reagent type (species) or resource | Designation | Source or reference | Identifiers | Additional information |
|---|---|---|---|---|
| Antibody | Anti-HSP70 (Mouse monoclonal) | Invitrogen | MA3-007 | IF(1:200) |
| Antibody | Anti-SQSTM1/p62 (Mouse monoclonal) | Abcam | ab56416 | IF(1:100) |
| Antibody | Recombinant Anti-LC3B (Rabbit monoclonal) | Abcam | ab192890 | IF(1:838) |
| Antibody | Anti-OCT3/4 (Mouse monoclonal) | Santa-Cruz | sc-5279 | IF(1:200) |
| Antibody | Anti-human phosphor-p53 S15 (Rabbit polyclonal) | R&D | AF1043 | IF(1:100) |
| Antibody | Anti-GATA4 (Rat monoclonal) | Invitrogen | 14-9980-82 | IF(1:400) |
| Antibody | Anti-DRAM (Rabbit polyclonal) | Invitrogen | PA20-335 | IF(1:500) |
| Antibody | Anti-phospho-histone H2A.X Ser139 (Mouse monoclonal) | Sigma-Aldrich | 05–636 | IF(1:500) |
| Antibody | Anti-NANOG (Goat polyclonal) | R&D | AF1197 | IF(1:200) |
| Chemical compound, drug | Reversine | Stem Cell Technologies | # 72614 | 0.5 µM |
| Other | CaspGLOW Fluorescein Active Caspase-8 Staining Kit | Invitrogen | 88-7005-42 | IF(1:300) |
| Other | CellEvent Caspase-3/7 Green Detection Reagent | Invitrogen | C10423 | IF(1:400) |
Additional files
-
MDAR checklist
- https://cdn.elifesciences.org/articles/88916/elife-88916-mdarchecklist1-v1.docx
-
Supplementary file 1
PGT diagnoses and inferCNV results first experiment.
- https://cdn.elifesciences.org/articles/88916/elife-88916-supp1-v1.xlsx
-
Supplementary file 2
Differentially expressed genes aneuploid versus euploid embryos.
- https://cdn.elifesciences.org/articles/88916/elife-88916-supp2-v1.xlsx
-
Supplementary file 3
Differentially expressed genes reversine versus euploid embryos.
- https://cdn.elifesciences.org/articles/88916/elife-88916-supp3-v1.xlsx
-
Supplementary file 4
Ranks of imbalanced gene loci for the first experiment.
- https://cdn.elifesciences.org/articles/88916/elife-88916-supp4-v1.xlsx
-
Supplementary file 5
Differentially expressed genes high-dosage versus euploid embryos.
- https://cdn.elifesciences.org/articles/88916/elife-88916-supp5-v1.xlsx
-
Supplementary file 6
Gene dosage ranking Experiment 3 and 4.
- https://cdn.elifesciences.org/articles/88916/elife-88916-supp6-v1.xlsx
-
Supplementary file 7
PGT diagnoses experiment 4.
- https://cdn.elifesciences.org/articles/88916/elife-88916-supp7-v1.xlsx
-
Supplementary file 8
Gene dosage classification experiment 4.
- https://cdn.elifesciences.org/articles/88916/elife-88916-supp8-v1.xlsx
-
Supplementary file 9
Antibodies and reagents used in this study.
- https://cdn.elifesciences.org/articles/88916/elife-88916-supp9-v1.xlsx
Download links
A two-part list of links to download the article, or parts of the article, in various formats.
Downloads (link to download the article as PDF)
Open citations (links to open the citations from this article in various online reference manager services)
Cite this article (links to download the citations from this article in formats compatible with various reference manager tools)
Complex aneuploidy triggers autophagy and p53-mediated apoptosis and impairs the second lineage segregation in human preimplantation embryos
eLife 12:RP88916.
https://doi.org/10.7554/eLife.88916.3


