Molecular mechanism of complement inhibition by the trypanosome receptor ISG65
- Department of Biochemistry, University of Oxford, United Kingdom
- Kavli Institute for Nanoscience Discovery, Dorothy Crowfoot Hodgkin Building, University of Oxford, United Kingdom
- Department of Biochemistry, University of Cambridge, United Kingdom
Figures
Figure 1 with 1 supplement
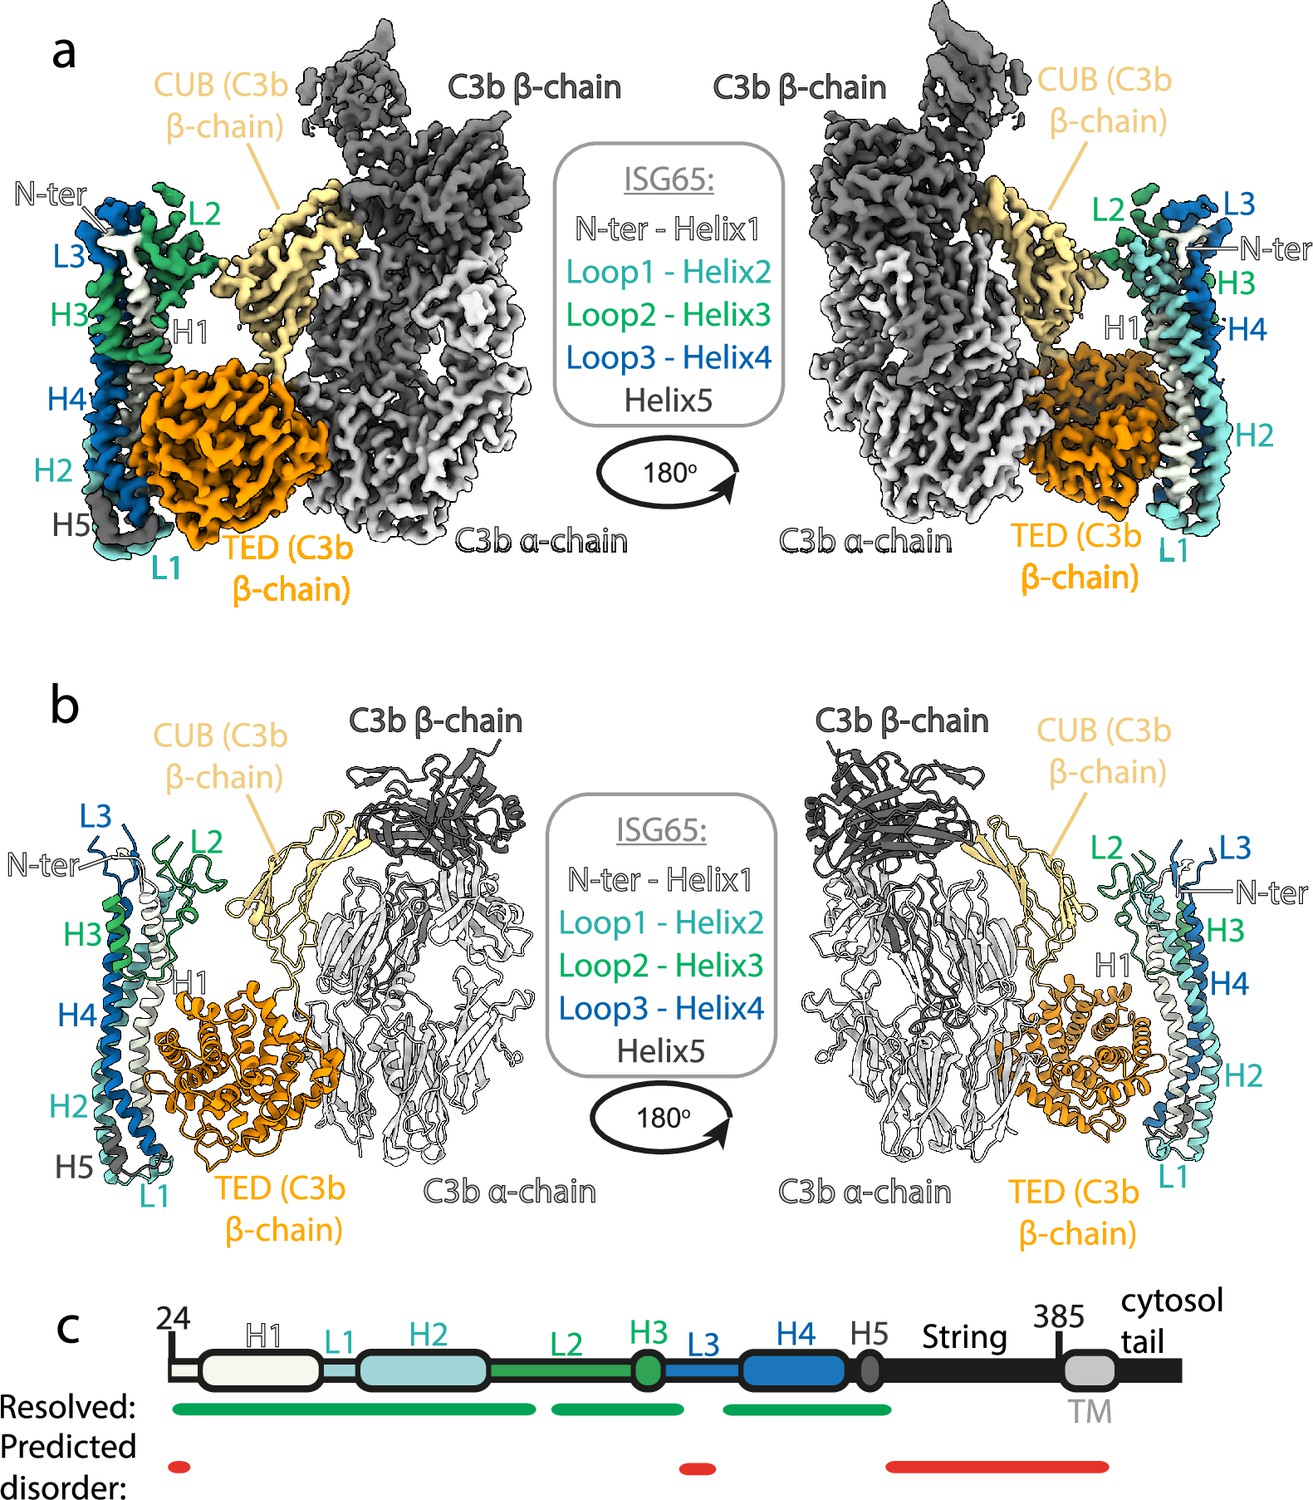
Structure of the complex between ISG65 and human C3b.
(a) Composite volume of locally refined regions determined using cryogenic electron microscopy for ISG65 bound to human C3b. ISG65 is coloured in different shades of blue and green, as indicated in the legend in the centre of the panel (loop1 and helix 2 are light blue, loop 2 and helix 3 are green and loop 3 and helix 4 are dark blue). C3b is coloured in grey scale with the α-chain in light grey and the β-chain in dark grey. The TED domain is highlighted in orange and the CUB domain highlighted in yellow. (b) Molecular model of the same complex with a colour scheme matching that of (a). (c) A schematic showing the features of ISG65, coloured as (a). Regions resolved in the structure are indicated underneath the schematic using a green line and regions predicted to be disordered using AUCpreD (Wang et al., 2016) are shown by the red line.
Figure 1—figure supplement 1
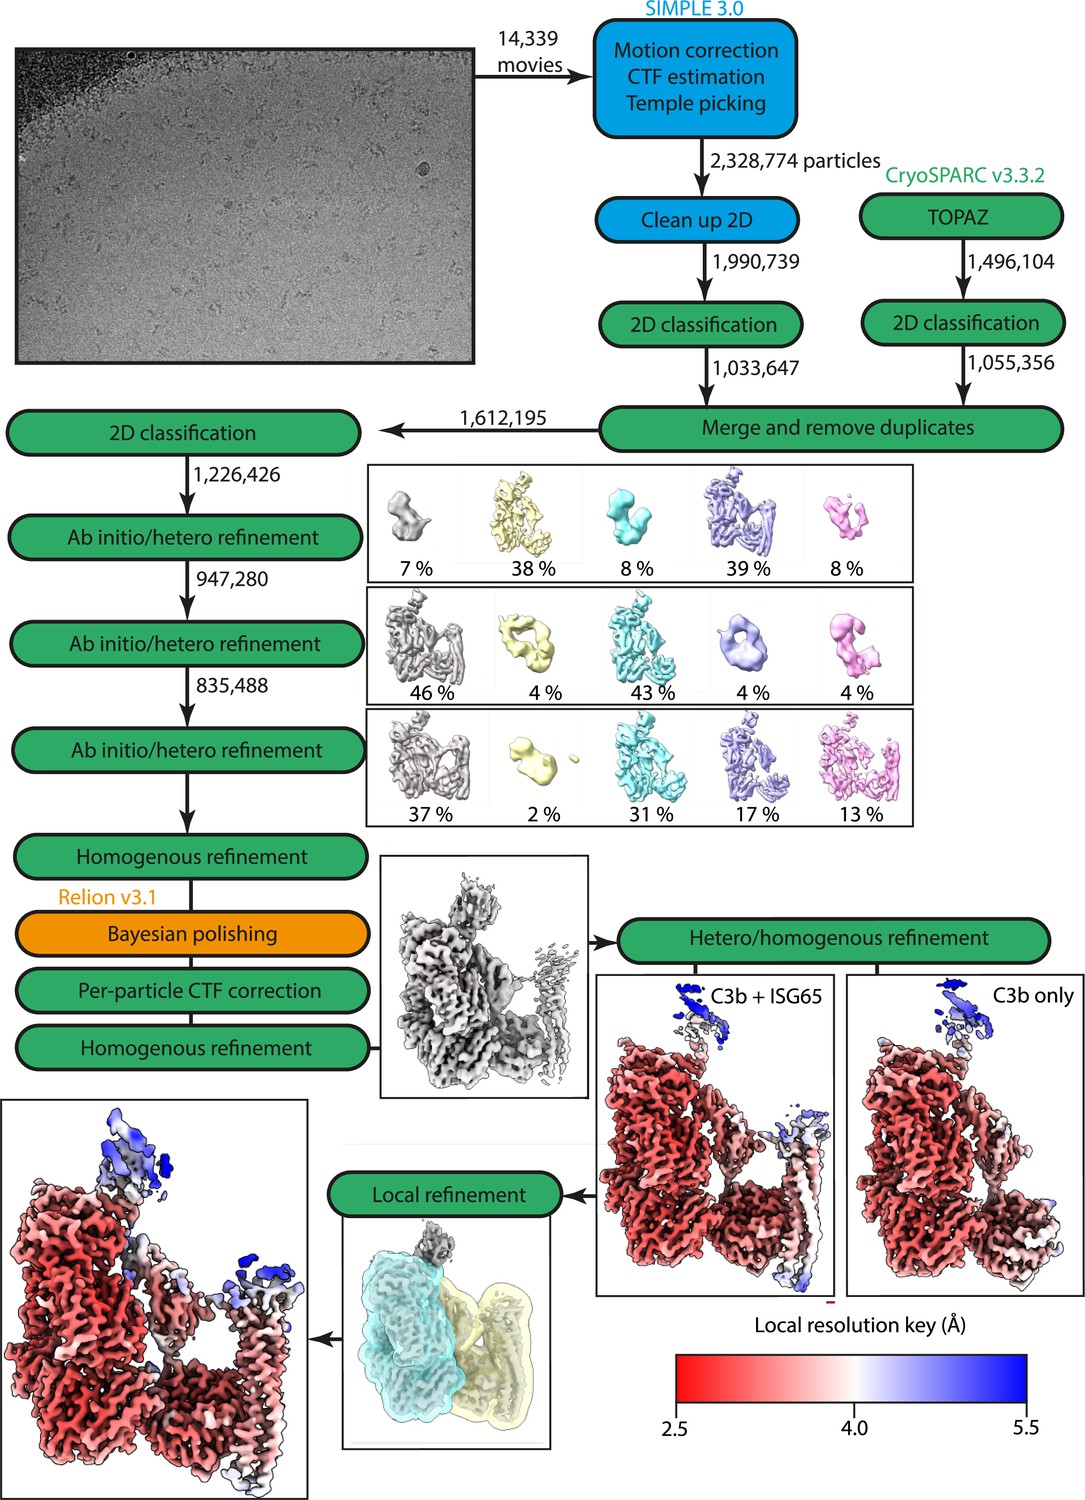
Workflow of Cryo-EM data processing.
Steps highlighted in blue were performed in SIMPLE, steps in green were performed in CryoSPARC, and steps in orange were performed in RELION.
Figure 2 with 1 supplement
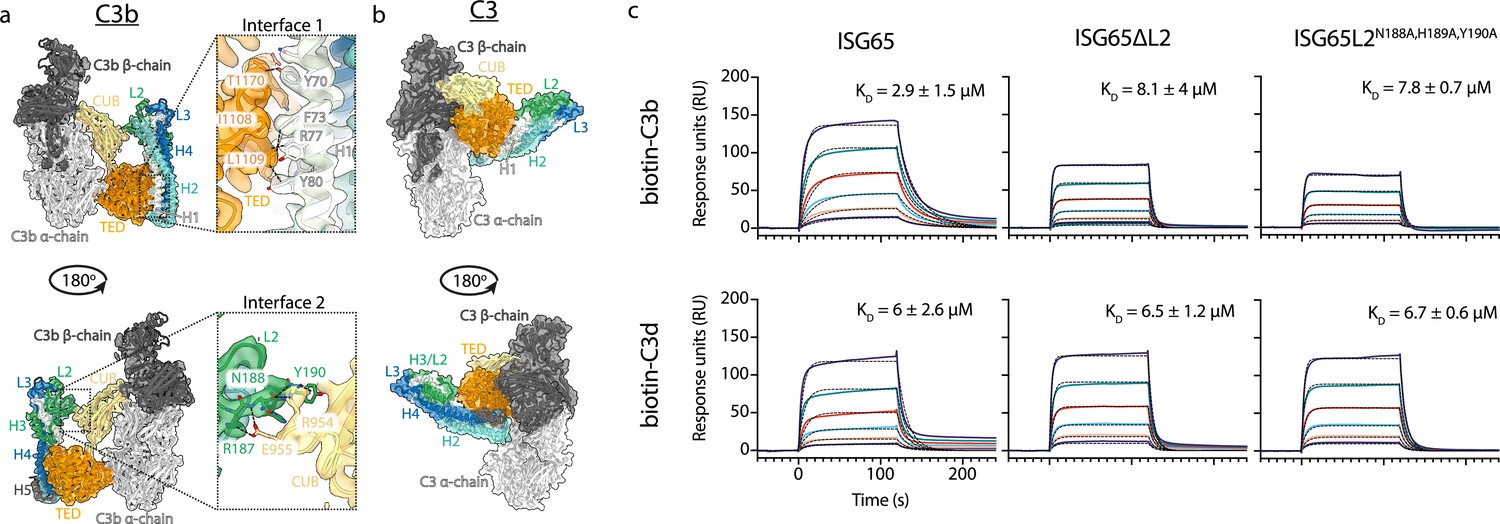
ISG65 forms two distinct interfaces with the TED and CUB domains of C3b.
(a) The ISG65-C3b model shown in transparent cryo-EM density. The top panel shows the interface between ISG65 and the TED domain (orange), with bottom panel showing the interface between loop L2 of ISG65 (green) and the CUB domain of C3b (yellow). In each case, the left-hand panel shows the intact structure, with a dotted box highlighting the region shown in an enlarged form in the right-hand panel. (b) The ISG65 model superimposed onto a previously determined structure of C3 (PDB ID: 2A73) (Janssen et al., 2005) via the TED domain of the ISG65-C3b model. This is shown as a ribbon within a transparent surface representation. ISG65 can bind to C3 via the TED domain, via the same interface as previously identified for ISG65-C3d (Macleod et al., 2022). (c) Surface plasmon resonance data showing responses from the injection of ISG65, ISG65∆L2, and ISG65N188A,H189A,Y190A (twofold serial dilutions from a concentration of 10 μM) over a flow cell coupled to biotin-C3b or biotin-C3d. Data is representative of three experimental repeats. Raw data is available in Figure 2—source data 1.
-
Figure 2—source data 1
Surface plasmon resonance data.
- https://cdn.elifesciences.org/articles/88960/elife-88960-fig2-data1-v1.xlsx
Figure 2—figure supplement 1

Surface plasmon resonance data.
Two experimental replicates of the data are shown in Figure 2c. Twofold serial dilutions from a concentration range of 5000–312.5 nM. Data shown here is derived from two biological replicates of biotin-C3b, biotin-C3d, and ISG65, and one biological replicate of ISG65∆L2, and ISG65N188A,H189A,Y190A. Raw data is available in Figure 2—figure supplement 1—source data 1 and Figure 2—figure supplement 1—source data 2.
-
Figure 2—figure supplement 1—source data 1
Surface plasmon resonance data.
- https://cdn.elifesciences.org/articles/88960/elife-88960-fig2-figsupp1-data1-v1.xlsx
-
Figure 2—figure supplement 1—source data 2
Surface plasmon resonance data.
- https://cdn.elifesciences.org/articles/88960/elife-88960-fig2-figsupp1-data2-v1.xlsx
Figure 3
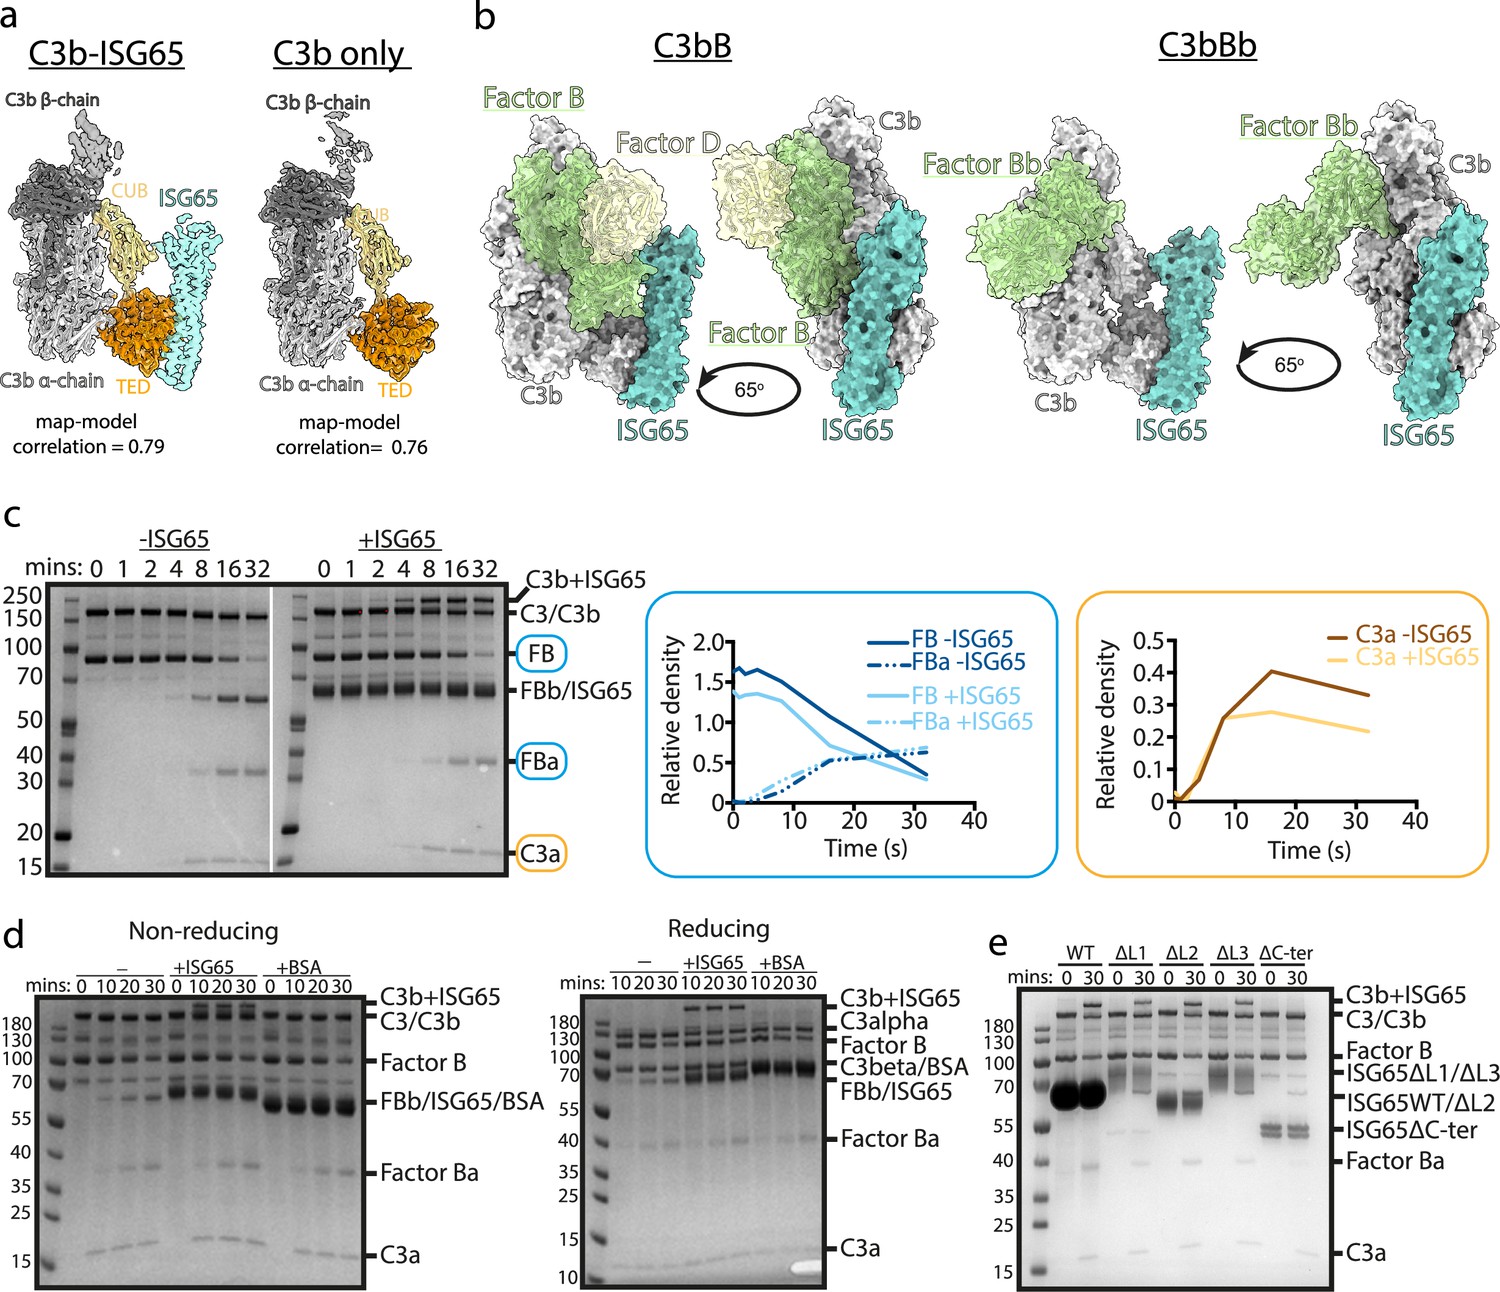
ISG65 does not block the formation of the C3 convertase.
(a) The structure of the ISG65-C3b complex (without ISG65) docked into the electron microscopy-derived volumes obtained for the ISG65-C3b complex (left) and C3b alone (right). (b) Composite models obtained by docking the C3b-ISG65 structure onto those of C3b bound to factors B and D (PDB ID: 2XWJ) (Forneris et al., 2010) or factor Bb (6RUR) (Rooijakkers et al., 2009). (c) An assay for C3 convertase formation in which C3b and factor D were each added at concentrations of 12 nM and C3 and factor B at concentrations of 600 nM. Samples were taken at different time points and were analysed by SDS-PAGE analysis with Coomassie straining. This was done in the absence (left-hand gel) and presence (right-hand gel) of 2 μM ISG65. The graphs show quantification by densitometry for factors B, Ba and C3a to assess convertase function. (d) An equivalent assay to that shown in (c), conducted in the absence of non-complement protein (left), or the presence of 2 μM ISG65 (central) or 2 μM BSA (right). The left-hand gel was run in non-reducing conditions while the right-hand gel was run in reducing conditions. (e). An equivalent assay to that shown in (c), conducted in presence of 2 μM ISG65 or of ISG65 variants lacking loop 1 (ΔL1), loop 2 (ΔL2), loop 3 (ΔL3) or the extended disordered C-terminal region (ΔC-ter). Raw data available Figure 3—source data 1.
-
Figure 3—source data 1
Figure 3c – raw gel 1 annotated.
- https://cdn.elifesciences.org/articles/88960/elife-88960-fig3-data1-v1.zip
-
Figure 3—source data 2
Figure 3c – raw gel 1.
- https://cdn.elifesciences.org/articles/88960/elife-88960-fig3-data2-v1.zip
-
Figure 3—source data 3
Figure 3c – raw gel 2 annotated.
- https://cdn.elifesciences.org/articles/88960/elife-88960-fig3-data3-v1.zip
-
Figure 3—source data 4
Figure 3c – raw gel 2.
- https://cdn.elifesciences.org/articles/88960/elife-88960-fig3-data4-v1.zip
-
Figure 3—source data 5
Figure 3d – raw gel annotated.
- https://cdn.elifesciences.org/articles/88960/elife-88960-fig3-data5-v1.zip
-
Figure 3—source data 6
Figure 3d – raw gel.
- https://cdn.elifesciences.org/articles/88960/elife-88960-fig3-data6-v1.zip
-
Figure 3—source data 7
Figure 3e – raw gel annotated.
- https://cdn.elifesciences.org/articles/88960/elife-88960-fig3-data7-v1.zip
-
Figure 3—source data 8
Figure 3e – raw gel.
- https://cdn.elifesciences.org/articles/88960/elife-88960-fig3-data8-v1.zip
Figure 4 with 1 supplement
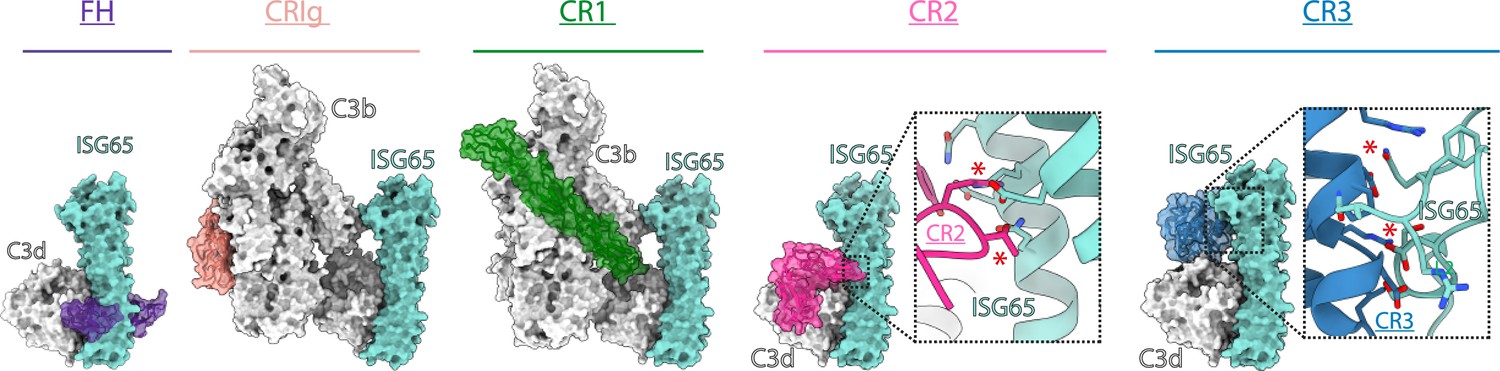
ISG65 overlaps the binding sites for complement receptors 2 and 3.
Composite models obtained by docking the C3b-ISG65 structure onto those of C3b/d bound to factor H CCP19-20 (3OXU) (Morgan et al., 2011), CRIg (2ICF) (Wiesmann et al., 2006), CR1 CCP15-17 (5FO9) (Forneris et al., 2016), CR2 SCR1-2 (3OED) (van den Elsen and Isenman, 2011) and CR3 I-domain (4M76) (Bajic et al., 2013). C3b/d is shown in a solid light grey surface, ISG65 is shown in a solid turquoise surface, and complement regulators are shown in transparent surface with ribbon in various colours.
Figure 4—figure supplement 1

Comparison of ISG65 sequences from T. brucei brucei (green labels), T. brucei rhodesiense (blue labels), and T. brucei gambiense (red labels).
Tables
Key resources table
| Reagent type (species) or resource | Designation | Source or reference | Identifiers | Additional information |
|---|---|---|---|---|
| Gene (Trypanosoma brucei brucei) | ISG65G gene | NCBI BioProject Accession: PRJEB46985 | UniProt: A0A8J9S0Z8 | |
| Gene (Homo sapiens) | CFB gene | NCBI GenBank accession: AF019413.1 | UniProt: P00751 | |
| Gene (H. sapiens) | CFD gene | NCBI GenBank accession: CH471139.2 | UniProt: P00746 | |
| Gene (H. sapiens) | C3 gene | NCBI GenBank accession: AY513239.1 | UniProt: P01024 | |
| Sequence-based reagent | Primers | This paper | See list of primers in the Appendeix. Primers were synthesised by Sigma. | |
| Recombinant DNA reagent | pHL-SEC vector backbone | https://doi.org/10.1107/S0907444906029799; Aricescu et al., 2006 | ||
| Cell line (H. sapiens) | HEK293F | Gibco | R79007 | |
| Biological sample (H. sapiens) | Human serum | NHSBT non-clinical issue | ||
| Software | SIMPLE v3 | https://github.com/hael/SIMPLE/releases; Elmlund et al., 2020 | ||
| Software | CryoSPARC v3 | https://cryosparc.com/; Structura Biotechnology Inc, 2020 | ||
| Software | TOPAZ v0.2.4 | https://github.com/tbepler/topaz; Bepler and Noble, 2020 | ||
| Software | RELION v3.1 | https://relion.readthedocs.io/en/release-3.1/index.html; RELION developer team, 2020 | ||
| Software | DeepEMhancer | https://github.com/rsanchezgarc/deepEMhancer; Sanchez Garcia, 2022 | ||
| Software | AlphaFold2 | https://github.com/google-deepmind/alphafold; AlphaFold Team, 2021 | ||
| Software | ISOLDE v1.0 | https://github.com/tristanic/isolde; Croll, 2019 | ||
| Software | COOT v0.9.8.3 | https://github.com/pemsley/coot; Emsley, 2022 | ||
| Software | PHENIX v1.20.1 | https://phenix-online.org; Phenix Development Group, 2022 | ||
| Software | ChimeraX v1.6 | https://www.cgl.ucsf.edu/chimerax/; UCSF Resource for Biocomputing, Visualization, and Informatics, 2023 | ||
| Software | BIAevaluation v1.0 | Biacore, Cytiva, Marlborough, MA, USA | ||
| Software | Fiji | https://imagej.net/software/fiji/ |
Additional files
-
Supplementary file 1
Supplementary Table 1: Cryo-EM data collection and model building statistics.
- https://cdn.elifesciences.org/articles/88960/elife-88960-supp1-v1.docx
-
Supplementary file 2
Supplementary Table 2: Kinetic parameters of ISG65 variants binding to biotinylated C3b and C3d, as measured by surface plasmon resonance.
Average values and standard deviation from three experimental repeats are reported.
- https://cdn.elifesciences.org/articles/88960/elife-88960-supp2-v1.docx
-
Supplementary file 3
Supplementary Table 3: Mass spectrometry analysis of ISG65-C3b conjugates observed in Figure 3.
The high molecular weight band observed in convertase assay in the presence of ISG65 was excised and analysed by mass spectrometry. The three most abundant proteins identified are presented.
- https://cdn.elifesciences.org/articles/88960/elife-88960-supp3-v1.docx
-
Supplementary file 4
Primers.
- https://cdn.elifesciences.org/articles/88960/elife-88960-supp4-v1.docx
-
MDAR checklist
- https://cdn.elifesciences.org/articles/88960/elife-88960-mdarchecklist1-v1.docx
Download links
A two-part list of links to download the article, or parts of the article, in various formats.
Downloads (link to download the article as PDF)
Open citations (links to open the citations from this article in various online reference manager services)
Cite this article (links to download the citations from this article in formats compatible with various reference manager tools)
Molecular mechanism of complement inhibition by the trypanosome receptor ISG65
eLife 12:RP88960.
https://doi.org/10.7554/eLife.88960.3


