Transposon mutagenesis screen in Klebsiella pneumoniae identifies genetic determinants required for growth in human urine and serum
- Institute of Microbiology and Infection, University of Birmingham, United Kingdom
- Institute for Molecular Bioscience, University of Queensland, Australia
- Division of Infection Medicine, University of Edinburgh, United Kingdom
- Institute of Immunology and Immunotherapy, University of Birmingham, United Kingdom
Figures
Figure 1 with 6 supplements
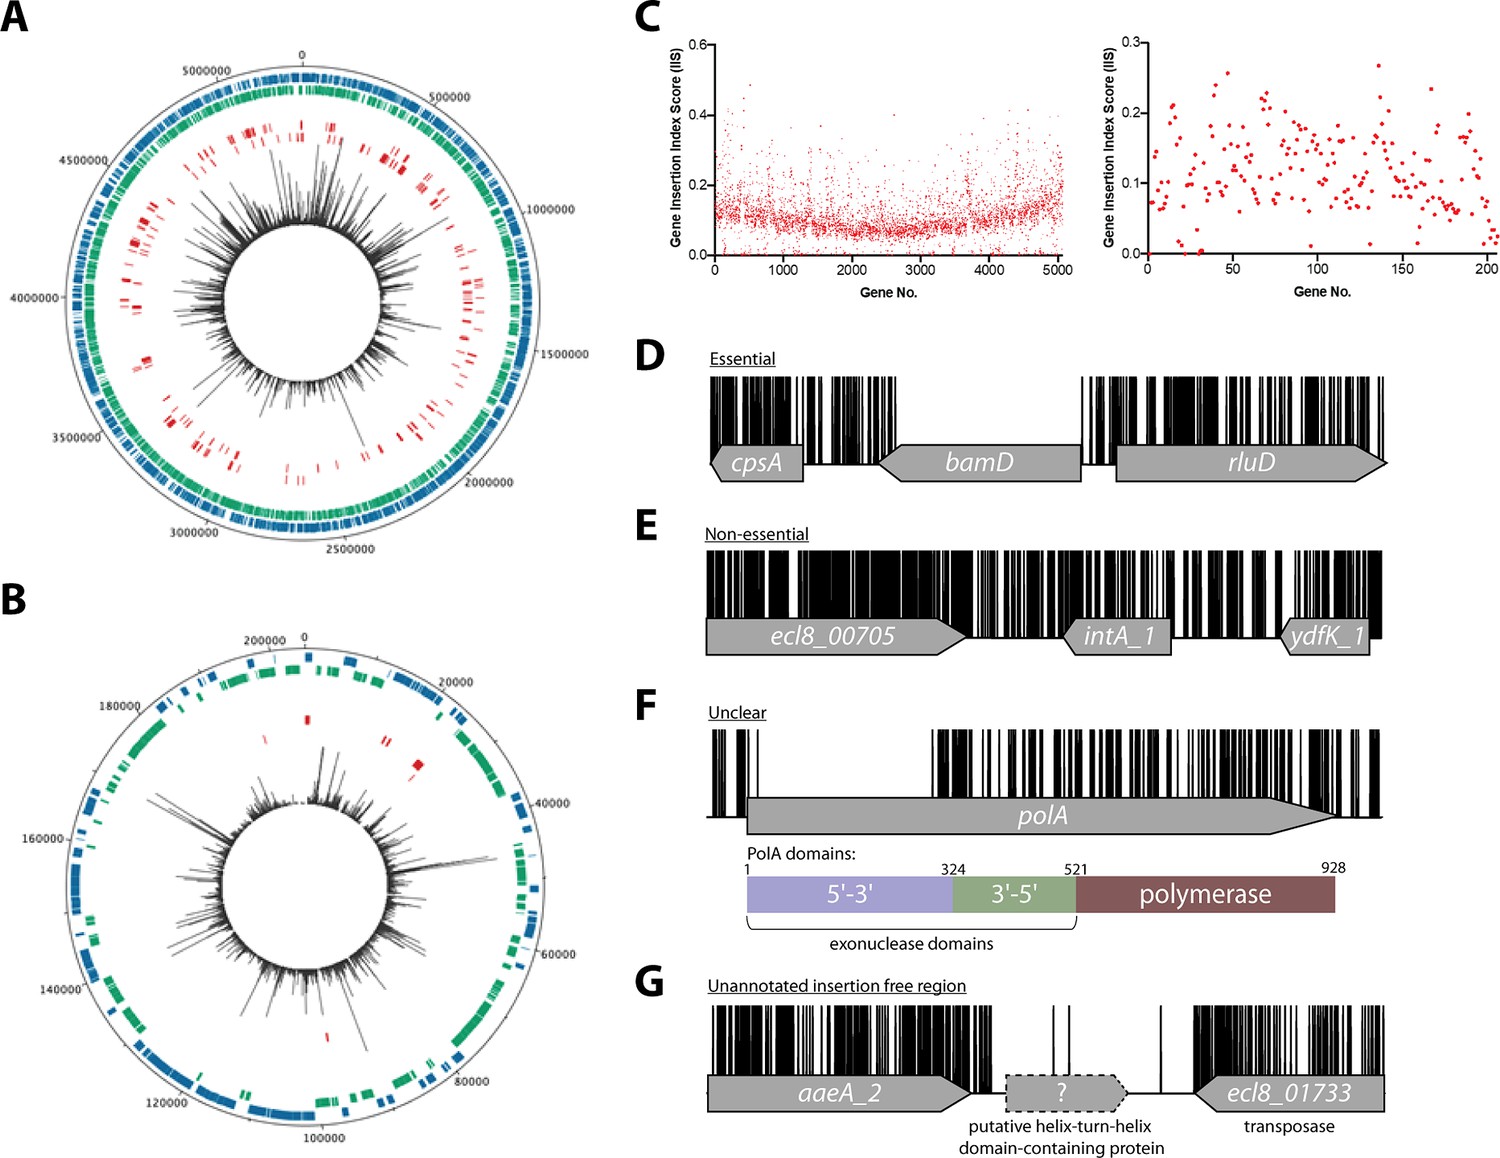
Overview of ECL8 transposon directed insertion-site sequencing (TraDIS) data: mapped insertions, insertion index profile, and example gene insertion plots.
Insertions are illustrated on the (A) chromosome and (B) plasmid, respectively. The outermost track displays the length of the ECL8 genome in base pairs. The subsequent two inner tracks correspond to coding sequences (CDSs) on the sense (blue) and antisense (green) DNA strands, respectively. Putative essential CDSs are highlighted in red. The innermost track (black) corresponds to the location and read frequency of transposon sequences mapped successfully to the K. pneumoniae ECL8 genome. Plot generated using DNAPlotter. (C) Gene insertion index scores (IIS) of the K. pneumoniae ECL8 TraDIS library mapped in order of genomic annotation of the K. pneumoniae ECL8 (left) chromosome and (right) plasmid. Example transposon insertion profiles categorized into essential, non-essential, and unclear: (D) an essential gene – bamD, an essential outer membrane factor for β-barrel protein assembly; (E) a non-essential gene – int_A1, a redundant (several copies) integrase required for bacteriophage integration into the host genome; (F) an ‘unclear’ gene – polA, an essential gene in prokaryotes required for DNA replication but showed requirement for the N-terminal 5’–3’ exonuclese domain; and (G) an insertion-free region suggestive of an unannotated open reading frame (ORF). Transposon insertion sites are illustrated in black and capped at a maximum read depth of 1.
-
Figure 1—source data 1
Essential gene table ECL8.
- https://cdn.elifesciences.org/articles/88971/elife-88971-fig1-data1-v1.xlsx
-
Figure 1—source data 2
Insertion-free regions (IFRs) within ECL8 (Luria-Bertani [LB]).
- https://cdn.elifesciences.org/articles/88971/elife-88971-fig1-data2-v1.xlsx
Figure 1—figure supplement 1
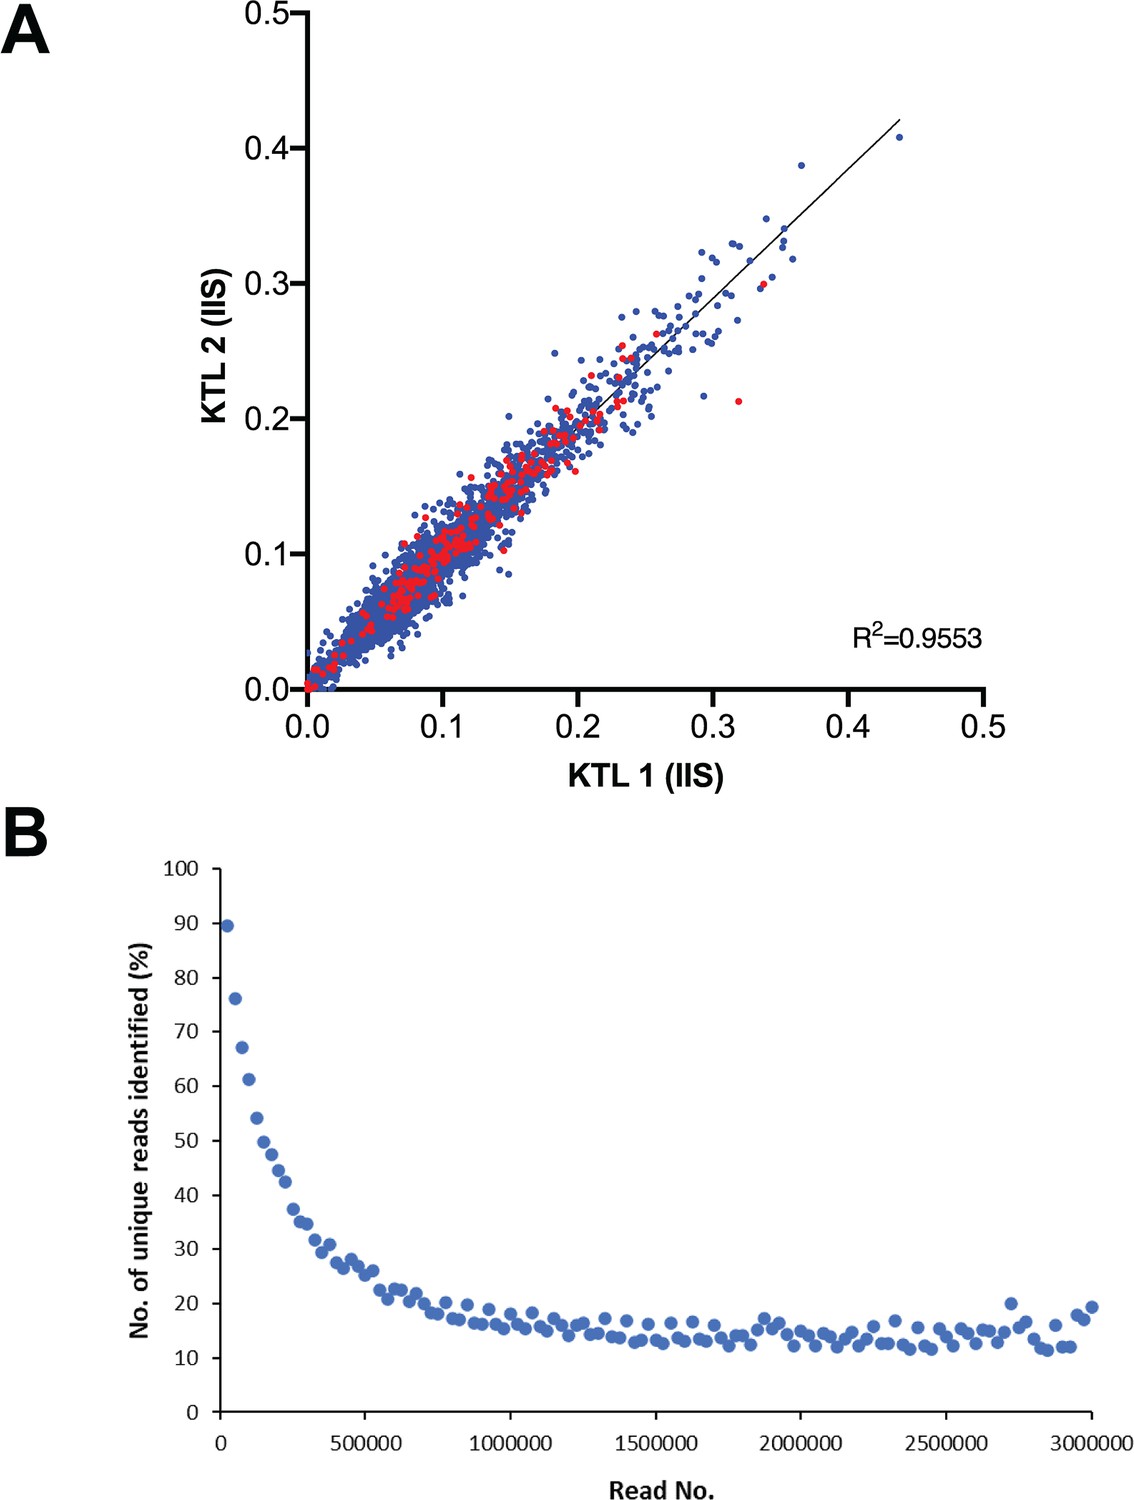
Analysis of TraDIS data.
(A) Pearson correlation coefficient (R2) of gene insertion index scores (IIS) of two sequenced technical replicates of the K. pneumoniae ECL8 transposon directed insertion-site sequencing (TraDIS) library (KTL1 and KTL2). The IIS of genes located on the chromosome and plasmid are highlighted in blue and red, respectively. (B) Number of unique reads identified (%) in the raw fastQ file of the K. pneumoniae TraDIS library in sequentially larger k-mer pools up to 3 million reads. Plot generated using BBTools: bbcountunique.sh in non-cumulative mode (https://jgi.doe.gov/data-and-tools/bbtools/).
Figure 1—figure supplement 2

Sequencing depth of the K. pneumoniae ECL8 plasmid (black) relative to the K. pneumoniae ECL8 chromosome (green).
The plasmid has a read depth 1.33× that of the genome, suggesting the plasmid has a copy number of one. Figure generated using Bandage (v3).
Figure 1—figure supplement 3
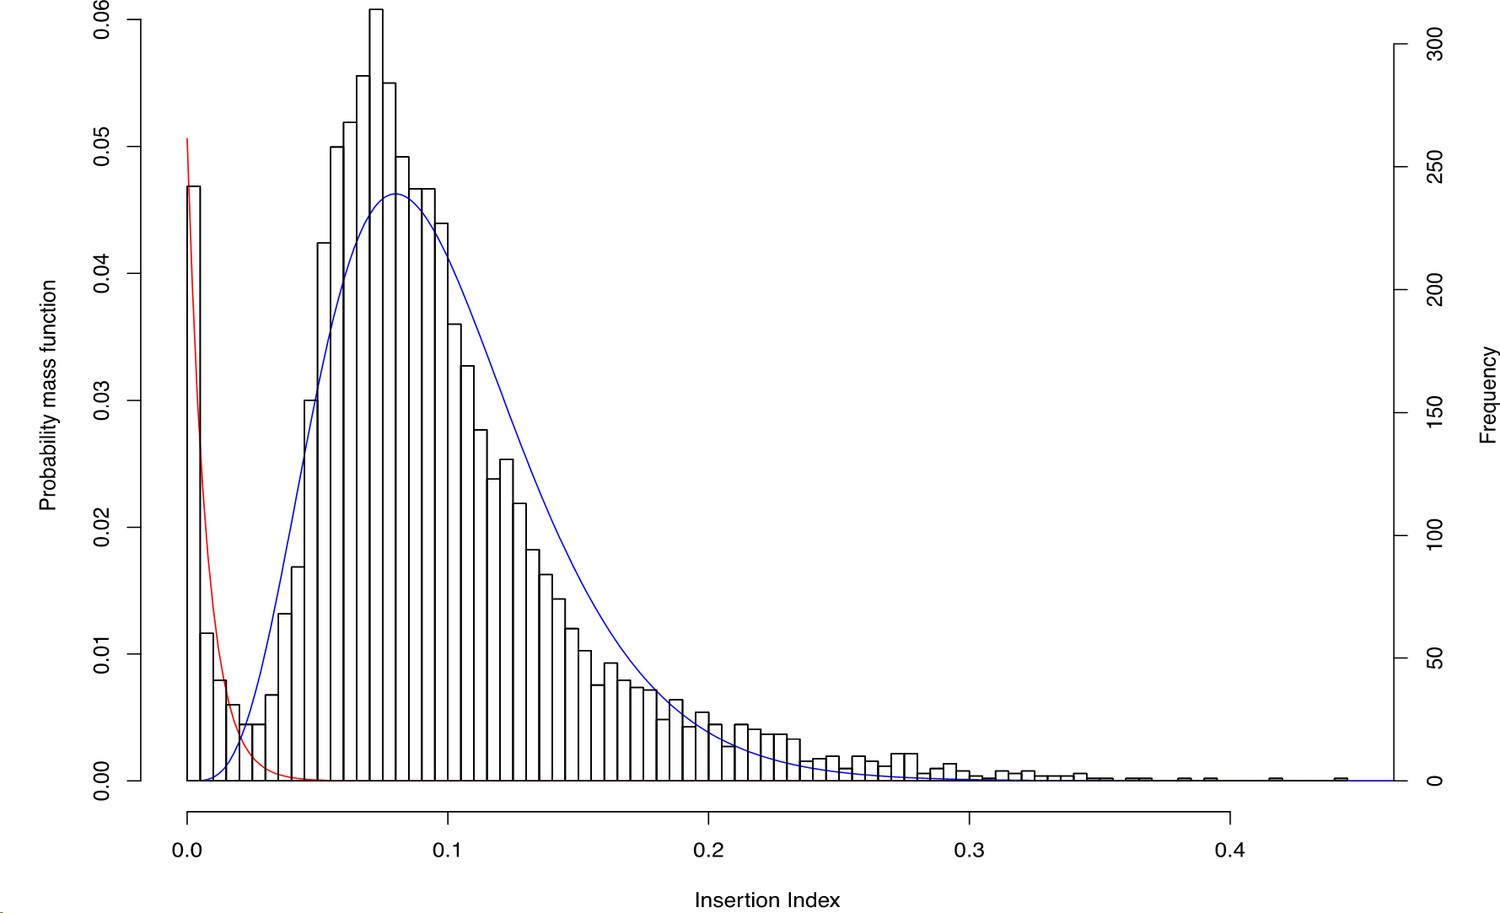
The frequency distribution of insertion index scores.
The insertion index score for each coding sequence (CDS) was calculated as the number of insertions per CDS divided by the CDS length in base pairs to normalize for gene length. An exponential distribution model was fitted to the left mode that includes essential genes, and a gamma distribution model was fitted to the right, non-essential mode (blue). For a given insertion index score, the probability of belonging to each mode was calculated, and the ratio of these values was the log-likelihood score. A gene was classified as essential if its log-likelihood score was less than log2 12 and was therefore 12 times more likely to belong to the red mode than the blue mode.
Figure 1—figure supplement 4
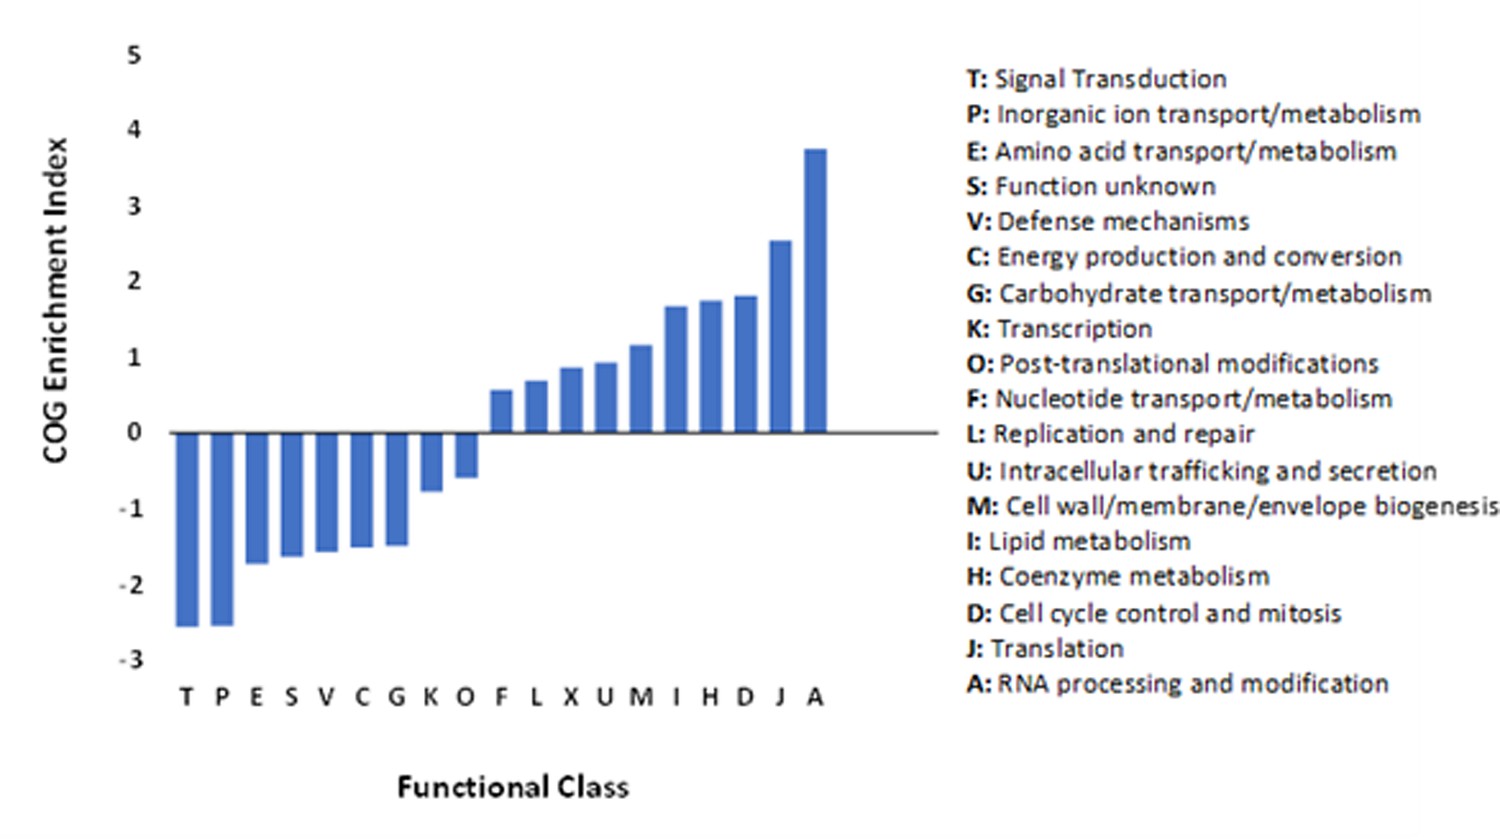
The COG (cluster of orthologous) enrichment index comprising 373 genes classified as essential in K. pneumoniae ECL8.
This index is calculated as the percentage of the essential genome made up of a COG divided by the percentage of the whole genome made up by the same COG. The log2 fold enrichment is displayed, and significant differences were calculated using the two-tailed Fisher’s exact test. Annotations were computed using eggnog-mapper based on eggNOG orthology data (Holt et al., 2015).
Figure 1—figure supplement 5
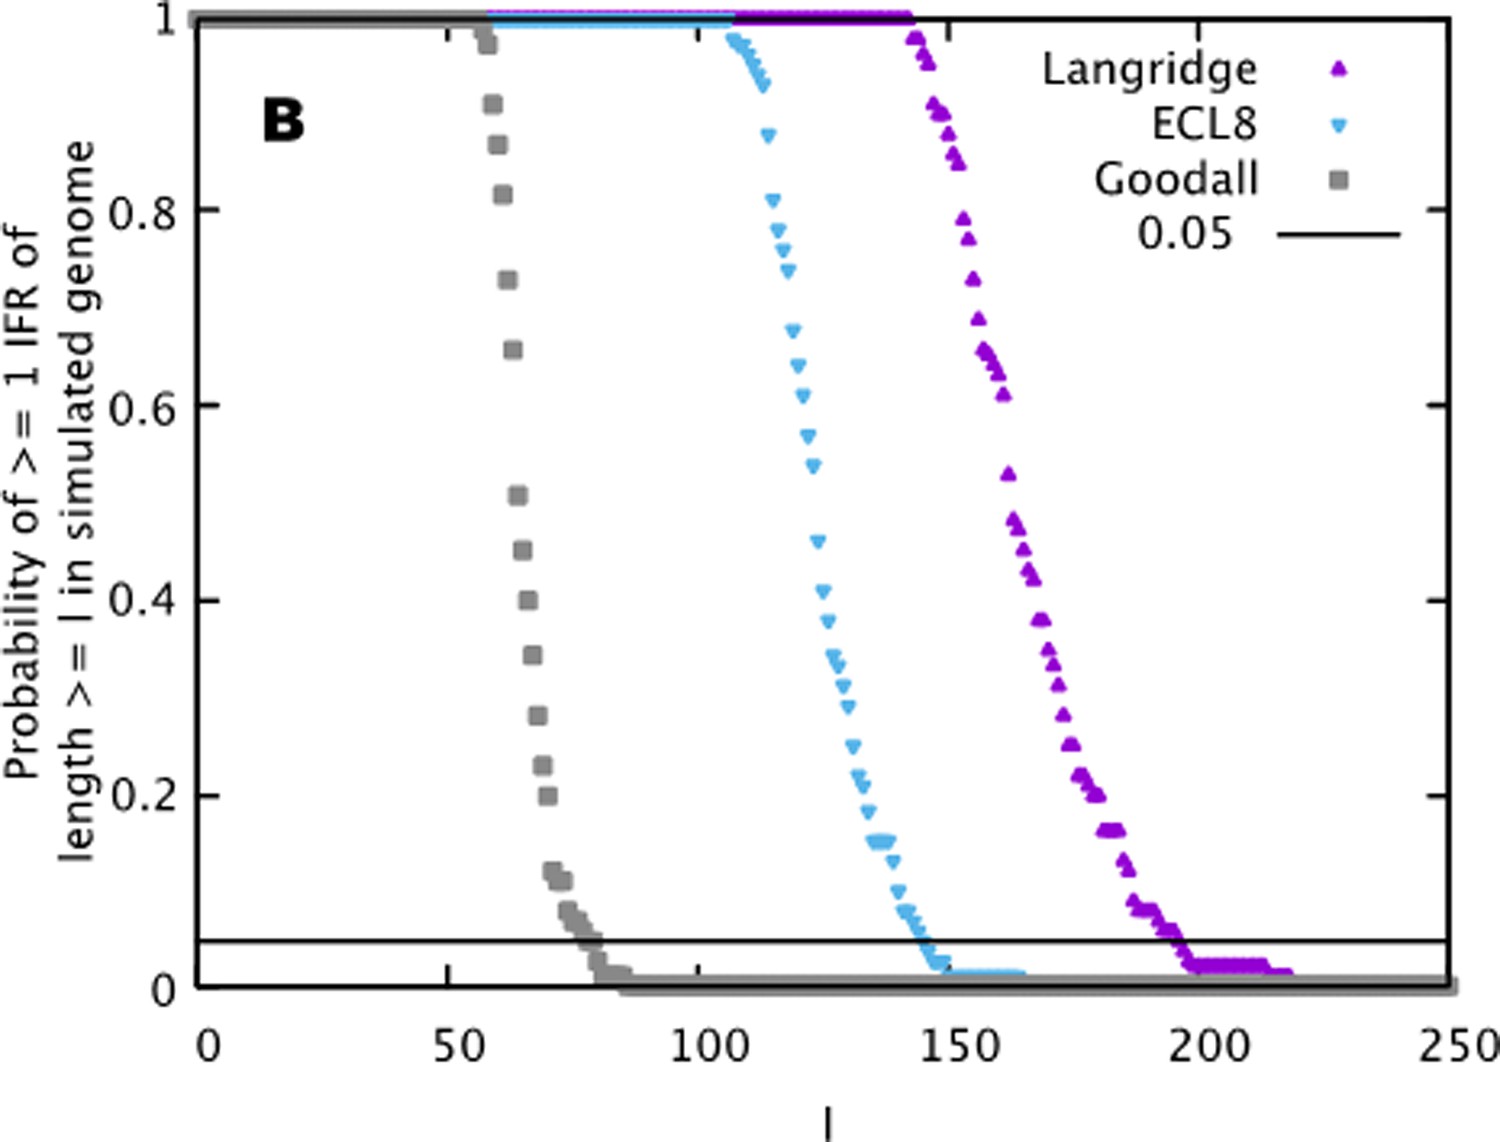
Mathematical simulation (105 instances) of random transposon insertion events under the null model of random insertion previously described (Podschun and Ullmann, 1998).
The probability of at least one insertion-free region (IFR) of length (l) occurring in a genome of 5.3 Mb containing 554,834 transposon insertions (blue). Genome length and no. of genome-wide insertions from transposon directed insertion-site sequencing (TraDIS) studies by Langridge et al., 2009 and Goodall et al., 2018, plotted for comparison (Podschun and Ullmann, 1998; Ko et al., 2002).
Figure 1—figure supplement 6
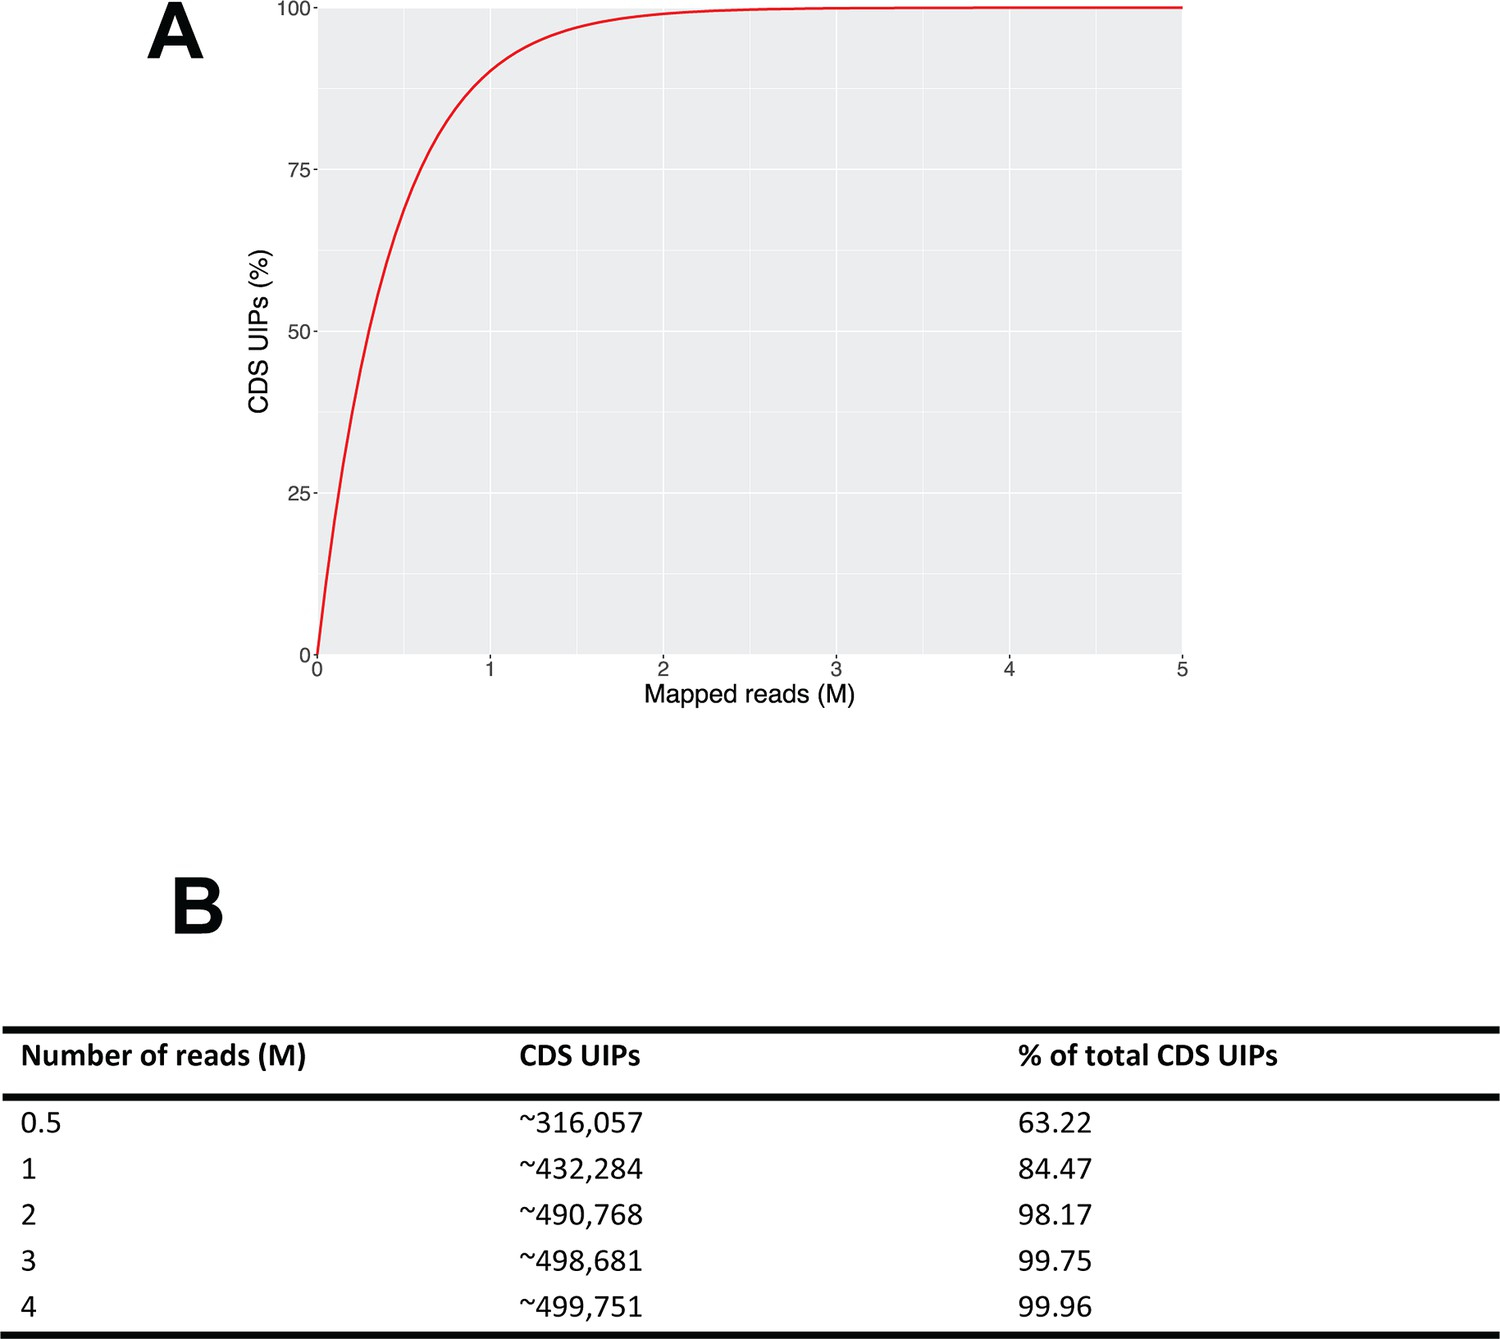
Sequencing depth required to sample a given proportion of the K. pneumoniae transposon directed insertion-site sequencing (TraDIS) library.
(A) The following equation: was applied to calculate the approximate number of sequence reads required to sample full library diversity, i.e., 100% of unique insertion points (UIPs). UIPs = unique insertion points, n=number of mapped reads in millions (M), and s=sample size, i.e., 499,919 coding sequence (CDS) UIPs. (B) The approximate number of CDS UIPs represented by a given number of sequence reads (M) is shown as a percentage of the total CDS UIPs, i.e., 499,919.
Figure 2
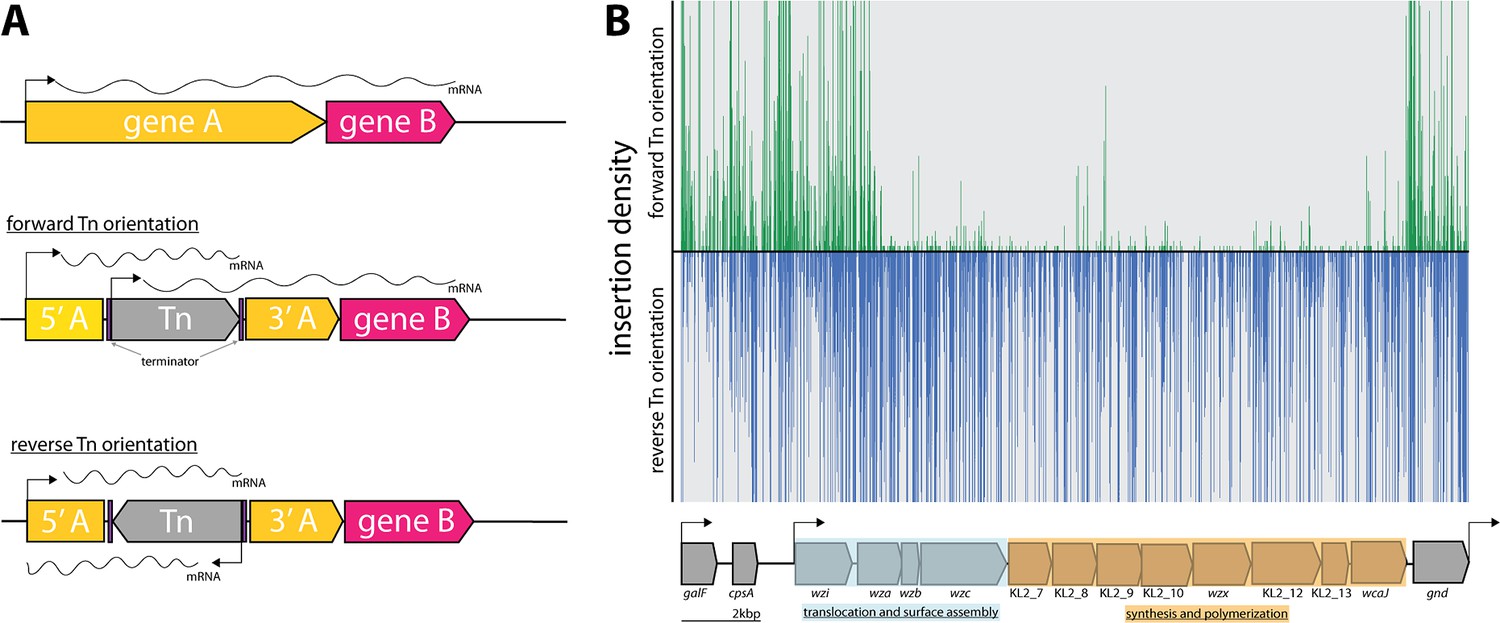
Directional insertion bias of transposon (Tn) into the capsular polysaccharide (cps) operon.
(A) Schematic representing the Tn orientation and effect on downstream transcription. The utilized Tn transposon is flanked by terminator sequences (purple) and is shown inserted in gene A (yellow) of a hypothetical two-gene transcription unit AB in the forward or reverse orientation. In the forward orientation transcription of gene B (pink) is expected to occur from the promoters of 5’ of gene A or the internal Tn5 but polycistronic mRNA differs in length due to the attenuation by the terminators. (B) Transposon insertions mapping to the K2 capsular operon of K. pneumoniae ECL8. Transposon insertions are configured in the forward orientation (green), and reverse orientation (blue) and insertion densities are capped at a maximum read depth of 50. The operon structure of the K2 capsular genes consisting of three promoters driving the expression of three unidirectional polycistronic transcripts is depicted.
Figure 3
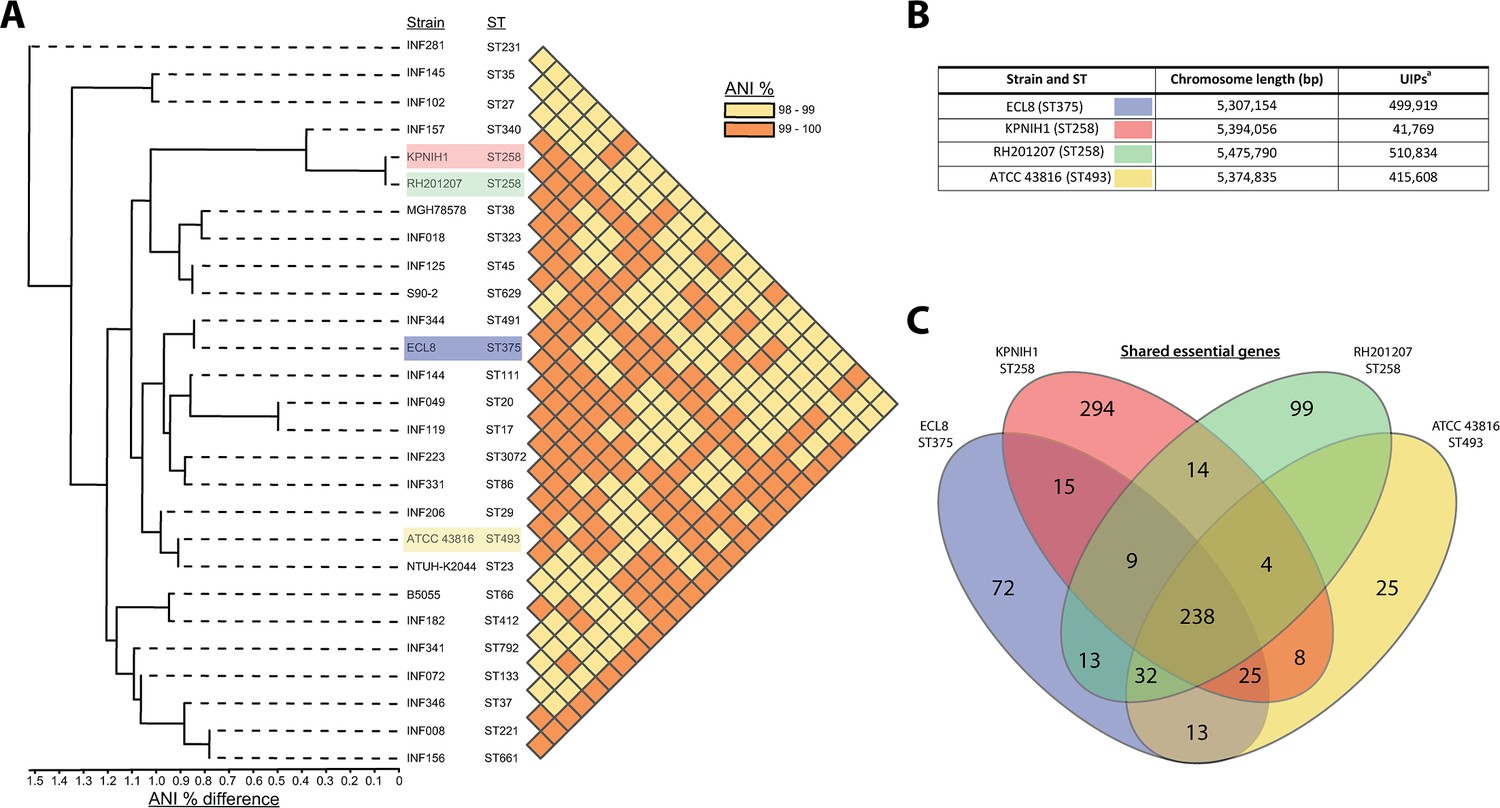
Phylogenetic context of K. pneumoniae ECL8 and comparison to previously reported essential gene lists.
(A) Phylogenetic tree and average nucleotide identity (ANI) analysis generated using the Integrated Prokaryotes Genome and Pan-genome Analysis (IPGA) webserver demonstrating the phylogenetic context of K. pneumoniae ECL8 compared to other previously published K. pneumoniae strains or isolates belonging to ‘21 “common” lineages’ of nosocomial origin by other groups. The ANI is a similarity index metric between a given pair of genomes applicable to prokaryotic organisms. A cutoff score of >95% typically indicates they belong to the same species. (B) Tabular comparison of K. pneumoniae strains listing genome size and number of unique insertion points mapped (C) Venn diagram depicting the shared and unique genes required for growth in nutrient-rich media (i.e. Luria-Bertani [LB]). Complete list of genomes, gene comparisons, and exclusions lists can be found in Figure 3—source data 1.
-
Figure 3—source data 1
Essential gene comparison against ECL8.
- https://cdn.elifesciences.org/articles/88971/elife-88971-fig3-data1-v1.xlsx
Figure 4 with 1 supplement
Overview and validation of ECL8 fitness factors for growth in pooled human urine.
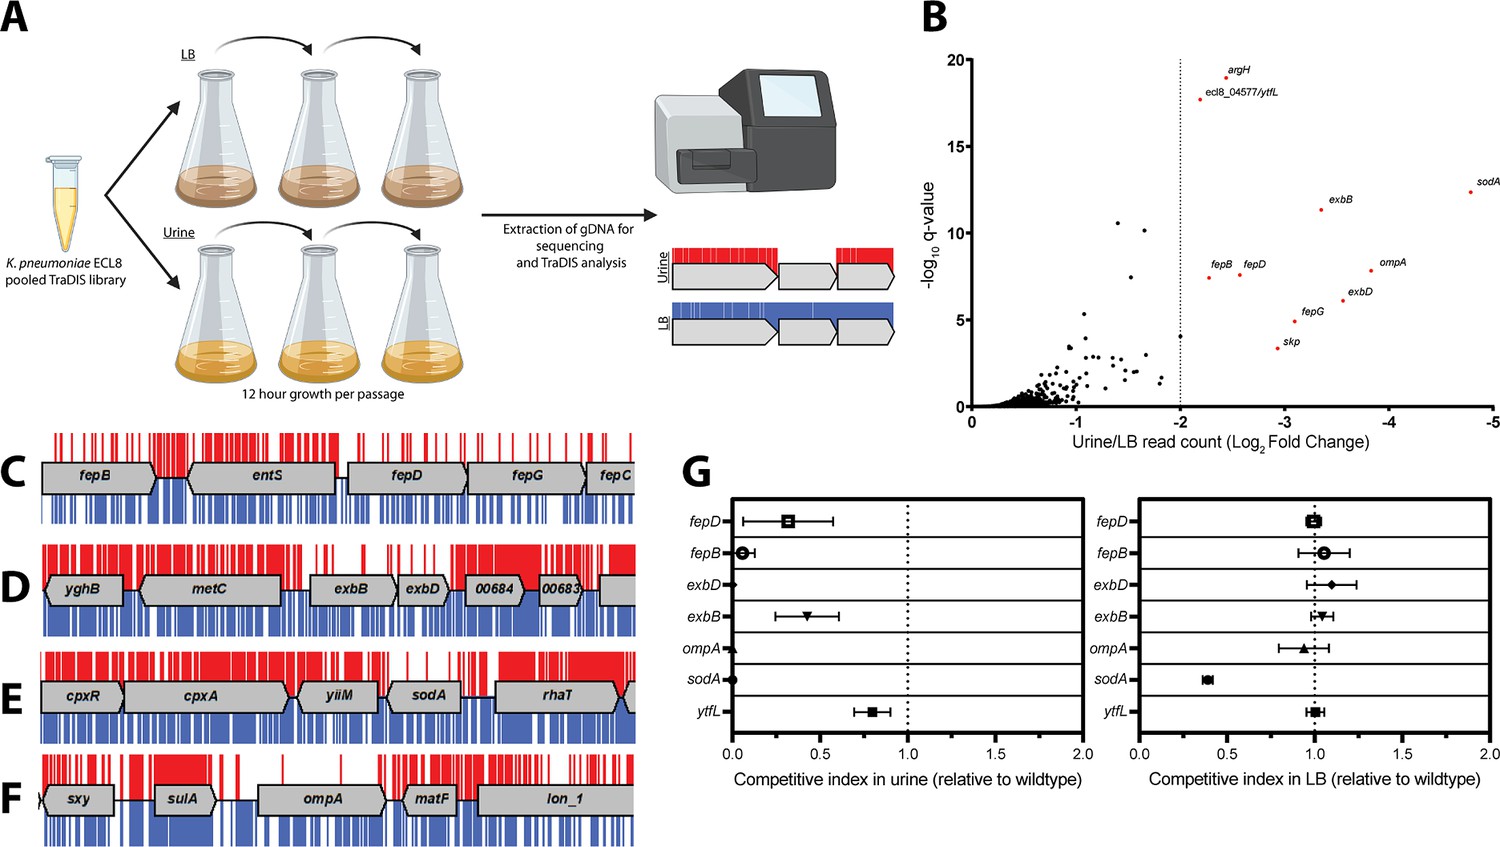
(A) Schematic of the experimental design used to identify genes that provide a fitness advantage for K. pneumoniae ECL8 growth in pooled human urine. The K. pneumoniae ECL8 library was inoculated into either 50 mL of Luria-Bertani (LB) or 50 mL of urine and incubated at 37°C with 180 RPM shaking for 12 hr. The library was passaged into 50 mL of fresh LB or pooled human urine at an initial OD600 of 0.05 two subsequent times. A 1 mL sample normalized to an OD600 of 1 from each culture was processed for genome extraction and multiplexed sequencing using an Illumina MiSeq. (B) Log2 fold change (log2FC) of the read count for each K. pneumoniae ECL8 gene when passaged in urine relative to an LB control. Genes highlighted in red satisfy a stringent applied threshold (log2FC>–2, Q-value≤0.05). The Q-value is the p-value that has been adjusted for the false discovery rate for each gene. For brevity, only genes with a log2FC≥0 are illustrated. Selected transposon insertion profiles of genes identified as advantageous for growth in urine: (C) fepB, fepD, fepG, (D) exbB, exbD, (E) sodA, and (F) ompA. These genes exhibited a significant loss of transposon insertions following growth in urine (red) in comparison to LB broth (blue). A 5 kb genomic region including the gene is illustrated. Reads are capped at a maximum depth of 1. (G) The fitness of gene replacement mutants relative to wild-type (WT) K. pneumoniae ECL8 in either LB medium or urine. The relative competitive index of single-gene replacement mutants after 12 hr passages 3× in either LB medium or urine. A relative fitness of one would indicate comparable fitness to WT. The mean (n=3) is plotted (±1 SD).
-
Figure 4—source data 1
Essential gene table ECL8 (urine).
- https://cdn.elifesciences.org/articles/88971/elife-88971-fig4-data1-v1.xlsx
Figure 4—figure supplement 1
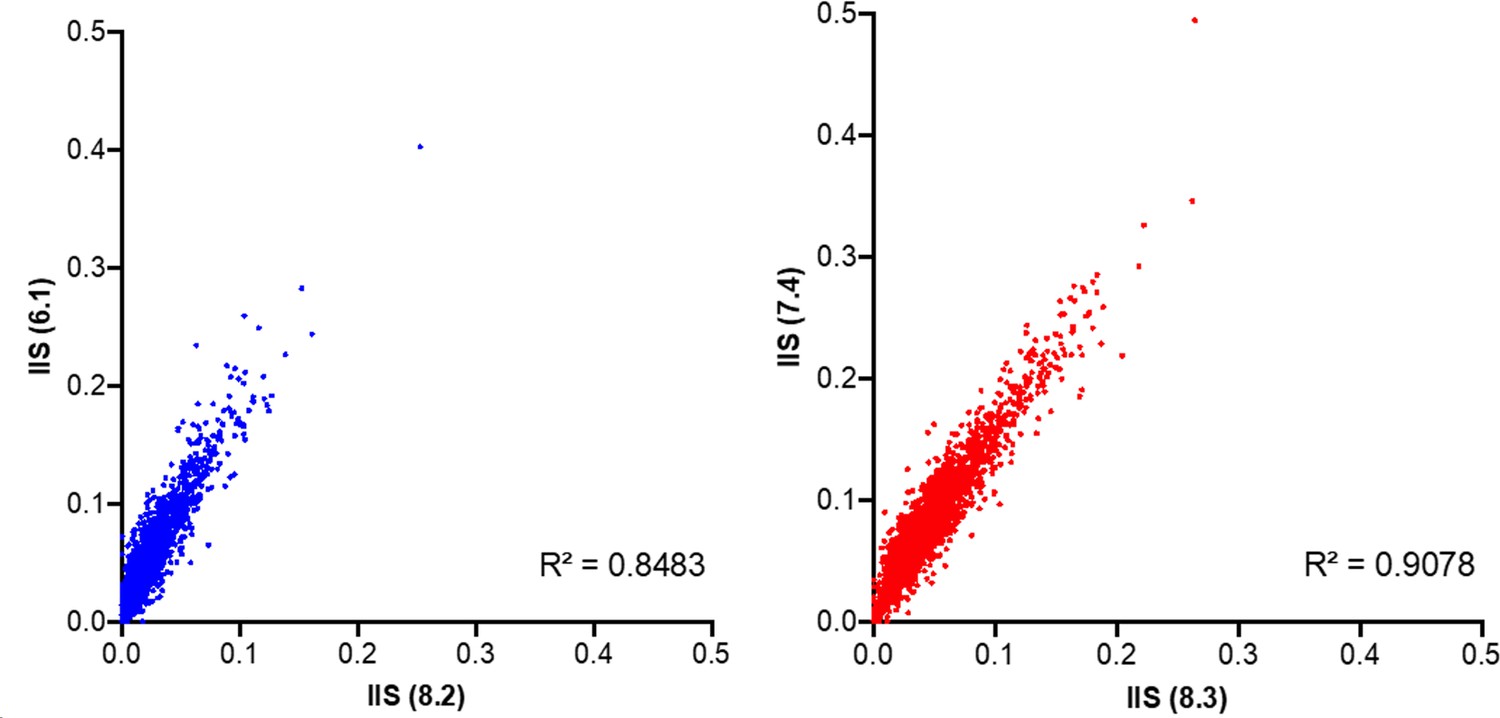
The Pearson correlation coefficient (R2) of gene insertion index scores (IIS) for two sequenced biological replicates of the K. pneumoniae ECL8 transposon directed insertion-site sequencing (TraDIS) library following three 12 hr passages in (blue) Luria-Bertani (LB) broth, or (red) pooled human urine.
The inline barcode identifiers used to demultiplex and distinguish replicates are highlighted in brackets.
Figure 5
Growth of the K. pneumoniae transposon directed insertion-site sequencing (TraDIS) library following passaging in Luria-Bertani (LB) and urine and schematic diagrams of enterobactin synthesis, secretion, and uptake.
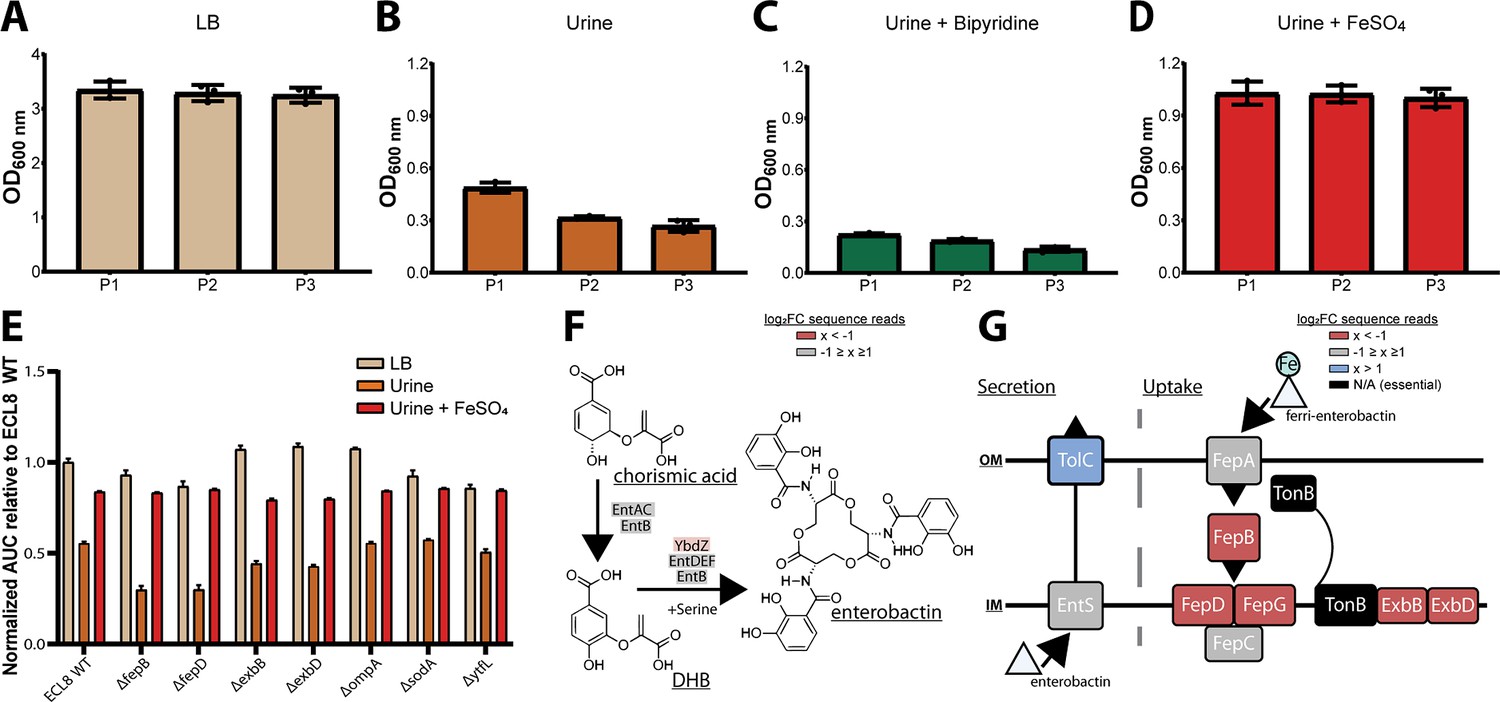
The OD600 of the K. pneumoniae TraDIS library following 12 hr of growth (P1) and two sequential 12 hr passages (P2 and P3). The library was passaged into fresh medium (A) LB or (B) urine to an initial OD600 of 0.05. To determine the effect of iron supplementation and depletion, urine was supplemented with exogenous iron (C) 100 μM FeSO4 or an iron chelator (D) 100 μM 2,2-dipyridyl. The average OD600 of three biological replicates for each time point is plotted (±) 1 SD. (E) Area under curve comparative analysis (OD600 vs. time) of K. pneumoniae ECL8 and mutants grown in LB, urine, or urine supplemented with 100 μM FeSO4 grown for 16 hr with 180 RPM shaking. The average of three biological replicates is plotted for each condition with error bars representing SD. (F) Simplified schematic of the enterobactin synthesis pathway. YbdZ, a co-factor of EntF for the terminal steps for enterobactin synthesis, depicted in light red had a log2 fold change (log2FC) sequence read value of –1.58, suggesting this gene conferred an overall fitness advantage for growth in urine. (G) Schematic representation of enterobactin secretion and uptake. The TonB transport system is present in Gram-negative bacteria and is required to transport Fe-bound enterobactin through the outer (OM) and inner membrane (IM) to the cytosol where it can be utilized. Based on log2FC sequence read value, loss of TolC (blue) was beneficial for growth, relative to an LB control. Loss of proteins, colored in red, had log2FC sequence read values <–2 suggesting they confer a fitness advantage for growth in urine. Proteins depicted in gray were genes that had log2FC values that ranged from –1 to 1 exposed to urine relative to an LB control. Genes depicted in black were essential and had no determinable log2FC value.
Figure 6 with 2 supplements
Overview and validation of ECL8 genes that increase resistance to complement-mediated killing.
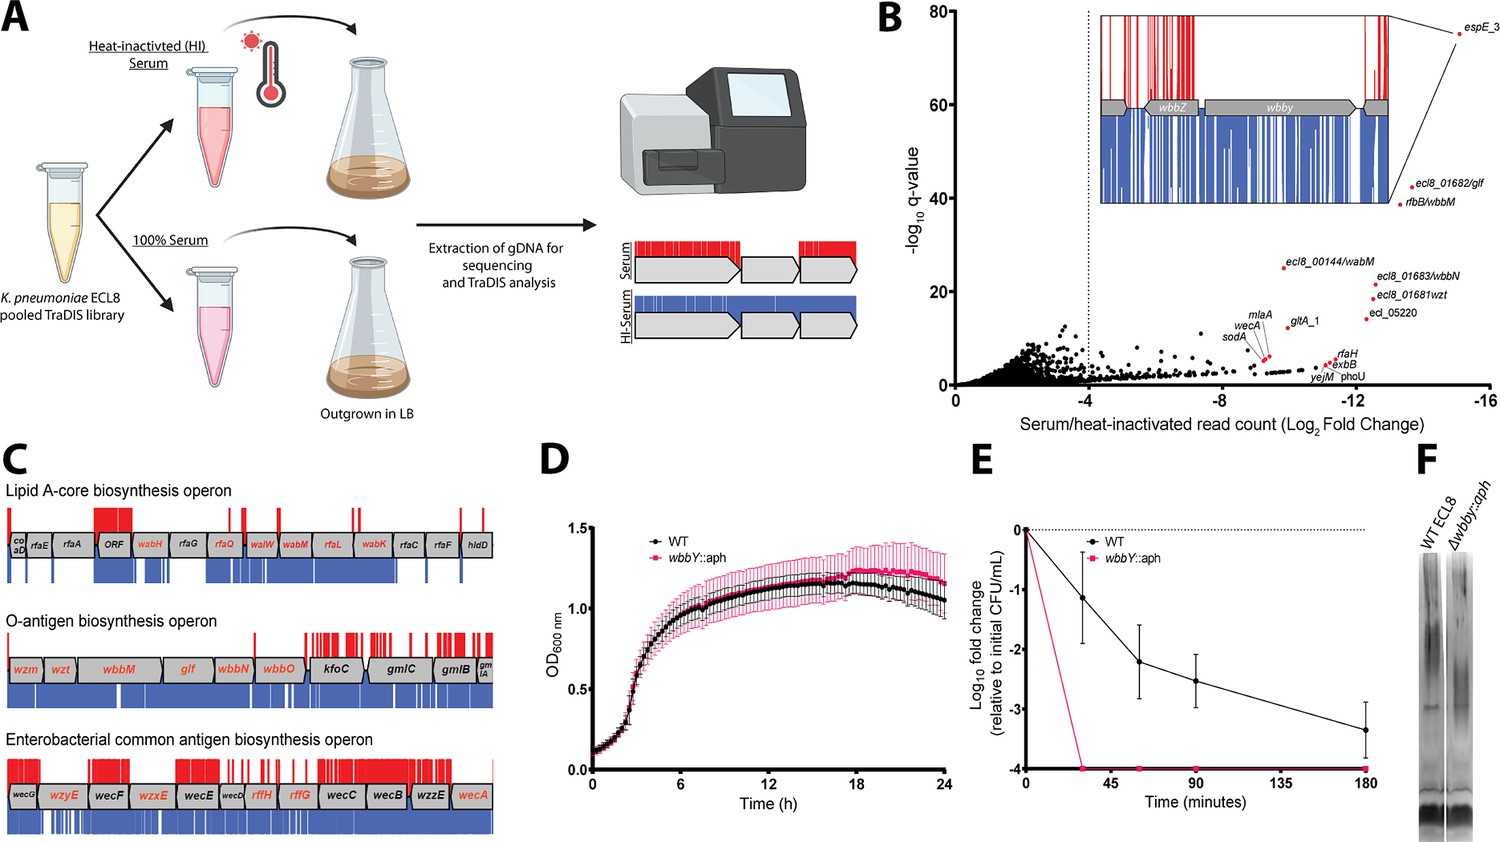
(A) The experimental methodology utilized for screening the transposon directed insertion-site sequencing (TraDIS) library in human serum and a heat-inactivated serum control. K. pneumoniae ECL8 (2×10⁸ cells) of the mutant library was inoculated into either 1 mL of human serum or 1 mL of heat-inactivated human serum and incubated for 90 min. Following exposure to serum, cells were grown to an OD600 of 1 in Luria-Bertani (LB) medium to enrich for viable mutants. A 1 mL sample normalized to an OD600 of 1 from each culture was processed for genome extraction and multiplexed sequencing using an Illumina MiSeq. (B) Log2FC for each gene of the K. pneumoniae ECL8 TraDIS library when incubated in pooled human serum relative to a heat-inactivated serum control. Selected genes highlighted in red are among the total of 144 genes that satisfy a stringent applied threshold (log2FC≥–4, Q-value≤0.05). For brevity, only genes with a log2FC≥0 are illustrated. Inset: transposon insertion profile of wbbY, gene with the highest fold log2FC, flanked by wbbZ and a transposable element at its 3’. Transposon insertions following exposure to serum and a heat-inactivated serum control are illustrated in red and blue, respectively. Transposon reads have been capped at a maximum of 10. (C) Transposon insertion profiles of genes within the: lipopolysaccharide (LPS), O-antigen, and the enterobacterial common antigen (ECA) biosynthesis operons. Genes in red font had a significantly (log2FC≥–4, Q-value≤0.05) decreased fitness when disrupted with a transposon following exposure to serum for 90 min (red), relative to a heat-inactivated serum control (blue). Operons are not drawn to scale and reads capped at a maximum read depth of 1. (D) Growth profile of wild-type (WT) K. pneumoniae ECL8 and Δwbby::aph in LB broth. Mean (n=3) is plotted (±1 SD). (E) Serum killing assay of WT K. pneumoniae ECL8 and Δwbby::aph. Mean is plotted (±1 SD). (F) LPS profiles of WT K. pneumoniae ECL8 and Δwbby::aph. Overnight cultures of each strain were normalized to an OD600 of 1. The LPS was separated on 4–12% Bis-Tris gels and was visualized by silver staining using the SilverQuest kit (Invitrogen).
-
Figure 6—source data 1
Essential gene table ECL8 (serum).
- https://cdn.elifesciences.org/articles/88971/elife-88971-fig6-data1-v1.xlsx
Figure 6—figure supplement 1
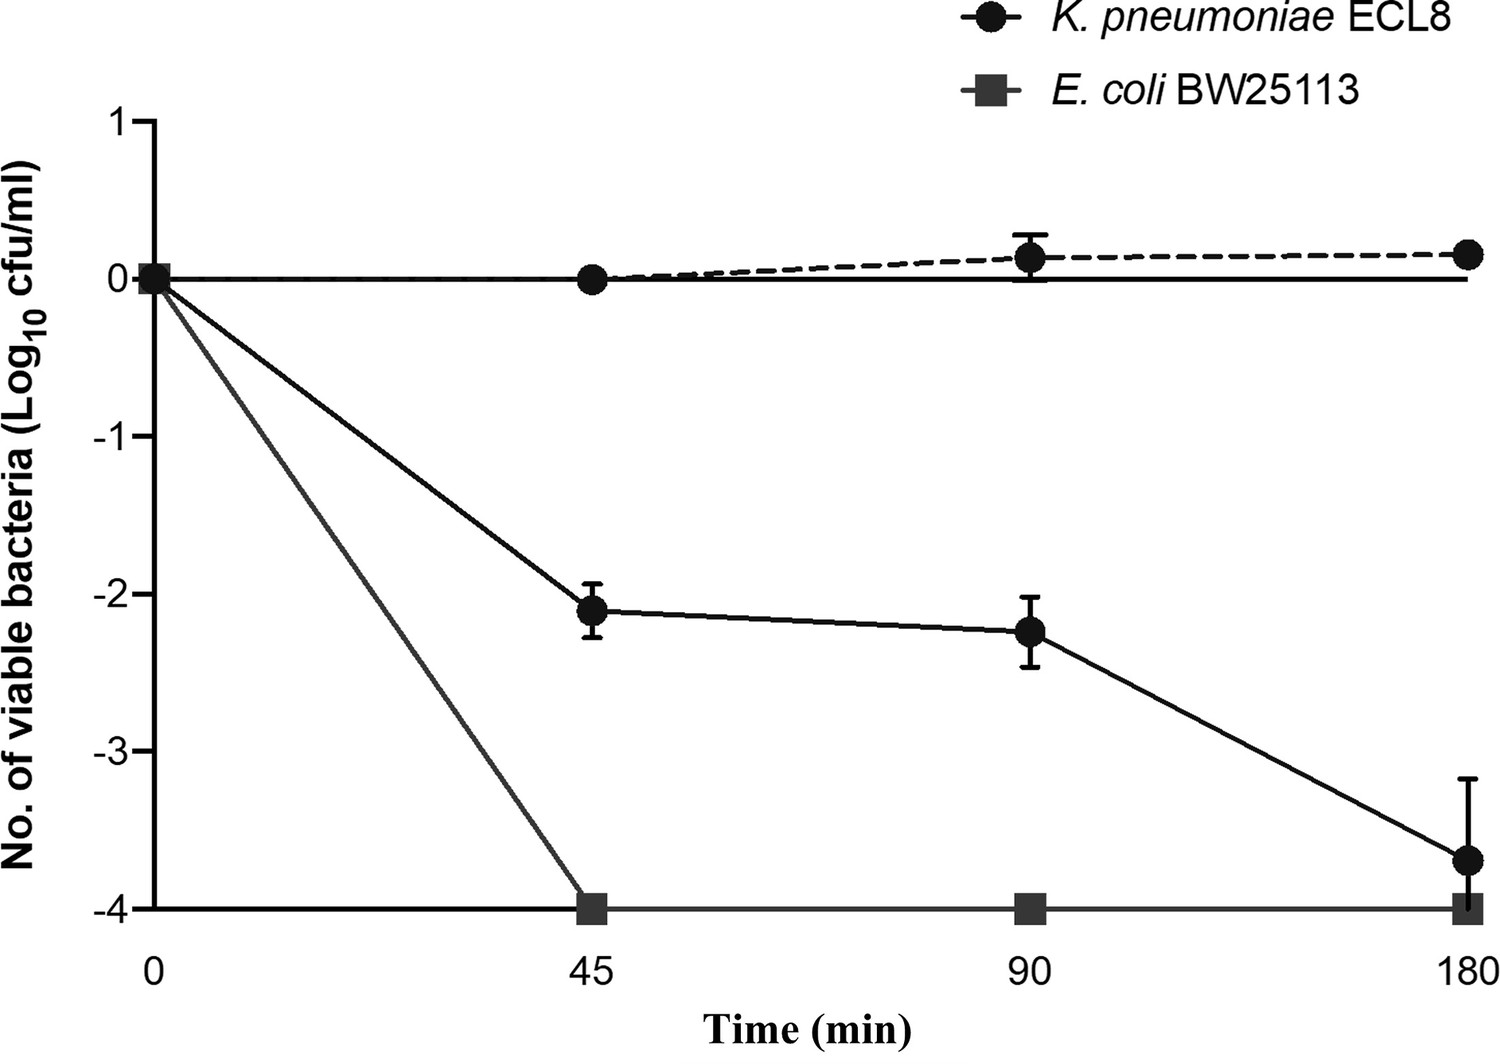
Serum killing assay of K. pneumoniae ECL8 and E. coli BW25113.
A sample of 2×10⁸ bacterial cells were incubated in 100 μL of human serum (solid line) or heat-inactivated human serum (dashed line) for 180 min. Viable bacterial numbers (CFU/mL) were sampled at regular time points by plating onto Luria-Bertani (LB) agar, overnight incubation at 37°C and subsequent counting of the colonies. The log10 fold change in viable cell number was measured. E. coli BW25113 lacks O-antigen and was used as a serum-sensitive control. The mean of three biological replicates is shown ±1 SD.
Figure 6—figure supplement 2
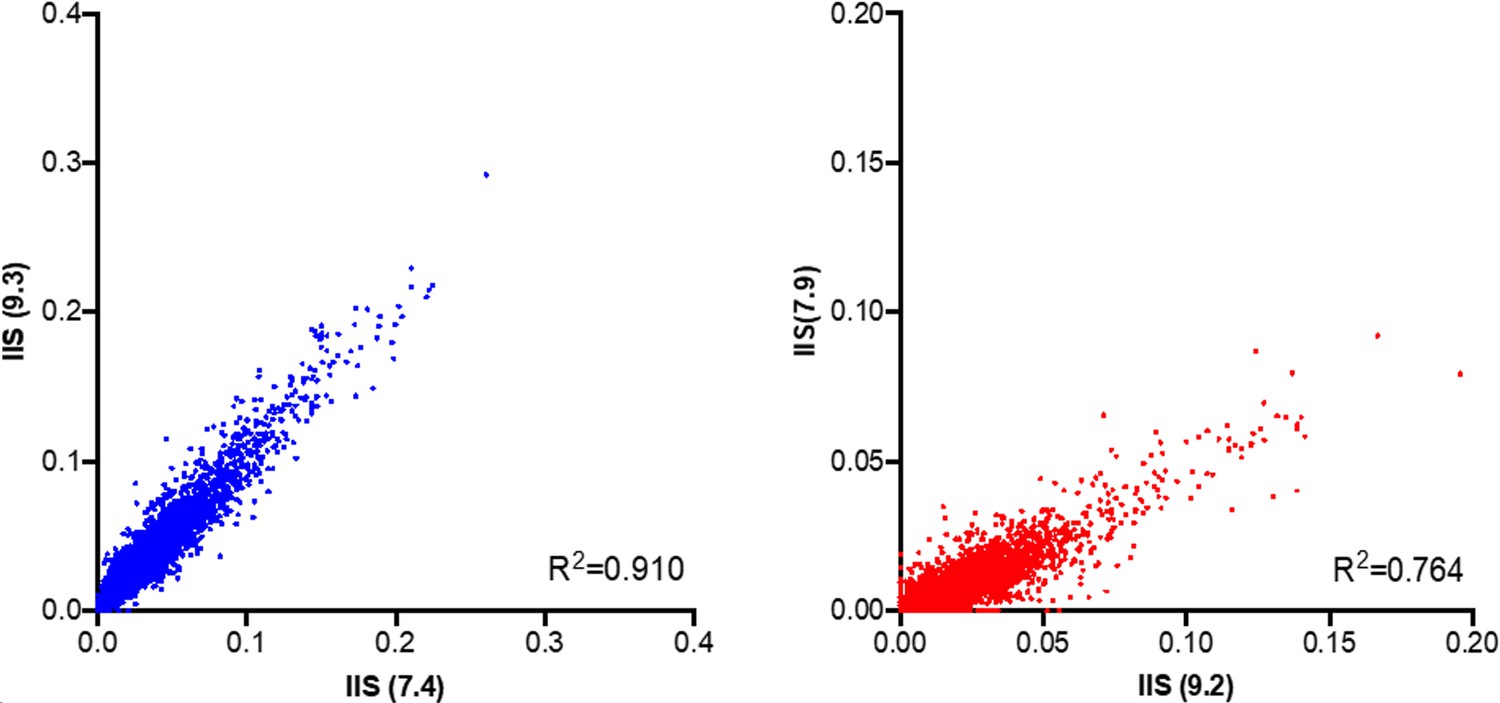
The Pearson correlation coefficient (R2) of gene insertion index scores (IIS) for two sequenced biological replicates of the K. pneumoniae ECL8 transposon directed insertion-site sequencing (TraDIS) library following 90 min exposure to (blue) heat-inactivated serum or (red) serum.
The inline barcodes used to demultiplex and distinguish replicates are given in brackets ().
Figure 7 with 3 supplements
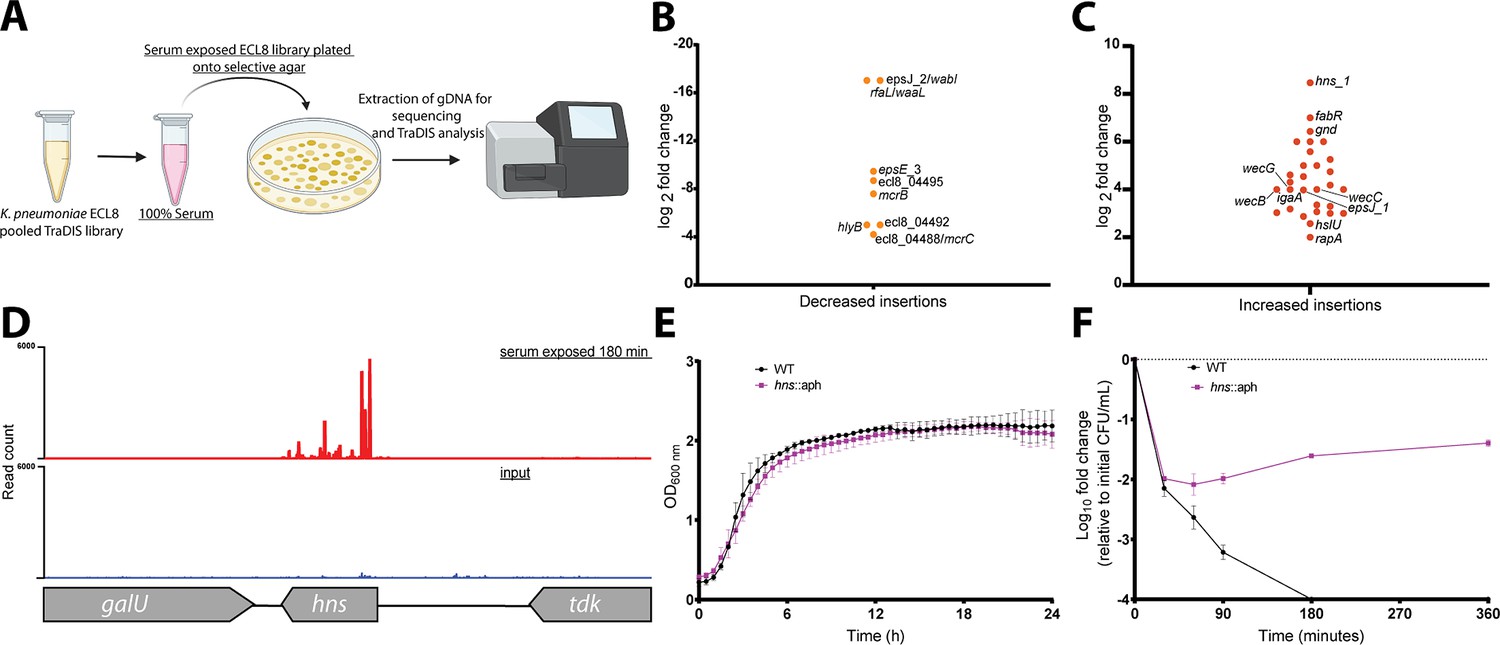
Overview and validation of ECL8 fitness factors for survival in pooled human serum.
(A) The experimental methodology utilized for screening the transposon directed insertion-site sequencing (TraDIS) library to identify genetic factors that increase resistance to human serum. K. pneumoniae ECL8 (2×10⁸ cells) of the mutant library was inoculated into 1 mL of human serum and incubated for 180 min and compared to before serum exposure input control. The output pool was washed with PBS and plated onto Luria-Bertani (LB) agar supplemented with kanamycin. Following overnight growth, ~150,000 colonies were recovered and pooled for sequencing. Comparative analysis using AlbaTraDIS software depicting genes with (B) decreased insertions suggesting a loss of fitness or (C) increased insertions suggesting a gain of fitness to serum exposure. (D) Transposon and read count insertion profiles of hns locus: red illustrating pooled mutant serum exposed for 180 min and blue denoting the before serum exposure input control. (E) Growth profile of wild-type (WT) K. pneumoniae ECL8 and Δhns::aph in LB broth. Mean (n=3) is plotted (±1 SD), where n=3. (F) Serum killing assay of WT K. pneumoniae ECL8 and Δhns::aph. Mean is plotted (±1 SD), where n=3.
-
Figure 7—source data 1
Kaptive webserver results – ECL8 O-antigen K-antigen.
- https://cdn.elifesciences.org/articles/88971/elife-88971-fig7-data1-v1.xlsx
-
Figure 7—source data 2
AlbaTraDIS ECL8 180 serum exposure results.
- https://cdn.elifesciences.org/articles/88971/elife-88971-fig7-data2-v1.xlsx
Figure 7—figure supplement 1

Pearson correlation coefficient (R2) of two biological replicates from the output transposon directed insertion-site sequencing (TraDIS) library following exposure to human serum for 180 min.
Figure 7—figure supplement 2
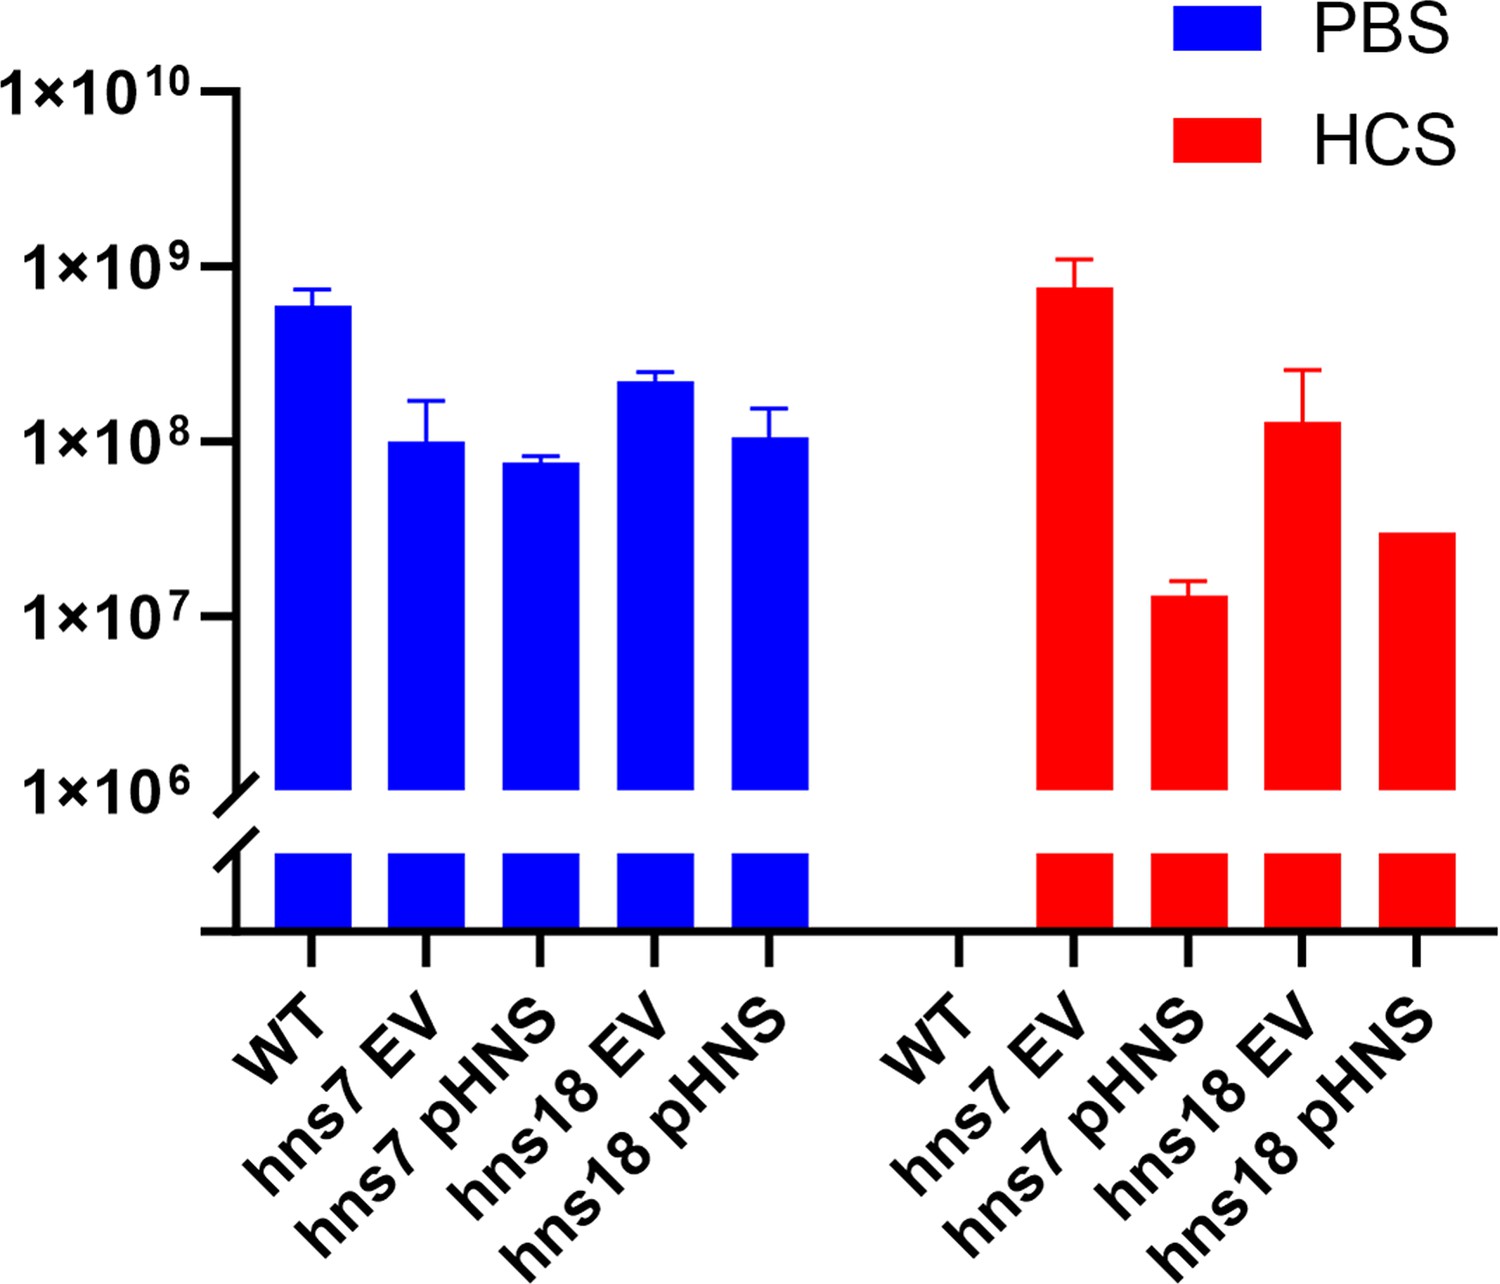
Serum killing assay of wild-type (WT) K. pneumoniae ECL8, hns7::Tn5, and hns18::Tn5.
Overnight cultures of bacterial cells were incubated in a 1:1 ratio (2×10⁸ cells:human serum) in a final volume of 100 μL. Viable bacterial numbers (CFU/mL) at 360 min time point was calculated by plating onto Luria-Bertani (LB) agar, overnight incubation at 37°C, and subsequent counting of the colonies with a PBS control performed in parallel. The mean of three biological replicates is shown ±1 SD.
Figure 7—figure supplement 3
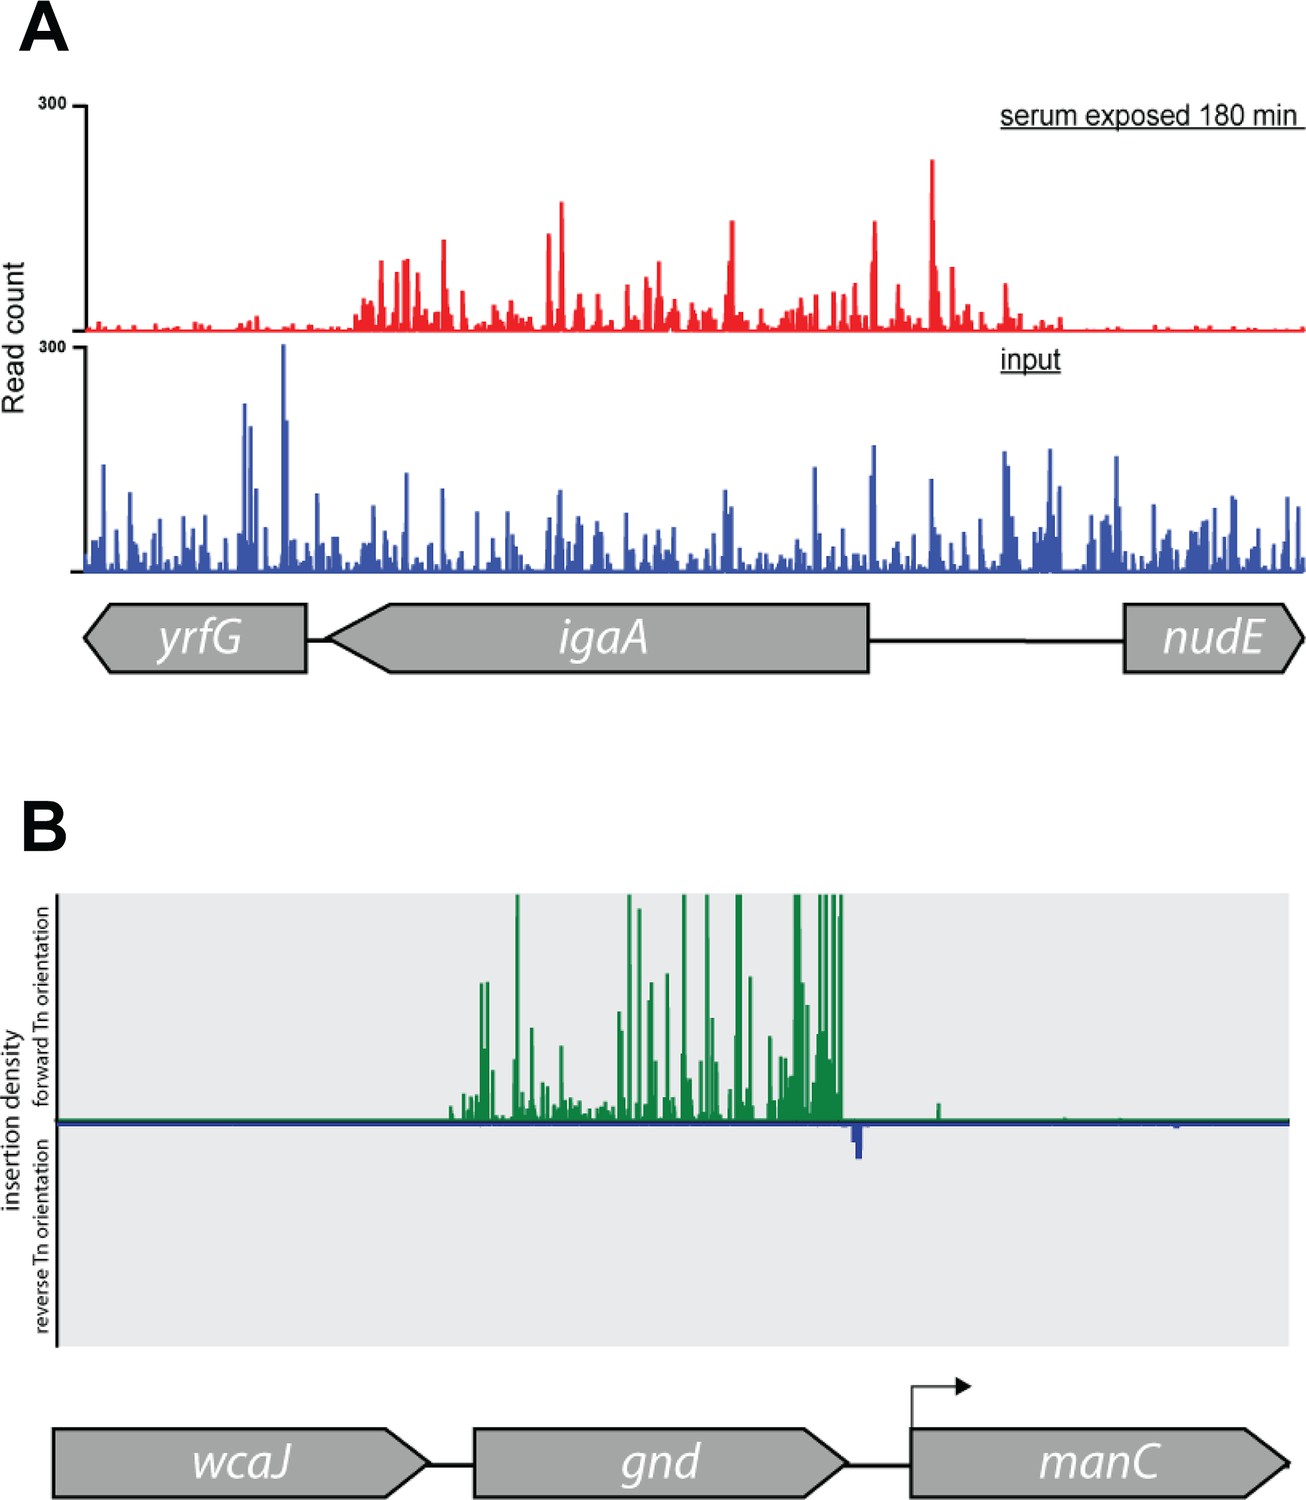
TraDIS insertion profiles for mutant conferring increased resistance to serum killing.
(A) Transposon and read count insertion profiles of hns locus: red illustrating pooled mutant serum exposed for 180 min and blue denoting the before serum exposure input control. (B) Directional insertion bias of transposon (Tn) into gnd. Transposon insertions configured in the forward orientation (green), reverse orientation (blue). Transposon insertion densities are capped at a maximum read depth of 2000. Below – genomic context of gnd with a putative promoter for manC driving the transcriptional unit (rfb cluster) for O-antigen biosynthesis.
Tables
Table 1
Summary of transposon-containing sequence reads and unique insertion points (UIPs) mapped to the K. pneumoniae ECL8.
| Sample | Mapped reads after QC | Genome-wide UIPs | CDS UIPs | Pearson correlation of replicates |
|---|---|---|---|---|
| ECL8 Input libraries (LB) | ||||
| KTL1 | 5,573,710 | 409,069 | 367,230 | Figure 1—figure supplement 1A |
| KTL2 | 2,854,389 | 400,915 | 361,272 | |
| KTL (combined) | 8,429,782 | 554,834 | 499,919 | |
| Urine output libraries | ||||
| LB | 4,324,125 | 4,324,125 | 403,381 | Figure 4—figure supplement 1 |
| Urine | 4,839,277 | 4,839,277 | 389,251 | |
| Serum output libraries | ||||
| Serum | 4,729,032 | 115,328 | 101,348 | Figure 6—figure supplement 2 |
| Heat-inactivated serum | 3,565,433 | 284,761 | 254,735 | |
| 180 min serum exposed | 1,481,732 | 133,790 | 121,316 | Figure 7—figure supplement 1 |
Table 2
K. pneumoniae ECL8 plasmid-borne genes computationally deemed essential.
| Locus tag | Gene | Function* |
|---|---|---|
| ecl8_05075 | repB_1 | RCR (rolling circle replication) plasmid protein |
| ecl8_05092 | – | SidC homolog |
| ecl8_05094 | – | DUF2509 family protein |
| ecl8_05096 | – | NB-ARC domain-containing protein |
| ecl8_05104 | rcsA_2 | DNA-binding transcriptional activator RcsA |
| ecl8_05105 | yedA_2 | Putative transporter |
| ecl8_05106 | – | DUF2695 domain-containing protein |
| ecl8_05170 | – | DUF305 domain-containing protein |
| ecl8_05205 | – | NADPH-dependent preQ0 reductase |
| ecl8_05272 | – | Transposase |
| ecl8_05279 | sopB | Control of plasmid partitioning |
-
*
Function derived from the top hit using NCBI blastN (https://blast.ncbi.nlm.nih.gov/Blast.cgi).
Additional files
-
Supplementary file 1
Strains, plasmids, and primers used in this study.
(A) Bacterial strains and plasmids utilized in this study. (B) Primer nucleotide sequences for construction of K. pneumoniae chromosomal mutant strains. (C) Primer nucleotide sequences for enrichment of the transposon junction (TKK_F and TKK_R) and the introduction of an inline barcode for multiplexed sequencing (TKK 6, 7, 8, 9).
- https://cdn.elifesciences.org/articles/88971/elife-88971-supp1-v1.docx
-
MDAR checklist
- https://cdn.elifesciences.org/articles/88971/elife-88971-mdarchecklist1-v1.docx
Download links
A two-part list of links to download the article, or parts of the article, in various formats.
Downloads (link to download the article as PDF)
Open citations (links to open the citations from this article in various online reference manager services)
Cite this article (links to download the citations from this article in formats compatible with various reference manager tools)
Transposon mutagenesis screen in Klebsiella pneumoniae identifies genetic determinants required for growth in human urine and serum
eLife 12:RP88971.
https://doi.org/10.7554/eLife.88971.3


