Paradoxical imbalance between activated lymphocyte protein synthesis capacity and rapid division rate
- National Institute of Allergy and Infectious Diseases, United States
- CNRS UMR-5203; INSERM U661; UM1; UM2, Institut de Génomique Fonctionnelle, France
Figures
Figure 1 with 2 supplements
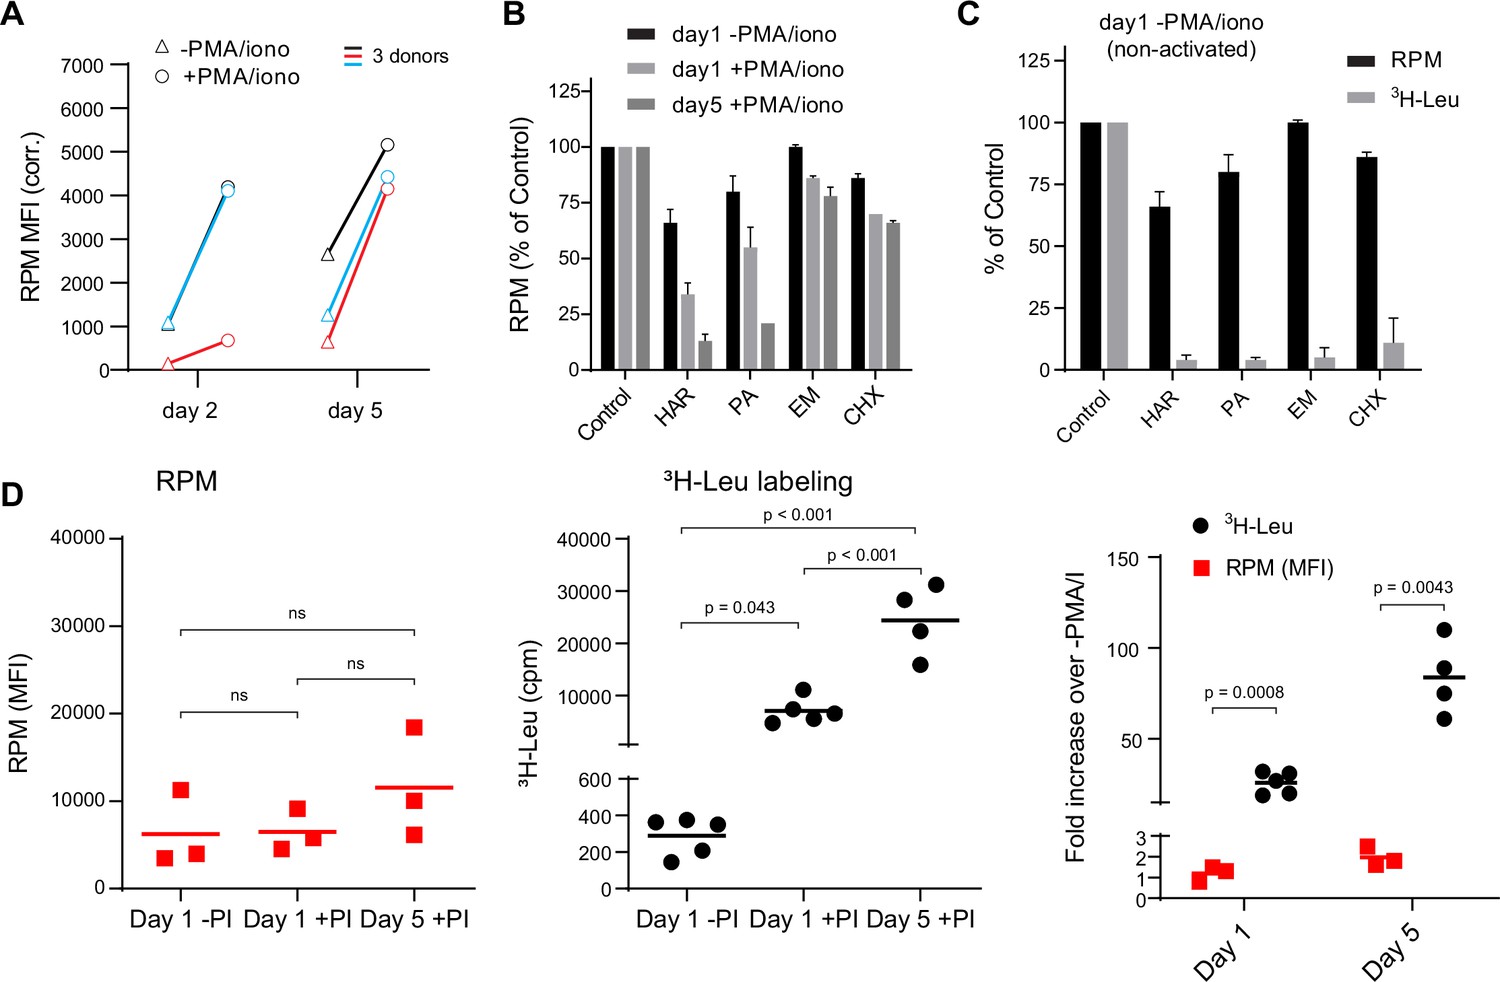
Stalled ribosomes in resting ex vivo human lymphocytes.
(A) Primary human lymphocytes from three independent donors were cultured in PMA/ionomycin and IL-2 (+PMA/iono) or IL-2 only (−PMA/iono) for up to 5 days. CD45+ cells were processed for flow ribopuromycylation method (RPM). (B) Primary human lymphocytes were cultured ex vivo as indicated, followed by a 15-min treatment with vehicle, harringtonine (HAR, 5 μg/ml), pactamycin (PA, 10 μM), emetine (EME, 25 μg/ml), or cycloheximide (CHX, 200 μg/ml), and all cultures were then treated with puromycin (PMY, 50 µg/ml) for 5 min. Cells were harvested, and RPM staining was performed. Gated on CD45+ cells. Error bars represent standard deviation of two independent experiments. (C) Radioactive amino acid incorporation (0.2 mCi/ml [3H]-Leu for 5 min) or RPM (as in B) in day 1 non-activated human lymphocytes. Error bars represent standard deviation of two independent experiments. (D) Radioactive amino acid incorporation and RPM in rested and activated human lymphocytes. RPM MFI values (gated on CD45+ cells) on the left, [3H]-Leu incorporation (cpm) in the middle, and ratios of the activated to the resting cells on the right. Each point represents a single donor; bars indicate the mean from three to five independent donors. Left and middle panels: one-way analysis of variance (ANOVA) pairwise p-values; right panel: unpaired t-test p-values with Welch’s correction.
-
Figure 1—source data 1
Numerical data and statistics related to Figure 1.
- https://cdn.elifesciences.org/articles/89015/elife-89015-fig1-data1-v1.xlsx
Figure 1—figure supplement 1
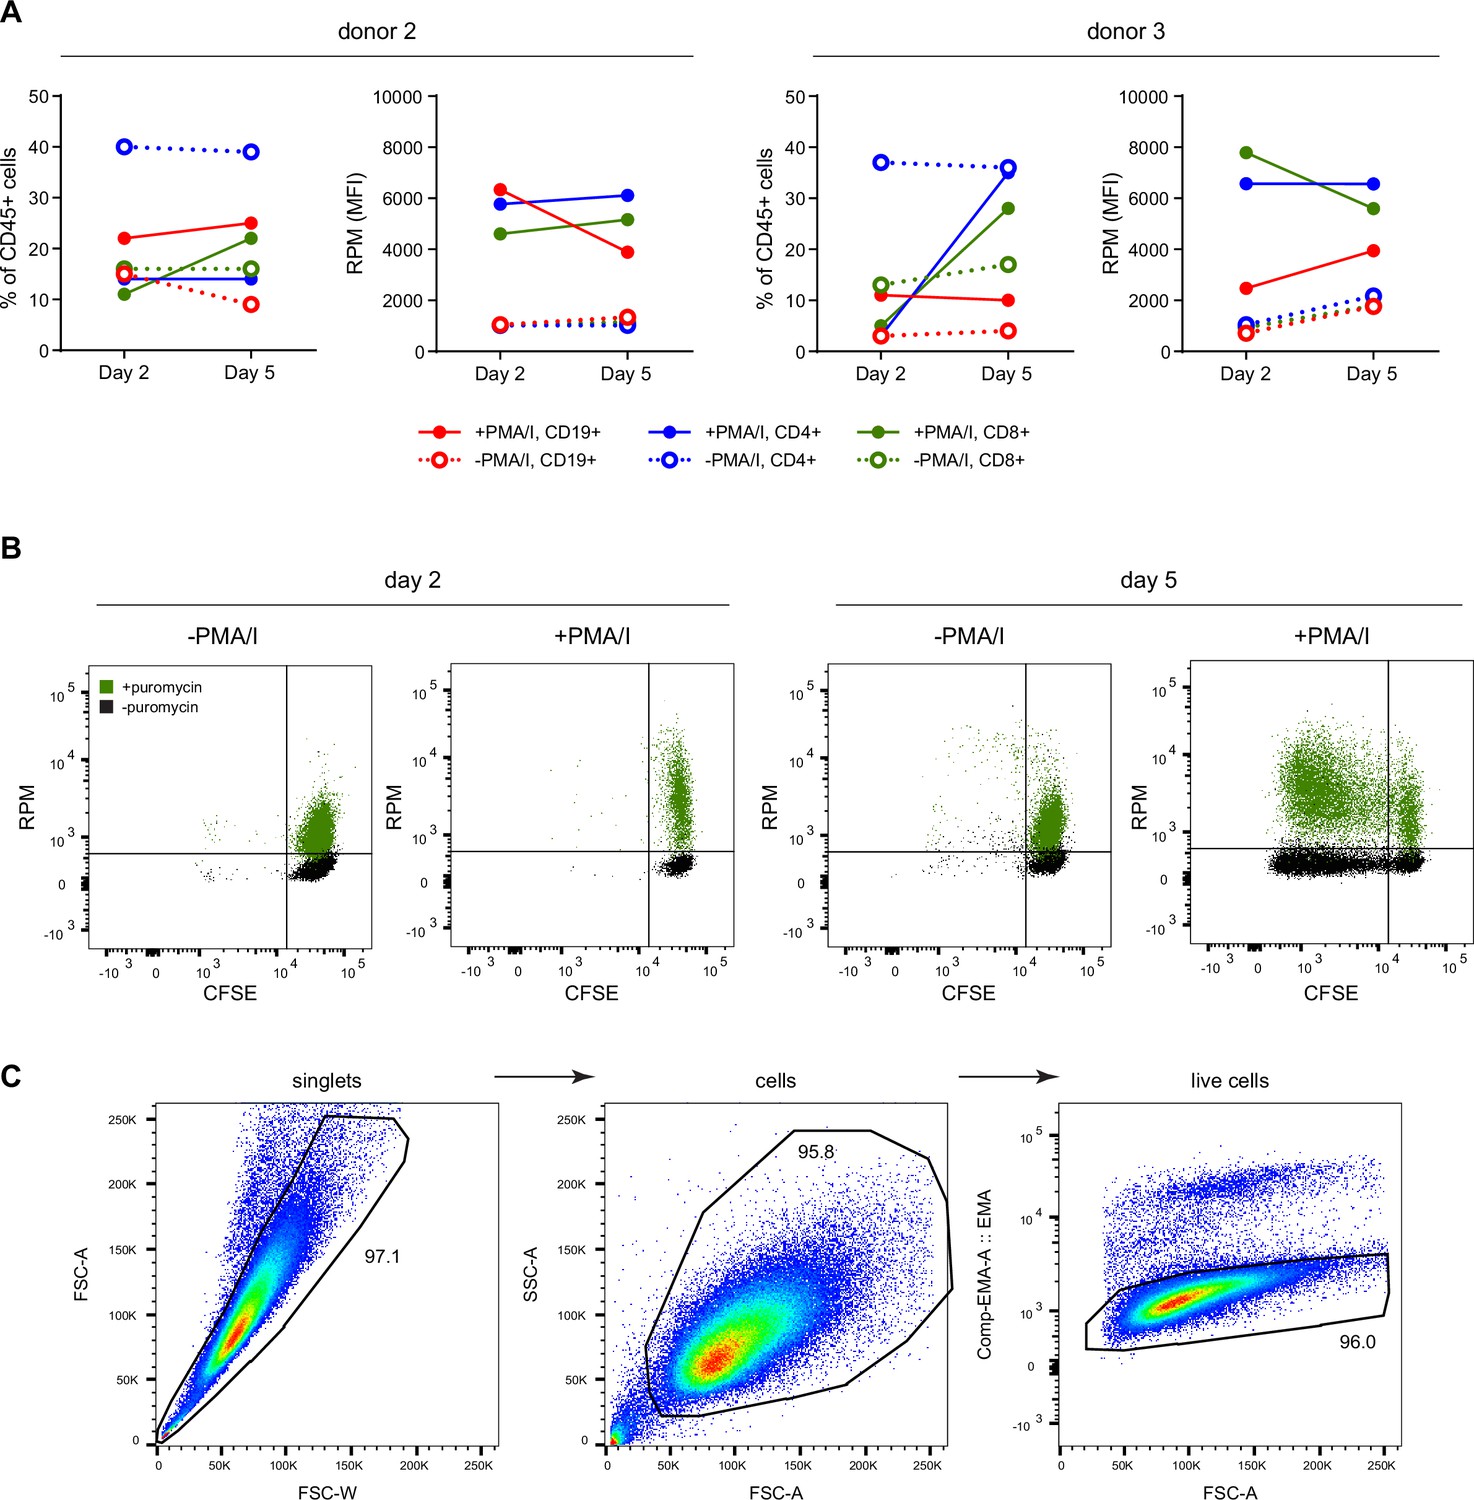
Ribopuromycylation method (RPM) tracks translation in distinct cell populations over time.
(A) Population frequency and RPM of resting day 2 or 5 human lymphocytes or PMA/ionomycin/IL-2 activated day 2 or 5 human lymphocytes. Left panel is the percent of CD45+ cells in the indicated population, the right panel is the RPM signal in each population. (B) Representative RPM flow cytometry plot gated on polyclonal CD8+ T cells. Similar data was obtained from all donors. (C) Gating strategy to quantify HeLa cell ribosome transit assays (RTAs) as described in Figure 2.
-
Figure 1—figure supplement 1—source data 1
Numerical data related to Figure 1—figure supplement 1.
- https://cdn.elifesciences.org/articles/89015/elife-89015-fig1-figsupp1-data1-v1.xlsx
Figure 1—figure supplement 2
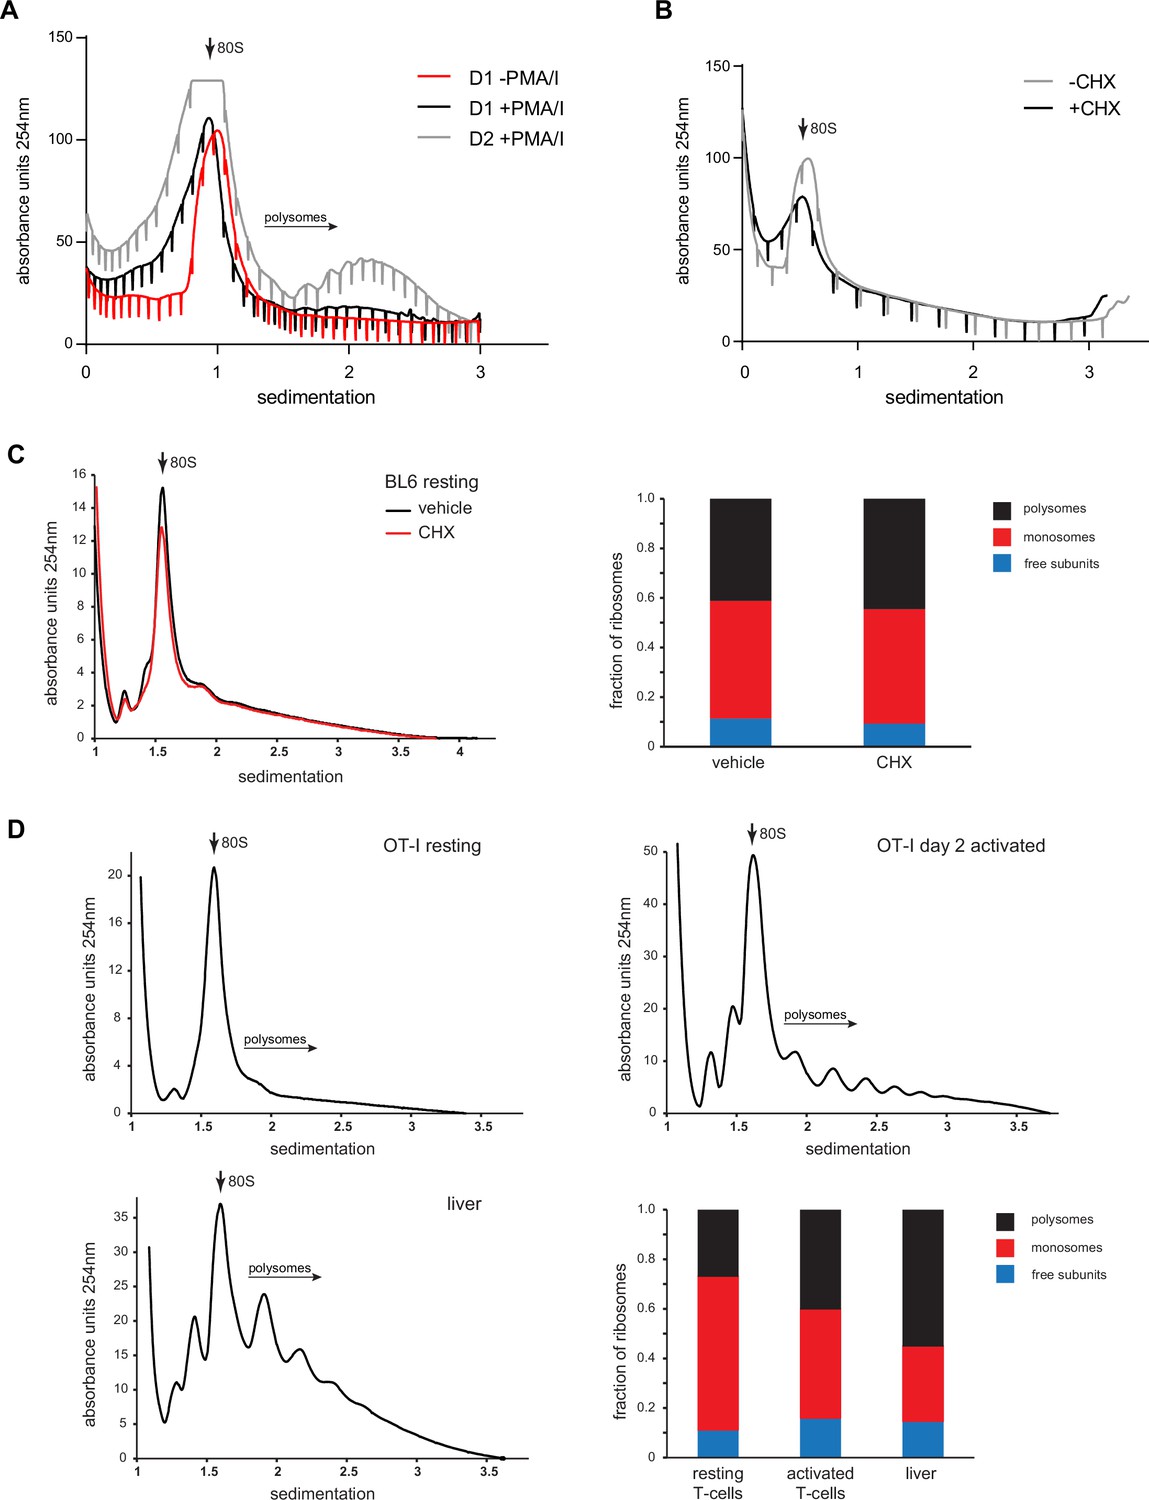
Dominant populations of monosomes in resting human and mouse lymphocytes.
(A) Primary human lymphocytes were cultured for 1 day in the absence of PMA/ionomycin or for up to 2 days in the presence of PMA/ionomycin/IL-2, followed by polysome profiling. Representative of two independent experiments. (B) Freshly isolated human lymphocytes were treated with 0.1 μg/ml cycloheximide (CHX) for 30 min prior to cell lysis and sucrose gradient centrifugation. Representative of two independent experiments. (C) C57BL/6 mice were treated IV with vehicle or CHX. After 10 min, spleens and lymph nodes were harvested, and the resulting cells subjected to polysome profiling via ultracentrifugation through 15–45% sucrose gradients. (D) Lymphocytes or hepatocytes were harvested from OT-I mice treated IV with CHX, lysed, and processed for polysome profiling. For activated cells, OT-I T cells were treated with PMA/ionomycin and IL-2 for 2 days prior to CHX treatment and polysome profiling. Bottom right: quantification of the areas under the curve of free subunits, monosomes, and polysomes. Representative of two independent experiments.
-
Figure 1—figure supplement 2—source data 1
Numerical data related to Figure 1—figure supplement 2.
- https://cdn.elifesciences.org/articles/89015/elife-89015-fig1-figsupp2-data1-v1.xlsx
Figure 2

Ribopuromycylation method (RPM) measures ribosome transit times in HeLa and human lymphocytes.
(A) Schematic representation of the RPM ribosome transit analysis (RTA) method. Translation initiation is blocked and the decrease in RPM is monitored as the elongating ribosomes run off mRNA. (B) RPM-RTA in HeLa cells. Harringtonine (HAR, 5 μg/ml) is used to inhibit new ribosome initiation; emetine (EME, 25 μg/ml) is used to freeze ribosomes on mRNA; puromycin (PMY, 50 μg/ml) generates RPM signal. Curve is fitted using one phase exponential decay, and ribosome transit times are expressed as RPM half-time to decay. Representative of three biological replicates. (C) Same as B, but cells are instead lysed in the presence of MG-132 and subjected to anti-puromycin western blot analysis. Representative of two biological replicates. (D) Representative plots of the RPM-RTA signal in resting and activated human lymphocytes (left three panels). Gated on CD45 cells. Far right, ribosome transit times determined from three independent donors. Each dot represents data from one individual donor; the horizontal bars indicate the mean. p-values indicate one-way analysis of variance (ANOVA) pairwise comparisons. (E) Ribosome transit times as in A but determined by [3H]-Leu incorporation instead of RPM. After treatment with HAR or HAR plus EME, cells were labeled for 5 min in 0.25 mCi/ml [3H]-Leu. Right panel, ribosome transit times determined by [3H]-Leu incorporation from three independent donors. Each dot represents data from one individual donor; the horizontal bars indicate the mean. Unpaired t-test.
-
Figure 2—source data 1
Numerical data and statistics related to Figure 2.
- https://cdn.elifesciences.org/articles/89015/elife-89015-fig2-data1-v1.xlsx
-
Figure 2—source data 2
Uncropped and outlined immunoblot images related to Figure 2C.
- https://cdn.elifesciences.org/articles/89015/elife-89015-fig2-data2-v1.zip
Figure 3
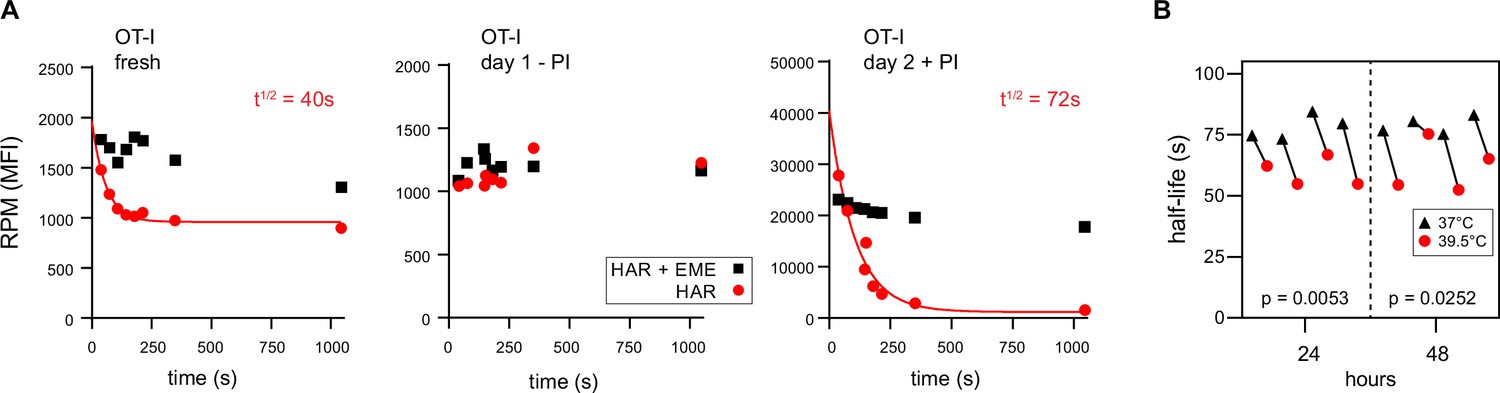
Ribopuromycylation method (RPM) ribosome transit analysis of OT-I T cells in vitro.
(A) Lymphocytes from spleens and lymph nodes from transgenic OT-I mice were isolated, and either used immediately, cultured for 1 day in the absence of PMA/ionomycin, or cultured for 2 days in the presence of PMA/ionomycin and IL-2. RPM-ribosome transit assay (RTA) analysis was conducted to determine ribosome transit half-lives, both with and without emetine (EME). Representative of three biological replicates. (B) Lymphocytes from spleens and lymph nodes from transgenic OT-I mice were isolated, labeled with carboxyfluorescein succinimidyl ester (CFSE), and cultured under activating conditions for either 24 or 48 hr. Cells were harvested, and RPM-RTA was performed at both 37 and 39.5°C. Half-life of RPM signal by RTA is plotted; p-values determined by paired t-test analysis. Representative of two biological replicates.
-
Figure 3—source data 1
Numerical data and statistics related to Figure 3.
- https://cdn.elifesciences.org/articles/89015/elife-89015-fig3-data1-v1.xlsx
Figure 4 with 1 supplement
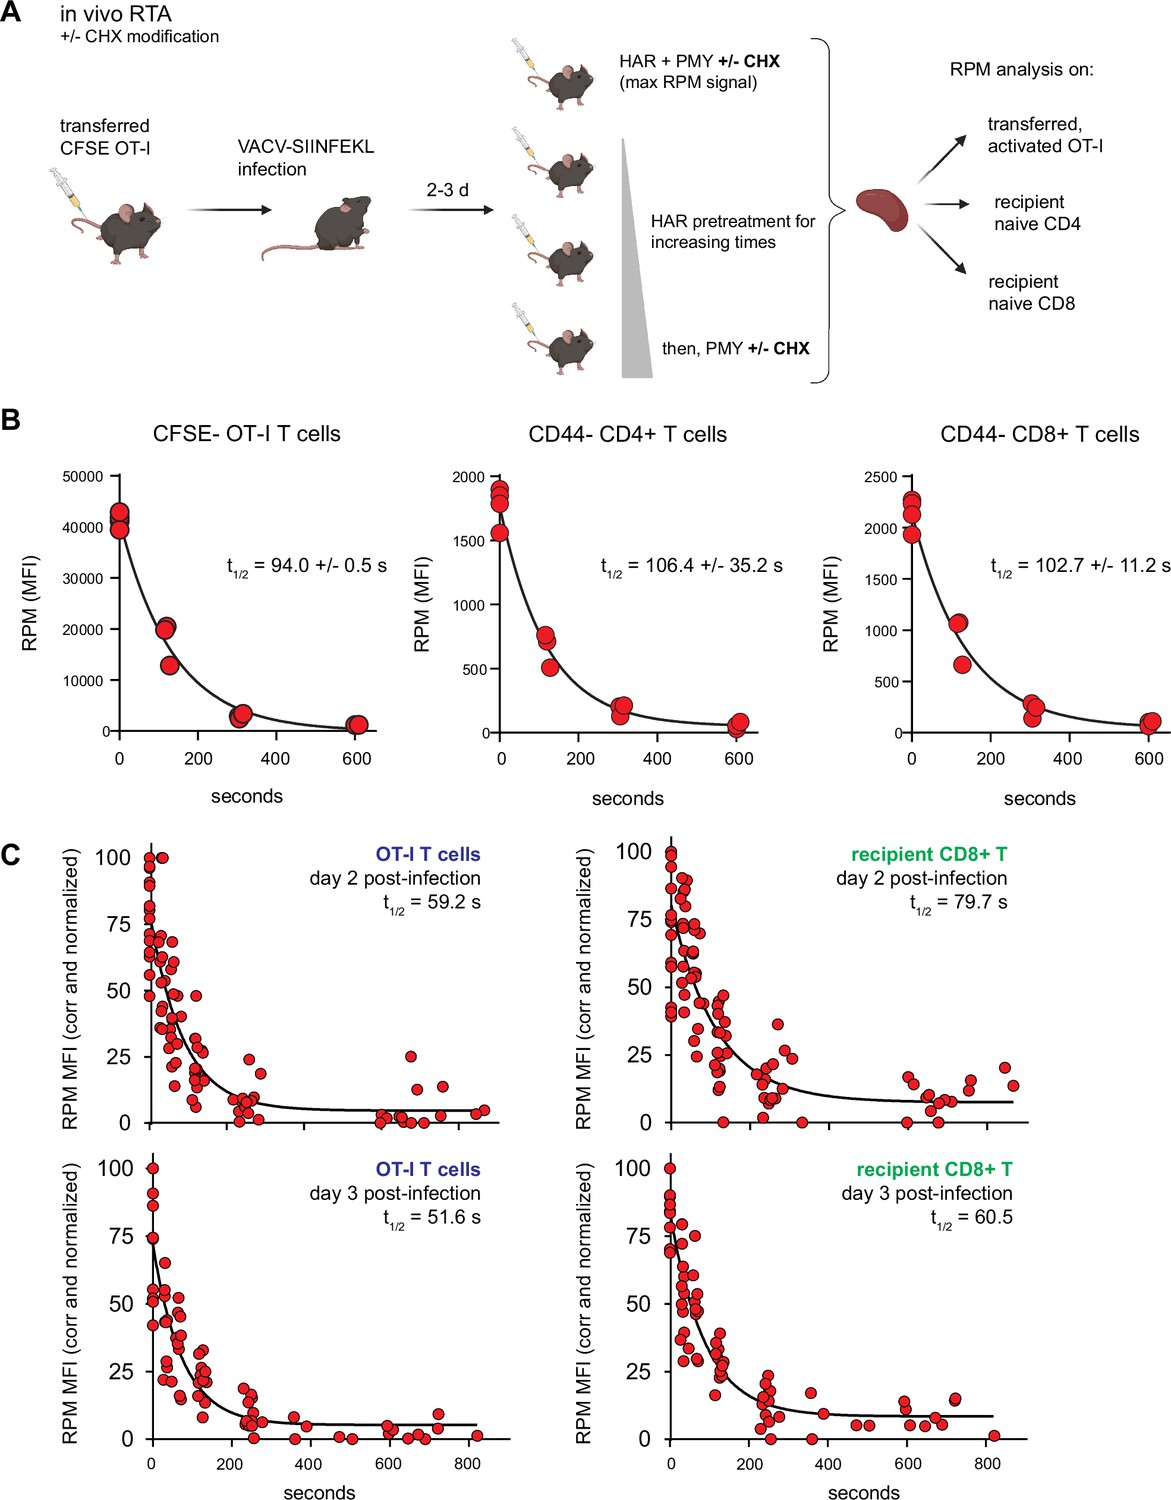
Translation rates of resting and activated T cells in vivo.
(A) Depiction of the in vivo ribopuromycylation method (RPM)-ribosome transit assay (RTA) method. Labeled OT-I T cells are first adoptively transferred, followed by VACV-SIINFEKL infection of mice. RTA analysis is performed by intravenous injection of harringtonine (HAR) followed by puromycin (PMY; +/− cycloheximide [CHX] to prevent leakiness from HAR inhibition alone). Spleens are harvested for RPM analysis on both endogenous and transferred T cells. Schematic designed with Biorender. (B) Carboxyfluorescein succinimidyl ester (CFSE)-labeled Ly5.2+ (CD45.2+CD45.1−) OT-I T cells were adoptively transferred into Ly5.1 (CD45.1+CD45.2−) mice, which were then infected with VACV-SIINFEKL to activate the OT-I cells. Three days after infection, mice were intravenously injected with HAR simultaneously with PMY for 5 min (maximum signal), or first injected with HAR for ~110, ~275, or ~575 s before being injected with PMY for 5 min. Splenocytes from mice were harvested, surface stained for gating and activation markers as indicated, fixed and permeabilized, and stained for RPM. Gates were CFSElow OT-I CD8+ T cells to measure decay in activated cells, and CD44−CD8+ or CD44−CD4+ T cells to measure decay in resting T cells. The curve was generated by fitting to a one phase exponential decay. Representative of two independent experiments, 2–4 mice per group, with the mean and standard deviation of the calculated half-life decays as indicated. (C) RTA, with the CHX modification, of adoptively transferred OT-I T cells or un-activated host CD8+ T cells in mice infected for 2 or 3 days with VACV-SIINFEKL. Three to four independent experiments combined, normalized by setting maximum background-subtracted signal to 100.
© 2024, BioRender Inc. Figure 4A was created using BioRender, and is published under a CC BY-NC-ND license. Further reproductions must adhere to the terms of this license.
-
Figure 4—source data 1
Numerical data and statistics related to Figure 4.
- https://cdn.elifesciences.org/articles/89015/elife-89015-fig4-data1-v1.xlsx
Figure 4—figure supplement 1
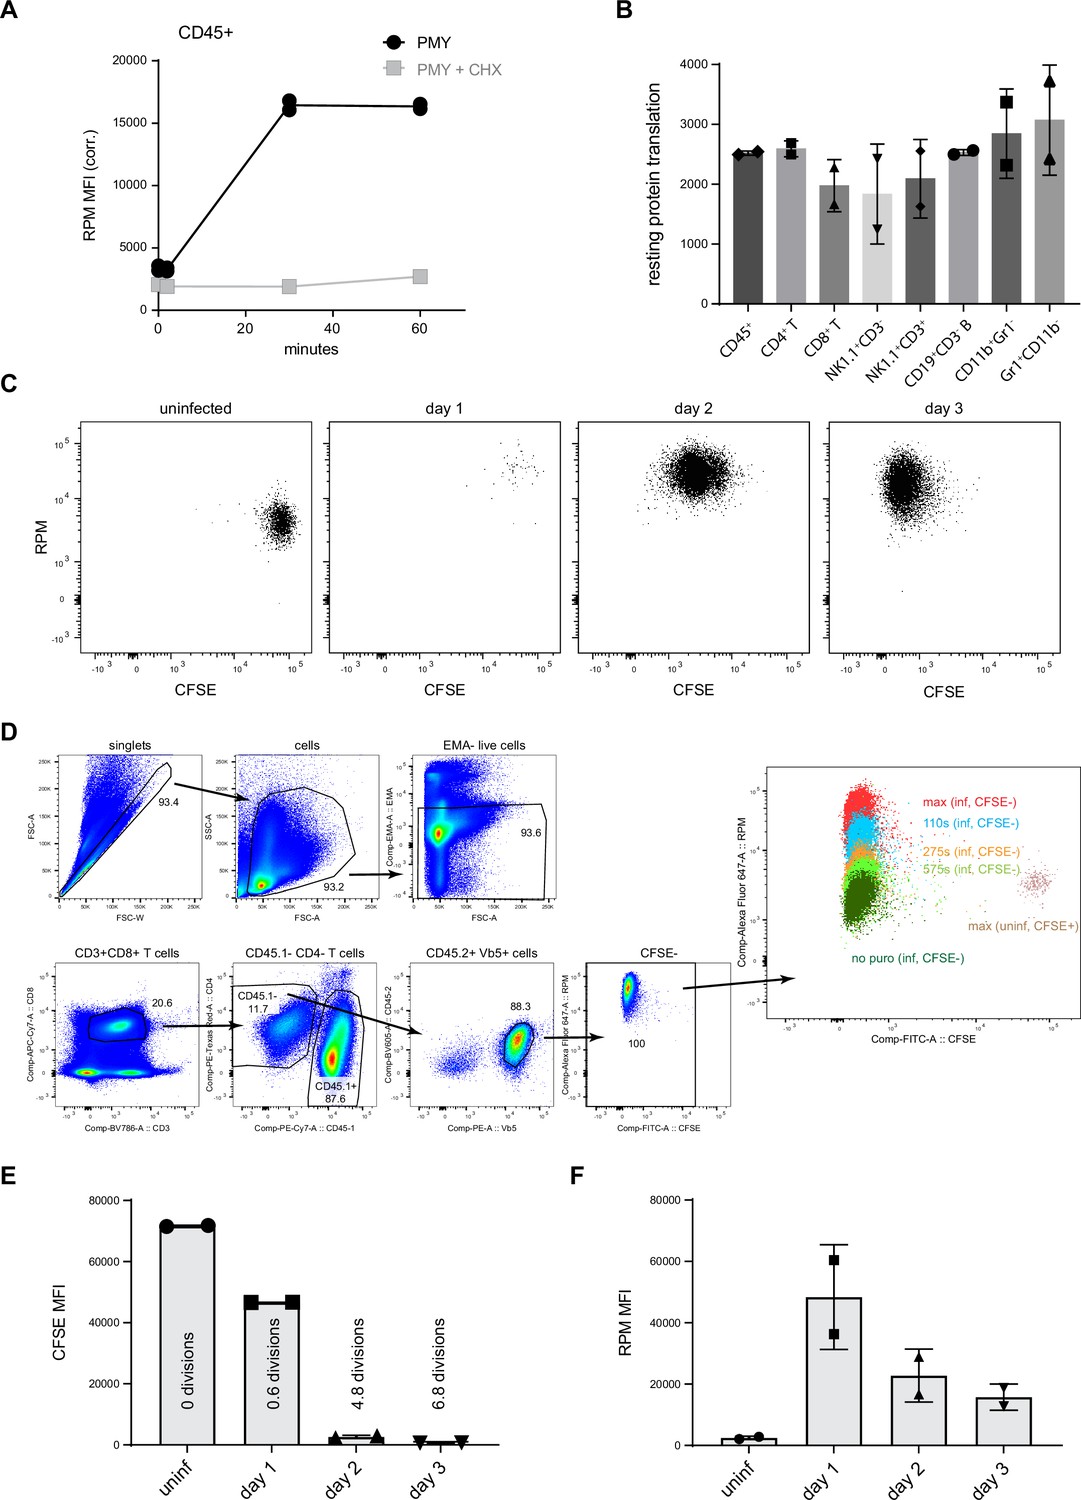
Ribopuromycylation method (RPM) cell phenotyping and in vivo T cell division.
(A) C57BL/6 mice were treated intravenously with cycloheximide (CHX) and puromycin (PMY) or only PMY. After the indicated times, splenocytes were harvested, surface stained, fixed/permeabilized, and RPM staining was performed. Representative of three independent experiments, 2–3 mice per group. (B) In one set of C57BL/6 mice, harringtonine (HAR) was intravenously injected for 15 min before intravenously injecting mice with PMY for 5 min. In a second set of mice, CHX and PMY were IV injected for 5 min. Splenocytes from each set of mice were harvested, surface stained, fixed, and permeabilized, and RPM staining was performed for various immune cell subsets. To determine relative amounts of ribosomes, the ‘HAR then PMY’ RPM signal was subtracted from the CHX + PMY RPM signal for each cell subset after flow cytometry. Representative of two independent experiments, 2–4 mice per group. (C) Carboxyfluorescein succinimidyl ester (CFSE)-labeled Ly5.2+ (CD45.2+CD45.1−) OT-I cells were adoptively transferred into Ly5.1+ (CD45.1+CD45.2−) mice, which were then infected with VAC-SIINFEKL. One to three days after infection, mice were intravenously injected with CHX simultaneously with PMY for 5 min. Splenocytes from the mice were harvested, surface stained, fixed and permeabilized, and RPM staining was performed. Representative flow cytometry plots gated on OT-I T cells. (D) Gating strategy used to display and quantify in vivo T cell data as described in panel C and elsewhere. (E) Number of divisions (by CFSE dilution) of OT-I T cells 1–3 days after infection of mice with VACV-SIINFEKL. (F) Amount of translation as measured by RPM signal (with ‘no PMY’ signal subtracted) in uninfected, or 1-, 2-, or 3-day VACV-SIINFEKL-infected mice. Representative of four independent experiments, 2–3 mice per time point.
-
Figure 4—figure supplement 1—source data 1
Numerical data and statistics related to Figure 4—figure supplement 1.
- https://cdn.elifesciences.org/articles/89015/elife-89015-fig4-figsupp1-data1-v1.xlsx
Figure 5 with 2 supplements
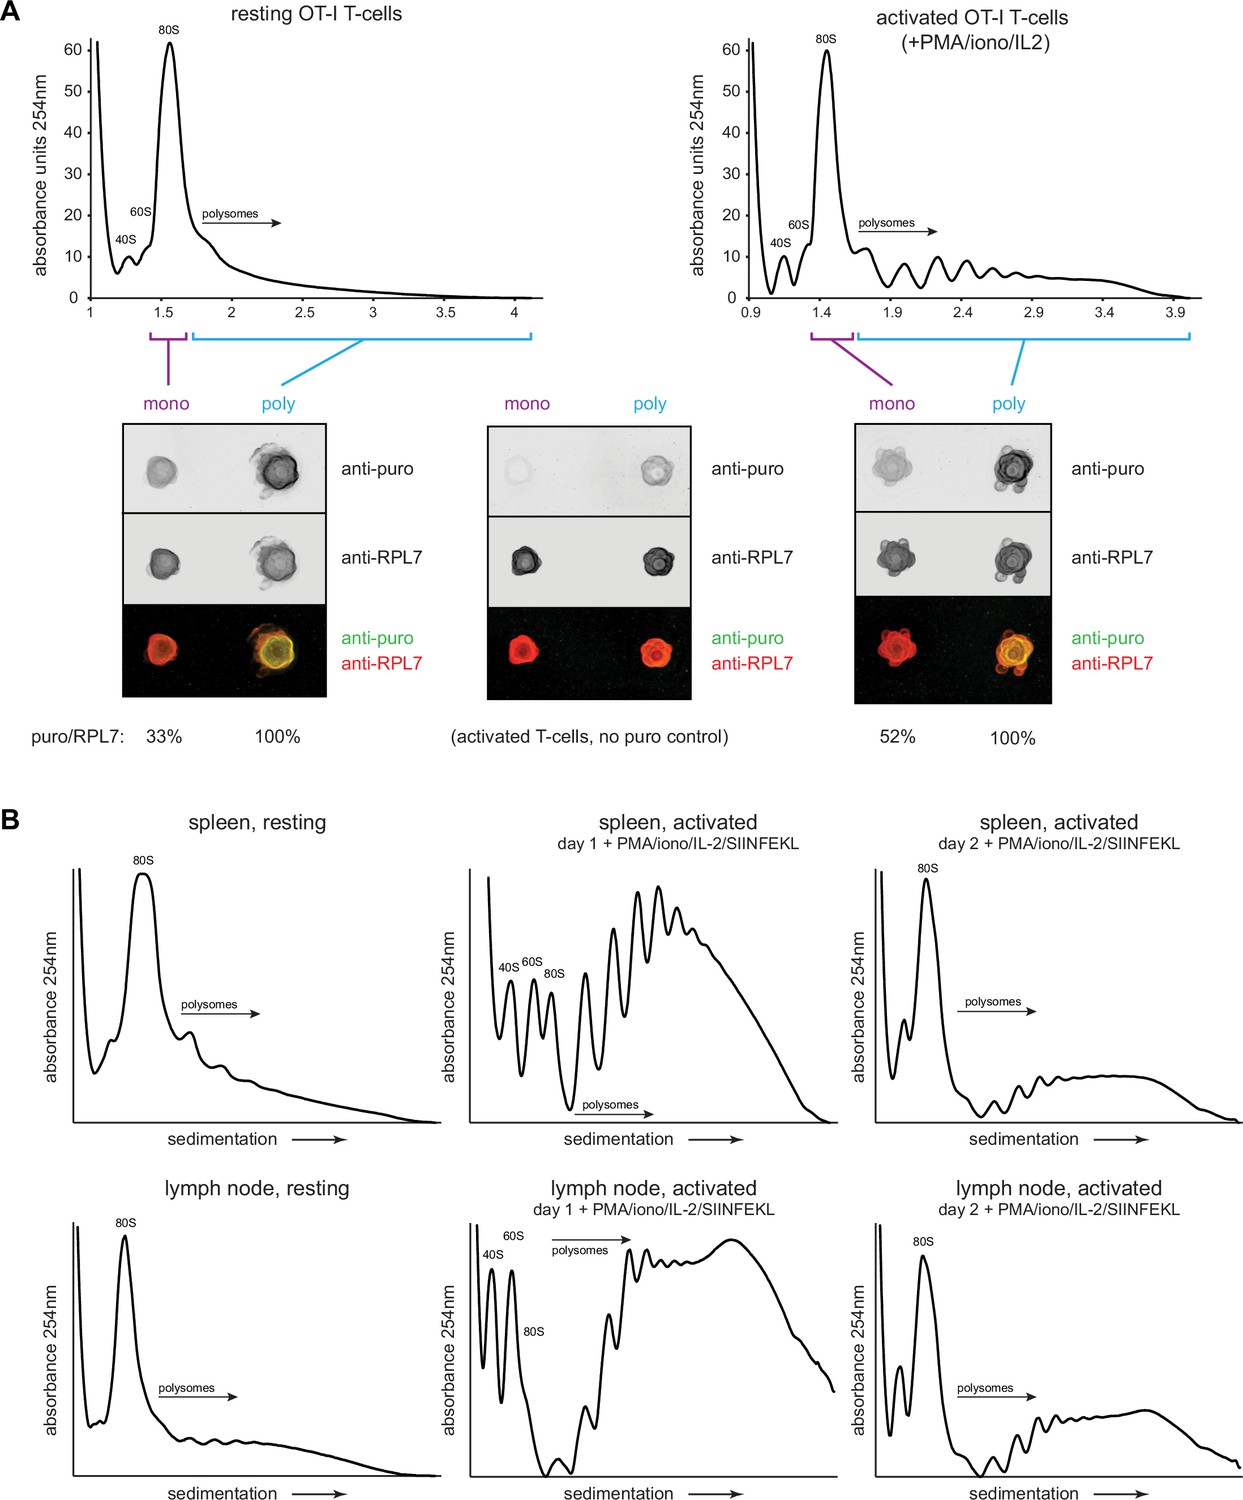
Puromycylation reveals percentage of actively translating monosomes in resting and activated T cells.
(A) OT-I mice were treated intravenously with cycloheximide (CHX) and puromycin (PMY), and lymphocytes from the spleens and lymph nodes were isolated and subjected to polysome profiling by ultracentrifugation through 15–45% sucrose gradients (resting OT-I T cells). OT-I T cells activated in vitro for 2 days with PMA/ionomycin and IL-2 (without cognate SIINFEKL peptide) were treated either with CHX alone (no PMY control) or CHX with PMY and subjected to polysome profiling. The indicated fractions were collected, pooled, and their ribosomes were re-isolated and dotted onto a nitrocellulose membrane for blotting with antibodies against PMY and RPL7. After subtraction of background signal from the anti-puro antibody (middle panel), the PMY/RPL7 ratio of monosomes was expressed relative to that of polysomes, which was defined as 100% translating. Representative of two biological replicates. (B) For resting T cells, OT-I mice were treated intravenously with CHX, and lymphocytes from the spleens or lymph nodes were isolated and lysed. For activated T cells, lymph node or splenic OT-I T cells were stimulated in vitro for 2 days with PMA/ionomycin, IL-2, and exogenous SIINFEKL, followed by treatment with CHX for 5 min. For both resting and activated cells, ribosome-containing lysates were fractionated via ultracentrifugation on 15–45% sucrose gradients. Representative of two biological replicates.
-
Figure 5—source data 1
Numerical data related to Figure 5.
- https://cdn.elifesciences.org/articles/89015/elife-89015-fig5-data1-v1.xlsx
-
Figure 5—source data 2
Uncropped and outlined immunoblot images related to Figure 5A.
- https://cdn.elifesciences.org/articles/89015/elife-89015-fig5-data2-v1.zip
Figure 5—figure supplement 1
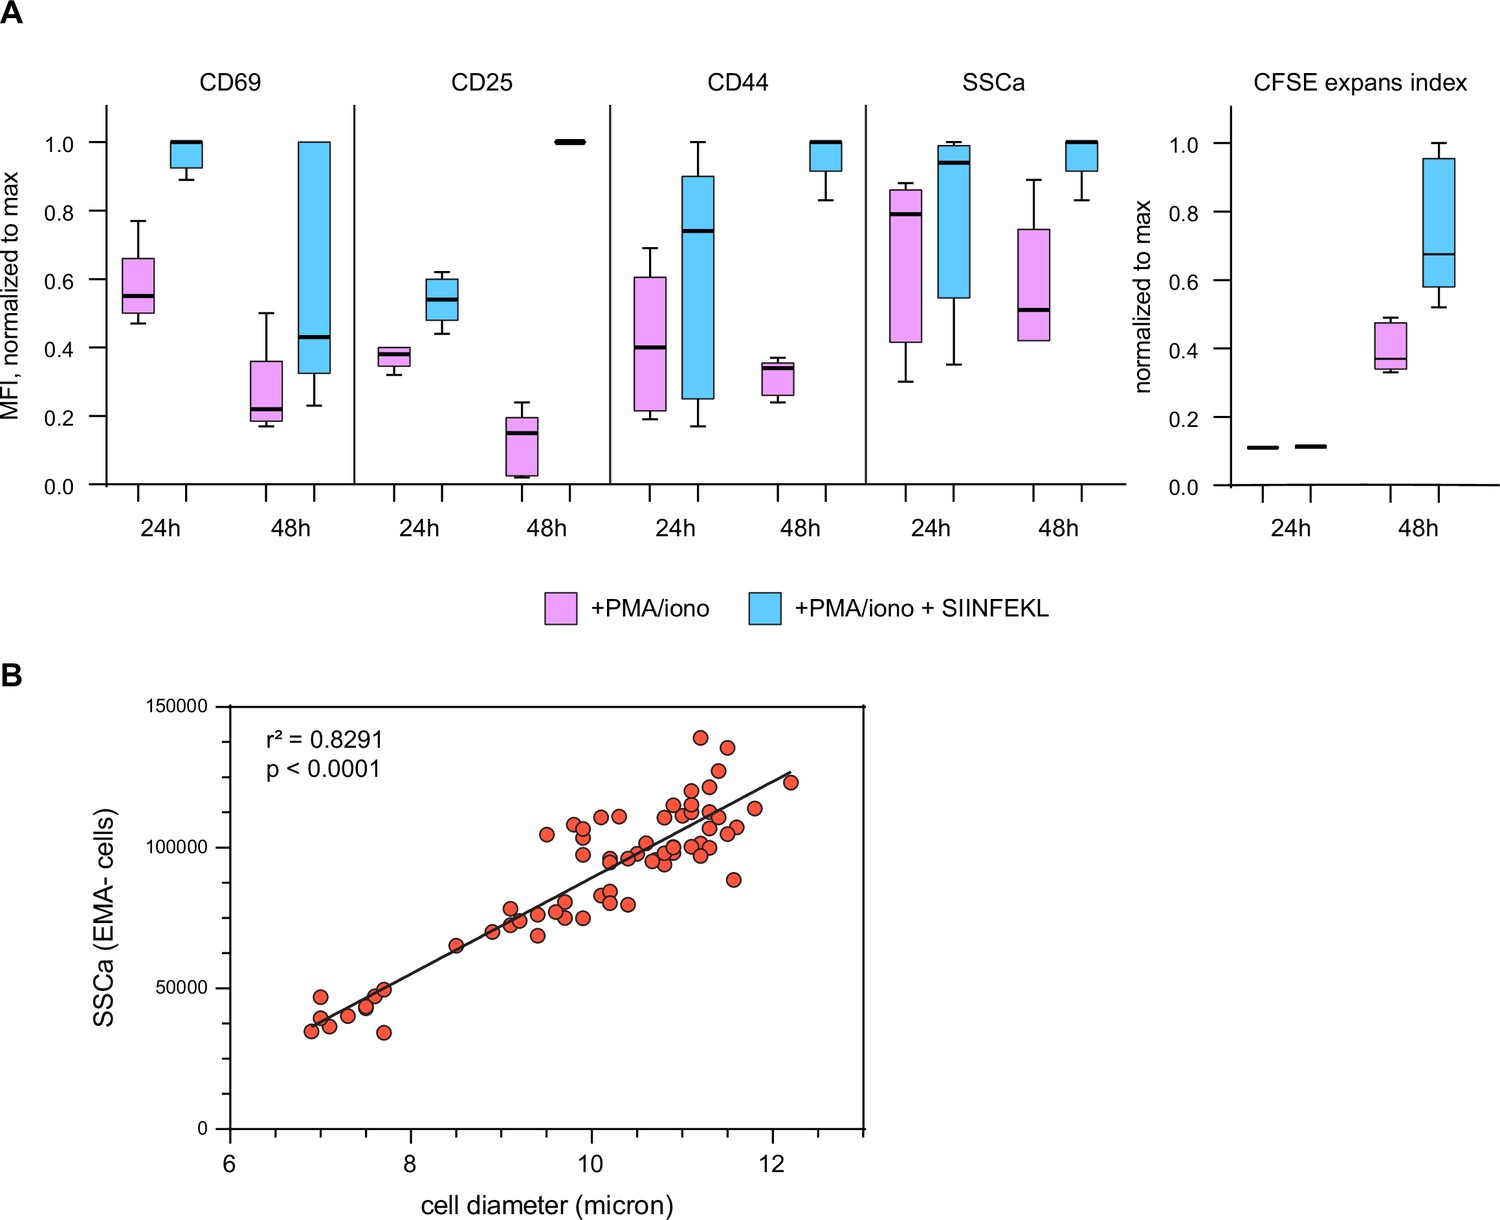
Exogenous SIINFEKL significantly enhances OT-I T cell activation in vitro.
(A) Maximum-normalized MFI of CD69, CD25, CD44, and side scatter (SSCa), as well as carboxyfluorescein succinimidyl ester (CFSE) expansion index, of OT-I T cells after 1 or 2 days with PMA/ionomycin or PMA/ionomycin with exogenous SIINFEKL. IL-2 was included in all conditions. (B) Side scatter is a good proxy for cell size. SSCa MFI plotted vs. cell diameter as determined by automated cell counter measurements. Combined measurements from four separate experiments.
-
Figure 5—figure supplement 1—source data 1
Numerical data related to Figure 5—figure supplement 1.
- https://cdn.elifesciences.org/articles/89015/elife-89015-fig5-figsupp1-data1-v1.xlsx
Figure 5—figure supplement 2
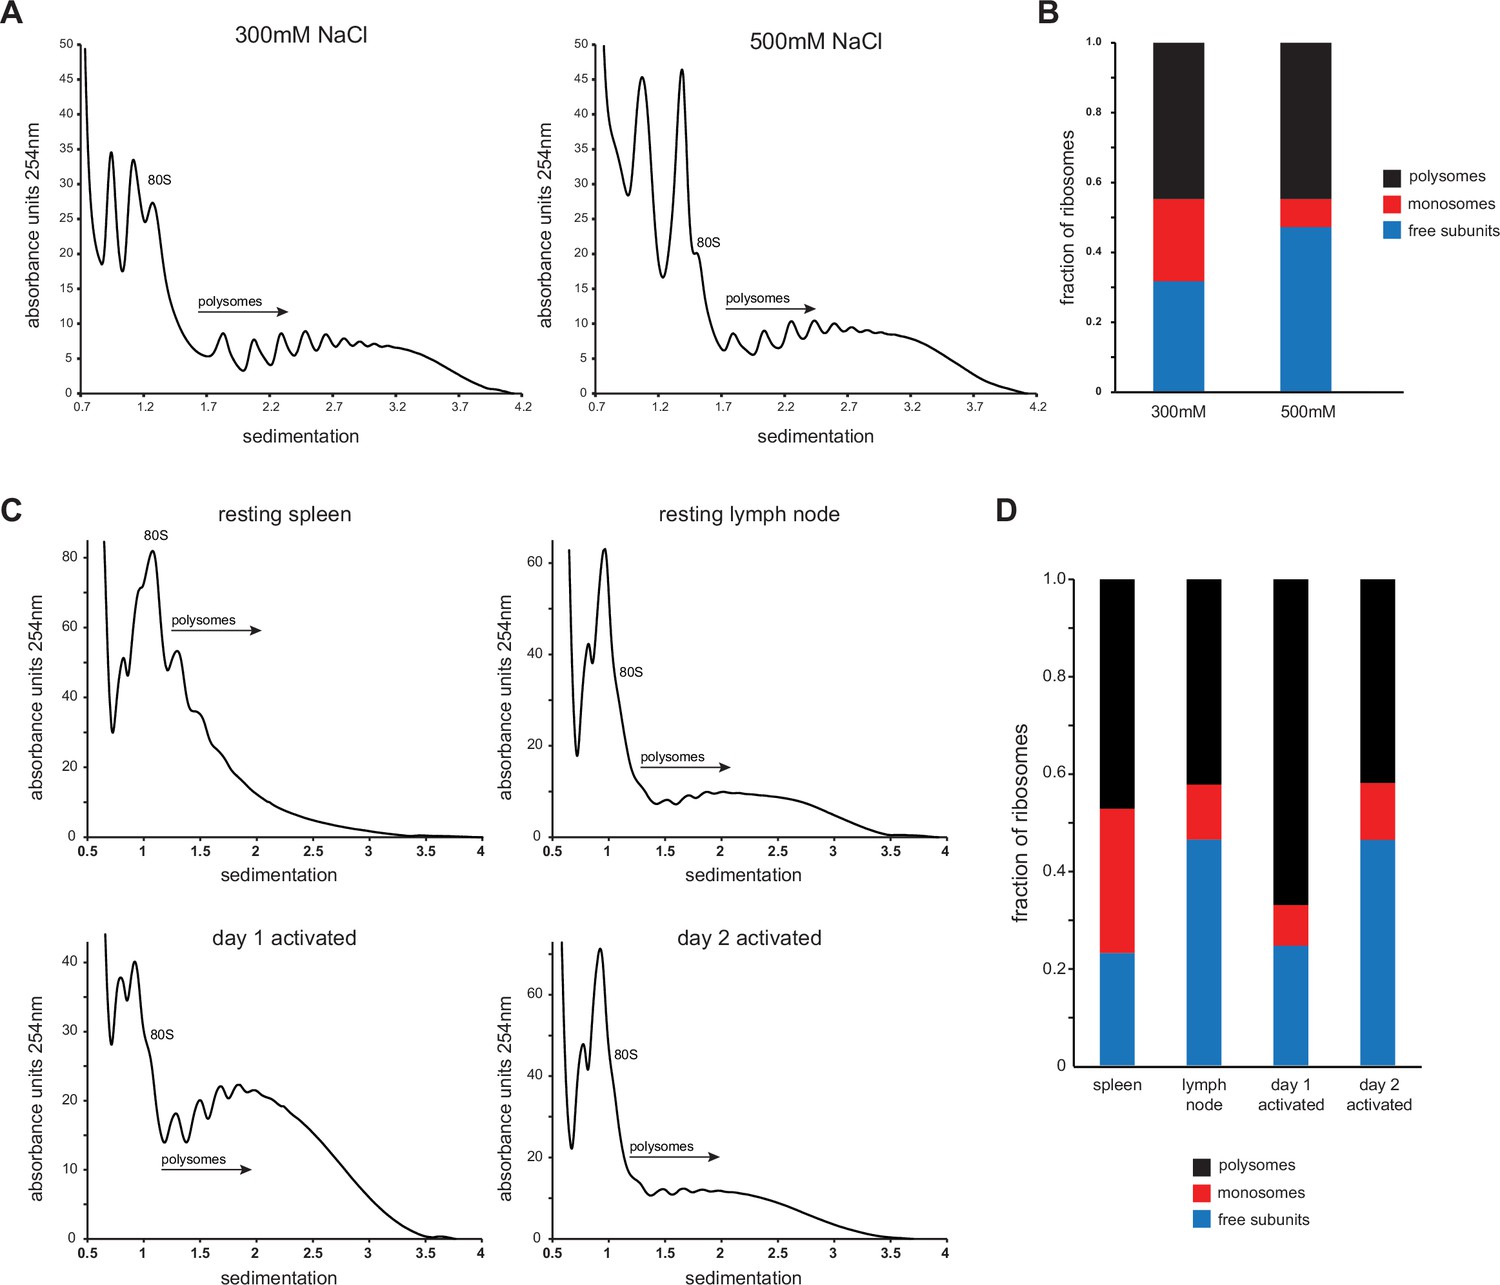
Salt stability of T cell ribosomes and monosome quantification.
(A) Lymph node and splenic OT-I T cells were mixed and stimulated in vitro for 2 days with SIINFEKL, PMA/ionomycin, and IL-2. Cells were treated with cycloheximide (CHX) for 5 min, lysed, and brought to either 300 or 500 mM NaCl final concentration. Ribosome-containing lysates were subjected to polysome profiling via ultracentrifugation through 15–45% sucrose gradients containing either 300 or 500 mM NaCl. Representative of two biological replicates. (B) Quantification of the areas under the curve of free subunits, monosomes, and polysomes for each sample. (C) For resting T cells, OT-I mice were treated IV with CHX and lymphocytes from the spleens or lymph nodes were isolated and lysed. For activated T cells, lymph node and splenic OT-I T cells were mixed and stimulated in vitro for 2 days with SIINFEKL, PMA/ionomycin, and IL-2, treated with CHX for 5 min, and lysed. Lysates were subjected to polysome profiling via ultracentrifugation on 15–45% sucrose gradients after bringing both lysate and sucrose gradients to a final concentration of 500 mM NaCl to dissociate non-translating ribosomes. (D) Quantification of the areas under the curve of free subunits, monosomes, and polysomes in each sample. Representative of two independent experiments.
-
Figure 5—figure supplement 2—source data 1
Numerical data related to Figure 5—figure supplement 2.
- https://cdn.elifesciences.org/articles/89015/elife-89015-fig5-figsupp2-data1-v1.pdf
Figure 6 with 1 supplement

T cell accounting reveals discrepancy in proteome duplication rate for activated T cells in vivo.
(A) Measurements made to calculate in vitro and in vivo rates of T cell division. (B) Volume calculations based on diameter measurements made by automated cell counter for the indicated cell types. Days 1 and 2 represent in vitro activated OT-I T cells. Ex vivo day 2 represent cells activated in vivo for 2 days, followed by isolation and processing. (C) Protein content per cell as measured by tryptophan fluorescence of denatured lysates. (D) Protein molecules per fL, assuming an average protein length of 472 aa and average amino acid mass of 110 Da. (E) Example output from custom bioanalyzer method to determine number or ribosomes per cell. Total RNA is quantified and the bioanalyzer is used to determine area under the curve for 18S and 28S percentage of total RNA. Additionally, an exogenous mRNA standard is spiked into the sample prior to RNA isolation to determine the percent loss in yield during the purification procedure. Combined, this method allows for the accurate determination of total number of 18S and 28S molecules per cell. (F) Number of ribosomes per cell for the indicated cells. (G) Ribosome per fL for the indicated cells. (H) The protein/ribosome ratio, a representation of how many proteins a single ribosome would need to create to duplicate the proteome. (I) Discrepancy between measured and calculated rates of division for OT-I T cells activated and dividing in vivo.
-
Figure 6—source data 1
Numerical data related to Figure 6.
- https://cdn.elifesciences.org/articles/89015/elife-89015-fig6-data1-v1.xlsx
Figure 6—figure supplement 1
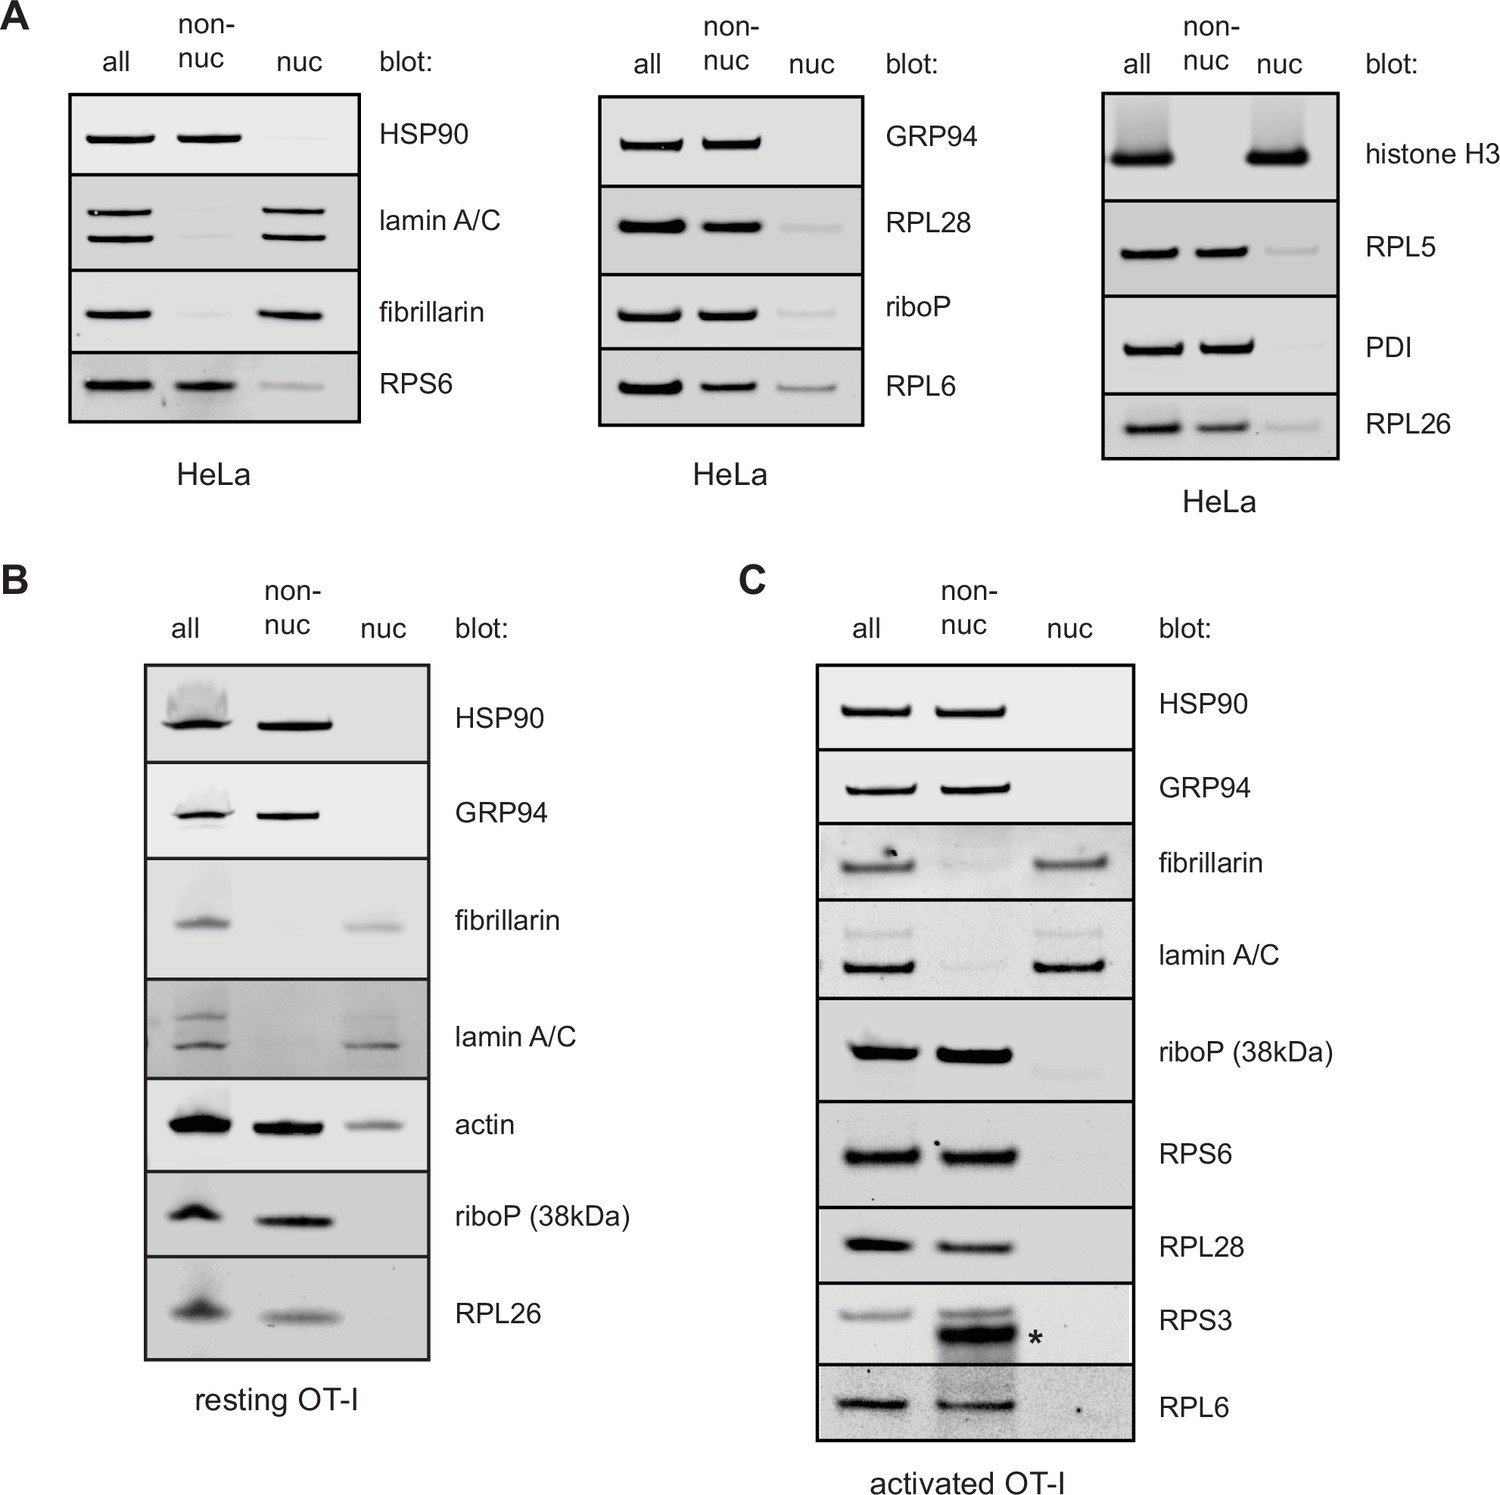
Fractionation of HeLa or T cells reveals few ribosomal components in nuclear lysates.
HeLa cells (A), freshly isolated resting OT-I T cells (B), or OT-I T cells stimulated with PMA/ionomycin and IL-2 in vitro for 2 days (C) were either lysed directly in sodium dodecyl sulfate (SDS) extraction buffer (all) or subjected to a hypotonic lysis procedure to isolate non-nuclear lysates and nuclear lysates. Equal amounts of each fraction were subjected to immunoblotting for markers typical of the cytosol, ER, and nucleus. Antibodies against ribosomal proteins were used to determine where the majority of ribosomal proteins (and therefore ribosomes) fractionated. Controls with antibodies specific for nucleolar located fibrillarin, histone H3, and lamin A/C establish lack of nuclear contamination in non-nuclear fractions. ER and cytoplasmic proteins HSP90, GRP94, PDI, and actin indicate lack of contamination in the nuclear fraction. Representative of two experiments.
-
Figure 6—figure supplement 1—source data 1
Uncropped and outlined immunoblot images related to Figure 6—figure supplement 1.
- https://cdn.elifesciences.org/articles/89015/elife-89015-fig6-figsupp1-data1-v1.zip
-
Figure 6—figure supplement 1—source data 2
Uncropped immunoblot images related to Figure 6—figure supplement 1.
- https://cdn.elifesciences.org/articles/89015/elife-89015-fig6-figsupp1-data2-v1.zip
Tables
Key resources table
| Reagent type (species) or resource | Designation | Source or reference | Identifiers | Additional information |
|---|---|---|---|---|
| Strain, strain background (Mus musculus, male, female) | (C57BL/6J) male, female | The Jackson Laboratory | RRID:IMSR_JAX:000664 Strain # (000664) | (6 weeks to 8 months of age) |
| Strain, strain background (Mus musculus, male, female) | (C57BL/6NTac) male, female | Taconic Biosciences | RRID:IMSR_TAC:B6 Model # (B6-M, B6-F) | (6 weeks to 8 months of age) |
| Strain, strain background (Mus musculus, male, female) | (B6.SJL-Ptprca/BoyAiTac) male, female | Taconic Biosciences | RRID:IMSR_TAC:1349 Model # (4007-M, 4007-F) | (6 weeks to 8 months of age) CD45.1 (Ly5.1) |
| Strain, strain background (Mus musculus, male, female) | Strain (B6.129S7-Rag1tm1Mom Tg(TcraTcrb)1100Mjb N9 + N1) male, female | NIAID Intramural Research Repository | RRID:IMSR_TAC:4175 Model # (4175-M, 4175-F) | (6 weeks to 8 months of age) RAG1ko OTI TCR transgenic |
| Cell line (Homo sapiens) | HeLa, Epithelial cell, uterus; cervix (adenocarcinoma) | ATCC | RRID:CVCL_0030 CCL2 | |
| Cell line (Homo sapiens) | Peripheral blood mononuclear cells (PBMCs, healthy, adult) | NIH Clinical Center Department of Transfusion Medicine | ||
| Chemical compound, drug | Puromycin | Calbiochem | 540222 – 100 MG | (1 mg/ mouse) (20 µg/ml) |
| Chemical compound, drug | Cycloheximide | EMD Millipore | 239764 – 100 MG | (0.34 mg/mouse) (200 µg/ml) |
| Chemical compound, drug | Harringtonin | Santa Cruz Biotech | sc-204771A | (100 µg/mouse) (5 µg/ml) |
| Chemical compound, drug | Emetine, dihydrochloride | Calbiochem | 324693 | (25 µg/ml) |
| Chemical compound, drug | Anisomycin | Sigma | A9789-25MG | (50 µg/ml) |
| Chemical compound, drug | Pactamycin | Sigma | PZ0182 | (10 µM) |
| Chemical compound, drug | Carboxyfluorescein succinimidyl ester (CFSE) | Invitrogen | C34554 | (5 µM) |
| Antibody | Anti-human CD3 mouse monoclonal antibody (OKT3), PerCP-eFluor 710, eBioscience | Invitrogen | Cat#: 46-0037-42 RRID:AB_1834395 | FACS (1 μl per test) |
| Antibody | Anti-human mouse CD19 Monoclonal Antibody (HIB19), PE, eBioscience | Invitrogen | Cat#: 12-0199-42 RRID:AB_1834376 | FACS (1 μl per test) |
| Antibody | Anti-human mouse CD45 Monoclonal Antibody (2D1), APC-eFluor 780, eBioscience | Invitrogen | Cat#: 12-0199-42 RRID:AB_1834376 | FACS (1 μl per test) |
| Antibody | BD Horizon PE-CF594 Mouse anti-Human CD4 (L3T4) | BD Biosciences | Cat#: 562281 RRID:AB_11154597 | FACS (1 μl per test) |
| Antibody | Anti-human mouse CD4 Monoclonal Antibody (RPA-T4), PE-Cyanine7, eBioscience | Invitrogen | Cat#: 25-0049-42 RRID:AB_1659695 | FACS (1 μl per test) |
| Antibody | BD Horizon BV421 Mouse Anti-Human CD8 (RPA-T8) | BD Biosciences | Cat#: 562428 RRID:AB_11154035 | FACS (1 μl per test) |
| Antibody | BD Horizon BV786 Hamster Anti-Mouse CD3e (145 – 2 C11) | BD Biosciences | Cat#: 564379 RRID:AB_2738780 | FACS (0.75 μl per test) |
| Antibody | BD Horizon BV510 Rat Anti-Mouse CD4 (RM4-5) | BD Biosciences | Cat#: 563106 RRID:AB_2687550 | FACS (0.75 μl per test) |
| Antibody | BD Horizon APC-R700 Rat anti-Mouse CD5 (53 – 7.3) | BD Biosciences | Cat#: 565505 | FACS (0.75 μl per test) |
| Antibody | BD Horizon PE-CF594 Rat Anti-Mouse CD8a (53 – 6.7) | BD Biosciences | Cat#: 562283 RRID:AB_11152075 | FACS (0.75 μl per test) |
| Antibody | Anti-mouse rat CD11b Monoclonal Antibody (M1/70), PE-Cyanine7, eBioscience | Invitrogen | Cat#: 25-0112-82 RRID:AB_469588 | FACS (0.75 μl per test) |
| Antibody | Anti-mouse rat CD19 Monoclonal Antibody (eBio1D3 (1D3)), APC, eBioscience | Invitrogen | Cat#: 17-0193-82 RRID:AB_1659676 | FACS (0.75 μl per test) |
| Antibody | BD Horizon BV650 Rat Anti-Mouse CD25 (PC61) | BD Biosciences | Cat#: 564021 RRID:AB_2738547 | FACS (0.75 μl per test) |
| Antibody | BD Horizon BV605 Rat Anti-Mouse CD44 (IM7) | BD Biosciences | Cat#: 563058 RRID:AB_2737979 | FACS (0.75 μl per test) |
| Antibody | Anti-mouse rat CD44 Monoclonal Antibody (IM7), eFluor 450, eBioscience | Invitrogen | Cat#: 48-0441-82 RRID:AB_1272246 | FACS (0.75 μl per test) |
| Antibody | Anti-mouse mouse CD45.1 Monoclonal Antibody (A20), APC, eBioscience | Invitrogen | Cat#: 17-0453-82 RRID:AB_469398 | FACS (0.75 μl per test) |
| Antibody | Anti-mouse mouse CD45.1 Monoclonal Antibody (A20), eFluor 450, eBioscience | Invitrogen | Cat#: 48-0453-82 RRID:AB_1272189 | FACS (0.75 μl per test) |
| Antibody | Anti-mouse Armenian hamster TCR gamma/delta Monoclonal Antibody (eBioGL3 (GL-3, GL3)), PE, eBioscience | Invitrogen | Cat#: 12-5711-82 RRID:AB_465934 | FACS (0.75 μl per test) |
| Antibody | BD Pharmingen PE Rat Anti-Mouse Ly-6G and Ly-6C (RB6-8C5) | BD Biosciences | Cat#: 561084 RRID:AB_394644 | FACS (0.75 μl per test) |
| Antibody | Anti-mouse mouse NK1.1 Monoclonal Antibody (PK136), FITC, eBioscience | Invitrogen | Cat#: 11-5941-82 RRID:AB_465318 | FACS (0.75 μl per test) |
| Antibody | BD Horizon BV711 Hamster Anti-Mouse TCR β Chain (H57-597) | BD Biosciences | Cat#: 563135 RRID:AB_2738023 | FACS (0.75 μl per test) |
| Antibody | BD Pharmingen PE Mouse Anti-Mouse Vβ 5.1, 5.2 T-Cell Receptor (MR9-4) | BD Biosciences | Cat#: 562086 RRID:AB_394698 | FACS (0.75 μl per test) |
| Antibody | Anti-puromycin (PMY-2A4) | (made in-house) Developmental Studies Hybridoma Bank | Cat#: PMY-2A4 RRID:AB_2619605 | FACS (1 μl per test) |
| Antibody | Human anti-riboP | Immunovision | PAG-3000 | Immunoblotting |
| Antibody | Rabbit anti-RPL7 | Abcam | Catalog number: ab72550, RRID:AB_1270391 | Immunoblotting |
| Antibody | Rabbit anti-RPL26 | Bethyl Laboratories | Catalog number: A300-686A, RRID:AB_530289 | Immunoblotting |
| Antibody | Mouse anti-beta actin | Invitrogen | Catalog number: MA1-140, RRID:AB_2536844 | Immunoblotting |
| Antibody | Rabbit anti-HSP90 | Santa Cruz | Discontinued | Immunoblotting |
| Antibody | Rat anti-GRP94 | Enzo | Catalog number: ADI-SPA-850-D, RRID:AB_2039133 | Immunoblotting |
| Antibody | Rabbit anti-RPL28 | Abcam | Catalog number: ab138125 | Immunoblotting |
| Antibody | Rabbit anti-RPL6 | Abcam | Catalog number: ab176705 | Immunoblotting |
| Antibody | Mouse anti-PDI | Abcam | Catalog number: ab2792, RRID: AB_303304 | Immunoblotting |
| Antibody | Mouse anti-lamin A/C | Cell Signaling Technology | Catalog number: 4777, RRID:AB_1054575 | Immunoblotting |
| Antibody | Rabbit anti-fibrillarin | Cell Signaling Technology | Catalog number: 2639, RRID: AB_2278087 | Immunoblotting |
| Antibody | Mouse anti-RPS6 | Cell Signaling Technology | Catalog number: 2317, RRID:AB_2238583 | Immunoblotting |
| Antibody | Rabbit anti-histone H3 | Cell Signaling Technology | Catalog number: 4499, RRID:AB_10544537 | Immunoblotting |
| Antibody | Rabbit anti-RPL5 | Cell Signaling Technology | Catalog number: 51345, RRID:AB_279939 | Immunoblotting |
| Antibody | Rabbit anti-RPS3 | Cell Signaling Technology | Catalog number: 9538, RRID:AB_10622028 | Immunoblotting |
| Commercial assay or kit | Alexa Flour 647 Protein Labelling Kit | Invitrogen | Cat#: A20173 | Used to label anti-puromycin Ab, used at 1 μl per test for FACS |
| Peptide, recombinant protein | SIINFEKL | Research Technology Branch, NIAID | N/A | For T cell activation |
| Strain, strain background | vaccinia virus NP (366NT60)-SIINFEKL-tdTomato | This paper | N/A | |
| Chemical compound/drug | Leucine, L-[4,5-3H], 1 mCi | Revvity | Cat.#: NET1166001MC | (0.2 mCi/ml) |
| Commercial assay or kit | DC Protein Assay Kit I | Bio-Rad | Cat.#: 5000111 | Protein quantification |
| Recombinant DNA reagent | CleanCap EGFP mRNA | Tri-Link | Cat.#: L-7601 | Spike in standard for RNA quantification |
| Commercial assay or kit | Agilent RNA 6000 Nano Kit | Agilent | Cat.#: 5067 – 1511 | RNA quantification |
Additional files
Download links
A two-part list of links to download the article, or parts of the article, in various formats.
Downloads (link to download the article as PDF)
Open citations (links to open the citations from this article in various online reference manager services)
Cite this article (links to download the citations from this article in formats compatible with various reference manager tools)
Paradoxical imbalance between activated lymphocyte protein synthesis capacity and rapid division rate
eLife 12:RP89015.
https://doi.org/10.7554/eLife.89015.3


