Gut microbiota-derived gamma-aminobutyric acid from metformin treatment reduces hepatic ischemia/reperfusion injury through inhibiting ferroptosis
- Institute of Ischemia/Reperfusion Injury, School of Basic Medical Science, Wenzhou Medical University, China
- Nottingham Ningbo China Beacons of Excellence Research and Innovation Institute, The University of Nottingham Ningbo, China
- Suzhou Inhal Pharma Co., Ltd., China
- Wenzhou Key Laboratory of Sanitary Microbiology, Wenzhou Medical University, China
- Department of Gastroenterology, The Second Affiliated Hospital and Yuying Children’s Hospital of Wenzhou Medical University, China
- Medical School of Ningbo University, Ningbo University, China
Figures
Figure 1
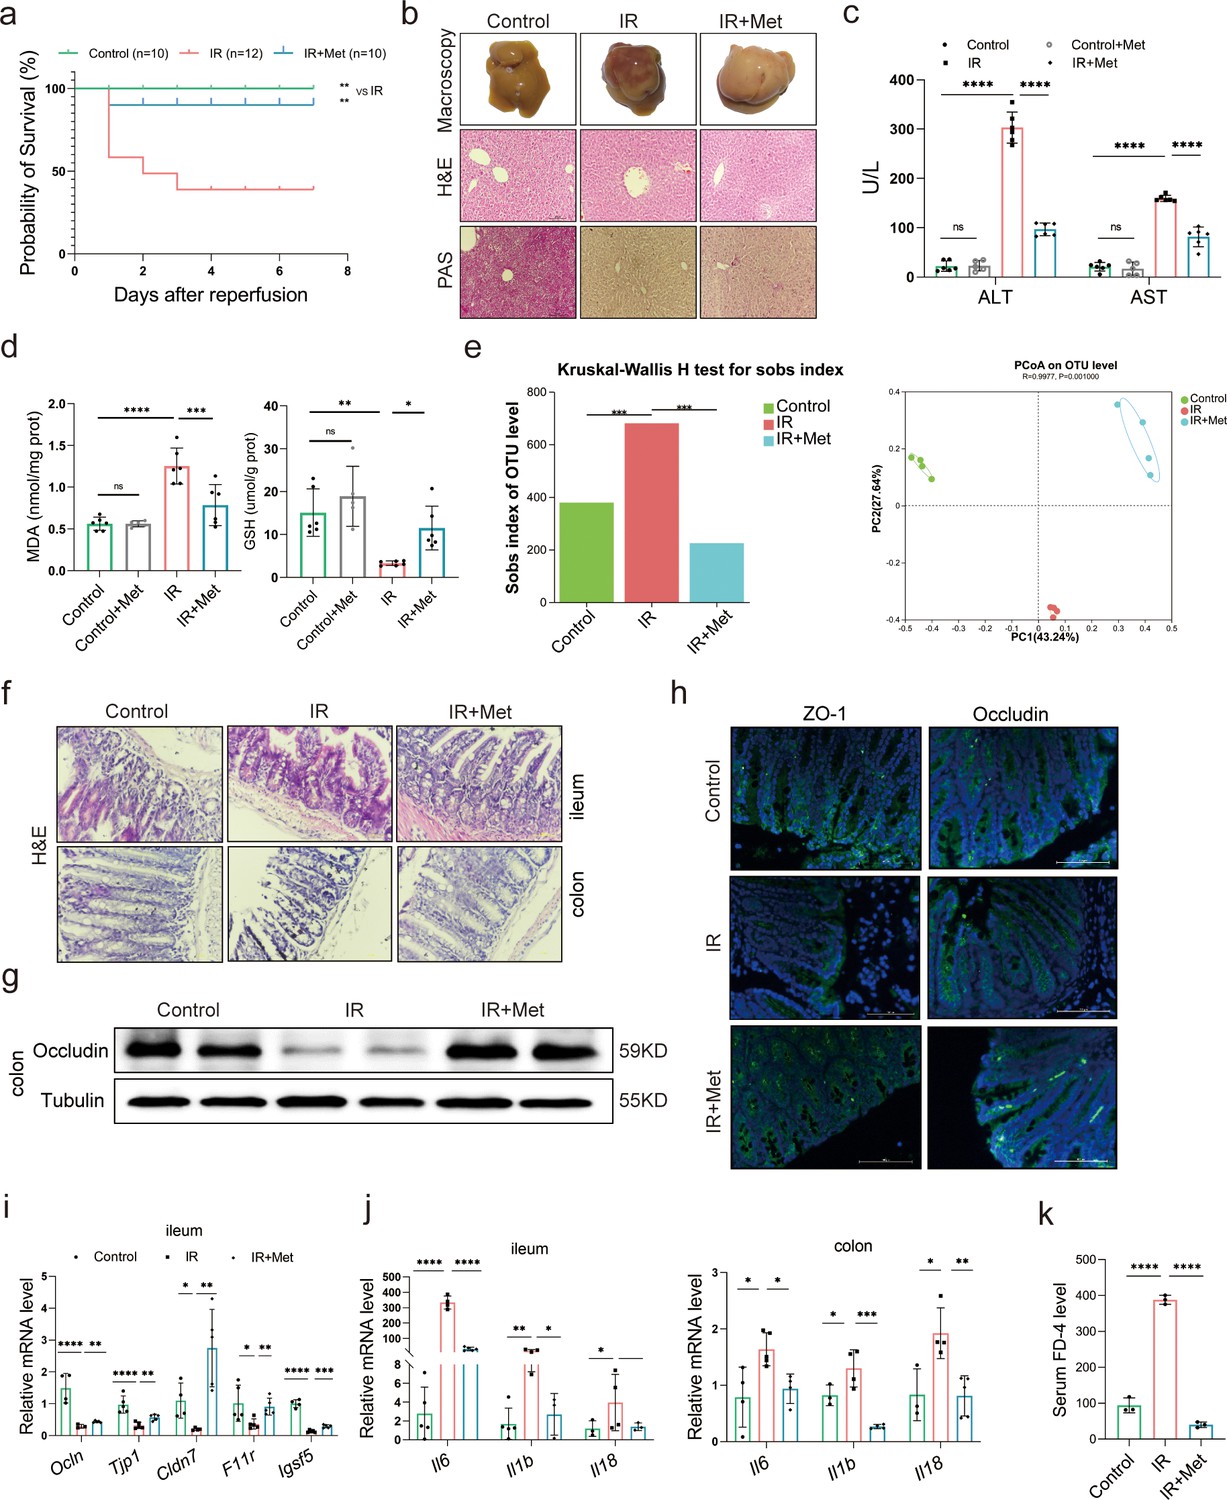
Metformin significantly mitigates hepatic ischemia/reperfusion injury (HIRI) by reshaping gut microbiota in mice.
(a) Survival rate analysis (n = 10–12/group), Kaplan–Meier was used to analyze statistical differences (Control vs IR, and IR + Met vs IR). (b) Morphological appearance, hematoxylin–eosin (H&E) and periodic acid-Schiff (PAS) staining of liver (n = 3/group). (c) Serum alanine transaminase (ALT) and aspertate aminotransferase (AST) levels. (d) Levels of malondialdehyde (MDA) and glutathione (GSH) in liver tissue. (e) Sobs index, PCoA(principal co-ordinates analysis) (n = 4/group). (f) H&E staining of ileum and colon (n = 3/group). (g) Western blot of Occludin in colon (n = 3/group). (h) IFC of ZO-1 and Occludin in colon (n = 3/group). (i) Quantitative real-time PCR (qRT-PCR) analysis of Ocln, Tjp1, Cldn7, F11r, and Igsf5 in ileum. (j) Il6, Il1b, and Il18 in ileum and colon (n = 3–5/group). (k) FD-4 level in mice serum (n = 3). Data are expressed as mean ± standard deviation. One-way analysis of variance (ANOVA) was used to analyze statistical differences; *p < 0.05, **p < 0.01, and ***p < 0.001, p****<0.0001.
-
Figure 1—source data 1
Original file for the Western blot analysis in Figure 1g.
- https://cdn.elifesciences.org/articles/89045/elife-89045-fig1-data1-v1.zip
-
Figure 1—source data 2
PDF containing Figure 1g and original scans of the relevant Western blot analysis with highlighted bands and sample labels.
- https://cdn.elifesciences.org/articles/89045/elife-89045-fig1-data2-v1.zip
Figure 2
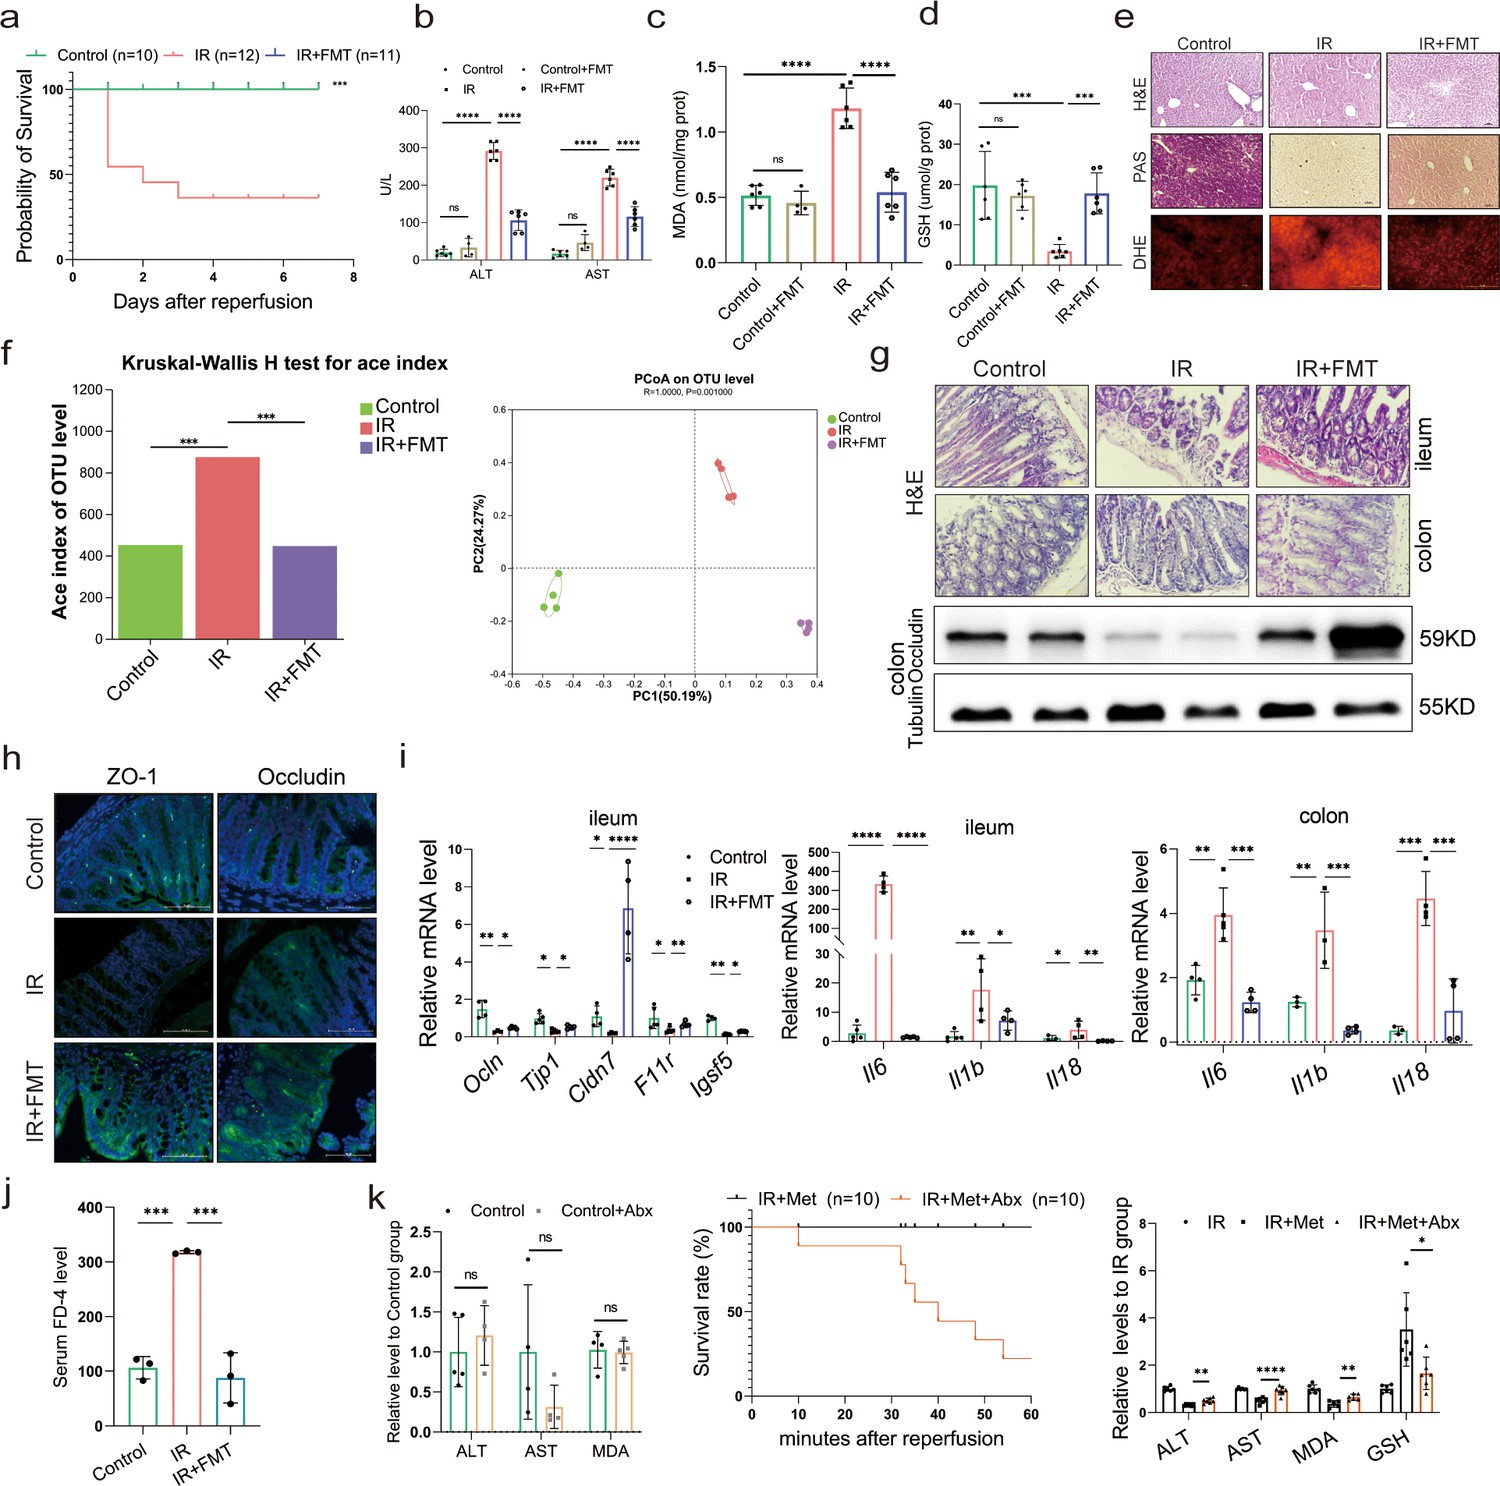
Metformin-reshaped fecal microbiota attenuates hepatic ischemia/reperfusion injury (HIRI).
(a) Survival rate analysis (n = 10–12/group), Kaplan–Meier was used to analyze statistical differences. (b) Serum alanine transaminase (ALT) and aspertate aminotransferase (AST) levels. Levels of malondialdehyde (MDA) (c) and glutathione (GSH) (d) in liver tissue. (e) Hematoxylin–eosin (H&E), periodic acid-Schiff (PAS), and dihydroethidium (DHE) staining of liver (n = 3/group). (f) Alpha diversity and PCoA level of mice microbes. (g) H&E staining of ileum and colon and Western blot analysis of Occludin in colon (n = 3/group). (h) IFC of ZO-1 and Occludin in colon (n = 3/group). (i) Quantitative real-time PCR (qRT-PCR) analysis of Ocln, Tjp1, Cldn7, F11r, and Igsf5 in ileum, and Il6, Il1b, and Il18 in ileum and colon (n = 3–5/group). (j) FD-4 level in mice serum (n = 3). (k) ALT, AST, and MDA detection between Control and Control + Abx group; survival rate of ischemia–reperfusion (IR) + Met + Abx group (n = 10), Kaplan–Meier was used to analyze statistical differences; and the levels of serum ALT, AST, liver MDA, Fe, and GSH in IR + Met + Abx group. Data are expressed as mean ± standard deviation. One-way analysis of variance (ANOVA) was used to analyze statistical differences; *p < 0.05, **p < 0.01, and ***p < 0.001, p****<0.0001.
-
Figure 2—source data 1
Original file for the Western blot analysis in Figure 2g.
- https://cdn.elifesciences.org/articles/89045/elife-89045-fig2-data1-v1.zip
-
Figure 2—source data 2
PDF containing Figure 2g and original scans of the relevant Western blot analysis with highlighted bands and sample labels.
- https://cdn.elifesciences.org/articles/89045/elife-89045-fig2-data2-v1.zip
Figure 3
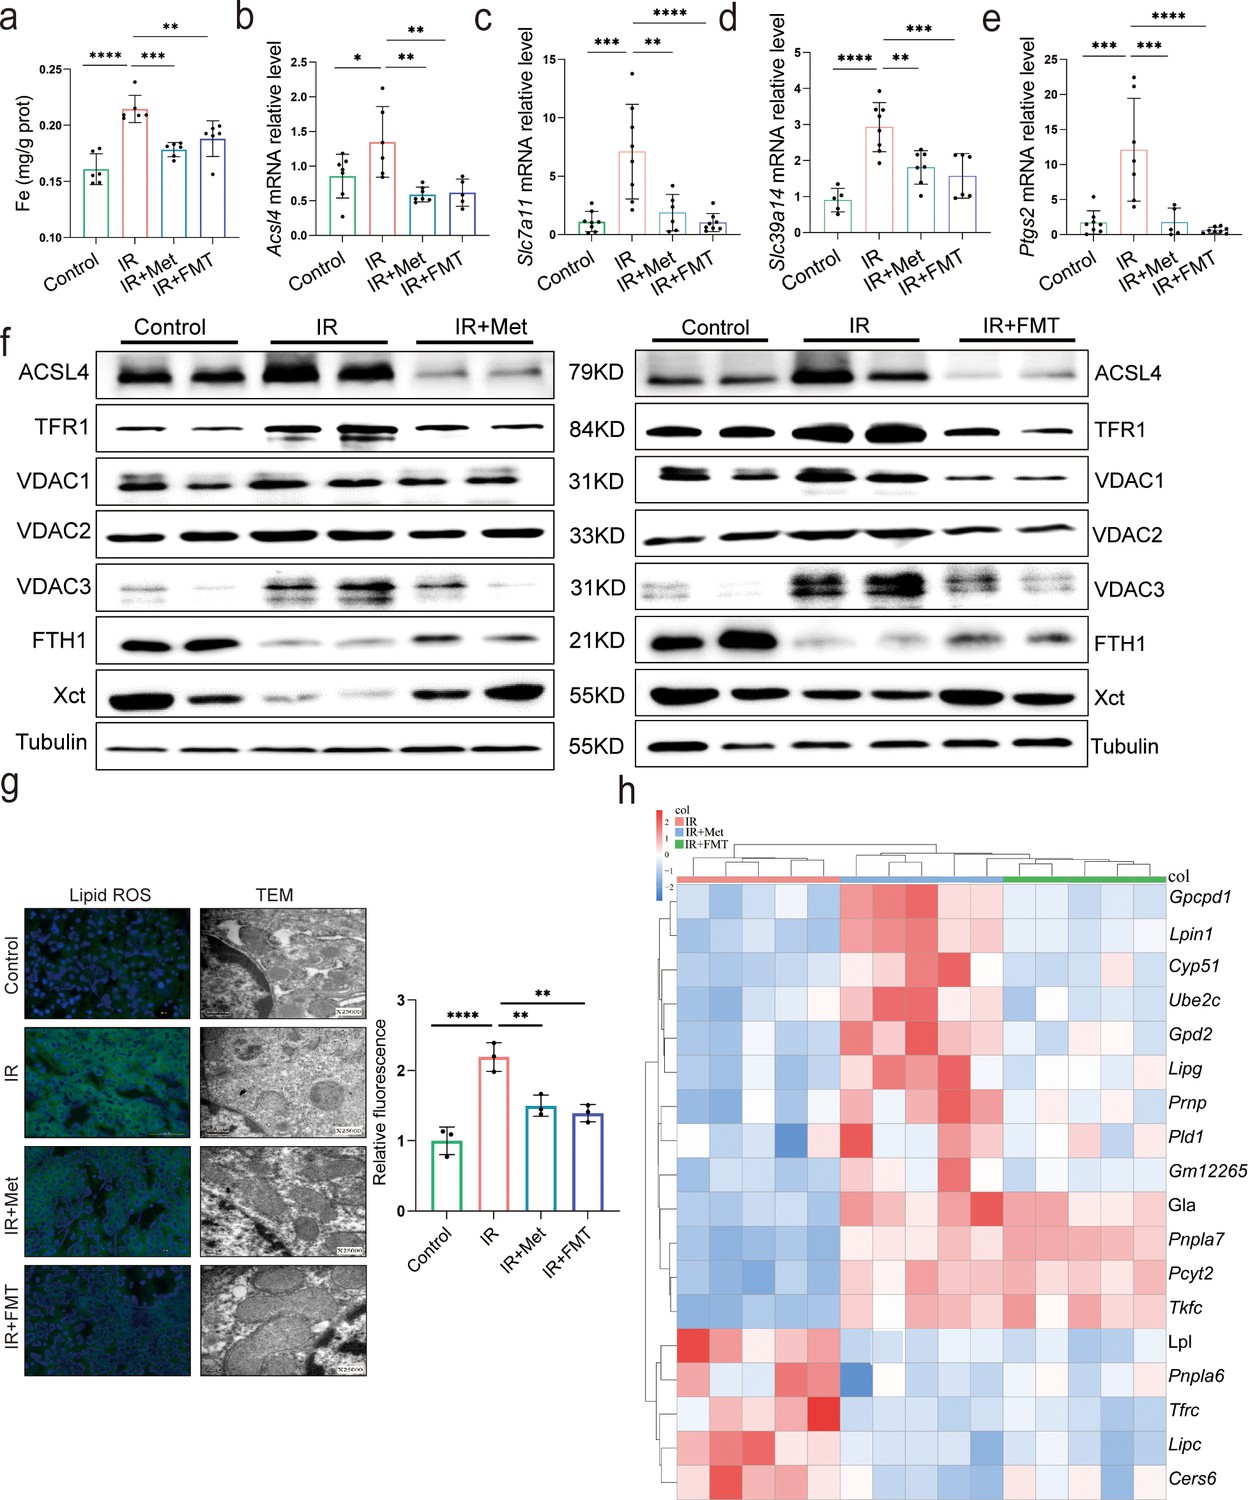
Metformin alleviates hepatic ischemia/reperfusion injury (HIRI) through inhibiting ferroptosis.
(a) Levels of Fe in liver tissue (n = 6). Quantitative real-time PCR (qRT-PCR) analysis of Acsl4 (b), Slc7a11 (c), Slc39a14 (d), and Ptgs2 (e) (n = 5–8/group). (f) Western blot analysis of ACSL4, FTH1, VDAC1, VDAC2, VDAC3, TFR1, and Xct in liver tissue (n = 3/group). (g) Lipid reactive oxygen species (ROS) staining and transmission electron microscopy (TEM) analysis of liver tissues (n = 3/group). (h) Ferroptosis-related transcriptome cluster diagram heatmap. Data are expressed as mean ± standard deviation. One-way analysis of variance (ANOVA) was used to analyze statistical differences; *p < 0.05, **p < 0.01, and ***p < 0.001, p****<0.0001.
-
Figure 3—source data 1
Original file for the Western blot analysis in Figure 3f.
- https://cdn.elifesciences.org/articles/89045/elife-89045-fig3-data1-v1.zip
-
Figure 3—source data 2
PDF containing Figure 3f and original scans of the relevant Western blot analysis with highlighted bands and sample labels.
- https://cdn.elifesciences.org/articles/89045/elife-89045-fig3-data2-v1.zip
Figure 4
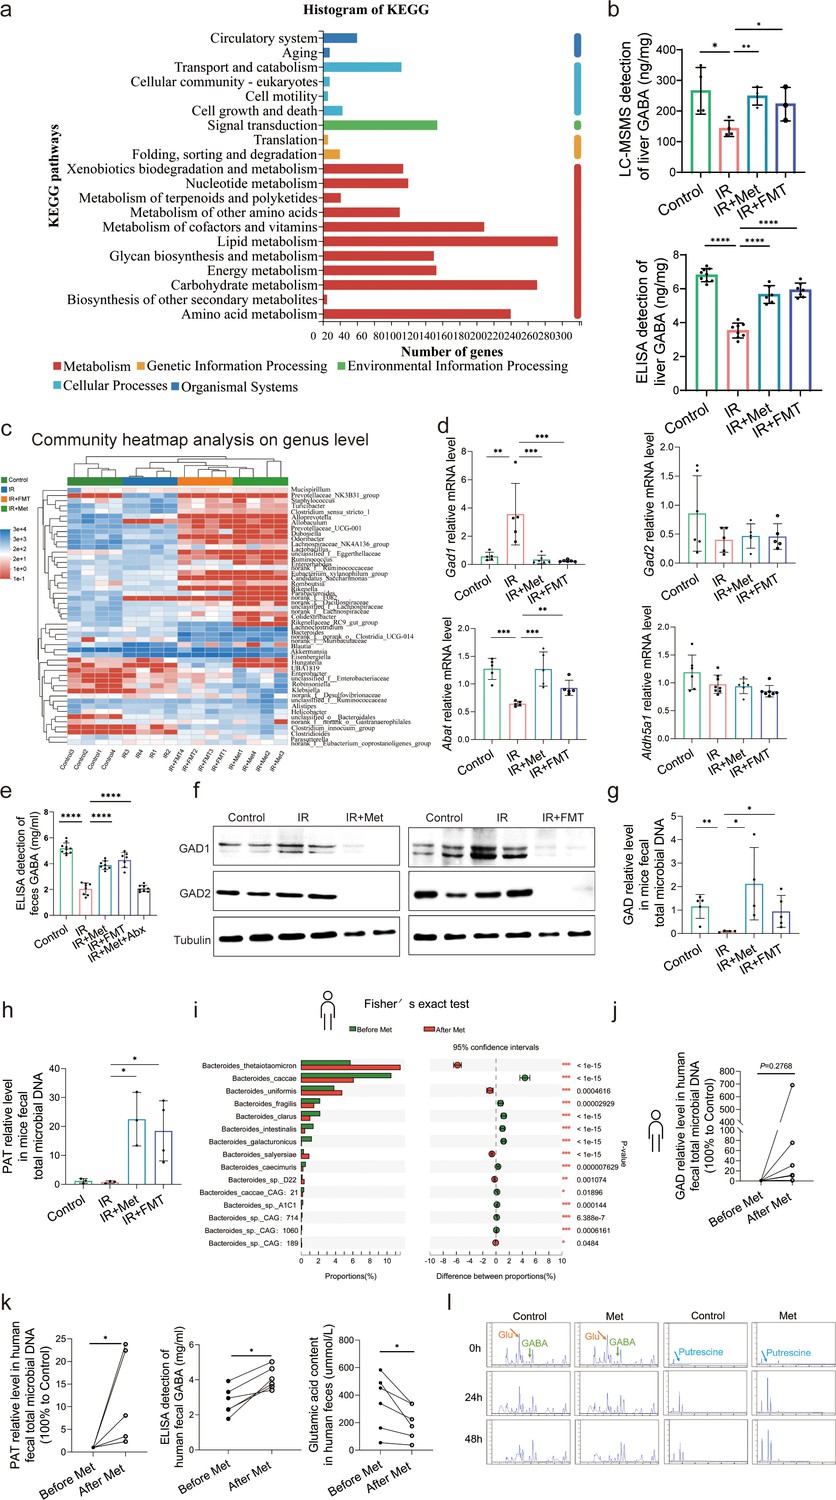
Metformin induces gamma-aminobutyric acid (GABA)-producing gut microbiota.
(a) KEGG analysis of transcriptome. (b) High-performance liquid chromatography with tandem mass spectrometric detection (HPLC–MS/MS) of GABA content in liver, ELISA of GABA in liver (n = 6–9/group). (c) Community heatmap analysis on genus level. (d) Quantitative real-time PCR (qRT-PCR) analysis of key metabolite enzyme glutamate decarboxylase 1 (Gad1), glutamic acid decarboxylase 2 (Gad2), 4-aminobutyrate aminotransferase (Abat), and aldhehyde dehydrogenase family 5 (Aldh5a1) in liver (n = 5–8/group). (e) ELISA of GABA in feces (n = 7–10/group). (f) Western blot analysis of GAD1 and GAD2 in liver. (g, h) qRT-PCR analysis of glutamic acid decarboxylase (GAD) and putrescine aminotransferase (PAT) in mice feces (n = 3–5/group). (i) Metagenomic sequencing analysis of human feces. (j, k) The level of GAD, PAT, GABA, and Glu in human feces (n = 5–6/group). (l) The level of GABA, Glu, and putrescine in human feces vitro culture (n = 3/group). Data are expressed as mean ± standard deviation. One-way analysis of variance (ANOVA) was used to analyze statistical differences; *p < 0.05, **p < 0.01, and ***p < 0.001, p****<0.0001.
-
Figure 4—source data 1
Original file for the Western blot analysis in Figure 4f.
- https://cdn.elifesciences.org/articles/89045/elife-89045-fig4-data1-v1.zip
-
Figure 4—source data 2
PDF containing Figure 4f and original scans of the relevant Western blot analysis with highlighted bands and sample labels.
- https://cdn.elifesciences.org/articles/89045/elife-89045-fig4-data2-v1.zip
Figure 5
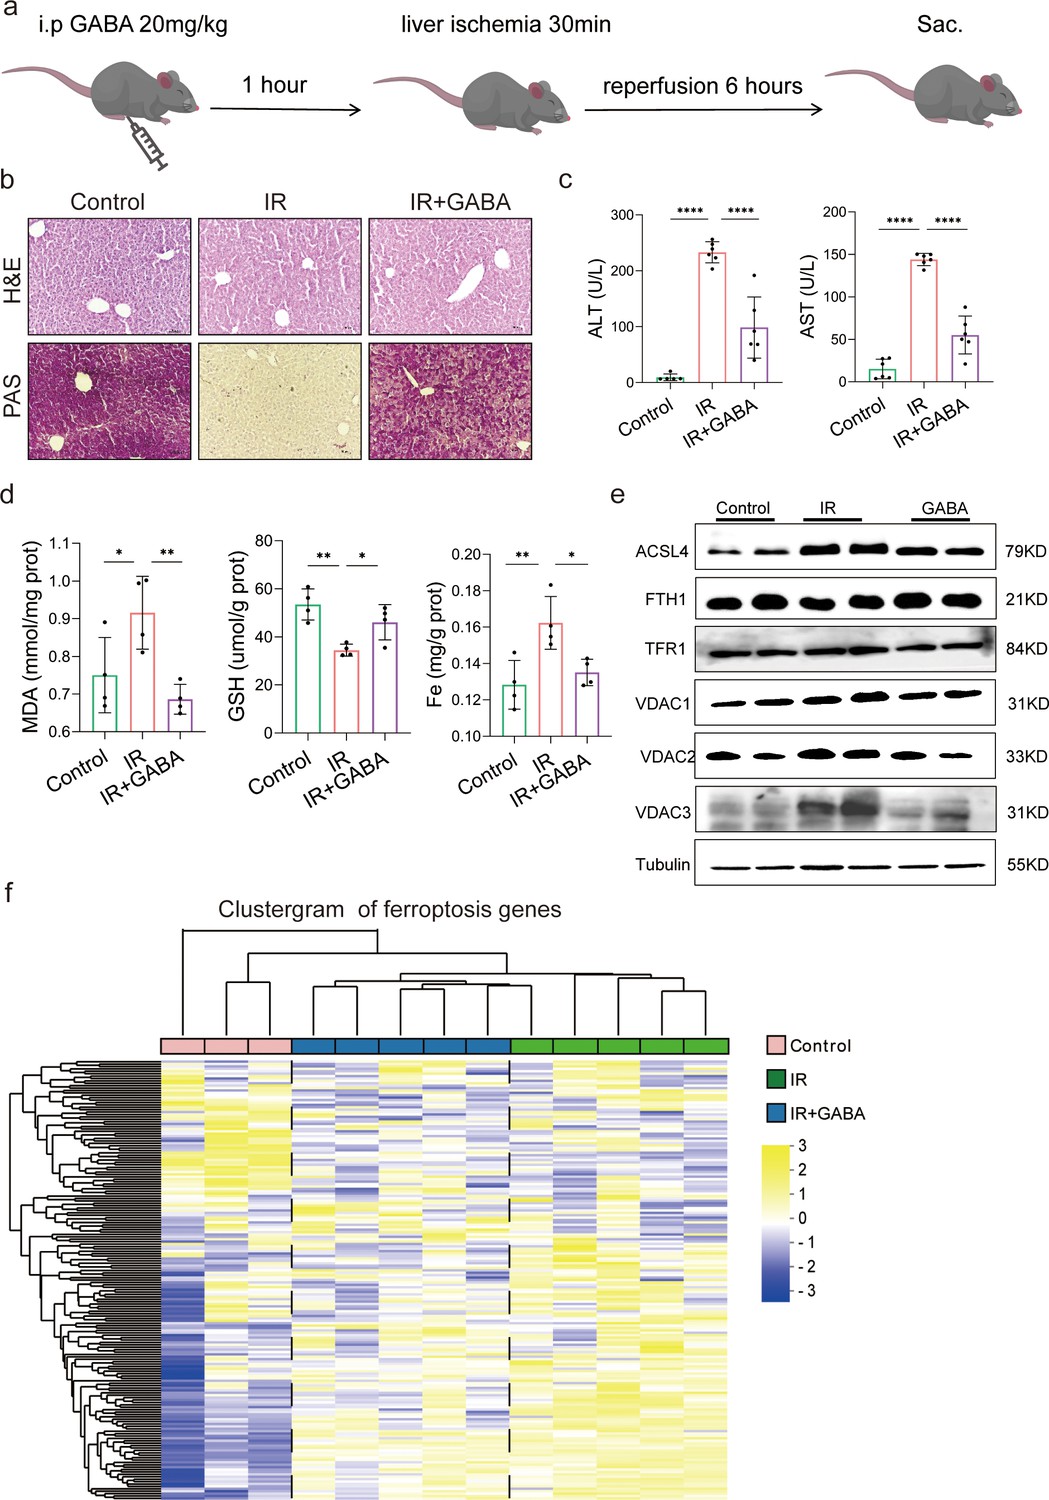
Gamma-aminobutyric acid (GABA) is the critical metabolite of metformin-reshaped gut microbiota against hepatic ischemia/reperfusion injury (HIRI)-induced ferroptosis.
(a) Diagram of GABA treatment experiment on mice model. (b) Hematoxylin–eosin (H&E) and periodic acid-Schiff (PAS) staining of liver (n = 3/group). (c) Serum alanine transaminase (ALT) and aspertate aminotransferase (AST) levels (n = 6/group). Levels of malondialdehyde (MDA), glutathione (GSH), and Fe in liver tissues (d) (n = 4/group). (e) Western blot analysis of ASCL4, FTH1, TFR1, and VADC1,2,3 in liver (n = 4/group). (f) Ferroptosis-related transcriptome cluster diagram heatmap (n = 3–5/group). Data are expressed as mean ± standard deviation. One-way analysis of variance (ANOVA) was used to analyze statistical differences; *p < 0.05, **p < 0.01, and ***p < 0.001, p****<0.0001.
-
Figure 5—source data 1
Original file for the Western blot analysis in Figure 5e.
- https://cdn.elifesciences.org/articles/89045/elife-89045-fig5-data1-v1.zip
-
Figure 5—source data 2
PDF containing Figure 5e and original scans of the relevant Western blot analysis with highlighted bands and sample labels.
- https://cdn.elifesciences.org/articles/89045/elife-89045-fig5-data2-v1.zip
Additional files
-
Supplementary file 1
Sequence list of relevant mouse genes.
- https://cdn.elifesciences.org/articles/89045/elife-89045-supp1-v1.xlsx
-
Supplementary file 2
Source list of antibiotics used in the article.
- https://cdn.elifesciences.org/articles/89045/elife-89045-supp2-v1.xlsx
-
Supplementary file 3
Data of ferroptosis inhibitor DFO treatment experiments.
- https://cdn.elifesciences.org/articles/89045/elife-89045-supp3-v1.pdf
-
Supplementary file 4
Heatmap of ferroptosis gene cluster in each group.
- https://cdn.elifesciences.org/articles/89045/elife-89045-supp4-v1.pdf
-
Supplementary file 5
Heatmap of amino acid content detection in each group.
- https://cdn.elifesciences.org/articles/89045/elife-89045-supp5-v1.pdf
-
Supplementary file 6
Sequence list of Bacteroides common genes PAT and GAD.
- https://cdn.elifesciences.org/articles/89045/elife-89045-supp6-v1.pdf
-
Supplementary file 7
Venn diagram of genes in each group.
- https://cdn.elifesciences.org/articles/89045/elife-89045-supp7-v1.pdf
-
MDAR checklist
- https://cdn.elifesciences.org/articles/89045/elife-89045-mdarchecklist1-v1.docx
Download links
A two-part list of links to download the article, or parts of the article, in various formats.
Downloads (link to download the article as PDF)
Open citations (links to open the citations from this article in various online reference manager services)
Cite this article (links to download the citations from this article in formats compatible with various reference manager tools)
Gut microbiota-derived gamma-aminobutyric acid from metformin treatment reduces hepatic ischemia/reperfusion injury through inhibiting ferroptosis
eLife 12:RP89045.
https://doi.org/10.7554/eLife.89045.4


