Epistasis between mutator alleles contributes to germline mutation spectrum variability in laboratory mice
- Department of Human Genetics, University of Utah, United States
- Department of Biomedical Informatics, University of Utah, United States
- Department of Genome Sciences, University of Washington, United States
- Herbold Computational Biology Program, Fred Hutch Cancer Center, United States
Figures
Figure 1 with 4 supplements
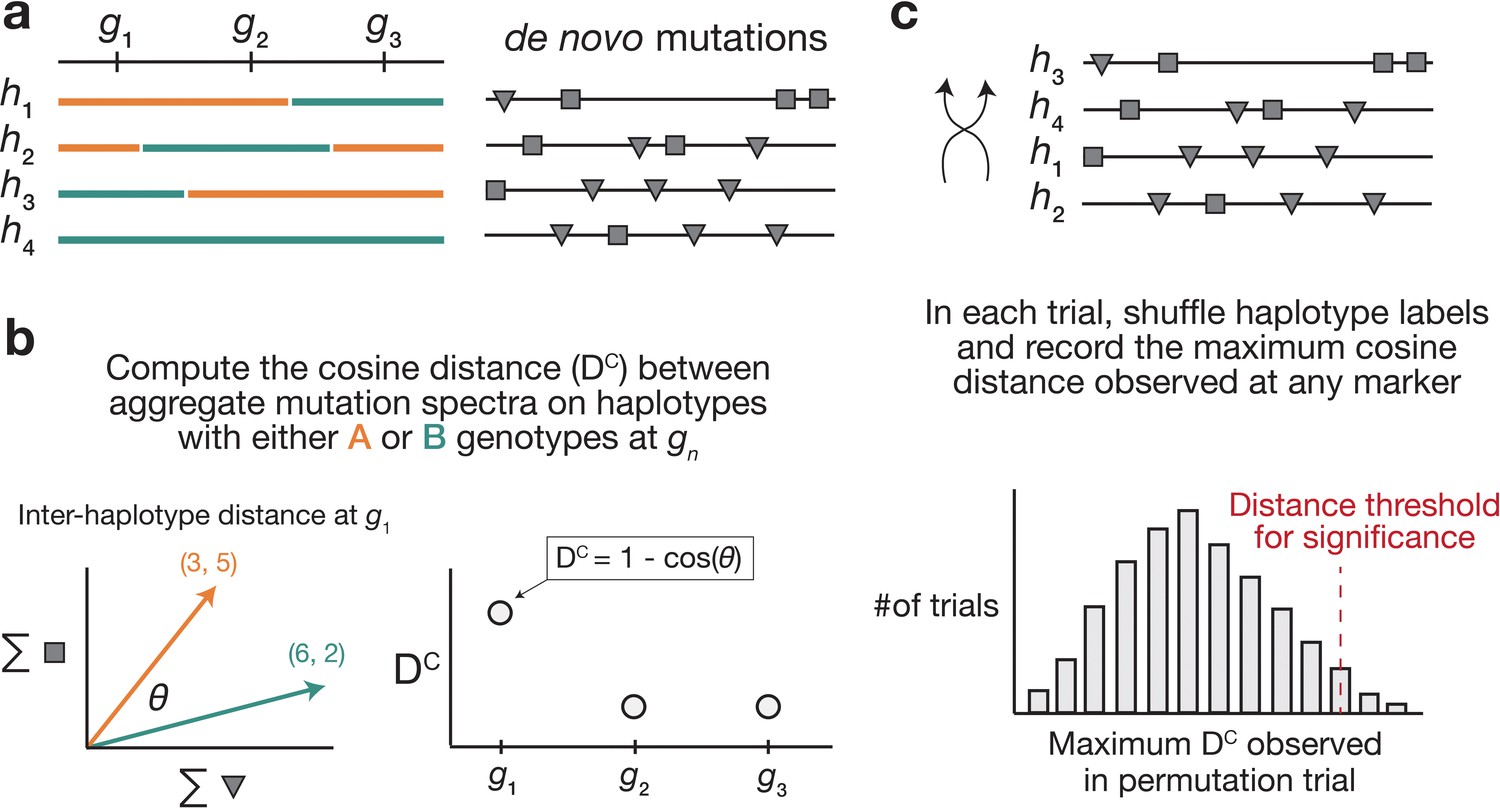
Overview of aggregate mutation spectrum distance method for discovering mutator alleles.
(a) A population of four haplotypes has been genotyped at three informative markers ( through ); each haplotype also harbors unique de novo germline mutations. In practice, de novo mutations are partitioned by k-mer context; for simplicity in this toy example, de novo mutations are simply classified into two possible mutation types (gray squares represent C>(A/T/G) mutations, while gray triangles represent A>(C/T/G) mutations). (b) At each informative marker , we calculate the total number of each mutation type observed on haplotypes that carry each parental allele (i.e. the aggregate mutation spectrum) using all genome-wide de novo mutations. For example, haplotypes with A (orange) genotypes at carry a total of three ‘triangle’ mutations and five ‘square’ mutations, and haplotypes with B (green) genotypes carry a total of six triangle and two square mutations. We then calculate the cosine distance between the two aggregate mutation spectra, which we call the ‘aggregate mutation spectrum distance’. Cosine distance can be defined as , where is the angle between two vectors; in this case, the two vectors are the two aggregate spectra. We repeat this process for every informative marker . (c) To assess the significance of any distance peaks in (b), we perform permutation tests. In each of permutations, we shuffle the haplotype labels associated with the de novo mutation data, run a genome-wide distance scan, and record the maximum cosine distance encountered at any locus in the scan. Finally, we calculate the percentile of the distribution of those maximum distances to obtain a genome-wide cosine distance threshold at the specified value of .
Figure 1—figure supplement 1
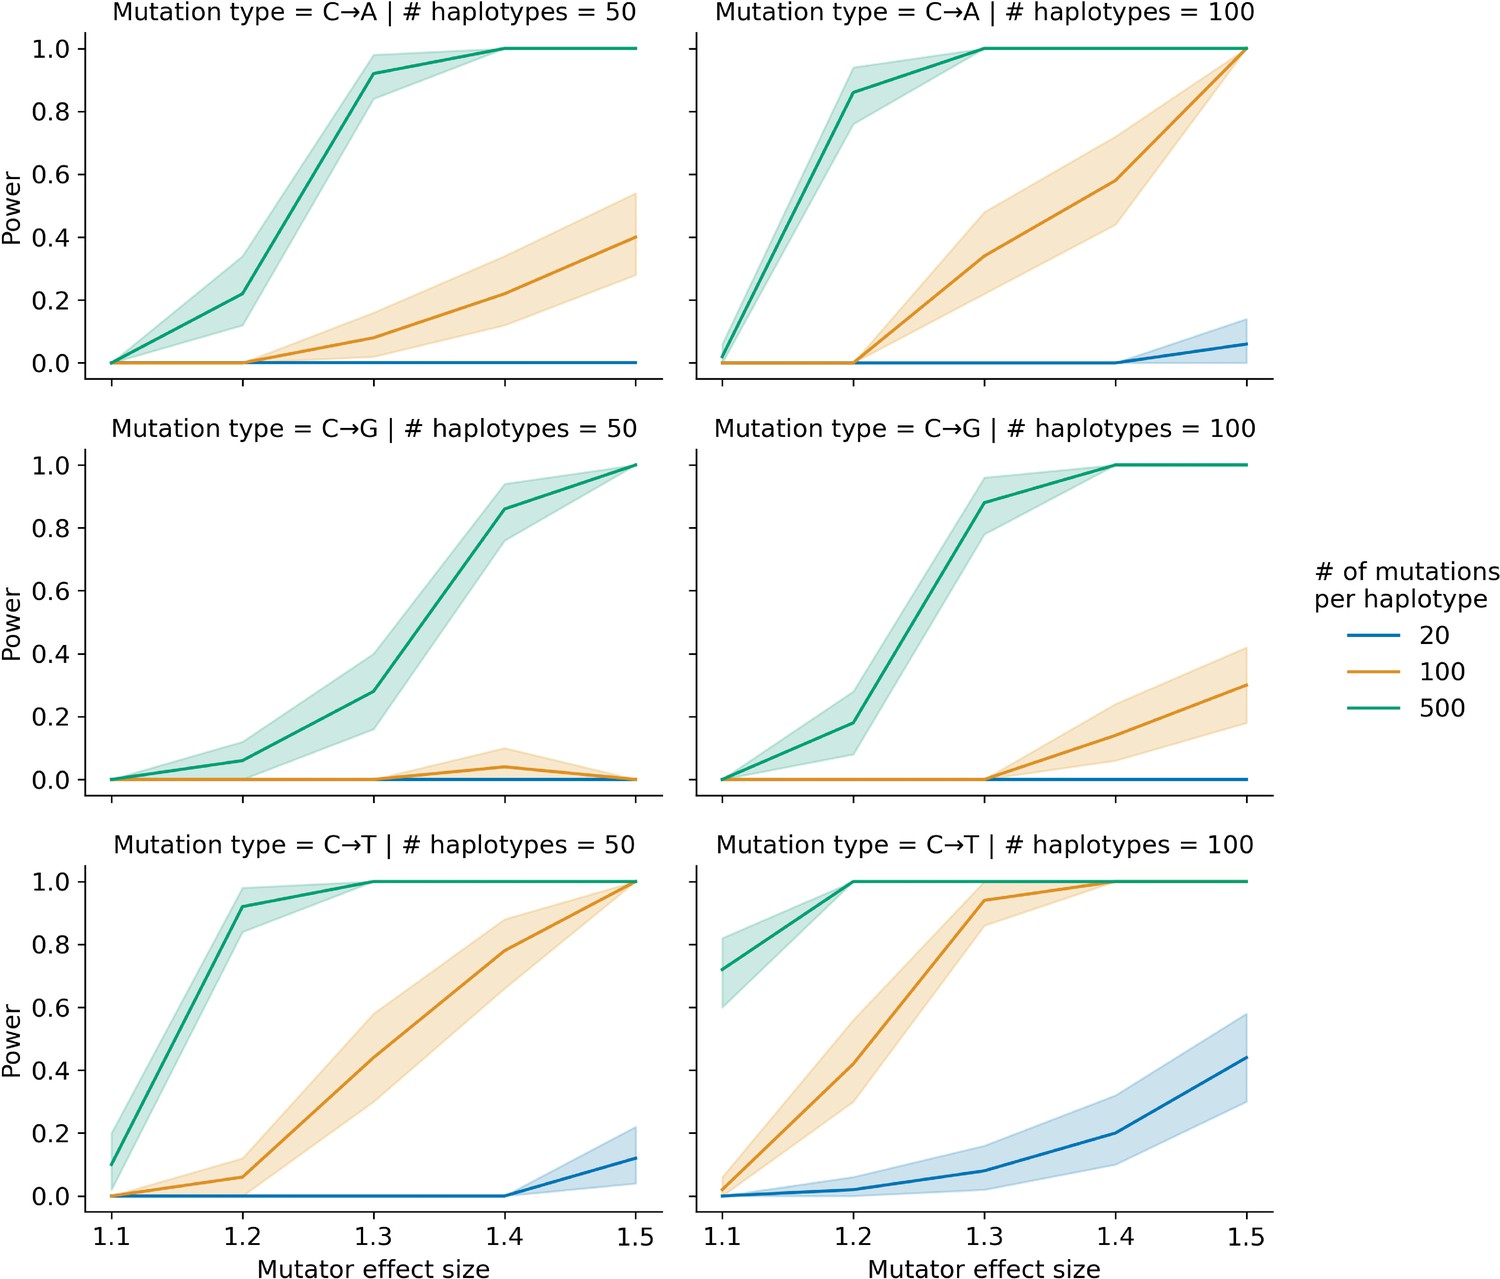
Simulations to assess the power of the aggregate mutation spectrum distance method.
In each of 50 trials, we simulated genotypes at 1000 biallelic loci in a toy population of either 50 or 100 haplotypes as follows: at every locus on every haplotype, we drew a single floating point value from a uniform distribution . If that value was less than or equal to 0.5, we set the allele to be ‘A’; otherwise, we set the allele to be ‘B’. In each trial, we also simulated de novo germline mutations on the population of haplotypes, such that at a single locus , we augmented the mutation rate of a particular k-mer by the specified effect size (an effect size of 1.5 indicates a 50% increase in the mutation rate) on haplotypes carrying ‘A’ alleles. We then applied the aggregate mutation spectrum distance method to these simulated data and asked if the adjusted cosine distance at locus was greater than expected by chance. Given a specific combination of parameters, the y-axis denotes the fraction of 50 trials in which the simulated mutator allele could be detected at a significance threshold of p = 0.05. Shaded areas indicate the 95% bootstrap confidence interval surrounding that estimate.
Figure 1—figure supplement 2
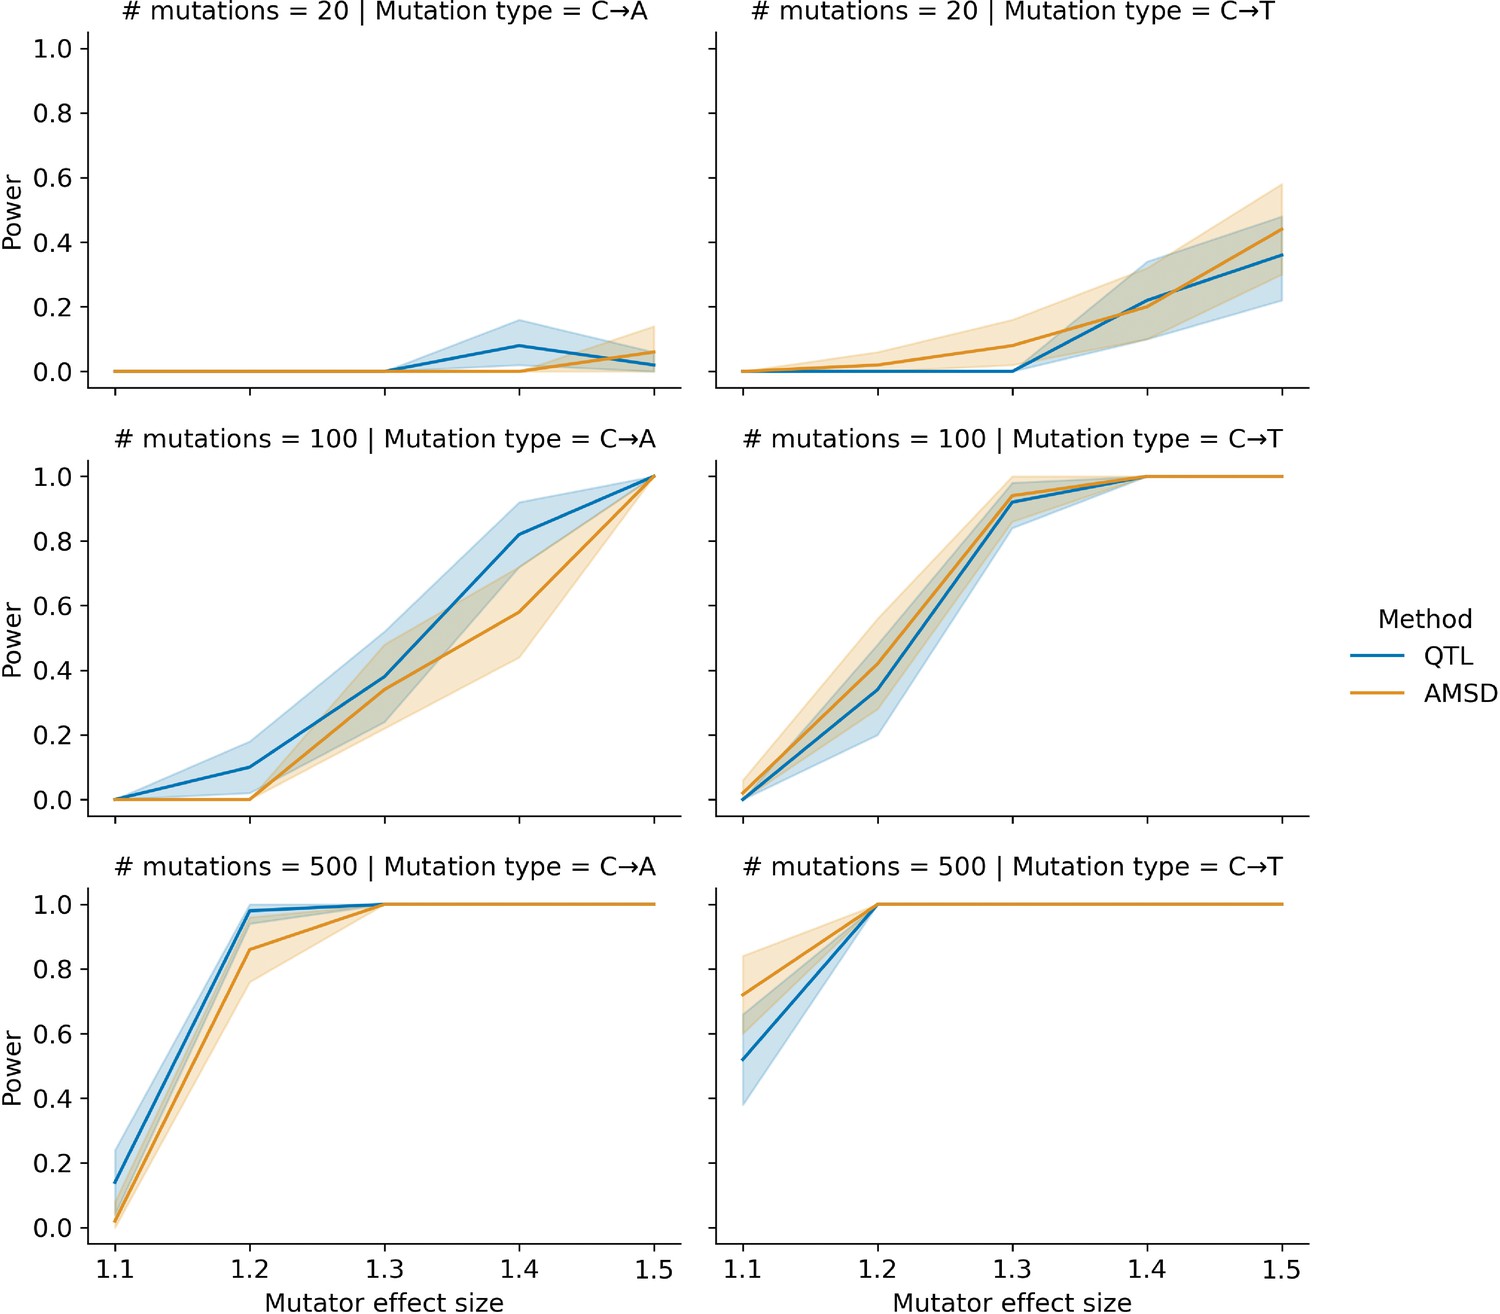
Comparing power between the aggregate mutation spectrum distance (AMSD) method and QTL mapping.
In each of 50 trials, we simulated genotypes at 1000 biallelic loci in a toy population of 100 haplotypes as follows: at every locus on every haplotype, we drew a single floating point value from a uniform distribution . If that value was less than or equal to 0.5, we set the allele to be ‘A’; otherwise, we set the allele to be ‘B’. In each trial, we also simulated de novo germline mutations on the population of haplotypes, such that at a single locus , we augmented the rate of the specified mutation type by the specified effect size (an effect size of 1.5 indicates a 50% increase in the mutation rate) on haplotypes carrying ‘A’ alleles. We then applied the AMSD method to these simulated data and asked if the adjusted cosine distance at locus was greater than expected by chance. Similarly, in each trial, we used R/qtl2 to perform a genome scan for QTL and asked if the log-odds score at was greater than expected by chance. Given a specific combination of parameters, the y-axis denotes the fraction of 50 trials in which the simulated mutator allele could be detected at a significance threshold of p = 0.05 (for AMSD) or at an alpha of (for QTL mapping). Shaded areas indicate the 95% bootstrap confidence interval surrounding that estimate.
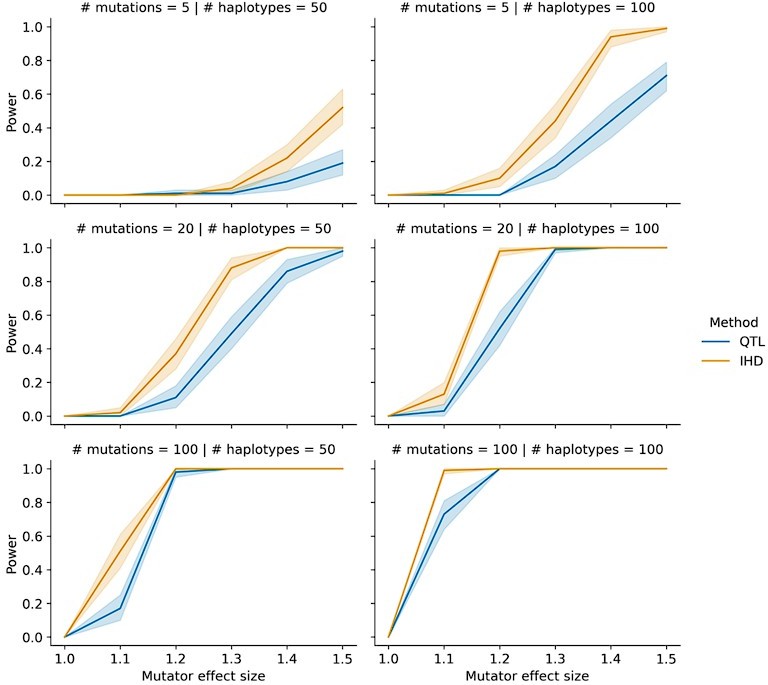
Figure 1—figure supplement 3
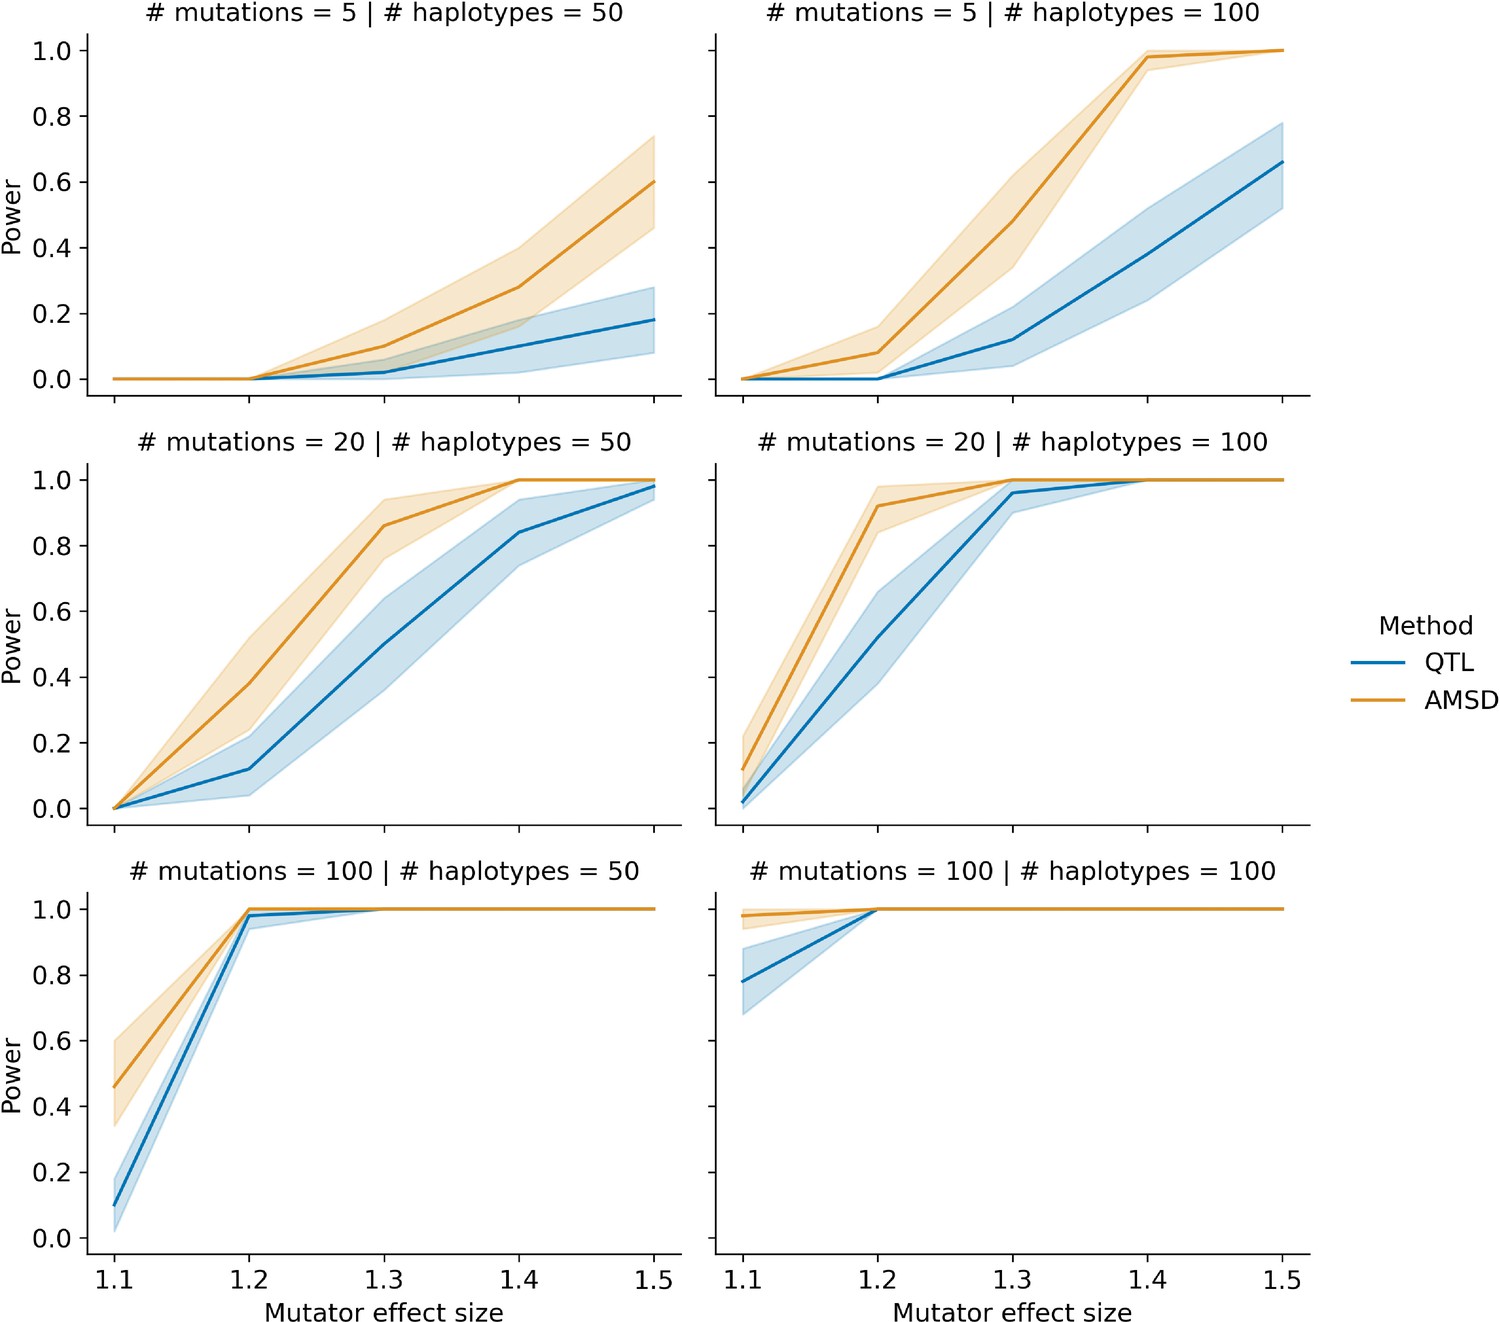
Comparing power between the aggregate mutation spectrum distance method (AMSD) and QTL mapping with variable counts of simulated mutations.
In each of 50 trials, we simulated genotypes at 1000 biallelic loci in a toy population of 50 or 100 haplotypes as follows: at every locus on every haplotype, we drew a single floating point value from a uniform distribution . If that value was less than or equal to 0.5, we set the allele to be ‘A’; otherwise, we set the allele to be ‘B’. In each trial, we also simulated de novo germline mutations on the population of haplotypes, such that at a single locus , we augmented the rate of the specified mutation type by the specified effect size (an effect size of 1.5 indicates a 50% increase in the mutation rate) on haplotypes carrying ‘A’ alleles. To more closely approximate the BXD recombinant inbred lines (RILs), the mean number of simulated mutations on each haplotype was allowed to vary by a factor of 20 (see Materials and methods for more details). We then applied the AMSD method to these simulated data and asked if the adjusted cosine distance at locus was greater than expected by chance. Similarly, in each trial, we used R/qtl2 to perform a genome scan for QTL and asked if the log-odds score at was greater than expected by chance. Given a specific combination of parameters, the y-axis denotes the fraction of 50 trials in which the simulated mutator allele could be detected at a significance threshold of p = 0.05 (for AMSD) or at an alpha of (for QTL mapping). Shaded areas indicate the 95% bootstrap confidence interval surrounding that estimate.
Figure 1—figure supplement 4
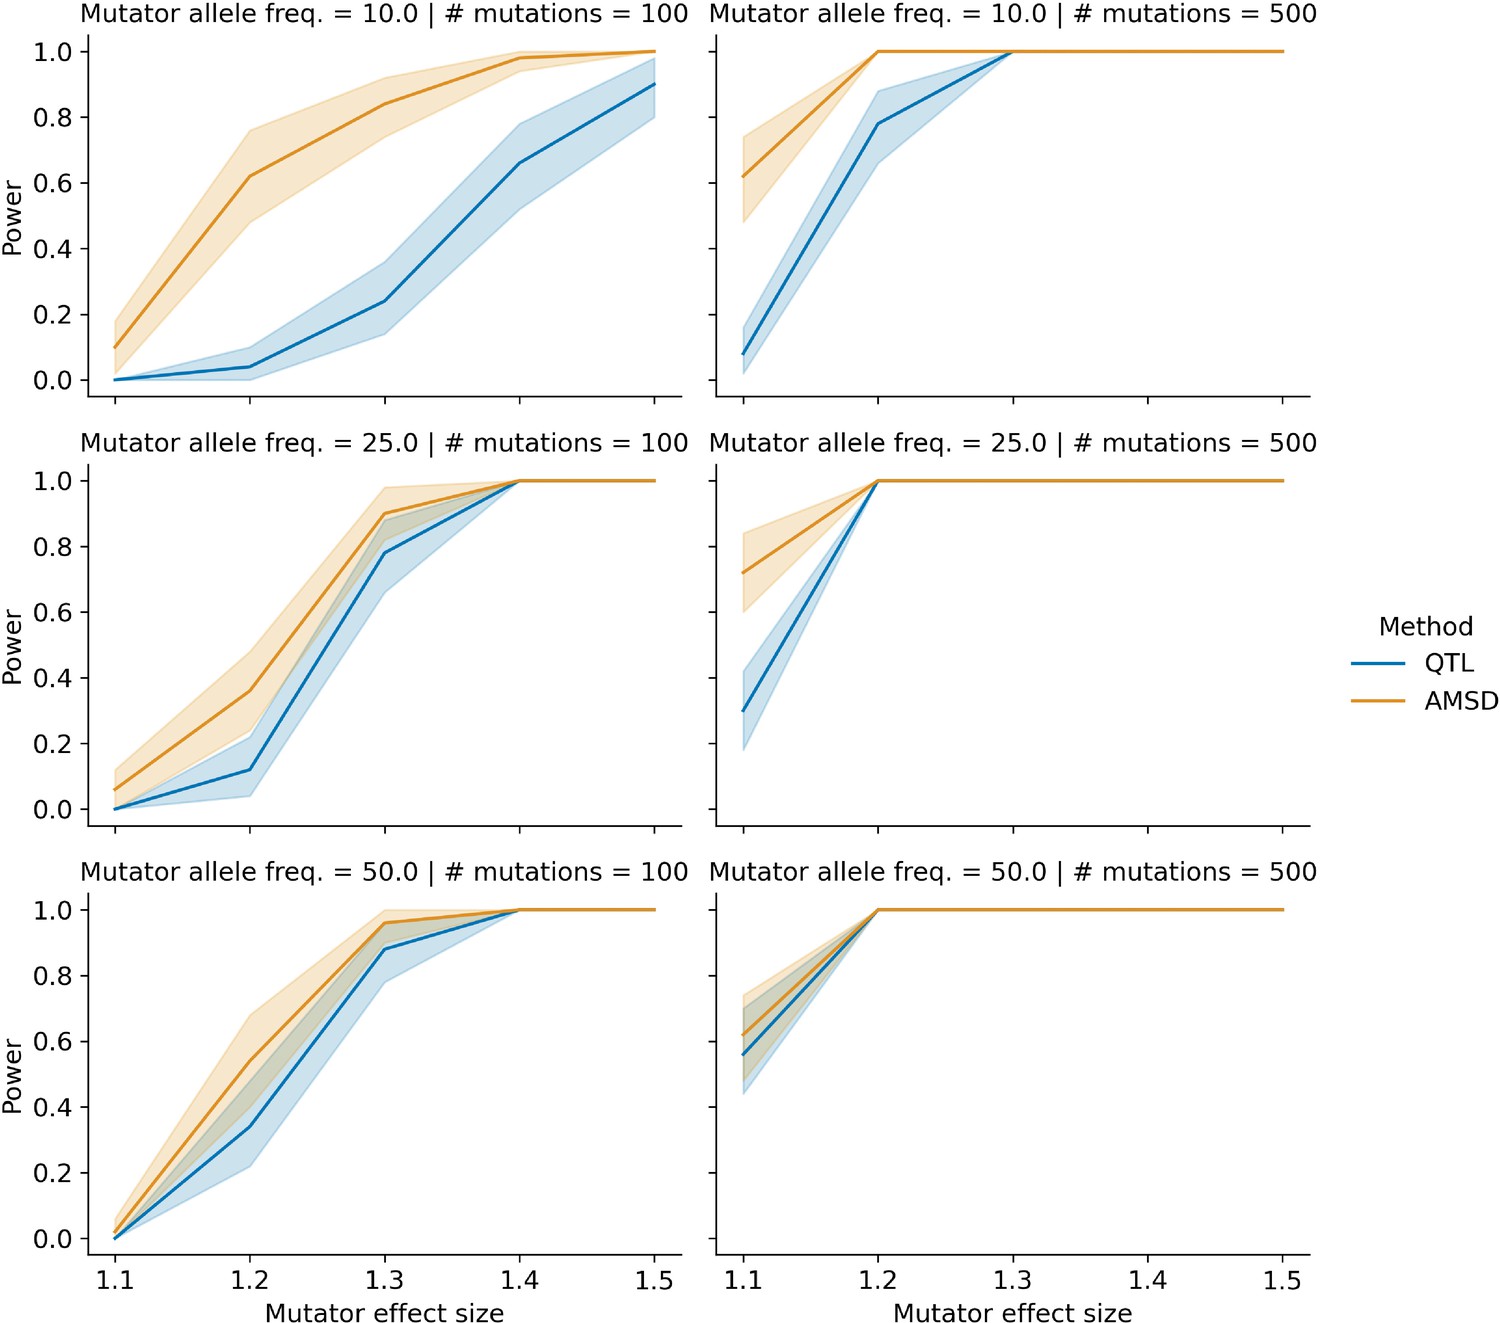
Comparing power between the aggregate mutation spectrum distance method (AMSD) and QTL mapping with variable mutator allele frequencies.
In each of 50 trials, we simulated genotypes at 1000 biallelic loci in a toy population of 100 haplotypes as follows: at every locus on every haplotype (other than the simulated mutator locus), we drew a single floating point value from a uniform distribution . If that value was less than or equal to 0.5, we set the allele to be ‘A’; otherwise, we set the allele to be ‘B’. To model the effects of mutator allele frequencies on AMSD and QTL power, we allowed the expected frequency of ‘A’ alleles at the mutator allele marker to be either 0.1, 0.25, or 0.5 in these simulations. In each trial, we also simulated de novo germline mutations on the population of haplotypes, such that at a single locus , we augmented the rate of the specified mutation type by the specified effect size (an effect size of 1.5 indicates a 50% increase in the mutation rate) on haplotypes carrying ‘A’ alleles. We then applied the AMSD method to these simulated data and asked if the adjusted cosine distance at locus was greater than expected by chance. Similarly, in each trial, we used R/qtl2 to perform a genome scan for QTL and asked if the log-odds score at was greater than expected by chance. Given a specific combination of parameters, the y-axis denotes the fraction of 50 trials in which the simulated mutator allele could be detected at a significance threshold of p=0.05 (for AMSD) or at an alpha of (for QTL mapping). Shaded areas indicate the 95% bootstrap confidence interval surrounding that estimate.
Figure 2 with 1 supplement
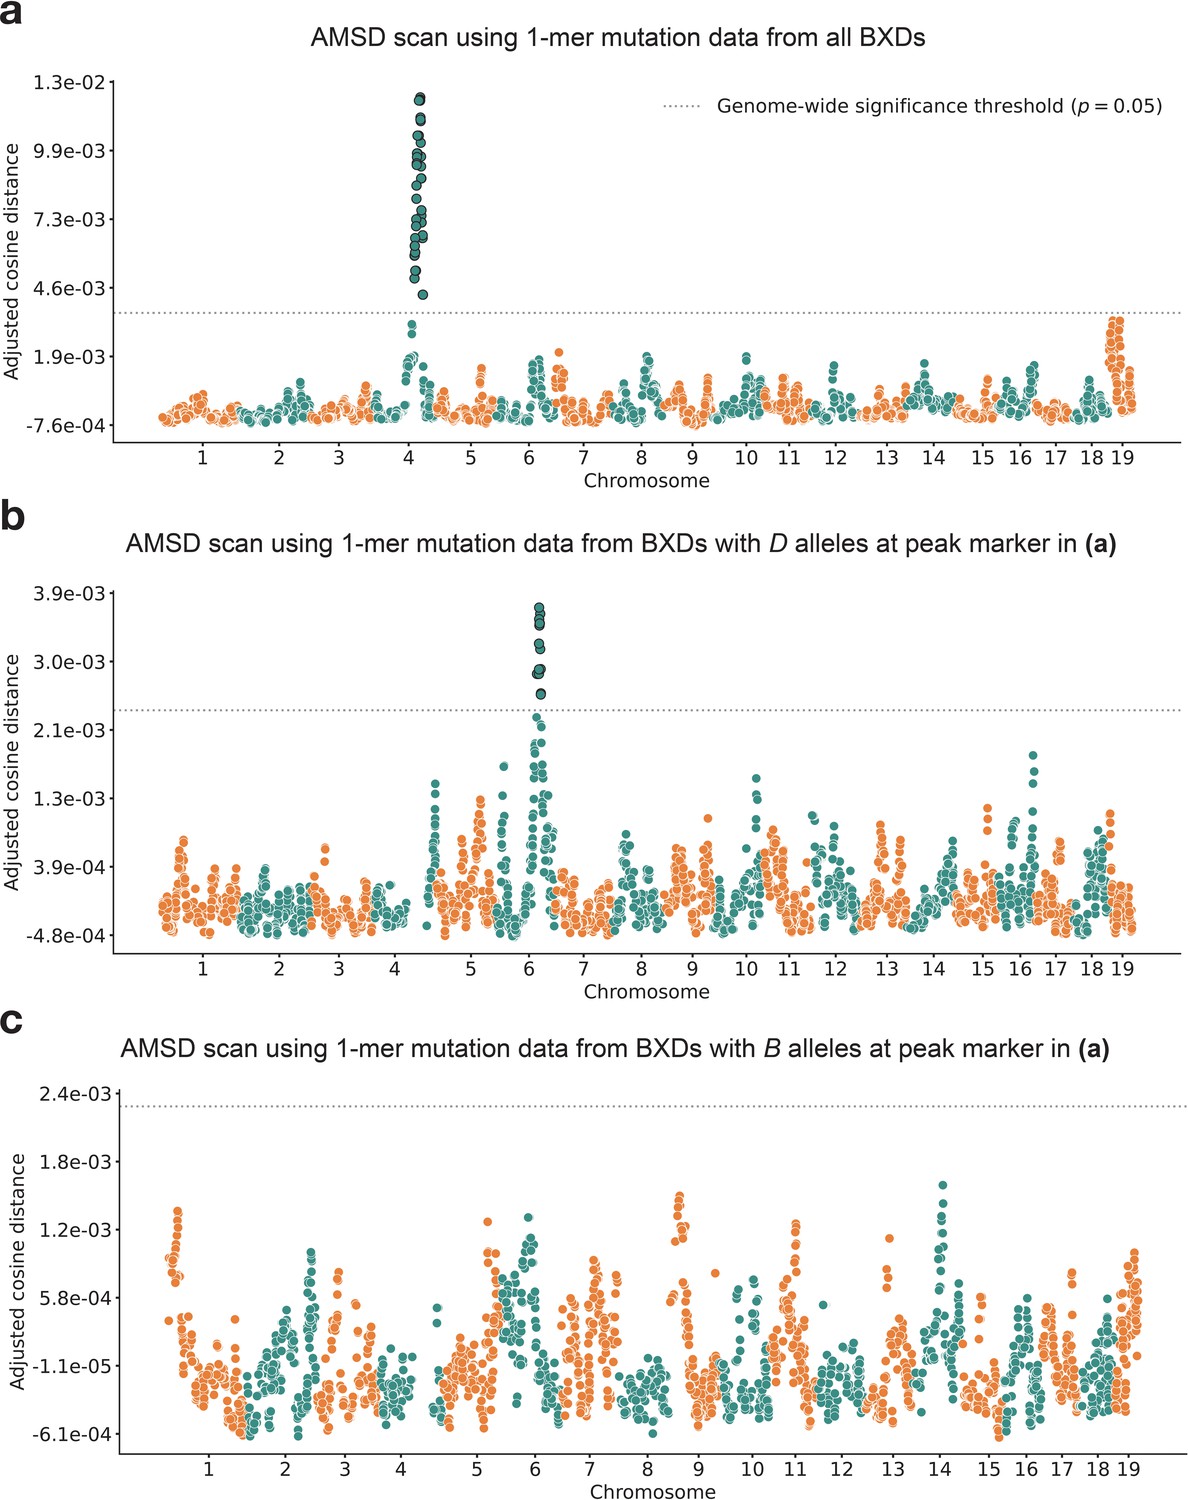
Results of aggregate mutation spectrum distance scans in the BXDs.
(a) Adjusted cosine distances between aggregate 1-mer de novo mutation spectra of BXD strains (n = 117 strains; 65,552 total mutations) with either D or B alleles at 7128 informative markers. Cosine distance threshold at p=0.05 was calculated by performing 10,000 permutations of the BXD mutation data, and is shown as a dotted gray line. (b) Adjusted cosine distances between aggregate 1-mer de novo mutation spectra of BXD strains with D alleles at rs27509845 (n = 66 strains; 42,171 total mutations) and either D or B alleles at 6957 informative markers. Cosine distance threshold at p = 0.05 was calculated by performing 10,000 permutations of the BXD mutation data, and is shown as a dotted gray line. (c) Adjusted cosine distances between aggregate 1-mer de novo mutation spectra on BXD strains with B alleles at rs27509845 (n = 44 strains; 22,645 total mutations) and either D or B alleles at 6957 informative markers. Cosine distance threshold at p = 0.05 was calculated by performing 10,000 permutations of the BXD mutation data, and is shown as a dotted gray line.
Figure 2—figure supplement 1
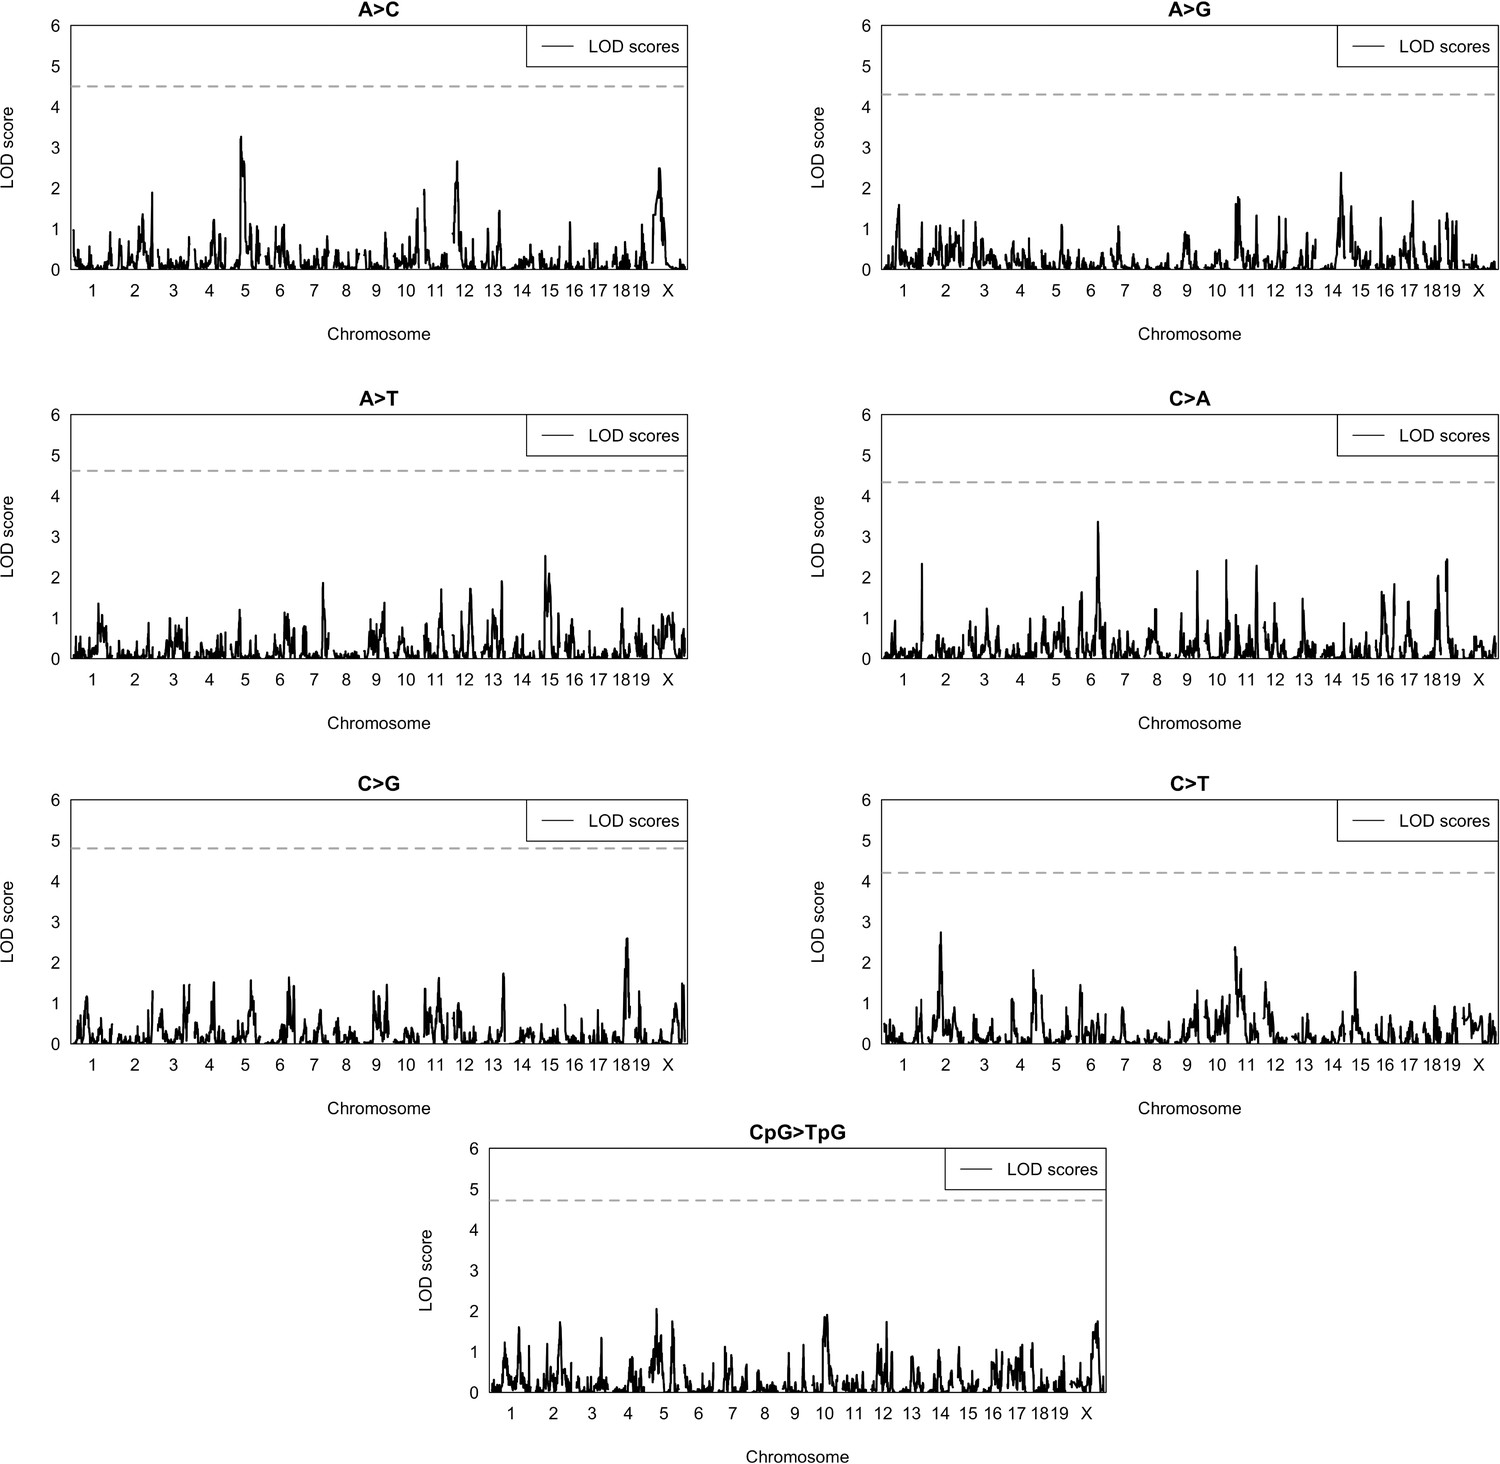
Quantitative trait locus (QTL) scans for mutation spectrum phenotypes.
Using the BXDs with D genotypes at rs27509845 (the marker with the highest inter-allelic cosine distance on chromosome 4; n = 66 BXDs, 42,171 total mutations), we used R/qtl2 to perform QTL scans for the fractions of each 1-mer mutation type. QTL scans also included a kinship matrix (that contained the pairwise genetic similarity between each pair of BXDs, calculated using the leave-one-chromosome-out method) as a random effect term using the kinship keyword argument in the scan1 function. Plots show the log-odds (LOD) score at every genotyped marker in blue; the dotted black line represents the genome-wide LOD significance threshold (established using 1000 permutations at an alpha of to account for the fact that 7 separate association tests were performed).
Figure 3 with 3 supplements
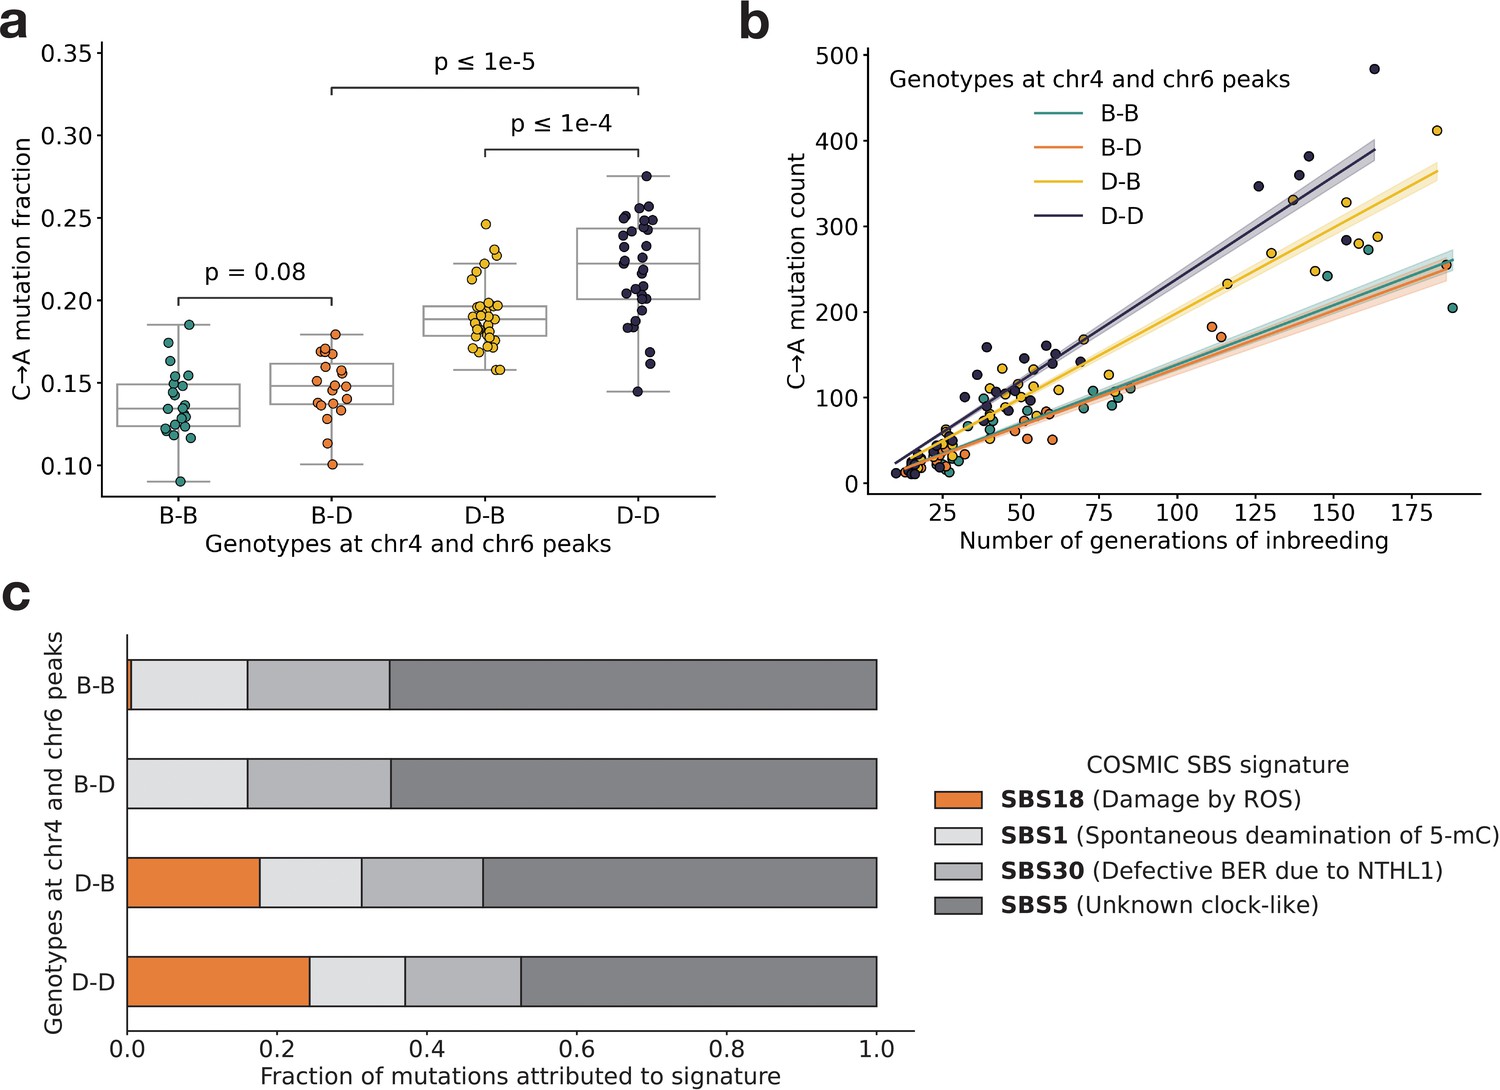
BXD mutation spectra are affected by alleles at both mutator loci.
(a) C>A de novo germline mutation fractions in BXDs with either D or B genotypes at markers rs27509845 (chr4 peak) and rs46276051 (chr6 peak). Distributions of C>A mutation fractions were compared with two-sided Mann-Whitney U-tests; annotated p-values are uncorrected. B-B vs. B-D comparison: U-statistic = 149.0, p = 7.58e-2; B-D vs D-D comparison: U-statistic = 21.0, p = 2.61e-8; D-B vs D-D comparison: U-statistic = 232.5, p = 6.99e-5. (b) The count of C>A de novo germline mutations in each BXD plotted against the number of generations for which it was inbred. Lines represent predicted C>A counts in each haplotype group from a generalized linear model (Poisson family, identity link), and shading around each line represents the 95% confidence interval. (c) Germline mutations in each BXD were assigned to COSMIC single-base substitution (SBS) mutation signatures using SigProfilerExtractor (Islam et al., 2022). After grouping BXDs by their genotypes at rs27509845 and rs46276051, we calculated the fraction of mutations in each group that was attributed to each signature. The proposed etiologies of each mutation signature are: SBS1 (spontaneous deamination of methylated cytosine nucleotides at CpG contexts), SBS5 (unknown, clock-like signature), SBS18 (damage by reactive oxygen species, related to SBS36 and defective base-excision repair due to loss-of-function mutations in MUTYH), and SBS30 (defective base-excision repair due to NTHL1 mutations).
Figure 3—figure supplement 1
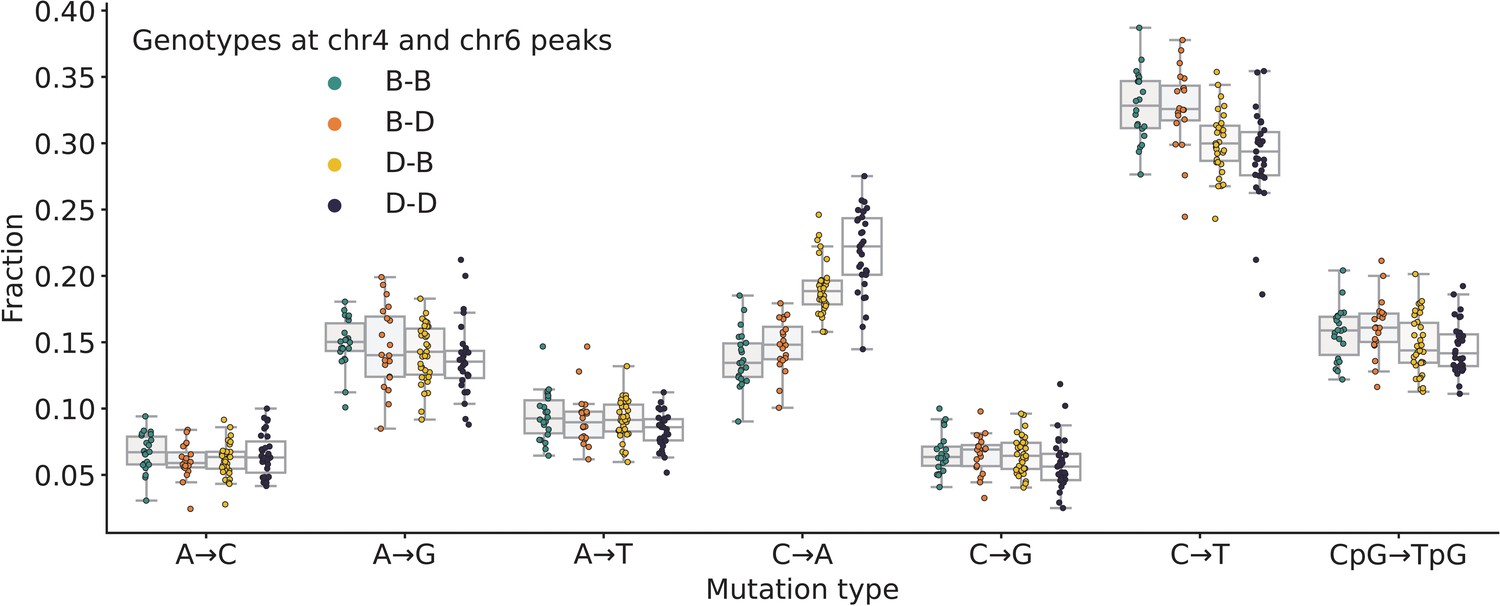
Mutation spectra comparison in BXD strains.
Fractions of de novo germline mutations in BXDs with either D or B genotypes at markers rs27509845 and rs46276051, stratified by mutation type.
Figure 3—figure supplement 2
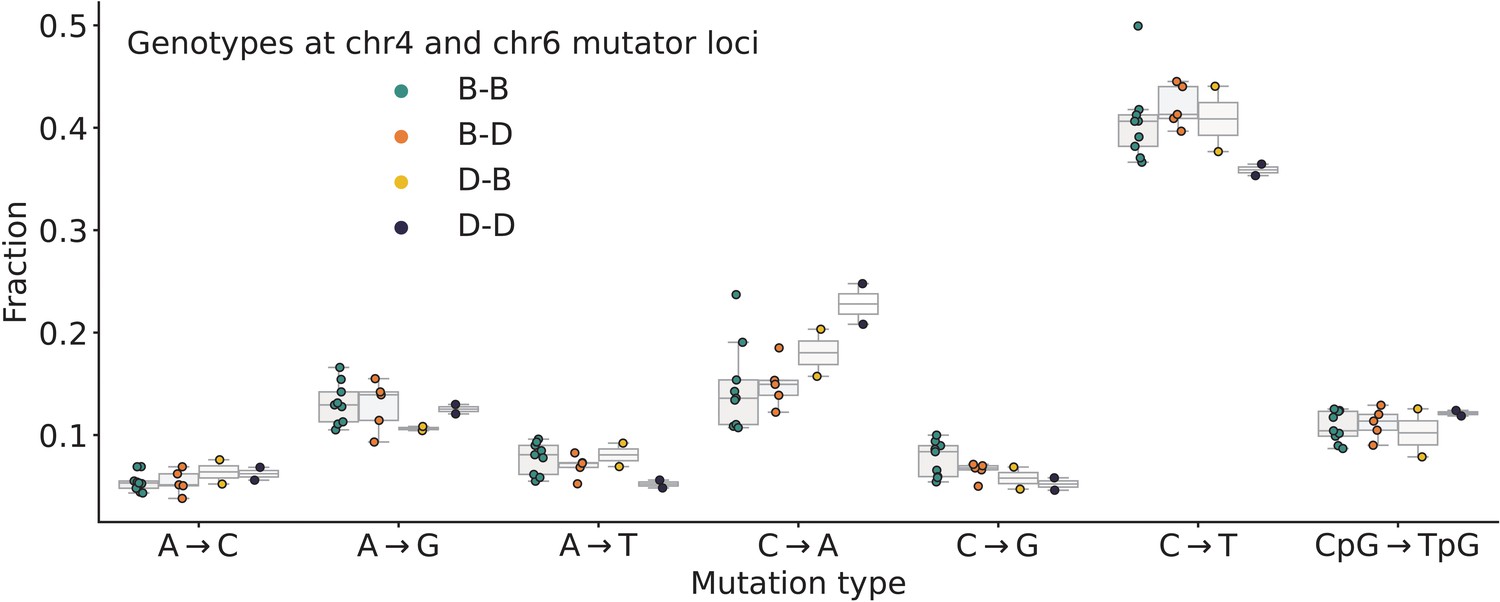
Mutation spectra comparison in Sanger Mouse Genomes Project (MGP) strains.
Fractions of de novo germline mutations in Sanger MGP strains with either D or B haplotypes at the chromosome 4 and chromosome 6 mutator loci, stratified by mutation type.
Figure 3—figure supplement 3
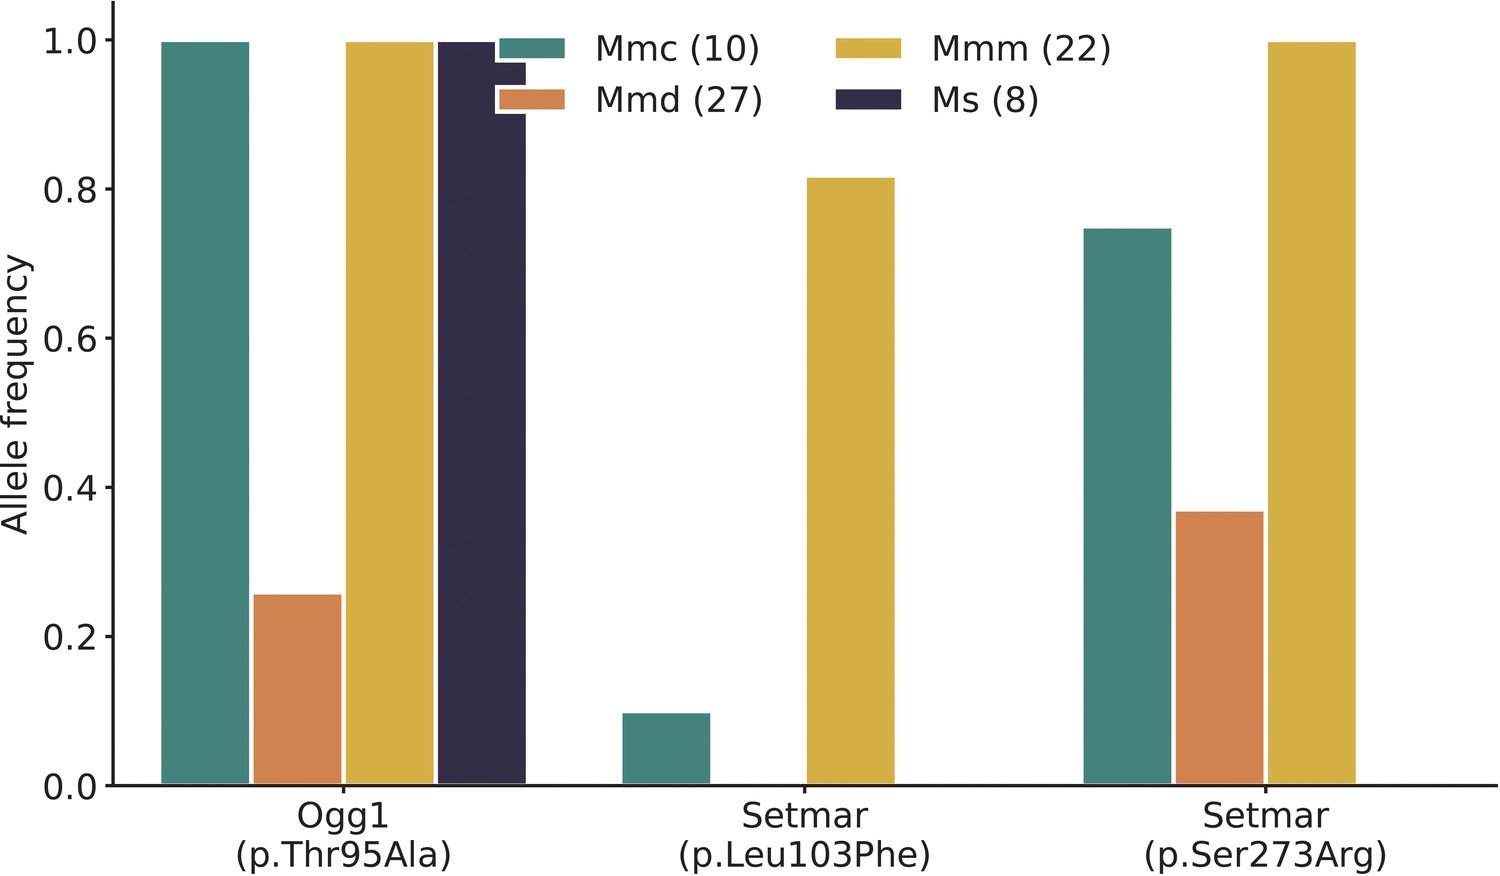
Frequency of nonsynonymous DNA repair mutations in wild mice.
Alternate allele frequencies of each nonsynonymous DNA repair mutation overlapping the chromosome 6 mutator locus were calculated in populations of wild-derived mice from Harr et al., 2016. Numbers of mice in each subpopulation are shown in parentheses. Mmc (Mus musculus castaneus), Mmd (Mus musculus domesticus), Mmm (Mus musculus musculus), and Ms (Mus spretus). The Mbd4 p.Asp129Asn mutation was not observed in any wild populations.
Author response image 1
Power of IHD and QTL mapping on simulated haplotypes with variable counts of mutations.
We simulated germline mutations on the specified number of haplotypes (as described in the manuscript) but allowed the total number of mutations per haplotype to vary by a factor of 20.
Author response image 2
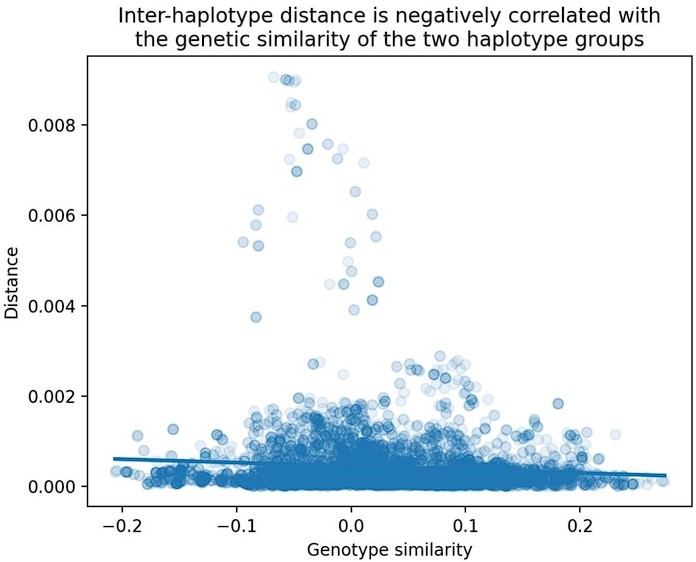
Relationship between cosine distance and genetic similarity in the BXDs.
As described in the Materials and Methods, we computed two values at each marker in the BXDs: (1) the cosine distance between the aggregate mutation spectra of BXDs with either B or D genotypes at the marker, and (2) the correlation between genome-wide D allele frequencies in BXDs with either B or D genotypes at the marker. We then regressed these two values across all genome-wide markers.
Author response image 3
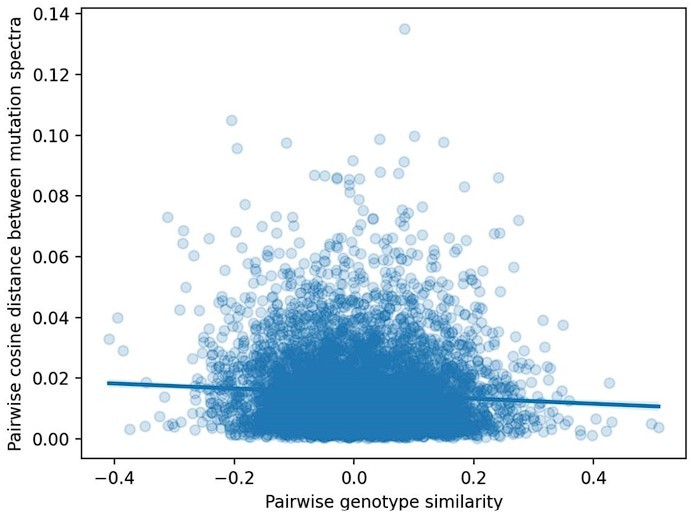
Pairwise cosine distance between BXD mutation spectra as a function of genetic similarity.
We computed two values for every possible pair of n = 117 BXDs: (1) the cosine distance between the samples' individual 1-mer mutation spectra and (2) the correlation coefficient between the samples' genome-wide counts of D alleles.
Author response image 4

Power of AMSD and QTL mapping on simulated haplotypes with variable marker allele frequencies.
We simulated germline mutations on the specified number of haplotypes (as described in the manuscript), but simulated genotypes at the mutator allele such that "A" alleles were at the specified allele frequency.
Author response image 5
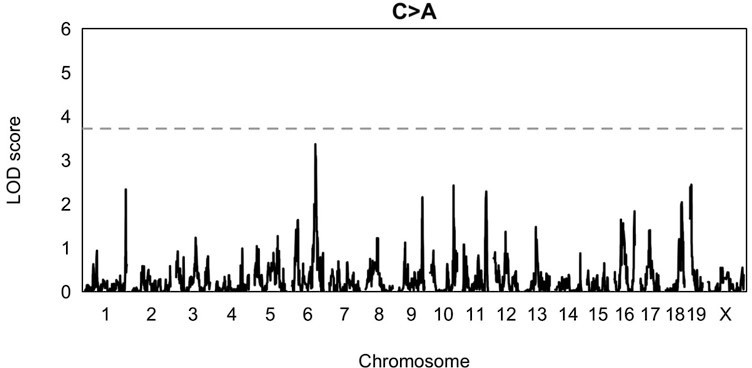
QTL scan for the fraction of C>A mutations in BXDs harboring D alleles at the locus near MythQTL scan was performed at a genome-wide significance alpha of 0.
05, rather than 0.05/7.
Tables
Table 1
Nonsynonymous mutations in DNA repair genes near the chr6 peak.
| Gene name | Ensembl transcript name | Nucleotide change | Amino acid change | Position in GRCm38/mm10 coordinates | PhyloP conservation score | SIFT prediction |
|---|---|---|---|---|---|---|
| Setmar | ENSMUST00000049246 | C>T | p.Leu103Phe | chr6:108,075,853 | 0.422 | 0.0 (intolerant/deleterious) |
| Setmar | ENSMUST00000049246 | T>G | p.Ser273Arg | chr6:108,076,365 | –0.355 | 0.3 (tolerant/benign) |
| Ogg1 | ENSMUST00000032406 | A>G | p.Thr95Ala | chr6:113,328,510 | –0.016 | 0.84 (tolerant/benign) |
| Mbd4 | ENSMUST00000032469 | C>T | p.Asp129Asn | chr6:115,849,644 | 2.28 | 0.02 (intolerant/deleterious) |
Table 2
Names of gene expression datasets used for each tissue type on GeneNetwork.
| Tissue name | Complete name of GeneNetwork expression data |
|---|---|
| Kidney | Mouse kidney M430v2 Sex Balanced (Aug06) RMA |
| Gastrointestinal | UTHSC Mouse BXD Gastrointestinal Affy MoGene 1.0 ST Gene Level (Apr14) RMA |
| Hematopoetic stem cells | UMCG Stem Cells ILM6v1.1 (Apr09) transformed |
| Spleen | UTHSC Affy MoGene 1.0 ST Spleen (Dec10) RMA |
| Liver | UTHSC BXD Liver RNA-Seq Avg (Oct19) TPM Log2 |
| Heart | NHLBI BXD All Ages Heart RNA-Seq (Nov20) TMP Log2 ** |
| Hippocampus | Hippocampus Consortium M430v2 (Jun06) RMA |
Additional files
-
Supplementary file 1
Significant cis-eQTLs (expression quantitative trait loci) for DNA repair genes in various tissues identified using GeneNetwork.
- https://cdn.elifesciences.org/articles/89096/elife-89096-supp1-v1.docx
-
MDAR checklist
- https://cdn.elifesciences.org/articles/89096/elife-89096-mdarchecklist1-v1.pdf
Download links
A two-part list of links to download the article, or parts of the article, in various formats.
Downloads (link to download the article as PDF)
Open citations (links to open the citations from this article in various online reference manager services)
Cite this article (links to download the citations from this article in formats compatible with various reference manager tools)
Epistasis between mutator alleles contributes to germline mutation spectrum variability in laboratory mice
eLife 12:RP89096.
https://doi.org/10.7554/eLife.89096.3


