Ubiquitin ligase and signalling hub MYCBP2 is required for efficient EPHB2 tyrosine kinase receptor function
- Institut de recherches cliniques de Montréal (IRCM), Canada
- Integrated Program in Neuroscience, McGill University, Canada
- Division of Experimental Medicine, McGill University, Canada
- Center for Integrative Brain Research, Seattle Children’s Research Institute, United States
- School of Life Sciences, Keele University, United Kingdom
- Department of Pediatrics, University of Washington School of Medicine, United States
- Department of Pharmacology, University of Washington School of Medicine, United States
- Department of Anatomy and Cell Biology, McGill University, Canada
Figures
Figure 1
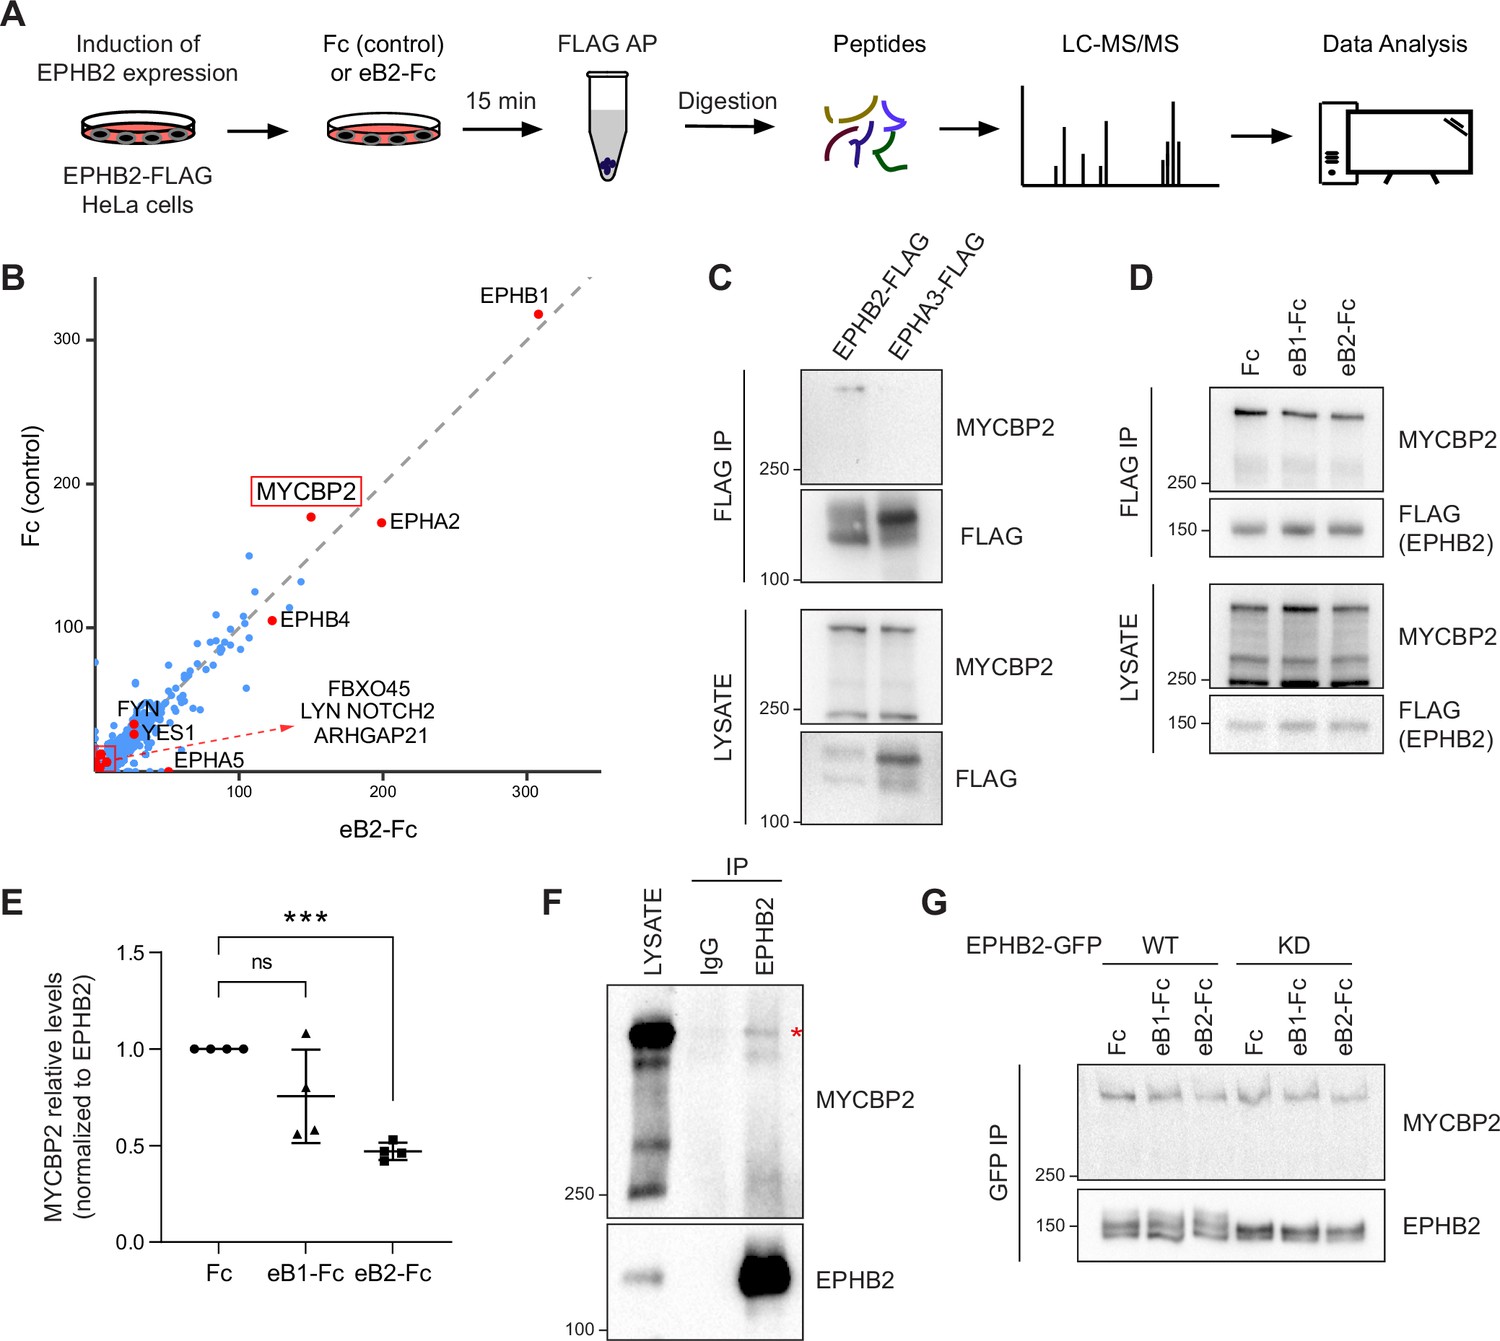
MS-proteomics and biochemistry in HeLa cells identifies MYCBP2 as EPHB2 binding protein.
(A) Schematic of EPHB2 affinity purification coupled to mass spectrometry (AP-MS) workflow. (B) Scatter plot of AP-MS data showing known and putative EPHB2 binding proteins, including MYCBP2. Y and X axes represent the average spectral counts of the identified protein hits in the EPHB2 protein complexes from cells stimulated with Fc control or ephrin-B2 (eB2-Fc), respectively. (C) In HEK 293T cells, endogenous MYCBP2 is pulled down by transiently overexpressed EPHB2-FLAG but not by EPHA3-FLAG. (D) In EPHB2-FLAG stable HeLa cell line, ephrin-B stimulation reduces the interaction between MYCBP2 and EPHB2. (E) Quantification of MYCBP2-EPHB2 association intensity after Fc, ephrin-B1 (eB1-Fc) or ephrin-B2 (eB2-Fc) treatment (eB1-Fc, p=0.1365; eB2-Fc, p=0.0002; one-sample t-test). EPHB2-MYCBP2 interaction reduction evoked by eB1-Fc is not statistically significant, probably because of high experimental variability which could be biologically significant. Error bars represent standard deviation (SD). (F) Representative image of MYCBP2 pull down with anti-EPHB2 or IgG control antibodies from rat cortical neurons. Asterisk indicates MYCBP2. (G) Representative images from western blot analysis of endogenous MYCBP2 following IP of GFP-EPHB2 wild-type (WT) or its kinase dead (KD) counterpart.
-
Figure 1—source data 1
Related to Figure 1C and D.
- https://cdn.elifesciences.org/articles/89176/elife-89176-fig1-data1-v1.zip
-
Figure 1—source data 2
Related to Figure 1F and G.
- https://cdn.elifesciences.org/articles/89176/elife-89176-fig1-data2-v1.zip
Figure 2
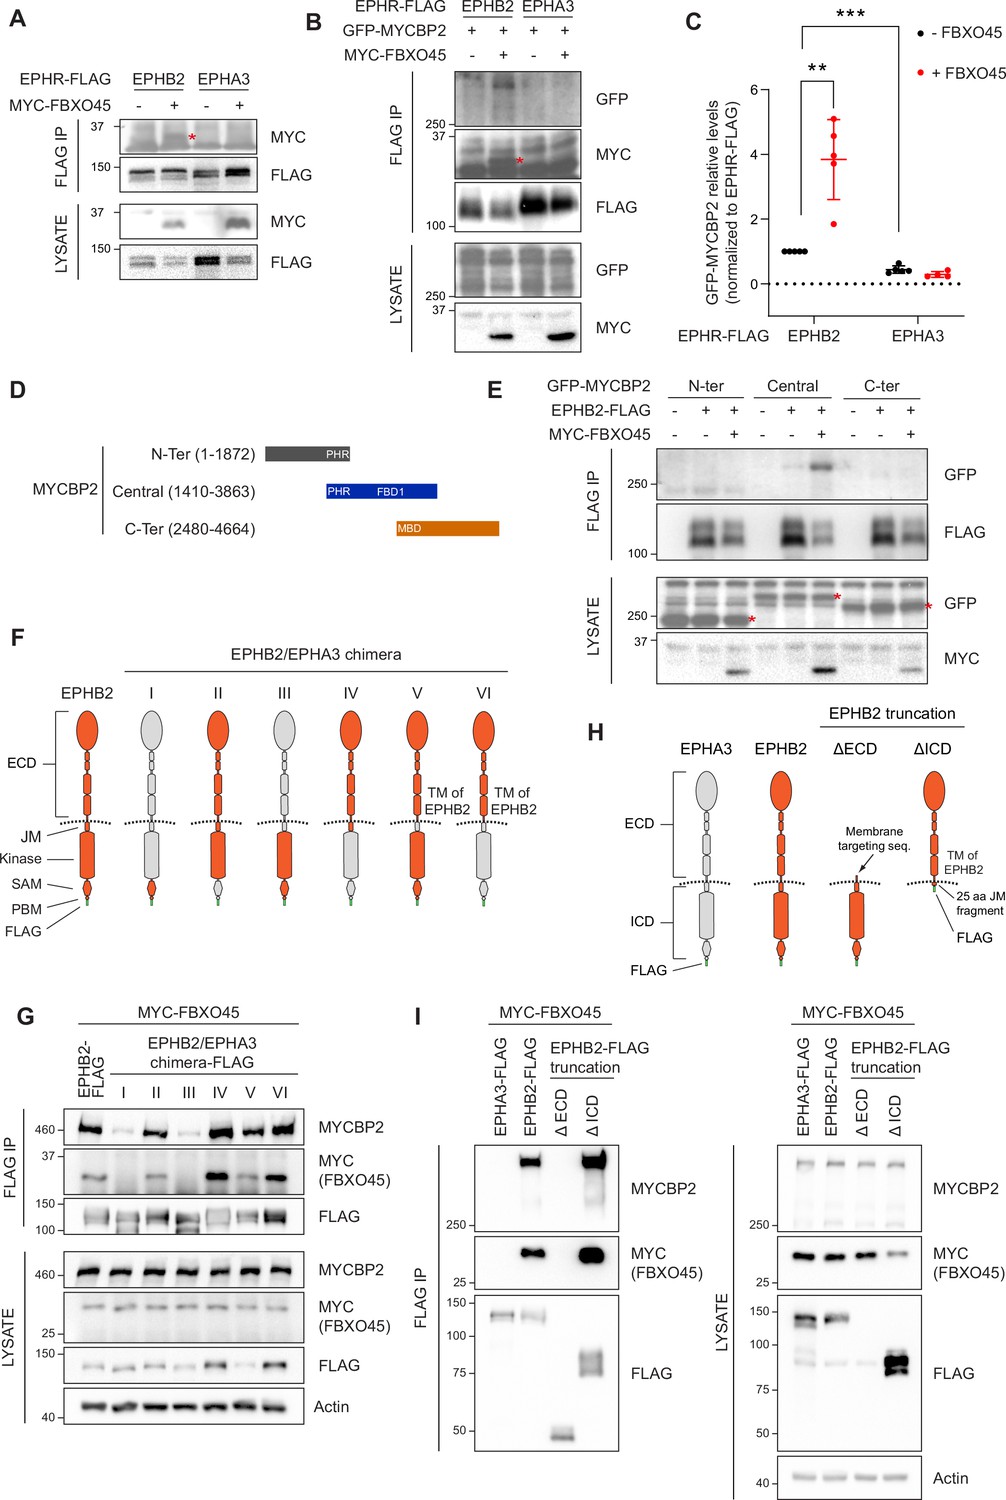
Mapping binding regions for EPHB2-MYCBP2 reveals role of FBXO45 in this interaction.
(A) Co-IP of EPHB2-FLAG with MYC-FBXO45 using transfected HEK293 cells. EPHB2 co-precipitates FBXO45, but EPHA3 does not. Asterisk indicates MYC-FBXO45. (B) In HEK 293T cells, FBXO45 overexpression enhances EPHB2-MYCBP2 binding. Asterisk indicates MYC-FBXO45. (C) Quantification of the association intensity of MYCBP2 and EPHB2 upon FBXO45 overexpression (EPHB2, p=0.0068; EPHB2 vs EPHA3, p=0.0005; one sample t-test). Error bars represent SD. (D) Schematic representation of MYCBP2 N-terminal, Central, and C-terminal fragments. (E) Co-IP of EPHB2-FLAG with GFP-MYCBP2 fragments in HEK 293T cells. EPHB2 coprecipitates with MYCBP2 central fragment. Asterisks indicate GFP-MYCBP2 fragments. (F) Schematic of chimeric domain swapping of EPHB2 (orange) and EPHA3 (grey). (G) Co-IP of MYC-FBXO45 and endogenous MYCBP2 with EPHB2/EPHA3 domain swapped chimeras. (H) Schematic representation of EPHB2 ΔECD (extracellular domain, aa deletions of 19–530) and ΔICD (intracellular domain, aa deletions of 590–986) truncations. (I) Co-IP of endogenous MYCBP2 with EPHA3, EPHB2 and EPHB2 truncation mutants. ECD, extracellular domain; TM, transmembrane; JM, juxtamembrane; SAM, Sterile alpha motif; PBM, PDZ (PSD-95, Dlg1, Zo-1) binding motif.
-
Figure 2—source data 1
Related to Figure 2A, B and E.
- https://cdn.elifesciences.org/articles/89176/elife-89176-fig2-data1-v1.zip
-
Figure 2—source data 2
Related to Figure 2G, I.
- https://cdn.elifesciences.org/articles/89176/elife-89176-fig2-data2-v1.zip
Figure 3
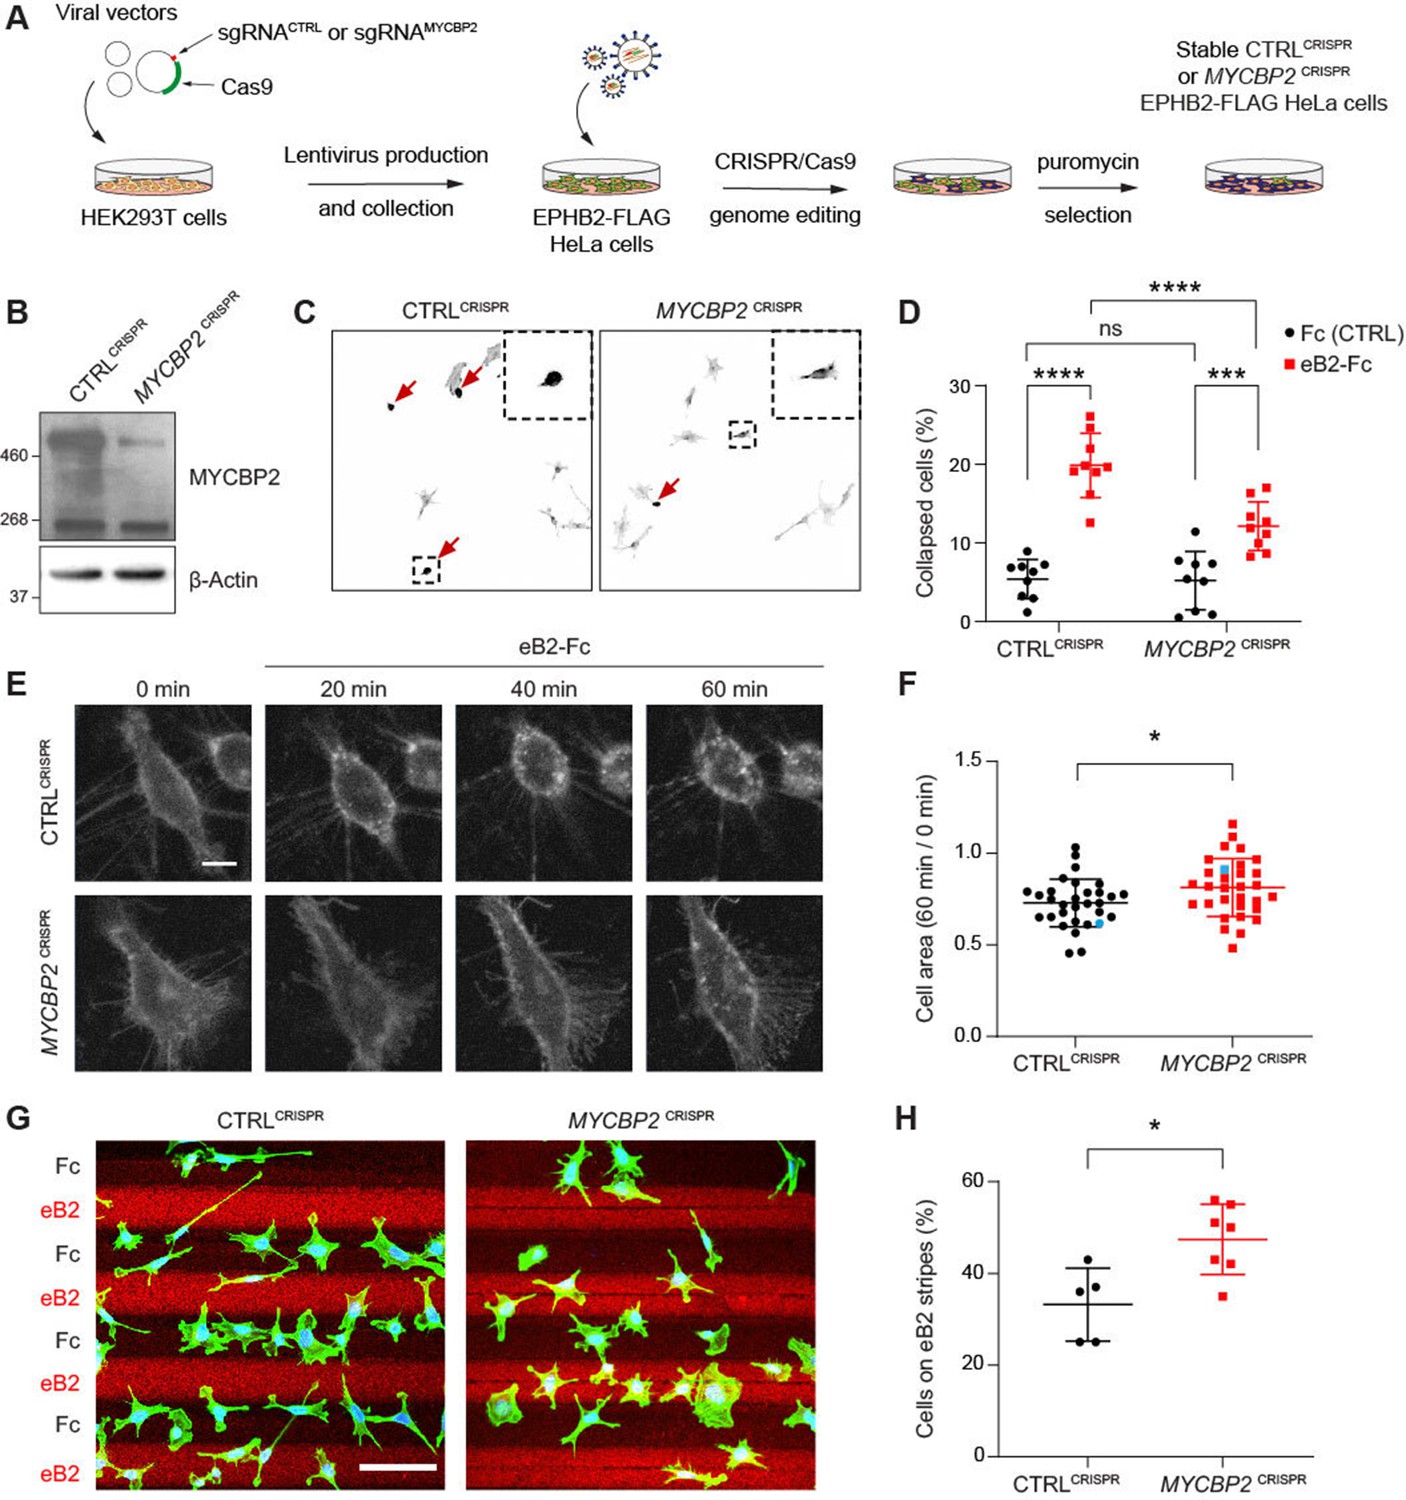
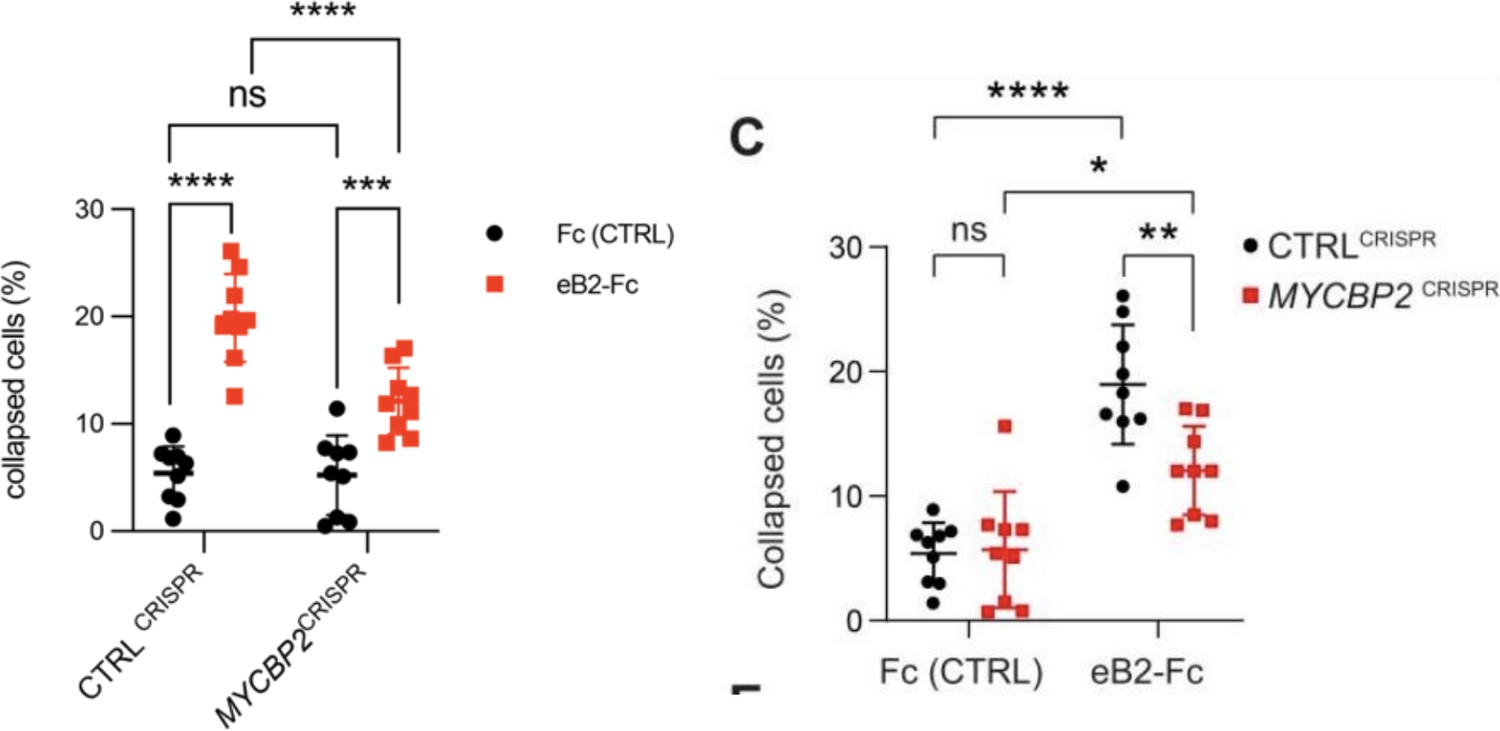
MYCBP2 CRISPR HeLa cells exhibit reduced ephrin-B2 evoked cell retraction and ephrin-B2 stripe avoidance.
(A) Schematic of generation of stable CTRLCRISPR or MYCBP2CRISPR HeLa EPHB2-FLAG cells. Note that these are not clonal cell lines. (B) MYCBP2 is reduced in HeLa MYCBP2CRISPR cells generated by sgRNA targeting MYCBP2 exon 6. (C) Representative images of cell collapse assays using CTRLCRISPR or MYCBP2CRISPR HeLa cells that were stimulated with ephrin-B2. Red arrows indicate rounded/collapsed cells. Scale bar is 10 μm, (D) Quantification of collapsed cells. Statistical significance between CTRLCRISPR and MYCBP2CRISPR cells was determined using two-way ANOVA followed by Sidak’s multiple comparison test (CTRLCRISPR vs MYCBP2 CRISPR: Fc, p=0.9903; eB2-Fc, p<0.0001. Fc vs eB2-Fc: CTRLCRISPR, p<0.0001; MYCBP2 CRISPR, p=0.0003). (E) Representative time-lapse sequences of CTRLCRISPR and MYCBP2CRISPR HeLa cells after ephrin-B2 treatment. (F) Quantification of cell area reduction after 60 min exposure to ephrin-B2. Cell area contraction ratio: CTRLCRISPR, 27.1%; MYCBP2CRISPR, 18.8%. p=0.0268, two-tailed unpaired t test. Data points corresponding to cells in representative images in panel E are in blue. (G) Ephrin-B2 stripe assays using CTRLCRISPR or MYCBP2CRISPR HeLa cells. Cells are visualized with Phalloidin 488 staining and nuclei are stained with DAPI (black, Fc stripes; red, ephrin-B2 stripes). Scale bar is 50 μm. (H) Quantification of cells present on ephrin-B2 stripes (%). Statistical significance was determined using two-tailed unpaired t-test (p=0.0109). Error bars represent SD.
-
Figure 3—source data 1
Related to Figure 3B.
- https://cdn.elifesciences.org/articles/89176/elife-89176-fig3-data1-v1.zip
Figure 4
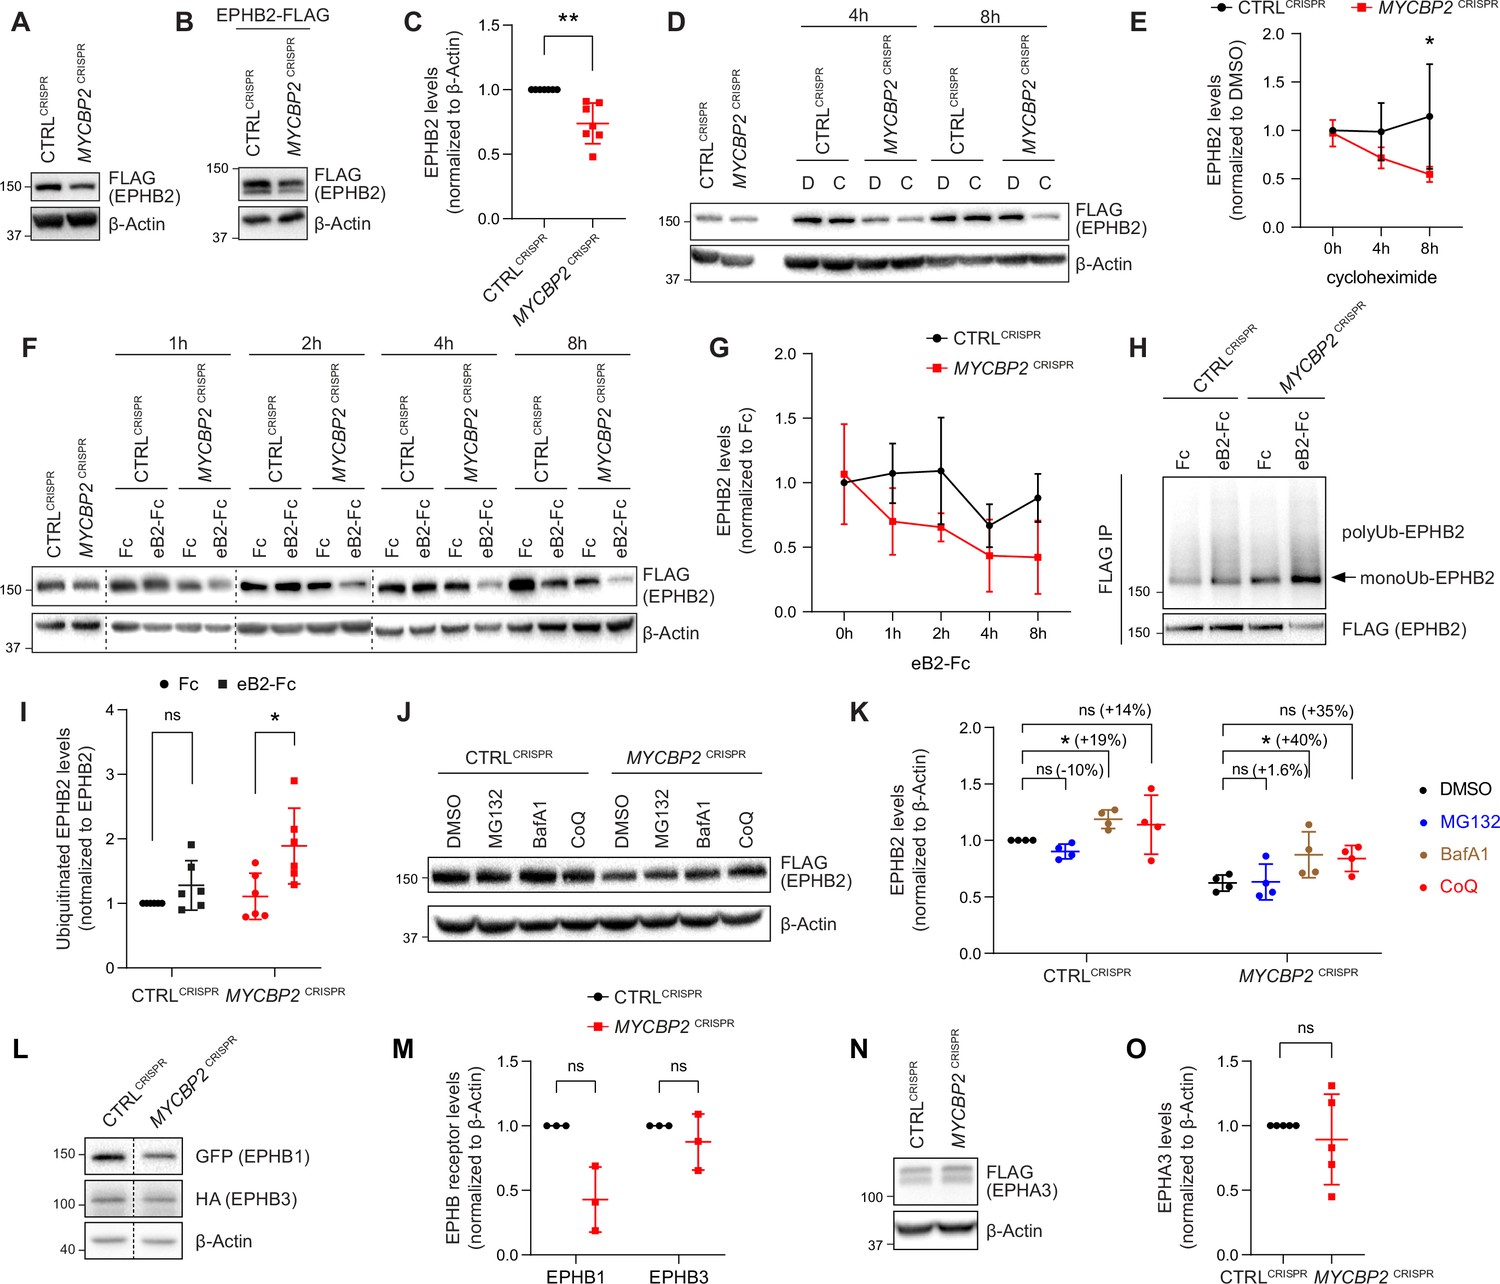
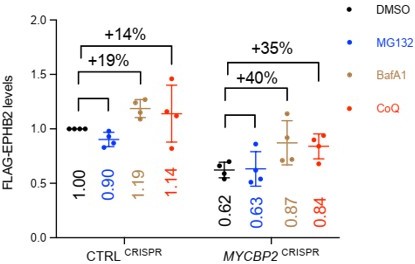
MYCBP2 loss-of-function increases EPHB2 protein turnover in HeLa cells.
(A) Induced EPHB2-FLAG expression is reduced in MYCBP2CRISPR HeLa cells. (B) Western blotting for transfected EPHB2-FLAG in CTRLCRISPR and MYCBP2CRISPR cells. (C) Quantification of transfected EPHB2-FLAG levels (p=0.0046, one-sample t-test). (D) Representative western blot of EPHB2-FLAG in CTRLCRISPR and MYCBP2CRISPR cells treated with DMSO or cycloheximide for 4 hr and 8 hr. (E) Quantification of EPHB2-FLAG turnover with cycloheximide (CTRLCRISPR vs. MYCBP2CRISPR at 8 hr eB2-Fc stimulation, p=0.0474, two-way ANOVA followed by Tukey’s multiple comparison test). (F) Western blot showing EPHB2-FLAG degradation when cells are challenged with ephrin-B2 (1 µg/ml) for different periods of time. (G) Quantification of ephrin-B2-evoked EPHB2 degradation (ns, not significant; two-way ANOVA followed by Tukey’s multiple comparison test). Although not significant, there is an apparent trend towards lower EPHB2 levels in MYCBP2CRISPR cells, which could become significant with additional replicates. (H) Western blot of EPHB2 ubiquitination in CTRLCRISPR and MYCBP2CRISPR cells. (I) Quantification of ubiquitinated EPHB2. CTRLCRISPR cells stimulated with Fc vs. eB2-Fc, p=0.1349 (One sample t-test); MYCBP2CRISPR cells stimulated with Fc vs. EB2-Fc, p=0.0195 (Unpaired two-tailed t-test). (J) After tetracycline induction of EPHB2-FLAG expression for 16 hr, CTRLCRISPR and MYCBP2CRISPR HeLa cells were treated with DMSO (1:500) or inhibitors of the proteasome (MG132 50 µM) or lysosome (BafA1 0.2 µM; CoQ 50 µM) for 6 hr, and EPHB2 levels were analysed by western blotting. (K) Quantification of EPHB2 levels following treatment with proteasome or lysosome inhibitors. Statistical significance for the comparison between CTRLCRISPR cells treated with DMSO or inhibitors was determined by one-sample t-test (MG132, p=0.0598; BafA1, p=0.0200; CoQ, p=0.3632), whereas statistical significance for the comparison between MYCBP2CRISPR cells treated with DMSO and individual inhibitors was determined by two-tailed paired t-test (MG132, p=0.8893; BafA1, p=0.0361; CoQ, p=0.0835). (L) GFP-EPHB1 and HA-EPHB3 transfected into CTRLCRISPR and MYCBP2CRISPR HeLa cells and detected by western blot. (M) Quantification of GFP-EPHB1 and HA-EPHB3 levels (EPHB1, p=0.0588; EPHB3, p=0.4253; one-sample t-test). (N) FLAG-EPHA3 transfected into CTRLCRISPR and MYCBP2CRISPR HeLa cells and detected by WB. (O) Quantification of FLAG-EPHA3 (p=0.5369, one-sample t-test). Error bars represent SD.
-
Figure 4—source data 1
Related to Figure 4A, B and D.
- https://cdn.elifesciences.org/articles/89176/elife-89176-fig4-data1-v1.zip
-
Figure 4—source data 2
Related to Figure 4F.
- https://cdn.elifesciences.org/articles/89176/elife-89176-fig4-data2-v1.zip
-
Figure 4—source data 3
Related to Figure 4H and J.
- https://cdn.elifesciences.org/articles/89176/elife-89176-fig4-data3-v1.zip
-
Figure 4—source data 4
Related to Figure 4L.
- https://cdn.elifesciences.org/articles/89176/elife-89176-fig4-data4-v1.zip
Figure 5
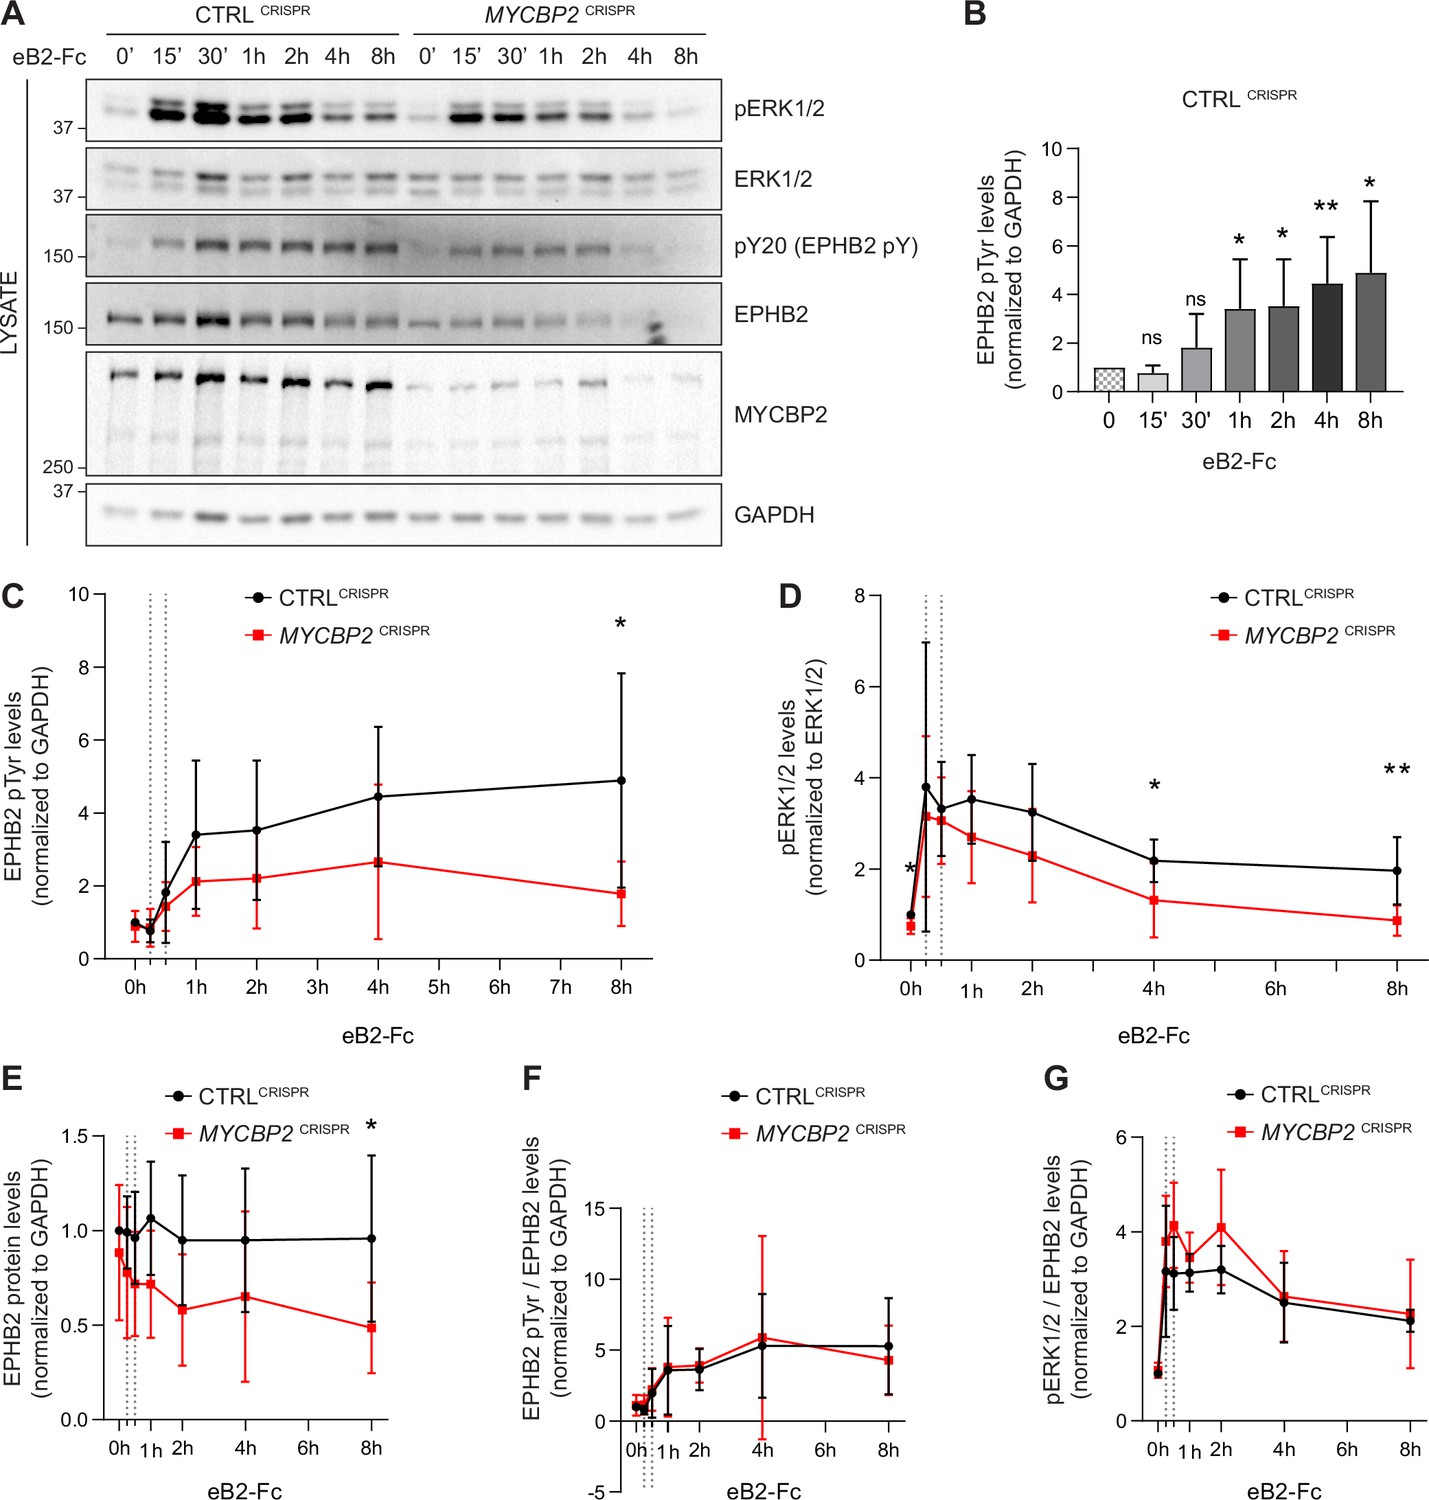
MYCBP2 depletion impairs EPHB2 phosphorylation and ERK1/2 activation in HeLa cells.
(A) Representative western blot for pERK1/2 and pTyr-EPHB2 detected in CTRLCRISPR and MYCBP2CRISPR cells treated with ephrin-B2 (eB2-Fc) for different periods (n=6). Membranes were striped and reblotted with anti-ERK1/2, anti-EPHB2, anti-GAPDH and anti-MYCBP2 antibodies as controls. (B) Quantification of EPHB2 tyrosine phosphorylation in CTRLCRISPR cells evoked by ephrin-B2 treatment (15 min, P=0.1363; 30 min, P=0.2056; 1 h, P=0.0342; 2 h, P=0.0234; 4 h, P=0.0068; 8 h, P=0.0231; one-sample t-test). (C) Quantification of EPHB2 tyrosine phosphorylation in CTRLCRISPR and MYCBP2CRISPR HeLa cells (unstimulated, P=0.5589, one-sample t-test; stimulated for 15 min, P=0.7463; 30 min, P=0.5520; 1 h, P=0.1920; 2 h, P=0.2009; 4 h, P=0.1550; 8 h, P=0.0331; two-tailed unpaired t-test). (D) Quantification of pERK1/2 in CTRLCRISPR and MYCBP2CRISPR HeLa cells (0 min, P=0.0168, one-sample t-test; 15 min, P=0.6695; 30 min, P=0.6649; 1 h, P=0.1776; 2 h, P=0.1479; 4 h, P=0.0494; 8 h, P=0.0078; two-tailed unpaired t-test). (E) Quantification of EPHB2 in CTRLCRISPR and MYCBP2CRISPR HeLa (0 min, P=0.4604, one-sample t-test; 15 min, P=0.2222; 30 min, P=0.1376; 1 h, P=0.0651; 2 h, P=0.0736; 4 h, P=0.2451; 8 h, P=0.0437, two-tailed unpaired t-test). (F) Quantification of ephrin-B2-evoked EPHB2 tyrosine phosphorylation levels relative to total EPHB2 protein levels (0 min, P=0.7058, one-sample t-test; 15 min, P=0.2464; 30 min, P=0.7835; 1 h, P=0.9164; 2 h, P=0.7196; 4 h, P=0.8625; 8 h, P=0.5750, two-tailed unpaired t-test). (G) Quantification of ephrin-B2-evoked pERK1/2 relative to EPHB2 total protein levels 0 min, P=0.3308, one-sample t-test; 15 min, P=0.3856; 30 min, P=0.0624; 1 h, P=0.2683; 2 h, P=0.1284; 4 h, P=0.7998; 8 h, P=0.7790, two-tailed unpaired t-test. Error bars represent SD.
-
Figure 5—source data 1
Related to Figure 5A.
- https://cdn.elifesciences.org/articles/89176/elife-89176-fig5-data1-v1.zip
Figure 6
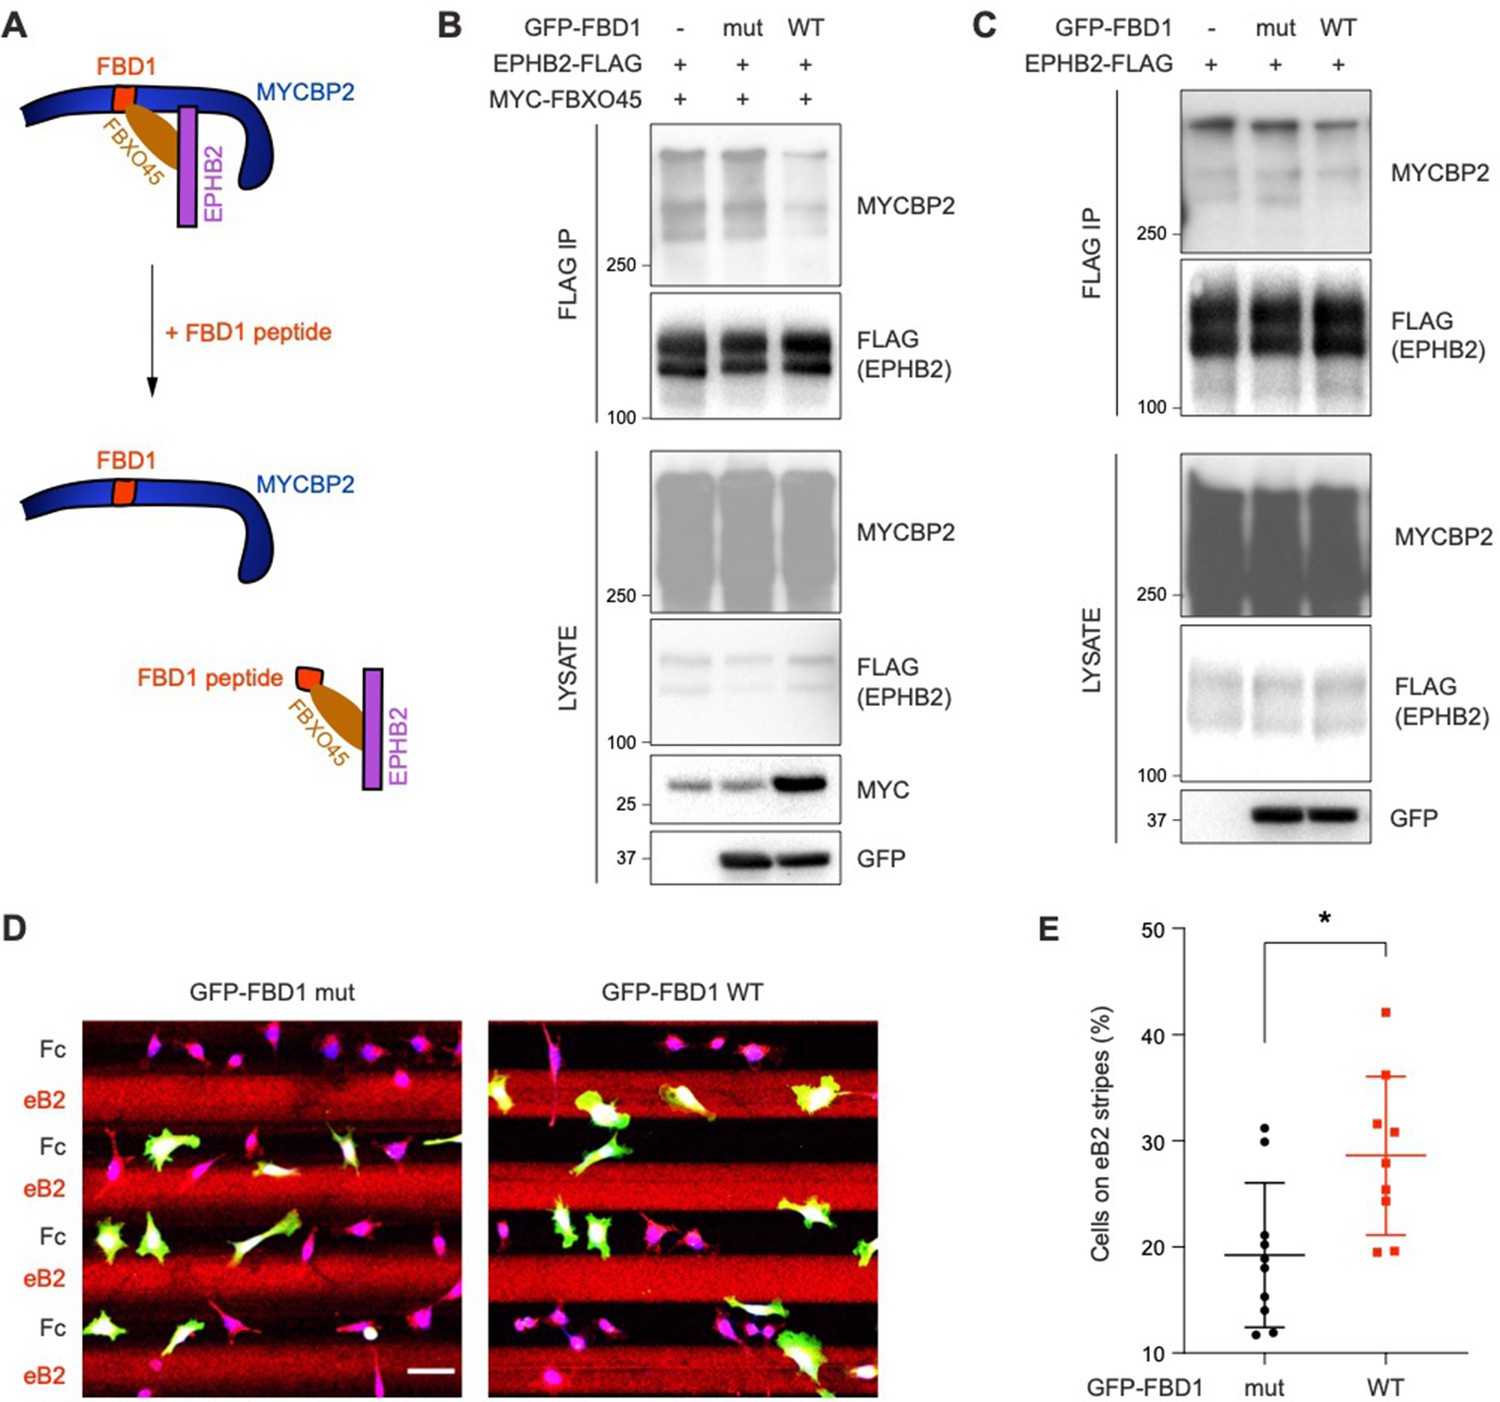
Exogenous FBD1 fragment of MYCBP2 disrupts EPHB2-MYCBP2 binding and impairs EPHB2 function in HeLa cells.
(A) Schematic illustrating competition of exogenous MYCBP2-FBD1 fragment that disrupts MYCBP2-FBXO45 binding and leads to MYCBP2 reduction in EPHB2 complexes. (B) Exogenous FBD1 WT overexpression leads to reduced EPHB2-MYCBP2 binding in HEK293 cells despite co-expression of FBXO45. (C) FBD1 overexpression also disrupts EPHB2-MYCBP2 binding in the absence of FBXO45 overexpression. (D) Representative images of ephrin-B2 stripe assays using HeLa cells expressing GFP-FBD1 mut or GFP-FBD1 WT. Scale bar is 50 μm. (E) Quantification of cells present on eB2 stripes (P=0.0107, two-tailed unpaired t-test). Error bars represent SD.
-
Figure 6—source data 1
Related to Figure 6B.
- https://cdn.elifesciences.org/articles/89176/elife-89176-fig6-data1-v1.zip
-
Figure 6—source data 2
Related to Figure 6C.
- https://cdn.elifesciences.org/articles/89176/elife-89176-fig6-data2-v1.zip
Figure 7
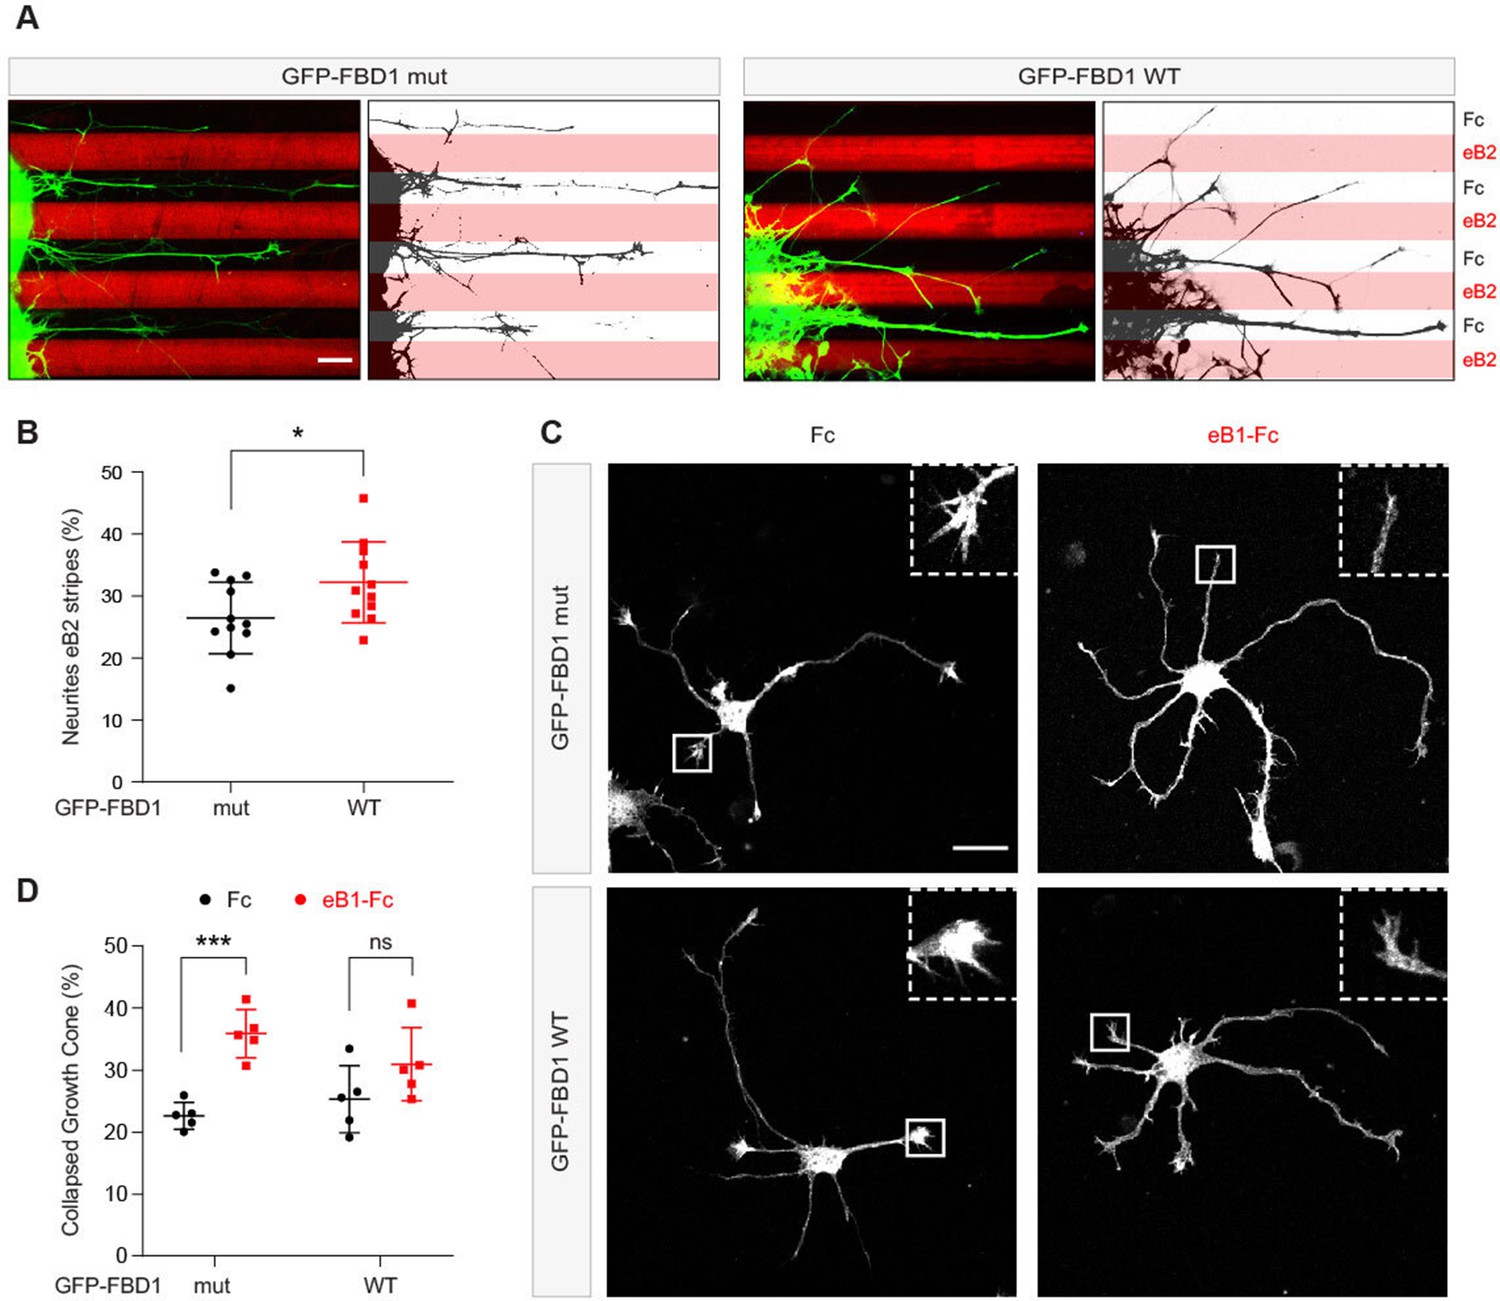
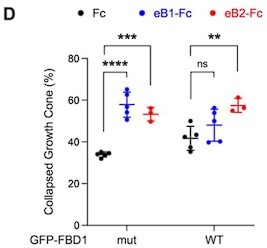
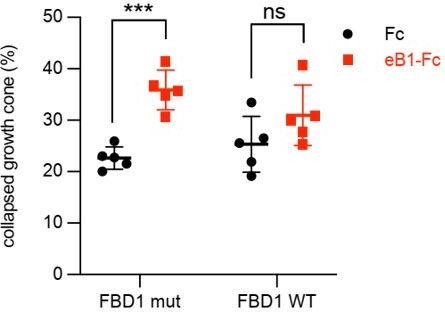
Exogenous FBD1 overexpression impairs EPH receptor functions in chick spinal cord explants and mouse hippocampal neurons.
(A) Representative images of ephrin-B2 stripe assays with chick embryonic spinal cord explants overexpressing GFP-FBD1 mut (negative control) or GFP-FBD1 WT. Images with inverted GFP signal in dark pixels on Fc / eB2 (pink) stripes are placed beside the original images. Scale bar is 50 μm. (B) Quantification of GFP-positive neurites present on ephrin-B2 stripes (GFP-FBD1 mut vs. GFP-FBD1 WT, p=0.0410, two-tailed unpaired t-test). (C) Representative images of DIV2 mouse hippocampal neurons overexpressing GFP-FBD1 mut or GFP-FBD1 WT and challenged with Fc control or ephrin-B1 (eB1-Fc). Scale bar is 20 μm. (D) Quantification of growth cone collapse rate for hippocampal neurites. GFP-FBD1 mut: Fc vs. eB1-Fc, p=0.0006; GFP-FBD1 WT: Fc vs. eB1-Fc p0.1341. Two-way ANOVA followed by Sidak’s multiple comparisons test. Error bars represent SD.
Figure 8
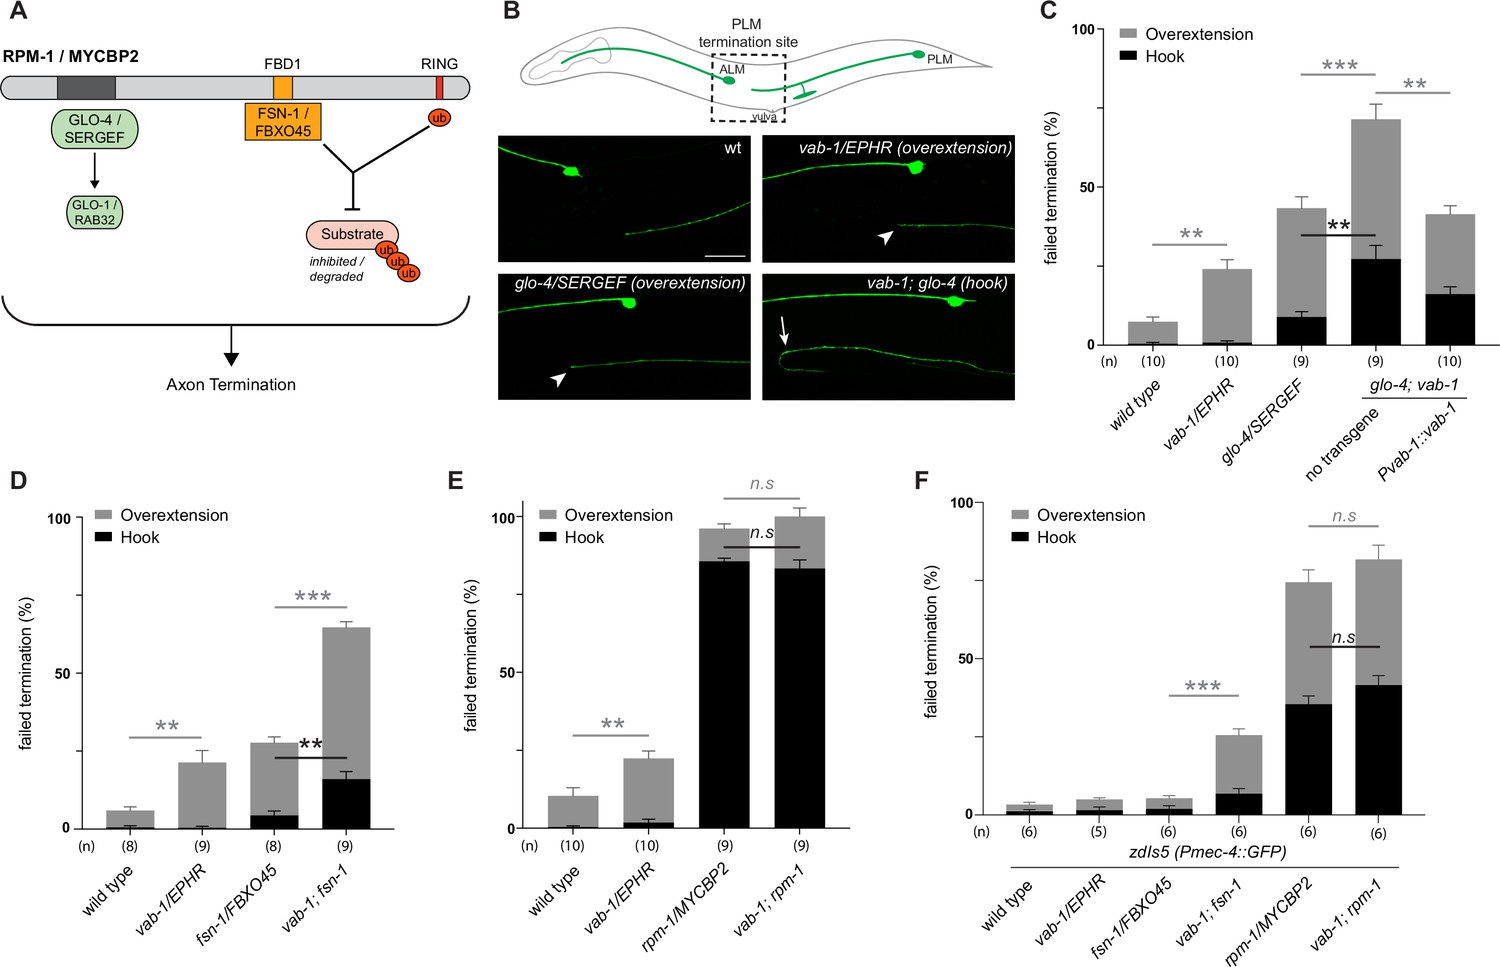
C. elegans VAB-1 ephrin receptor interacts genetically with known RPM-1/MYCBP2 binding proteins FSN-1/FBXO45 and GLO-4/SERGEF.
(A) schematic showing the known RPM-1/MYCBP2 binding proteins GLO-4/SERGEF and FSN-1/FBXO45. GLO-4 functions independent of RPM-1 ubiquitin ligase. FSN-1 is the F-box protein that forms a ubiquitin ligase complex with RPM-1. Adapted from Grill et al., 2016. (B) Schematic representation of axon morphology and axon termination site for PLM mechanosensory neurons and representative images of failed axon termination defects observed in PLM neurons for indicated genotypes. Axon termination visualized using muIs32 (Pmec-7::GFP), which expresses GFP in the PLM and ALM mechanosensory neurons. Examples of moderate severity overextension defects (arrowhead) observed in vab-1/EphR and glo-4/SERGEF single mutants. Example of severe overextension (hook) defects (arrow) observed in vab-1; glo-4 double mutants. (C) Quantitation of axon termination defects for indicated genotypes using muIs32. vab-1; glo-4 double mutants show enhanced frequency of both hook (black) and overextension (grey) failed termination defects. Overextension defects are significantly reduced by transgenic expression of VAB-1. (D) Quantitation of axon termination defects for indicated genotypes. vab-1; fsn-1 double mutants show enhanced termination defects. (E) Quantitation of axon termination defects for indicated genotypes using muIs32. Axon termination defects are not suppressed in vab-1; rpm-1 double mutants compared to rpm-1 single mutants. (F) zdIs5 (Pmec-4::GFP) was used to quantify axon termination defects for indicated genotypes. vab-1; fsn-1 double mutants show enhanced frequency of overextension defects (grey). Frequency and severity of axon termination defects is not significantly different between vab-1; rpm-1 double mutants and rpm-1 single mutants. n is defined as a single count of 20–30 animals. Means are shown from 8 to 10 counts (20–30 animals per count) for each genotype, and error bars represent SEM. Significance determined using Student’s t-test with Bonferroni correction for multiple comparisons. ** p<0.01; *** p<0.001; n.s, not significant. Scale bar is 20 μm.
Author response image 1
Author response image 2

Author response image 3
Author response image 4
Author response image 5
Tables
Key resources table
| Reagent type (species) or resource | Designation | Source or reference | Identifiers | Additional information |
|---|---|---|---|---|
| Strain, strain background (Mus musculus) | C57BL/6 J | Jackson Labs | Jax:000664 | |
| Cell line (Homo sapiens) | HeLa | ATCC | #CCL2 | |
| Cell line (Homo sapiens) | HEK 293T | ATCC | #CRL-3216 | |
| Cell line (Homo sapiens) | T-REx-HeLa | Invitrogen | #R71407 | |
| Cell line (Homo sapiens) | HeLa CTRL CRISPR | This paper | Materials and methods: Cell culture | |
| Cell line (Homo sapiens) | HeLa MYCBP2 CRISPR | This paper | Materials and methods: Cell culture | |
| Antibody | Anti-MYCBP2 (Rabbit polyclonal) | Abcam | RRID:AB_1925230 | WB:(1:2000) |
| Antibody | Anti-pERK1/2 (Rabbit polyclonal) | Cell Signaling Technology | RRID:AB_331646 | WB:(1:1000) |
| Antibody | Anti-ERK1/2 (Rabbit polyclonal) | Cell Signaling Technology | RRID:AB_330744 | WB:(1:1000) |
| Antibody | Anti-EPHB2 (Goat polyclonal) | R&D Systems | RRID:AB_355375 | WB:(1:1000) |
| Antibody | Anti-β-Actin (Mouse monoclonal) | Sigma-Aldrich | RRID:AB_476744 | WB:(1:4000) |
| Antibody | Anti-pTyr (Mouse monoclonal) | Santa Cruz Biotechnology | RRID:AB_628122 | WB:(1:400) |
| Antibody | Anti-GAPDH (Mouse monoclonal) | Santa Cruz Biotechnology | RRID:AB_627678 | WB:(1:1000) |
| Antibody | Anti-FLAG (Mouse monoclonal) | Sigma-Aldrich | RRID:AB_439702 | WB:(1:2000) |
| Antibody | Anti-HA (Mouse monoclonal) | Cell Signaling Technology | RRID:AB_1549585 | WB:(1:1000) |
| Antibody | Anti-MYC (Mouse monoclonal) | Santa Cruz Biotechnology | RRID:AB_627268 | WB:(1:400) |
| Antibody | anti-GFP (Rabbit polyclonal) | Thermo Fisher Scientific | RRID:AB_221569 | WB:(1:1000) |
| Antibody | Donkey anti- Goat HRP | Jackson ImmunoResearch | #705-035-003 | WB:(1:5000) |
| Antibody | Donkey anti-Mouse HRP | Jackson ImmunoResearch | #715-035-151 | WB:(1:5000) |
| Antibody | Donkey anti-Rabbit HRP | Jackson ImmunoResearch | #711-035-152 | WB:(1:5000) |
| Antibody | Goat anti-Fc IgG | Sigma-Aldrich | #I2136 | for conjugation |
| Peptide, recombinant protein | Fc | Millipore | #401104 | |
| Peptide, recombinant protein | ephrinB1-Fc | R&D Systems | #473-EB | |
| Peptide, recombinant protein | ephrinB2-Fc | R&D Systems | #496-EB | |
| Chemical compound, drug | Penicillin/Streptomycin | Wisent Bioproducts | #450–200-EL | for cell line culture |
| Chemical compound, drug | Penicillin/Streptomycin | Hyclone | #SV30010 | for neuron culture |
| Chemical compound, drug | MG132 | Sigma-Aldrich | #474790 | 50 µM |
| Chemical compound, drug | BafilomycinA1 | Sigma-Aldrich | #B1793 | 0.2 µM |
| Chemical compound, drug | Chloroquine | Tocris | #4109 | 50 µM |
| Other | Neurobasal | Thermo Fisher Scientific | #21103049 | Materials and methods: Dissociated mouse hippocampal neuron culture and electroporation |
| Other | B-27 | Thermo Fisher Scientific | #17504044 | |
| Other | HBSS | Gibco | #14185052 | |
| Other | HEPES | Gibco | #15630080 | |
| Other | SM1 supplement | Stemcell | #05711 | |
| Other | GlutaMAX-I | Gibco | #35050 | |
| Other | Protease inhibitor | Roche | #11836153001 | Materials and methods: Cell lysis, co-immunoprecipitation and western blotting |
| Other | Phosphatase inhibitor | Roche | #04906837001 | |
| Other | Anti-FLAG agarose beads | Sigma-Aldrich | #A2220 | |
| Other | PVDF membrane | Millipore | #IPVH00010 |
Author response table 2
| CtrlCRISPR cells | +9% | +24% | +27% | +15% |
|---|---|---|---|---|
| MYCBP2CRISPR cells | +31% | +22% | +62% | +39% |
Additional files
Download links
A two-part list of links to download the article, or parts of the article, in various formats.
Downloads (link to download the article as PDF)
Open citations (links to open the citations from this article in various online reference manager services)
Cite this article (links to download the citations from this article in formats compatible with various reference manager tools)
Ubiquitin ligase and signalling hub MYCBP2 is required for efficient EPHB2 tyrosine kinase receptor function
eLife 12:RP89176.
https://doi.org/10.7554/eLife.89176.4


