Apoptotic signaling clears engineered Salmonella in an organ-specific manner
- Department of Integrative Immunobiology, Duke University School of Medicine, United States
- Department of Molecular Genetics and Microbiology, Duke University School of Medicine, United States
- Department of Cell Biology, Duke University School of Medicine, United States
- Department of Microbiology and Immunology, University of North Carolina at Chapel Hill, United States
- Department of Biomedical Engineering, Duke University Pratt School of Engineering, United States
- Department of Pathology and Laboratory Medicine, Tulane University School of Medicine, United States
Figures
Figure 1 with 2 supplements
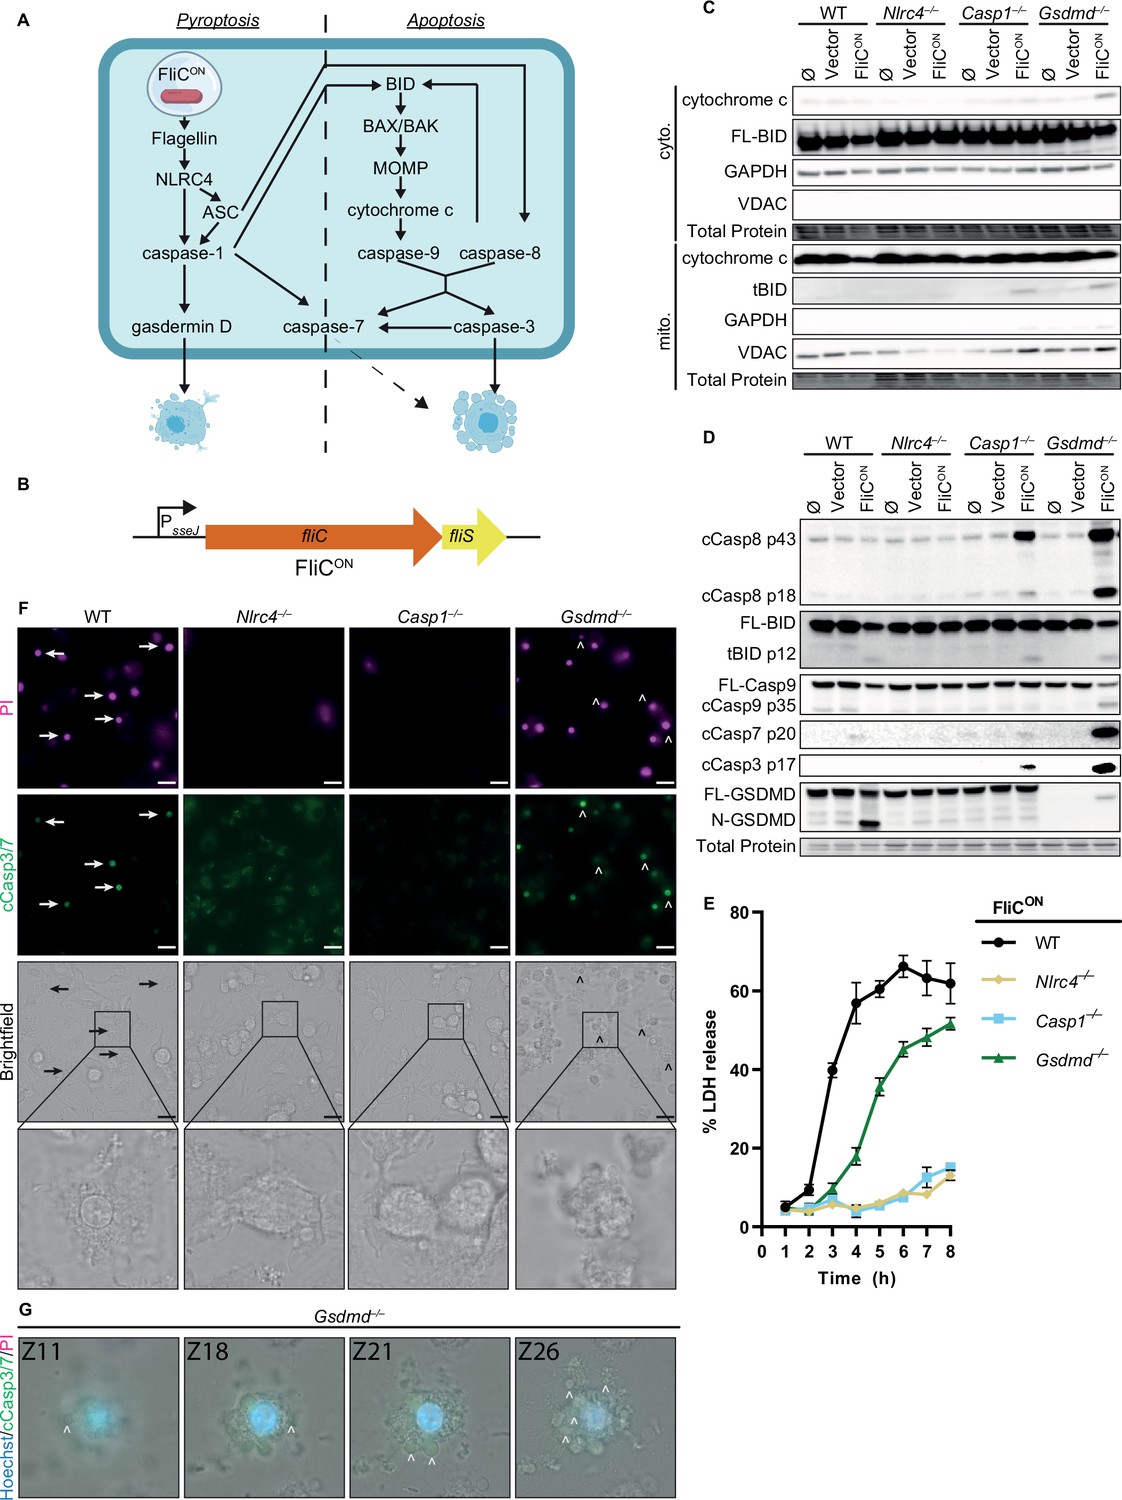
FliCON S. Typhimurium activates apoptotic backup pathways in vitro.
(A) Cell death pathways activated by FliCON S. Typhimurium. (B) Schematic of engineered FliCON construct. (C–F) Bone marrow-derived macrophages (BMMs) were infected with indicated SPI2-induced S. Typhimurium strains. (C) Western blot analysis of cytosolic and mitochondrial fractions at 5 hpi. Representative image from three independent experiments. (D) Western blot analysis of whole cell lysates at 4 hpi. Representative image from three independent experiments. (E) Lactate dehydrogenase (LDH) release at 1–8 hpi. Results representative of three independent experiments. Data are represented as mean ± SD of three technical replicates. (F–G) Immunofluorescence and brightfield. Cells were stained with PI, cleaved caspase-3/7, and Hoechst. (F) Representative image from two (brightfield, PI) or one (cleaved caspase-3/7) independent experiments at 4 hpi. 60 x magnification, scale bar 20 µm. Arrows, pyroptotic cells. Carrots, apoptotic cells. (G) Z-stack slices from Figure 1—video 1. Gsdmd–/– BMMs infected with FliCON imaged at 6 hpi. Representative Z-stack from three (brightfield, PI) or one (cleaved caspase-3/7) independent experiments. 60 x magnification, Z-slices 11, 18, 21, and 26 shown. Carrots; selected examples of apoptotic bodies.
-
Figure 1—source data 1
Western blot images for Figure 1C.
- https://cdn.elifesciences.org/articles/89210/elife-89210-fig1-data1-v1.zip
-
Figure 1—source data 2
Western blot images for Figure 1D.
- https://cdn.elifesciences.org/articles/89210/elife-89210-fig1-data2-v1.zip
-
Figure 1—source data 3
Data for Figure 1E.
- https://cdn.elifesciences.org/articles/89210/elife-89210-fig1-data3-v1.xlsx
Figure 1—figure supplement 1
Vector control S. Typhimurium does not activate apoptotic backup pathways in vitro.
(A–E) Bone marrow-derived macrophages (BMMs) were infected with indicated SPI2-induced S. Typhimurium strains. (A) Western blot analysis of whole cell lysates at 4 hpi. Results from one experiment. (B) Lactate dehydrogenase (LDH) release at 1–8 hpi. Results representative of three independent experiments. Data are represented as mean ± SD of three technical replicates. Data performed at the same time as Figure 1E, graphed separately for visualization. (C) LDH release at 1–8 hpi. Results from one experiment. Data are represented as mean ± SD of three technical replicates. (D–E) Immunofluorescence and brightfield at 4 hpi. Cells were stained with PI, cleaved caspase-3/7, and Hoechst. Representative image from two (brightfield, PI) or one (cleaved caspase-3/7) independent experiments. Data performed at the same time as Figure 1F. (D) 60 x magnification, scale bar 20 µm. (E) 20 x stitched image, scale bar 500 µm.
-
Figure 1—figure supplement 1—source data 1
Western blot images for Figure 1—figure supplement 1A.
- https://cdn.elifesciences.org/articles/89210/elife-89210-fig1-figsupp1-data1-v1.zip
-
Figure 1—figure supplement 1—source data 2
Data for Figure 1—figure supplement 1B–C.
- https://cdn.elifesciences.org/articles/89210/elife-89210-fig1-figsupp1-data2-v1.xlsx
Figure 1—video 1
Engineered FliCON S. Typhimurium activates apoptosis in Gsdmd–/– bone marrow-derived macrophages (BMMs) in vitro.
Gsdmd–/– BMMs were infected with FliCON SPI2-induced S. Typhimurium strains. Cells were stained with PI, cleaved caspase-3/7, and Hoechst and imaged at 6 hpi. 60 x magnification, scale bar 20 µm. Z-stack of data in Figure 1G (slices 11, 18, 21, 26) and Figure 4B (slice 19). Performed in the same experiment as Figure 3—video 1.
Figure 2 with 1 supplement
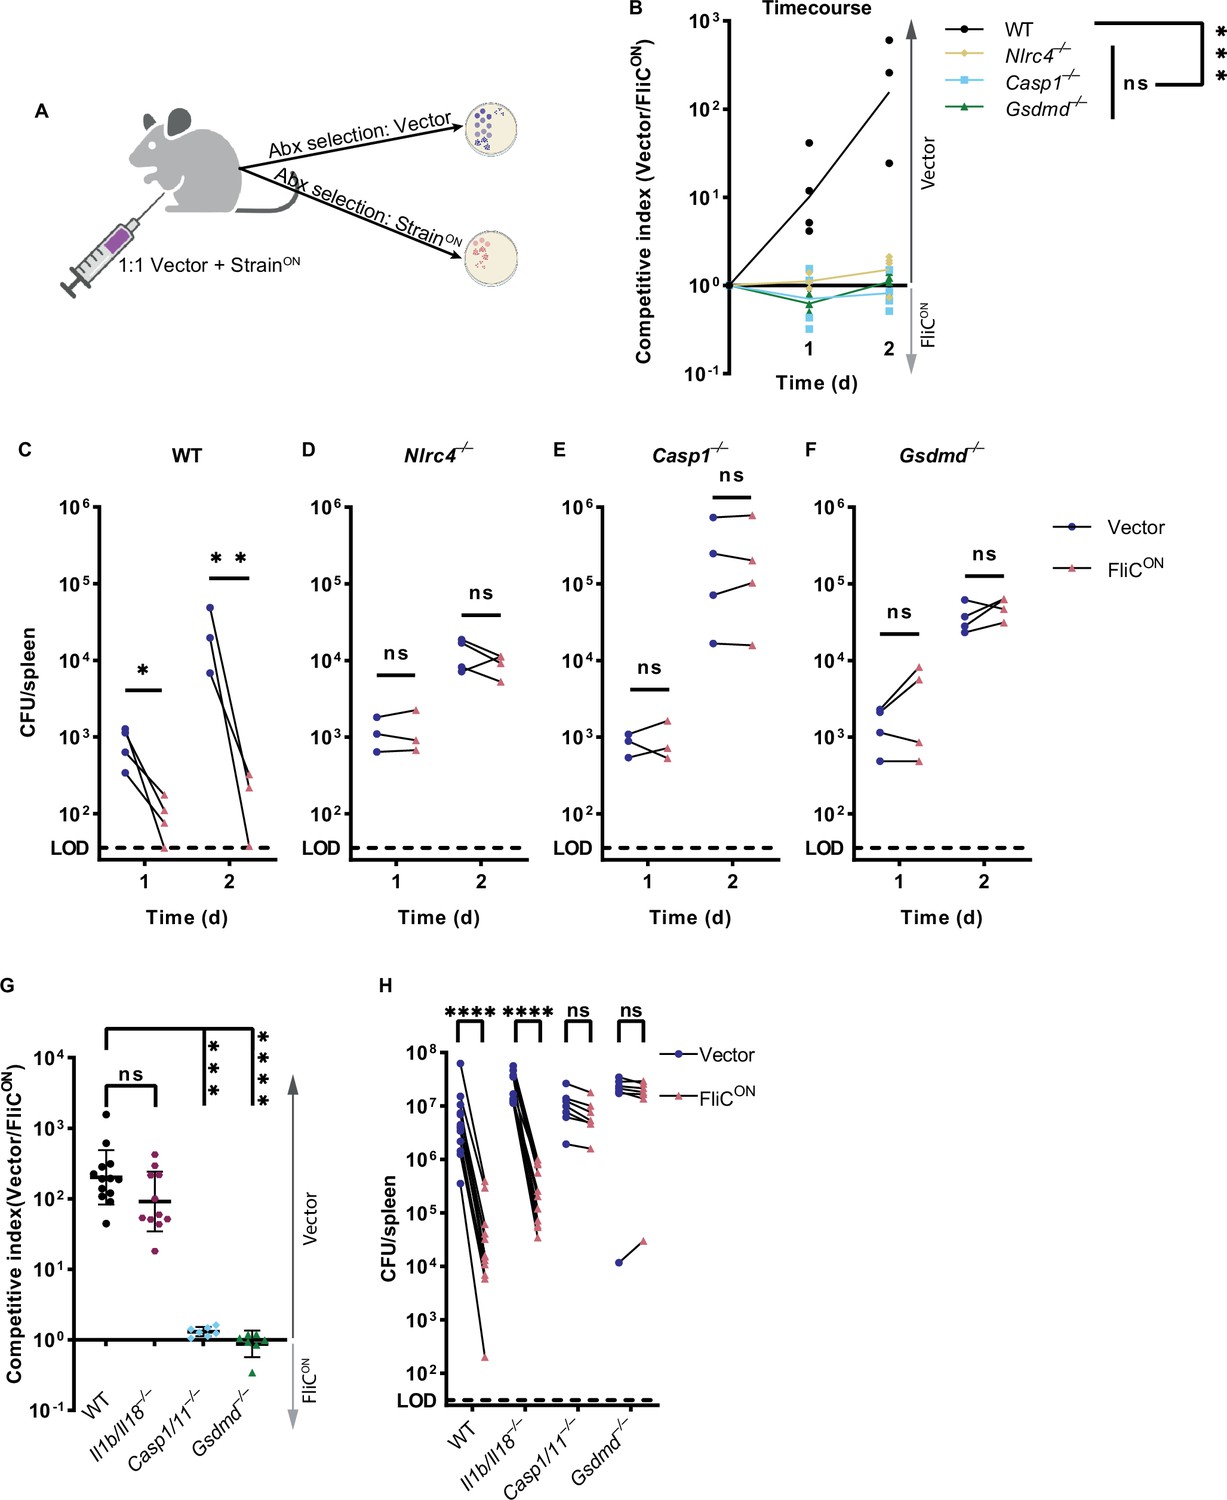
Backup apoptosis does not clear FliCON S. Typhimurium in the spleen.
(A) Schematic of competitive index infection model. (B–H) Mice were infected with a 1:1 ratio of FliCON and a vector control S. Typhimurium. Bacterial burdens in the spleen were determined at the indicated timepoints. (B) Timecourse of competitive index infection in indicated mice. Mice were infected with 5 × 10² CFU of each strain. Ratio of vector to FliCON is graphed. Data representative of three (WT, Gsdmd–/–) or two (Nlrc4–/–, Casp1–/–) independent experiments. Line connects mean, n=3–4 mice per genotype per timepoint. Two-way ANOVA n.s. p>0.05; ***p<0.001. (C–F) Individual burdens of vector and FliCON from (B). Paired vector and FliCON data from each mouse are connected by a line. Two-way repeated measure ANOVA. n.s. p>0.05, *p<0.05, **p<0.01 (G) Mice were infected with 5 × 10⁴ CFU of each strain. Bacterial burdens in the spleen were determined at 48 hpi. Ratio of vector to FliCON is graphed. Combined two independent experiments, line representing mean ± SD, n=7–13 mice per genotype. Kruskal-Wallis n.s. p>0.05; ***p<0.001, ****p<0.0001. (H) Individual burdens from (G). Paired vector and FliCON data from each mouse are connected by a line. Two-way repeated measure ANOVA. n.s. p>0.05, ****p<0.0001.
-
Figure 2—source data 1
Data for Figure 2B–H.
- https://cdn.elifesciences.org/articles/89210/elife-89210-fig2-data1-v1.xlsx
Figure 2—figure supplement 1
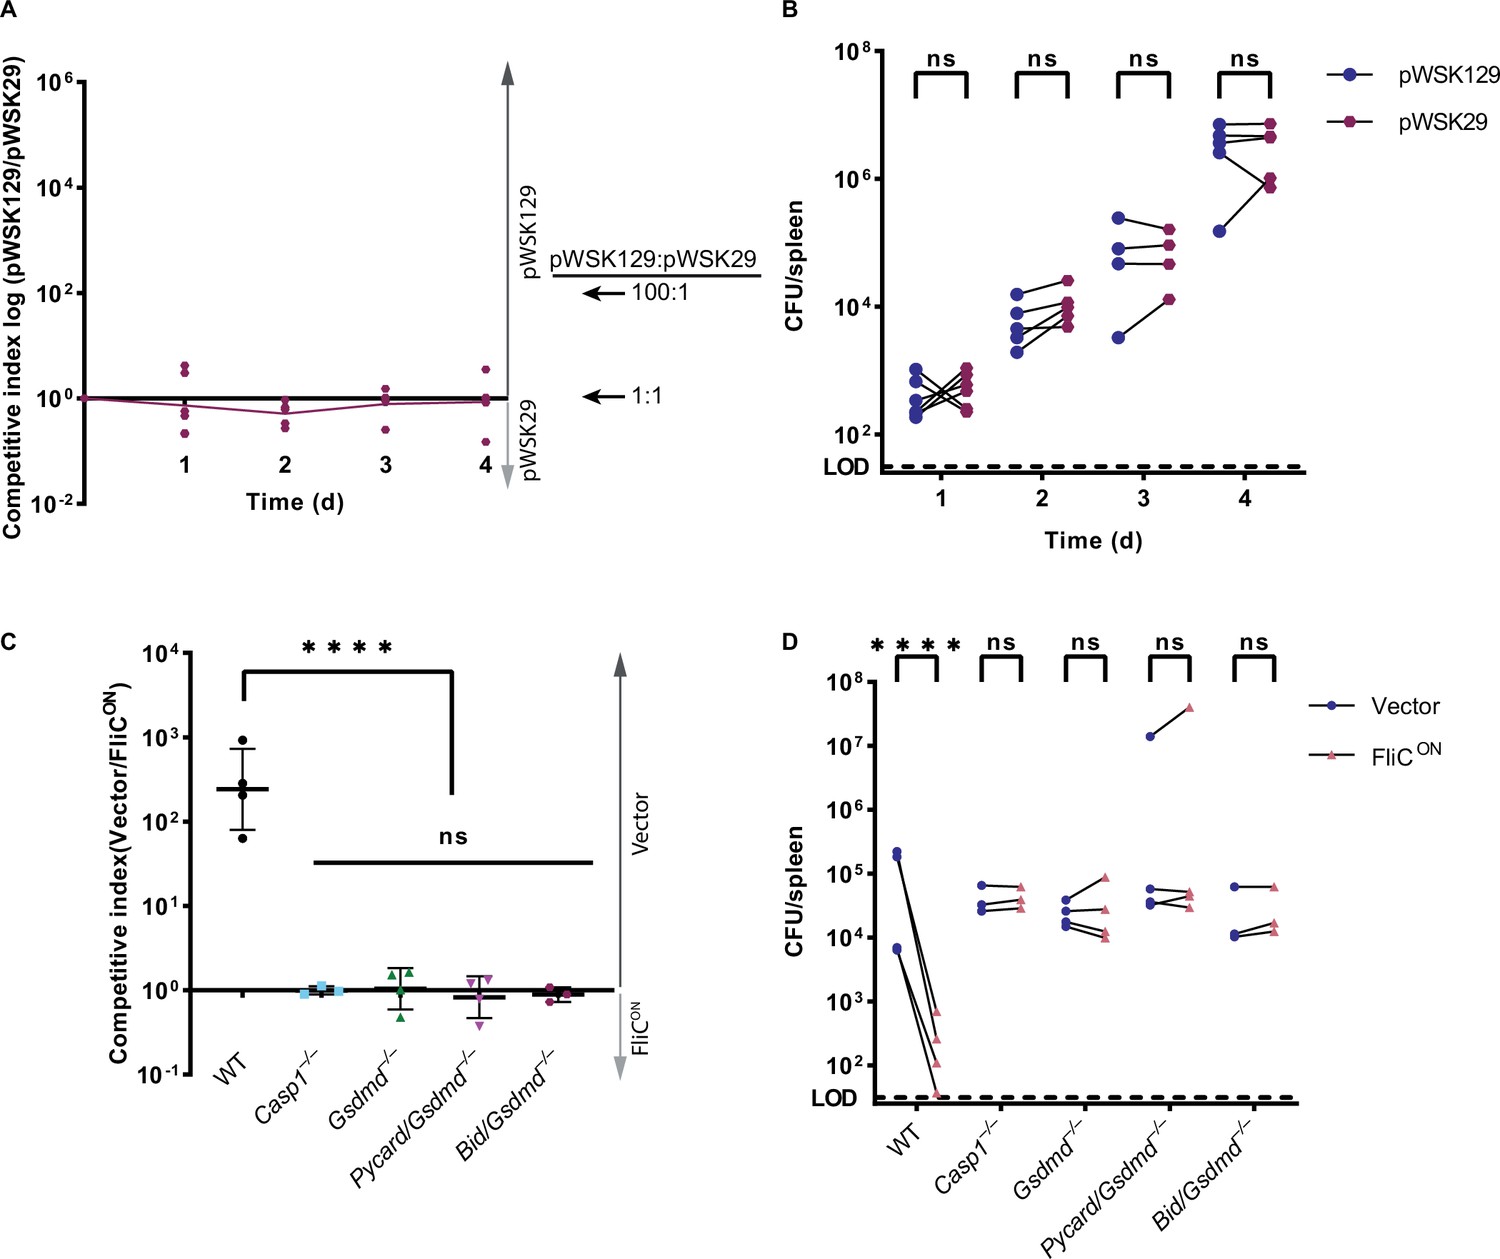
Competitive index model can be used to study the clearance of S. Typhimurium in vivo.
(A–B) Mice were infected with a 1:1 ratio of pWSK129 (‘vector’) and pWSK29 (backbone of FliCON and BIDON plasmids) S. Typhimurium. Mice were infected with 5 × 10² CFU of each strain. Bacterial burdens in the spleen were determined at the indicated timepoints. (A) Timecourse competitive index infection in WT mice. Ratio of vector to pWSK29 is graphed. Data from one independent experiment, line connects means, n=4–6 mice per timepoint. (B) Individual burdens of vector and pWSK29 from (A). Paired vector and pWSK29 data from each mouse are connected by a line. Two-way ANOVA n.s. p<0.05 (C–D) Mice were infected with a 1:1 ratio of FliCON and a vector control S. Typhimurium. Mice were infected with 5 × 10² CFU of each strain. Bacterial burdens in the spleen were determined at 48 hpi. (C) Competitive index infection in indicated mice. Data from one independent experiment, line representing mean ± SD, n=3–4 mice per genotype. One-way ANOVA n.s. p>0.05; ****p<0.0001. (D) Individual burdens of vector and FliCON from (C). Paired vector and FliCON data from each mouse are connected by a line. Two-way repeated measure ANOVA. n.s. p>0.05, ****p<0.0001.
-
Figure 2—figure supplement 1—source data 1
Data for Figure 2—figure supplement 1A–D.
- https://cdn.elifesciences.org/articles/89210/elife-89210-fig2-figsupp1-data1-v1.xlsx
Figure 3 with 2 supplements
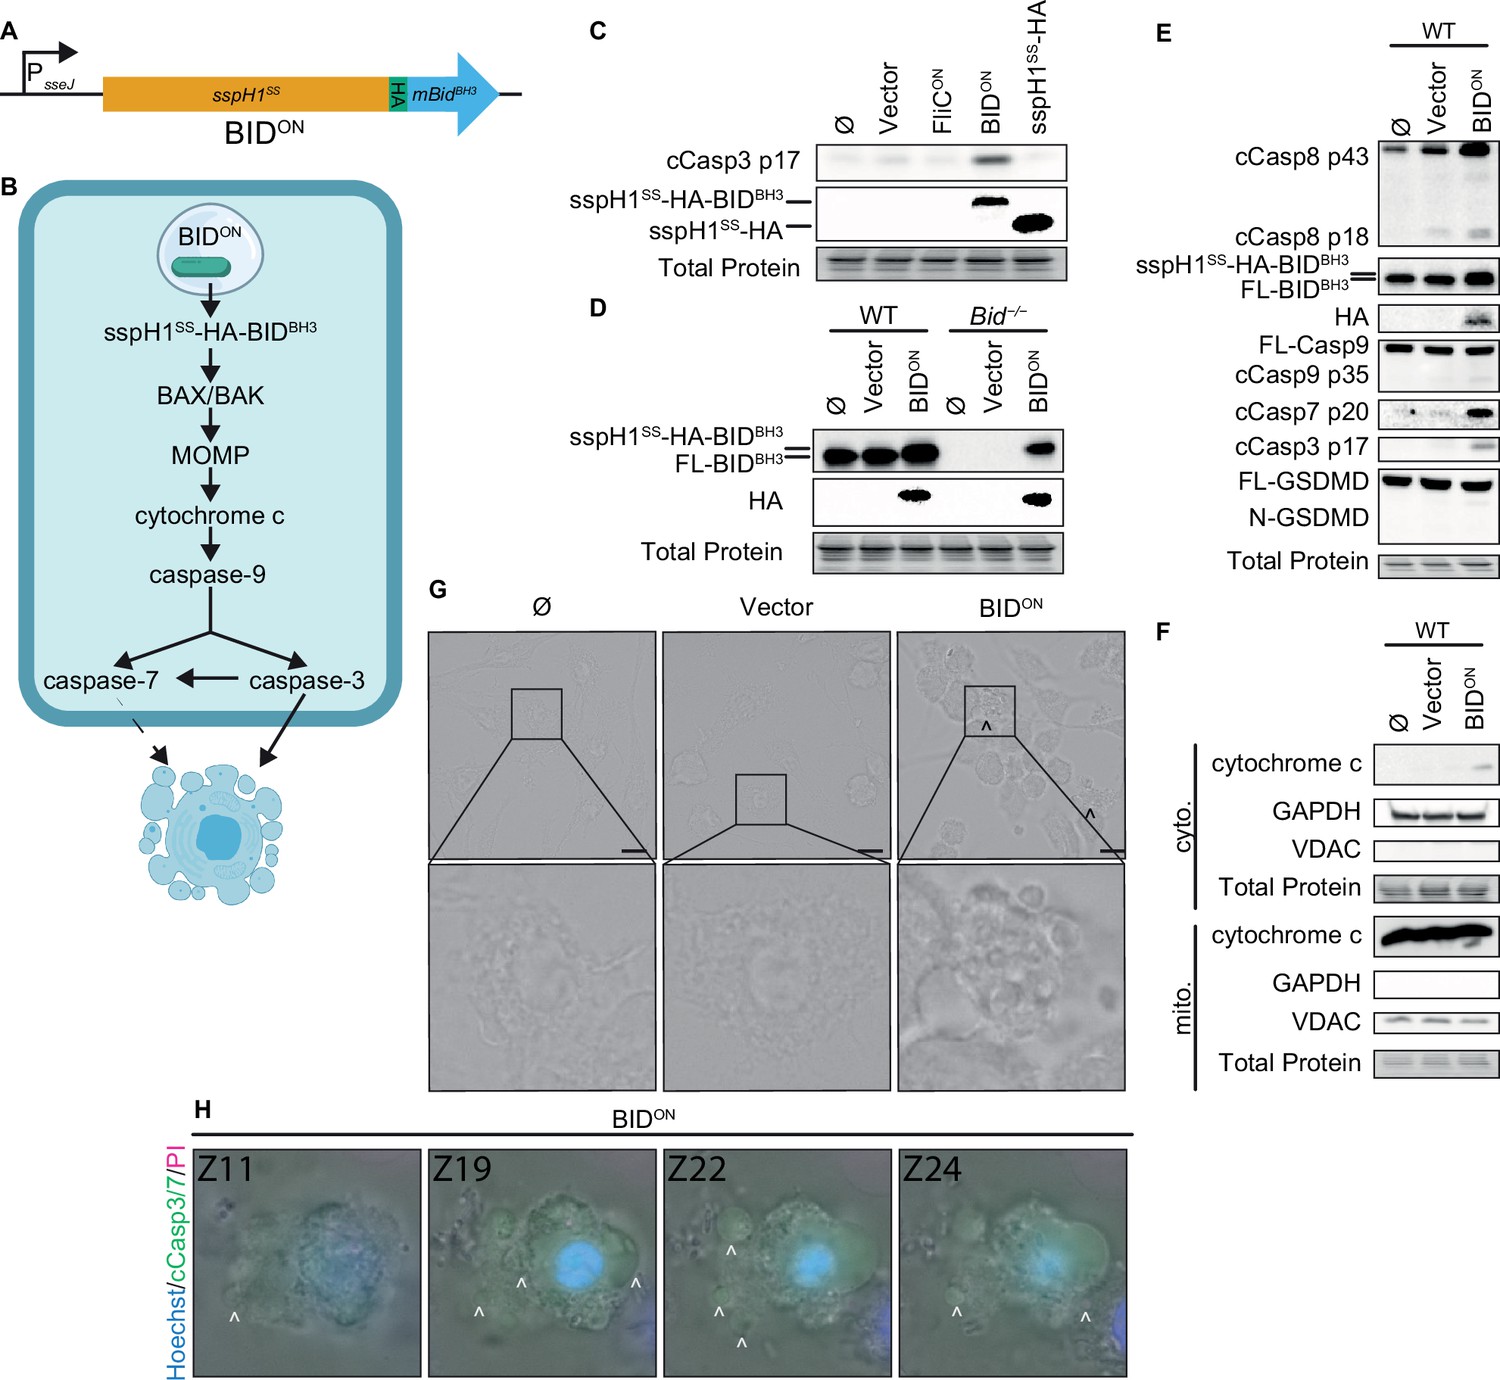
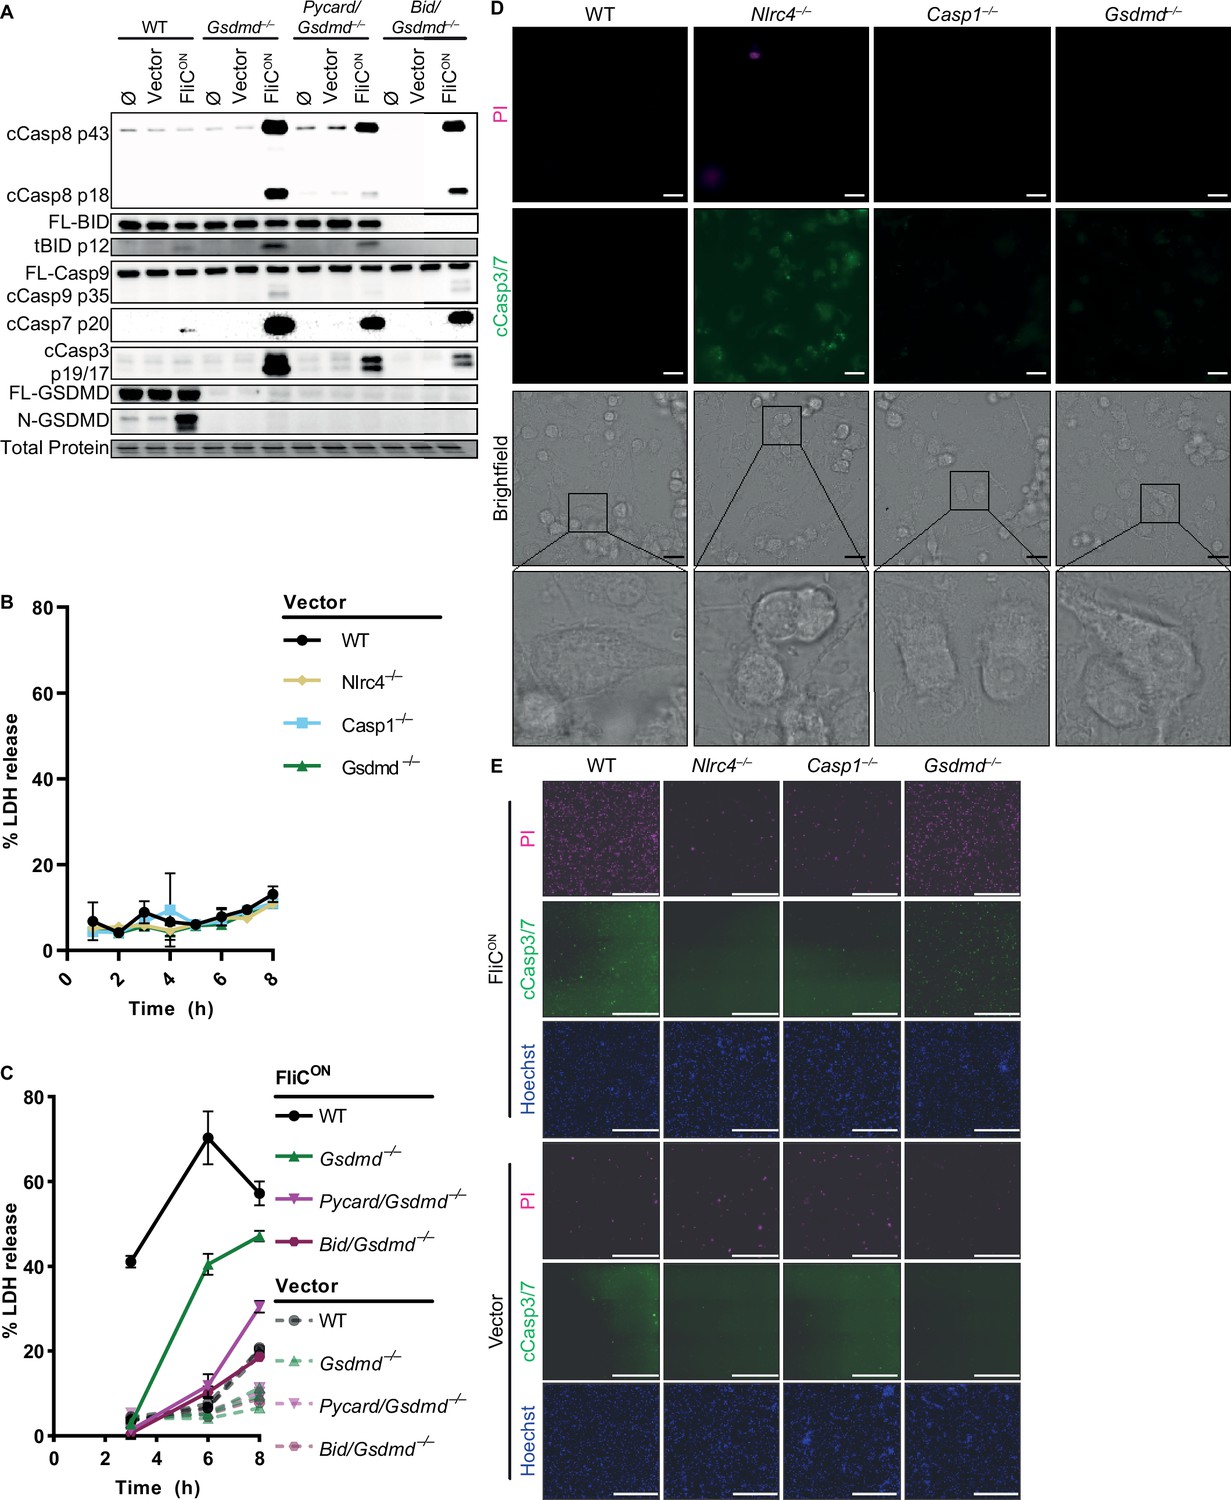
Engineered BIDON S. Typhimurium activates apoptosis in vitro.
(A) Schematic of engineered BIDON construct. (B) Pathway model showing how BIDON leads to intrinsic apoptosis. (C–G) Bone marrow-derived macrophages (BMMs) were infected with indicated SPI2-induced S. Typhimurium strains. (C–E) Western blot analysis of whole cell lysates at 6 hpi. Data representative of two (C) or three (D–E) independent experiments. (F) Western blot analysis of cytosolic and mitochondrial fractions at 4 hpi. Data representative from three independent experiments. (G) Brightfield at 6 hpi. Data representative of three independent experiments. 60 x magnification, scale bar 20 µm, carrot, apoptotic blebs. (H) Z-stack slices from Figure 3—video 1. WT BMMs infected with BIDON imaged at 6 hpi. Representative Z-stack from three (brightfield, PI) or one (cleaved caspase-3/7) independent experiments. 60 x magnification, Z-slices 11, 19, 22, and 24 shown. Carrots; selected examples of apoptotic bodies.
-
Figure 3—source data 1
Western blot images for Figure 3C.
- https://cdn.elifesciences.org/articles/89210/elife-89210-fig3-data1-v1.zip
-
Figure 3—source data 2
Western blot images for Figure 3D.
- https://cdn.elifesciences.org/articles/89210/elife-89210-fig3-data2-v1.zip
-
Figure 3—source data 3
Western blot images for Figure 3E.
- https://cdn.elifesciences.org/articles/89210/elife-89210-fig3-data3-v1.zip
-
Figure 3—source data 4
Western blot images for Figure 3F.
- https://cdn.elifesciences.org/articles/89210/elife-89210-fig3-data4-v1.zip
Figure 3—figure supplement 1

Production of SspH1SS-HA-BIDBH3 construct does not cause growth defects in BIDON S. Typhimurium.
(A) OD600 growth curve in LB media. Results are combined from two independent experiments, represented as mean ± SD. (B) Bone marrow-derived macrophages (BMMs) were infected with SPI2-induced S. Typhimurium. Western blot analysis of whole cell lysates at 6 hpi. Double band of endogenous full-length BID and sspH1SS-HA-BIDBH3 resolved.
-
Figure 3—figure supplement 1—source data 1
Data for Figure 3—figure supplement 1A.
- https://cdn.elifesciences.org/articles/89210/elife-89210-fig3-figsupp1-data1-v1.xlsx
-
Figure 3—figure supplement 1—source data 2
Western blot images for Figure 3—figure supplement 1B.
- https://cdn.elifesciences.org/articles/89210/elife-89210-fig3-figsupp1-data2-v1.zip
Figure 3—video 1
Engineered BIDON S. Typhimurium causes apoptosis in WT bone marrow-derived macrophages (BMMs) in vitro.
WT BMMs were infected with BIDON SPI2-induced S. Typhimurium strains. Cells were stained with PI, cleaved caspase-3/7, and Hoechst and imaged at 6 hpi. 60 x magnification, scale bar 20 µm. Z-stack of data in Figure 3H (slices 11, 19, 22, 24) and Figure 4B (slice 20). Performed in the same experiment as Figure 1—video 1.
Figure 4 with 1 supplement
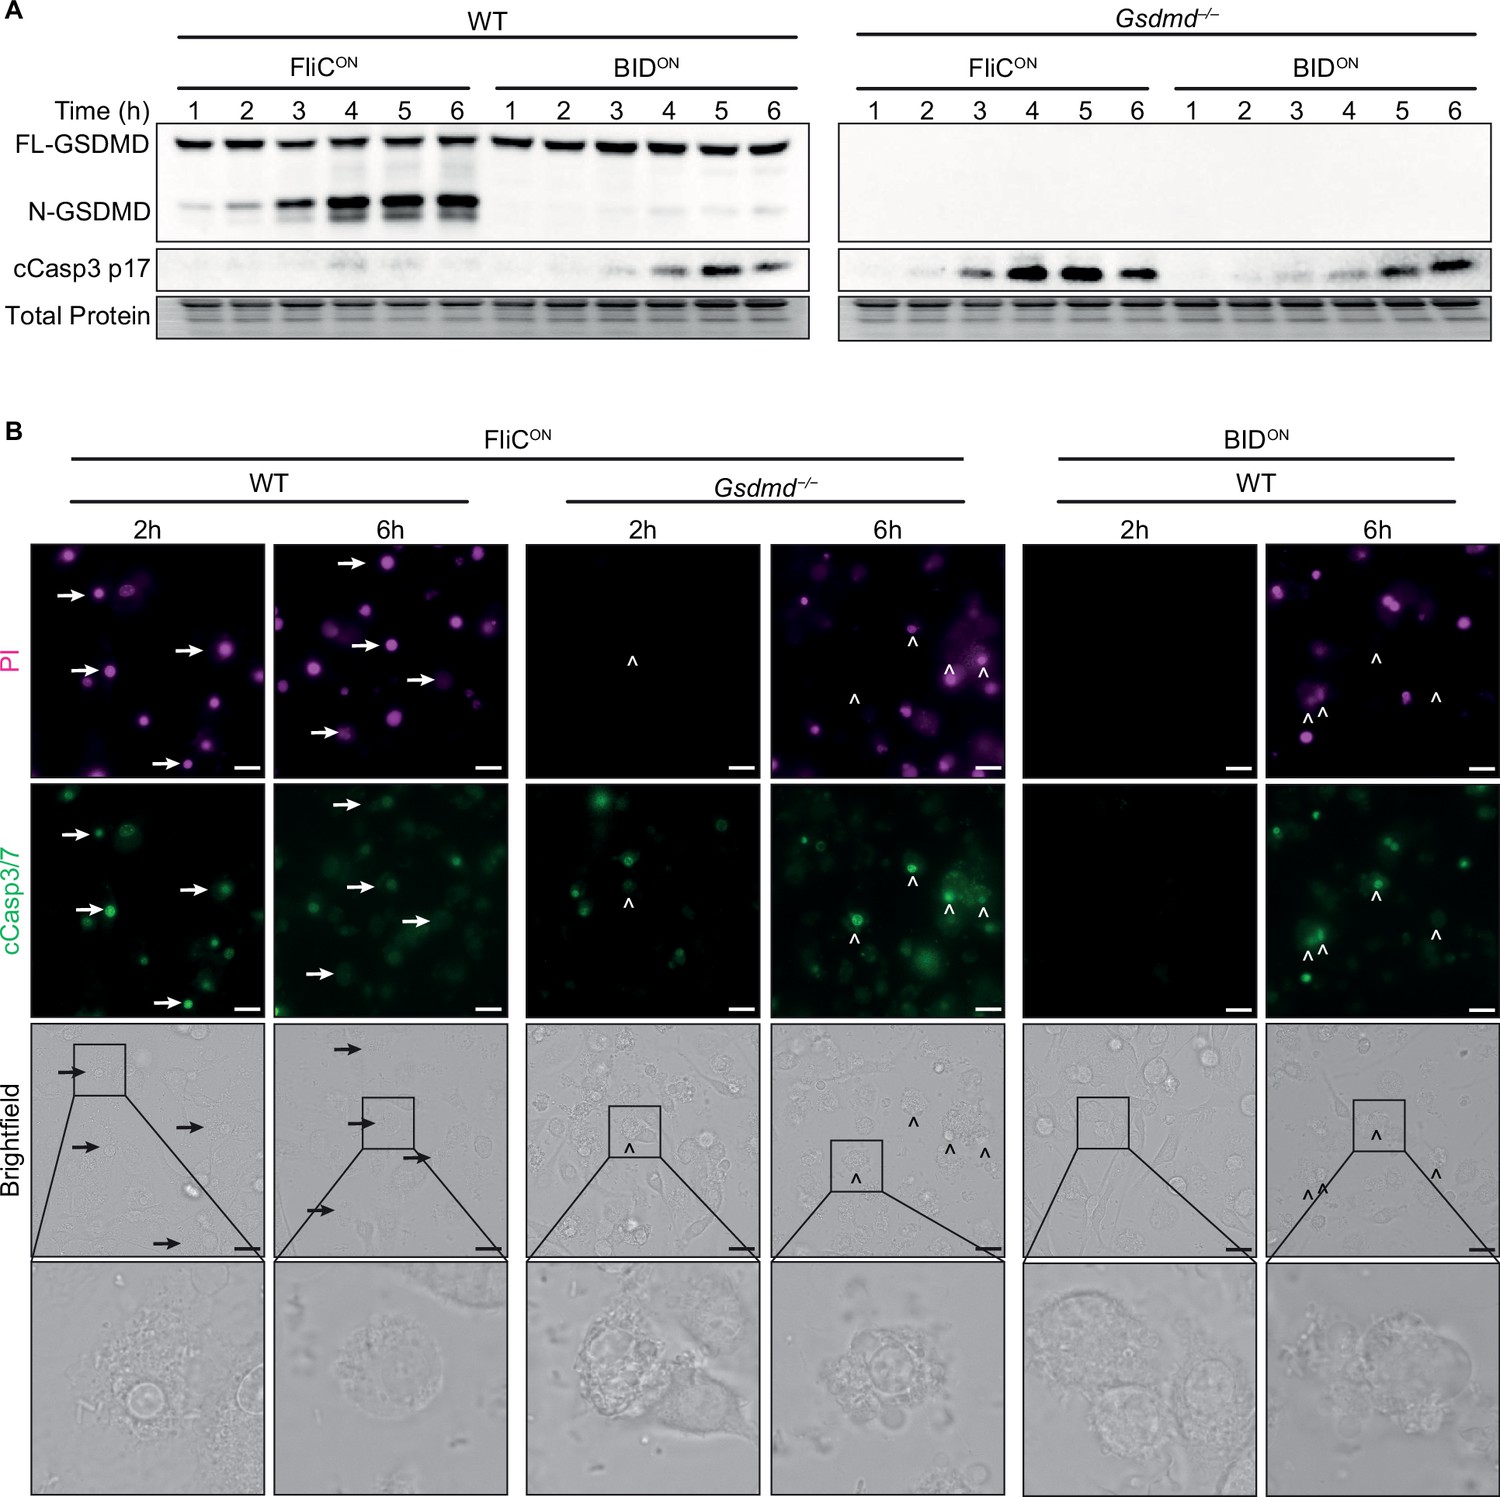
Apoptosis is induced slower than pyroptosis.
(A–B) Bone marrow-derived macrophages (BMMs) were infected with indicated SPI2-induced S. Typhimurium strains. (A) Western blot analysis of whole cell lysates. Representative of five independent experiments. (B) Immunofluorescence and brightfield. Cells were stained with PI, cleaved caspase-3/7, and Hoechst and imaged at indicated timepoints. Representative image from three (brightfield, PI) or one (cleaved caspase-3/7) independent experiments. Z-stack of the 6 hr timepoint is represented in Figure 1—video 1 and Figure 3—video 1. Z-stack slice 19 (FliCON in Gsdmd–/–) and slice 20 (BIDON in WT) shown here. 60 x magnification, scale bar 20 µm. Arrows, pyroptotic cells. Carrots, apoptotic cells.
-
Figure 4—source data 1
Western blot images for Figure 4A.
- https://cdn.elifesciences.org/articles/89210/elife-89210-fig4-data1-v1.zip
Figure 4—figure supplement 1
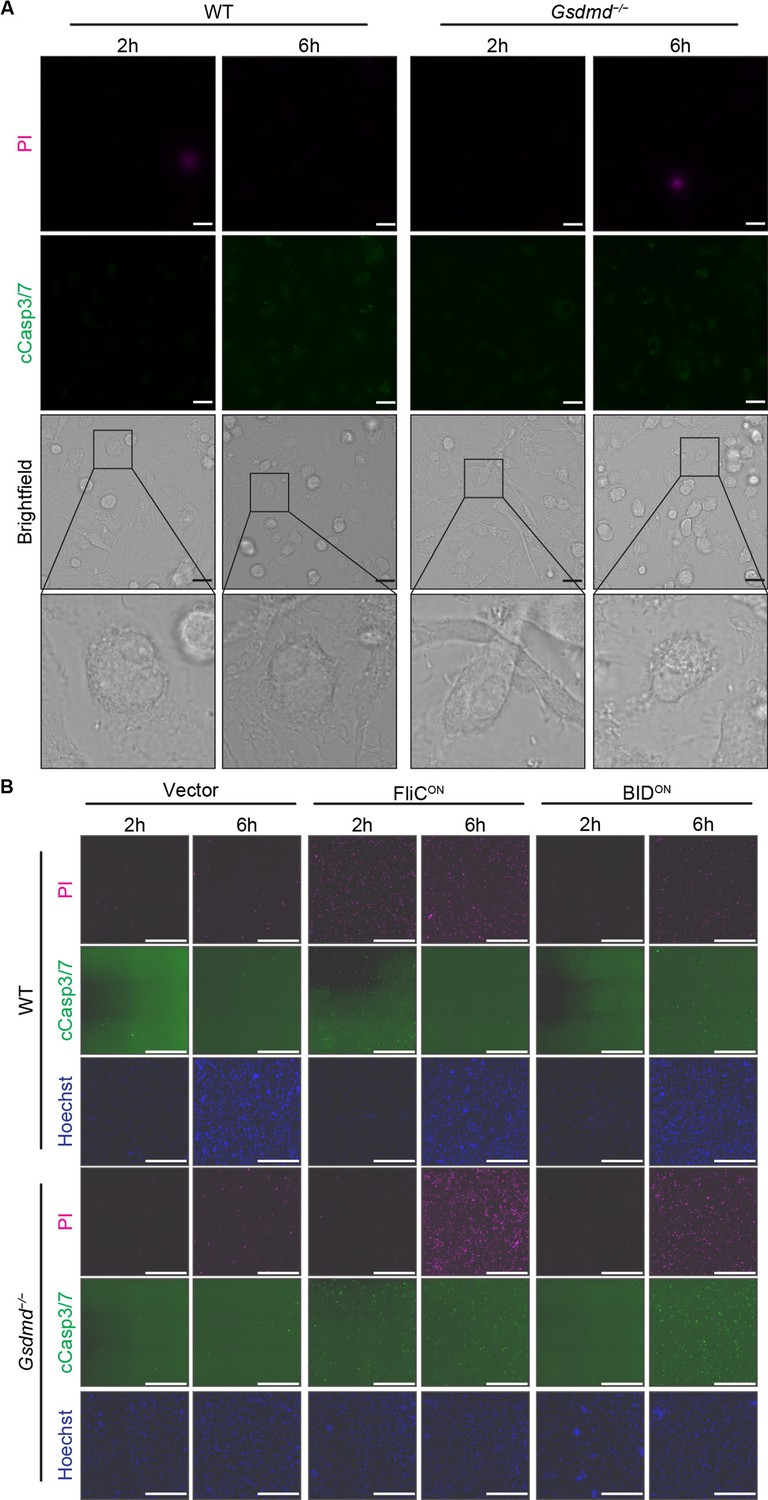
Vector control S. Typhimurium does not cause regulated cell death (RCD) in vitro.
(A–B) Bone marrow-derived macrophages (BMMs) were infected with indicated SPI2-induced S. Typhimurium strains. Cells were stained with PI, cleaved caspase-3/7, and Hoechst and imaged at indicated timepoints. Representative image from three (brightfield, PI) or one (cleaved caspase-3/7) independent experiments. Data performed at the same time as Figure 4B. (A) 60 x magnification, scale bar 20 µm. (B) 20 x stitched image, scale bar 500 µm.
Figure 5 with 1 supplement
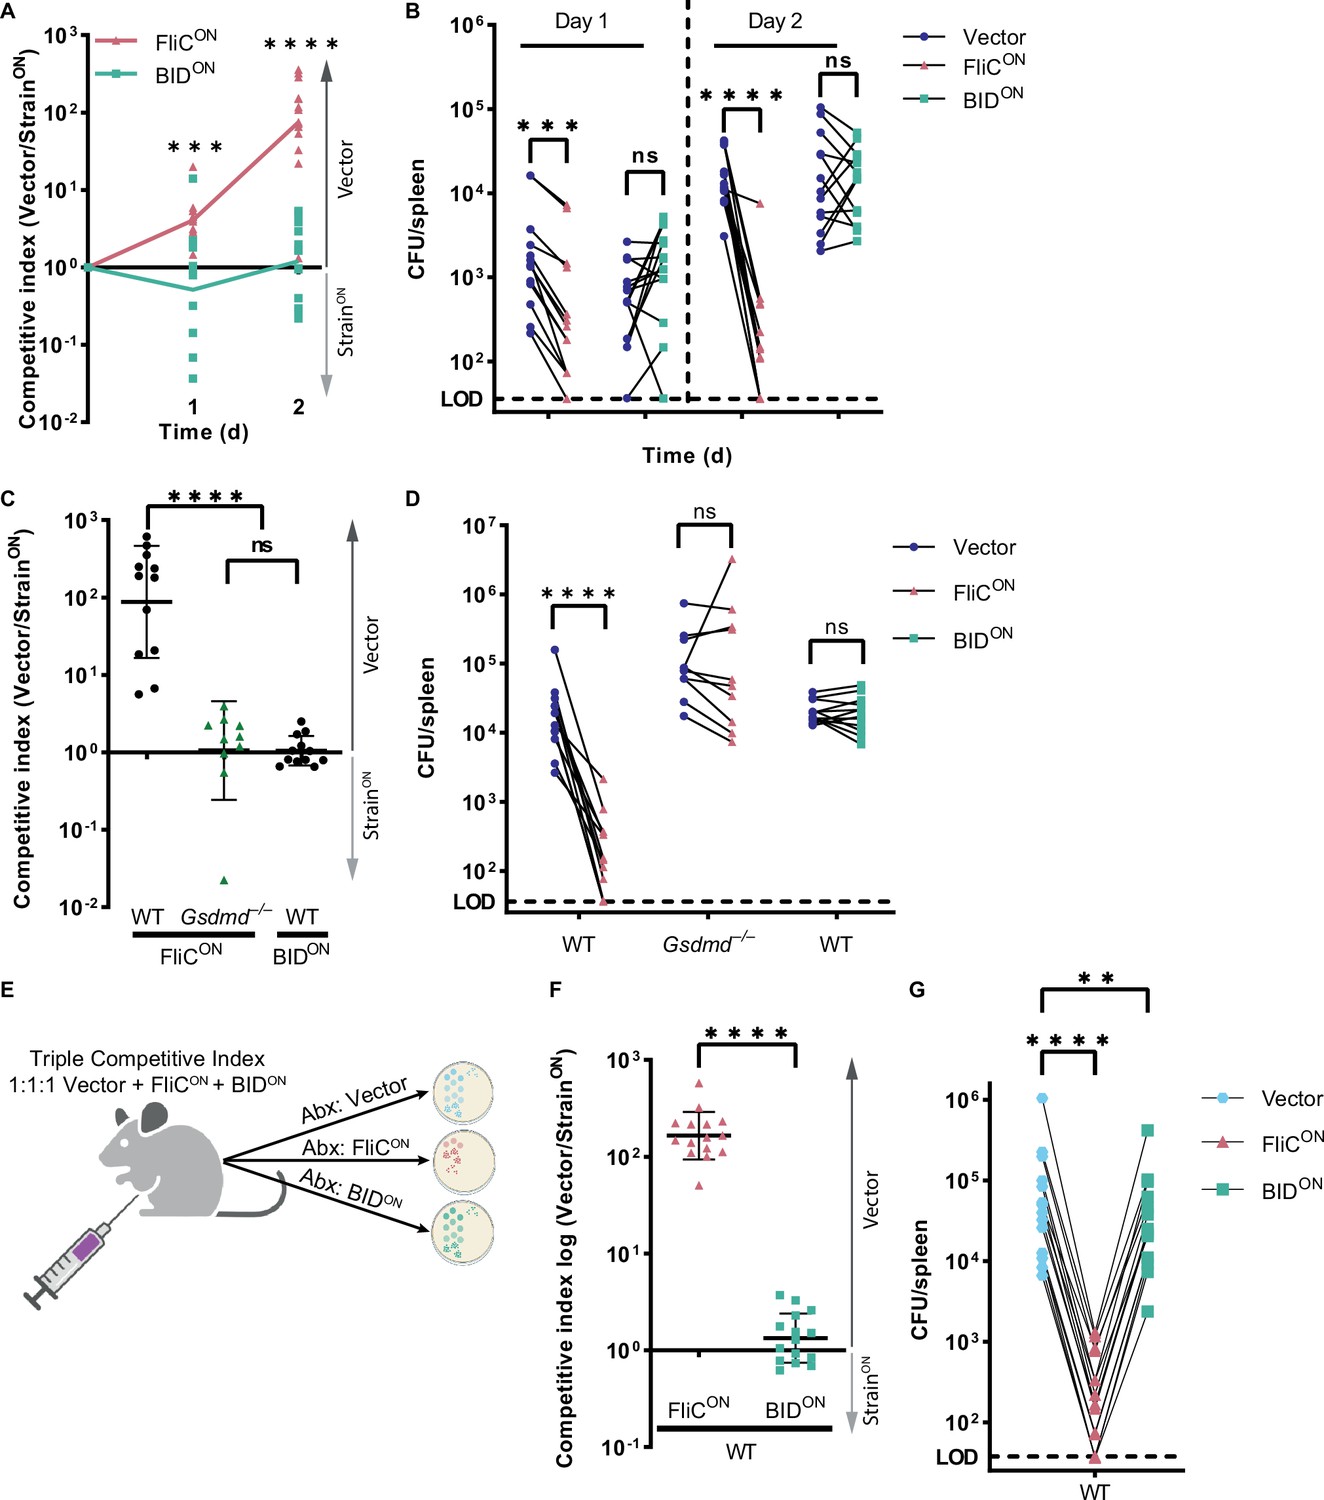
Intrinsic apoptosis does not clear engineered S. Typhimurium in the spleen.
(A–D) Mice were infected with a 1:1 ratio of either FliCON or BIDON and a vector control S. Typhimurium. Mice were infected with 5 × 10² CFU of each strain. Bacterial burdens in the spleen were determined at the indicated timepoints. (A) Timecourse competitive index infection in WT mice. Ratio of vector to either FliCON or BIDON is graphed. Data is combined from three independent experiments, line connects means, n=13–14 mice per condition. Two-way ANOVA *** p<0.001, ****p<0.0001. (B) Individual burdens of vector and FliCON or BIDON from (A). Paired vector and FliCON or BIDON data from each mouse are connected by a line. Two-way repeated measure ANOVA n.s. p>0.05; ***p<0.001, ****p<0.0001. (C) Competitive index infection of indicated mice infected with either FliCON or BIDON. Ratio of vector to either FliCON or BIDON is graphed. Bacterial burdens in the spleen were determined at 48 hpi. Data is combined from three independent experiments, line representing mean ± SD, n=10–12 mice per condition. One-way ANOVA n.s. p>0.05, ****p<0.0001. (D) Individual burdens of vector and FliCON or BIDON from (C). Paired vector and StrainON data from each mouse are connected by a line. Two-way repeated measure ANOVA n.s. p>0.05, ****p<0.0001. (E) Schematic of triple competitive index model. (F–G) Mice were infected simultaneously with three strains, 5 × 10² CFU each of CamR vector, KanR FliCON, and AmpR BIDON S. Typhimurium. Bacterial burdens in the spleen were determined at 48 hpi. (F) Triple competitive index infection of WT mice. Ratio of CamR vector to KanR FliCON or AmpR BIDON is graphed. Data is combined from three independent experiments, line representing mean ± SD, n=15. Unpaired two-tailed t-test ****p<0.0001. (G) Individual burdens of CamR vector, KanR FliCON, and AmpR BIDON from (F). Paired vector, FliCON, and BIDON data from each mouse are connected by a line. One-way repeated measure ANOVA **p<0.01, ****p<0.0001.
-
Figure 5—source data 1
Data for Figure 5A–D and F–G.
- https://cdn.elifesciences.org/articles/89210/elife-89210-fig5-data1-v1.xlsx
Figure 5—figure supplement 1

pWSK229 can be used for triple competitive index infection in vivo.
(A–B) Mice were infected simultaneously with three strains, 5 × 10² CFU each of pWSK229 (‘vector (Cam),’ Cam), pWSK129 (Kan), and pWSK29 (Amp) S. Typhimurium. Bacterial burdens in the spleen were determined at 48 hpi. (A) Triple competitive index infection of WT mice. Ratio of vector (Cam) to pWSK129 and vector to pWSK29 is graphed. Data representative of three experiments. Data represented by line at mean ± SD, n=5. Unpaired two-tailed t-test n.s. p>0.05. (B) Individual burdens of vector (Cam), pWSK129, and pWSK29 from (A). Paired vector, pWSK129, and pWSK29 data from each mouse are connected by a line. Repeated measures one-way ANOVA n.s. p>0.05.
-
Figure 5—figure supplement 1—source data 1
Data for Figure 5—figure supplement 1A–B.
- https://cdn.elifesciences.org/articles/89210/elife-89210-fig5-figsupp1-data1-v1.xlsx
Figure 6
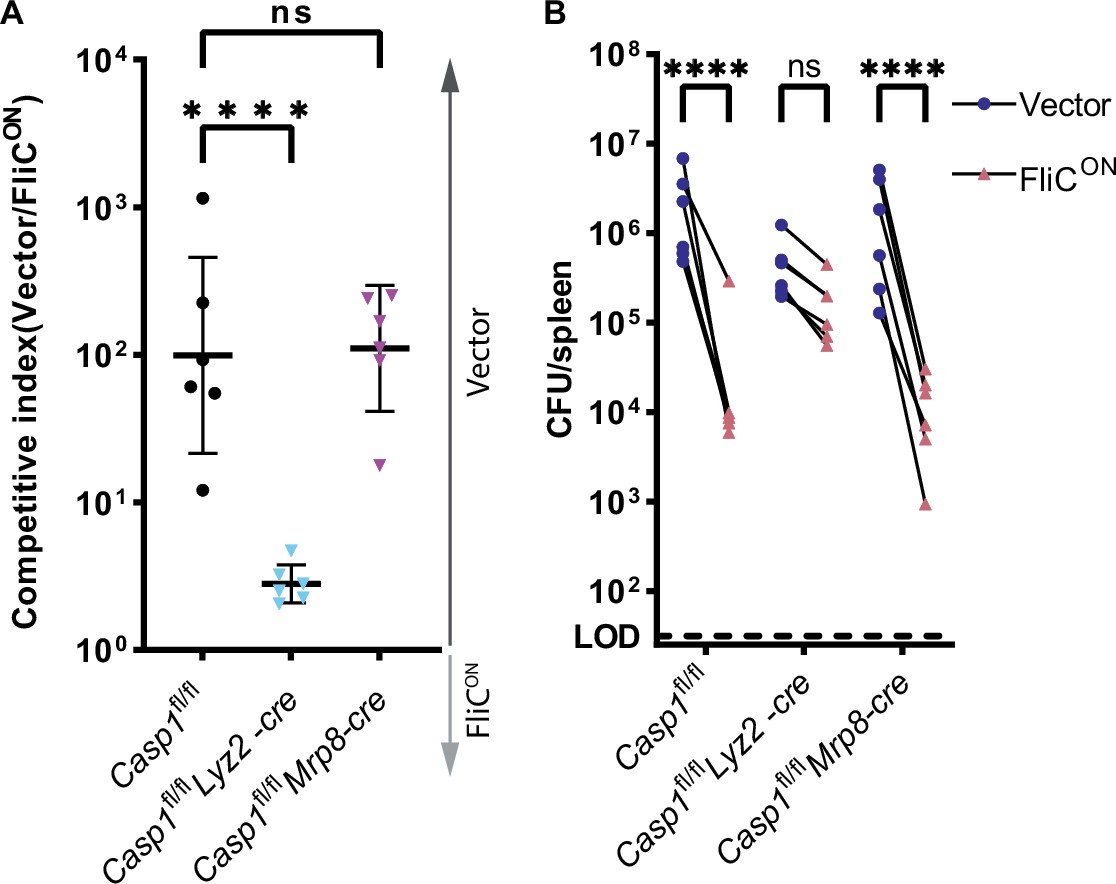
Pyroptosis clears FliCON from myeloid compartment in vivo.
(A) Mice were infected with 5 × 10⁴ CFU of each strain. Bacterial burdens in the spleen were determined at 48 hpi. Ratio of vector to FliCON is graphed. Combined two independent experiments, line representing mean ± SD, n=6 mice per genotype. One-way ANOVA n.s. p>0.05; ****p<0.0001. (B) Individual burdens from (A). Paired vector and FliCON data from each mouse are connected by a line. Two-way repeated measure ANOVA. n.s. p>0.05, ****p<0.0001.
-
Figure 6—source data 1
Data for Figure 6A–B.
- https://cdn.elifesciences.org/articles/89210/elife-89210-fig6-data1-v1.xlsx
Figure 7 with 1 supplement
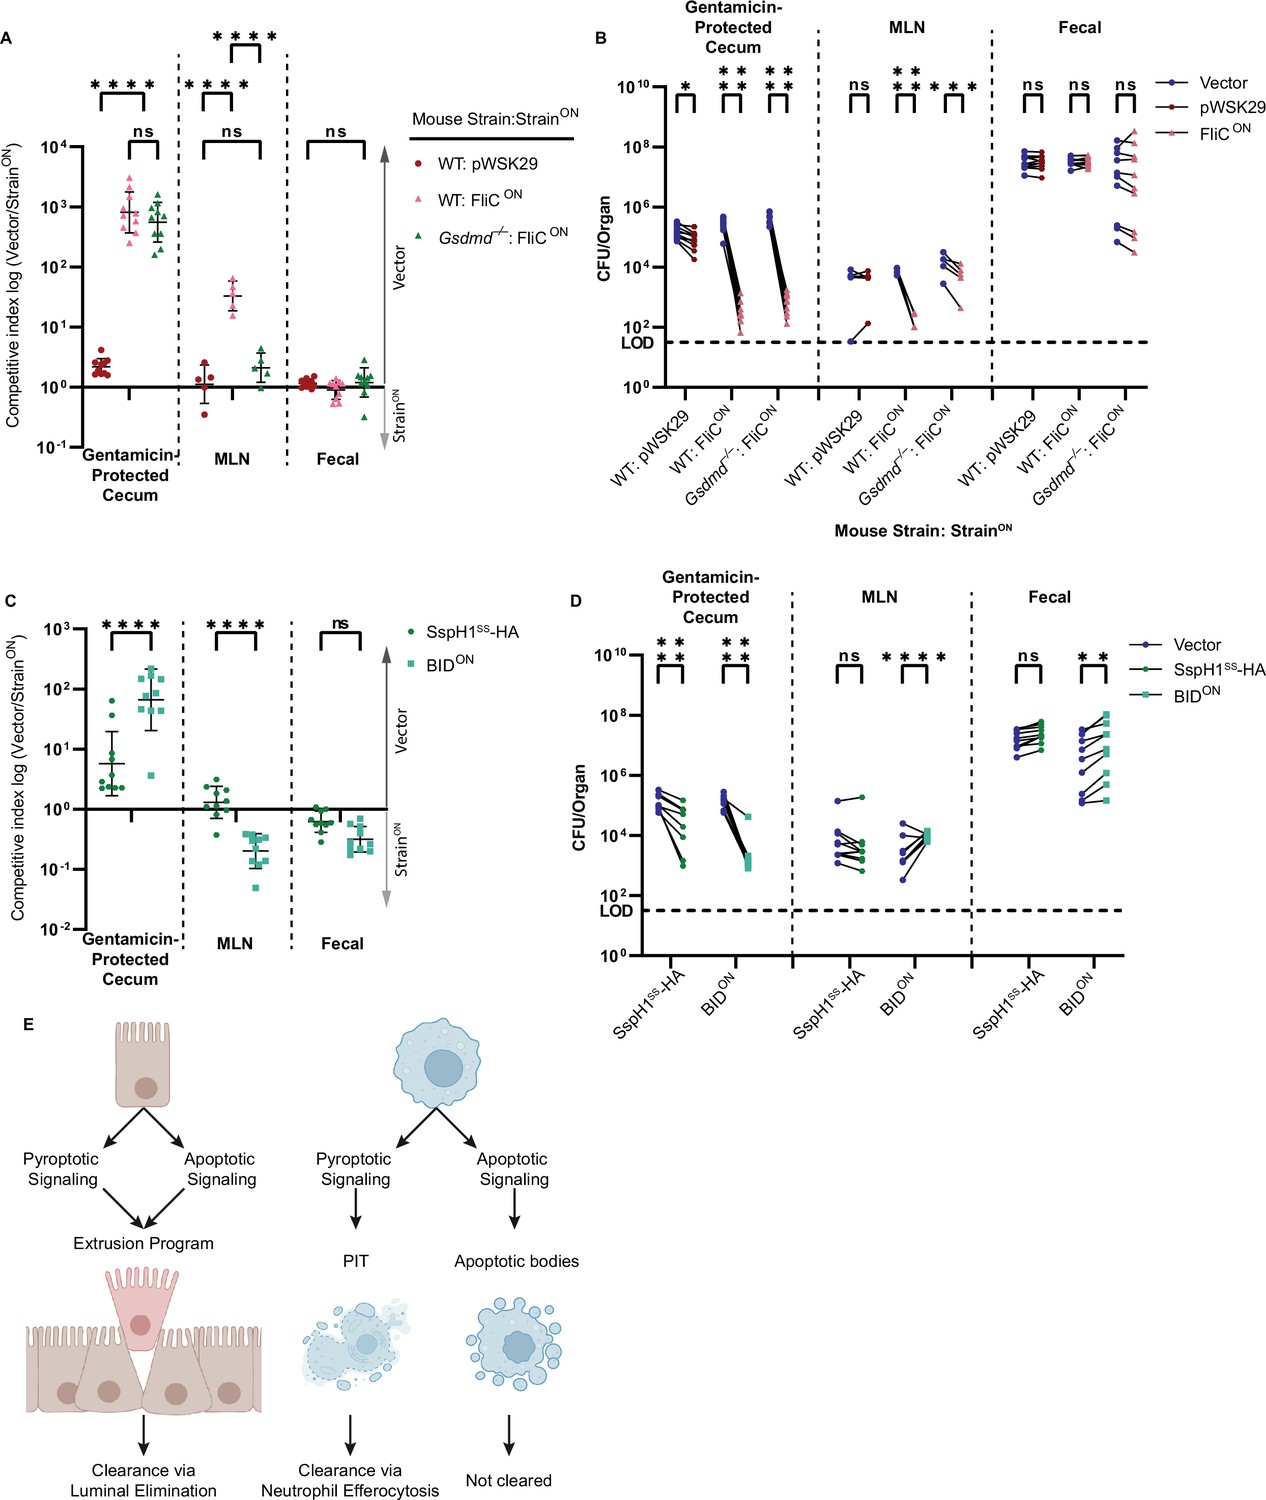
Apoptotic pathways lead to clearance in the cecum.
(A–D) Mice were orally treated with 20 mg streptomycin, and 24 hr later orally infected with 1 × 10⁷ CFUs total bacteria comprised of a 1:1 ratio of the indicated ampicillin-resistant strain and kanamycin-resistant vector (pWSK129) control S. Typhimurium, all on a flgB mutant background. Bacterial burdens in the cecum, mesenteric lymph nodes (MLN), and fecal samples were determined at 48 hpi. (A) Competitive index is graphed as a ratio of vector to either pWSK29 or FliCON. Data is combined from two (cecum, fecal) or one (MLN) independent experiments (MLN was not harvested in the first experiment, where we harvested the spleen, which had negligible burdens; one additional representative experiment is shown in Figure 7—figure supplement 1A–B), line representing mean ± SD, n=10 (cecum, fecal) or 5 (MLN) mice per condition. Two-way repeated measure ANOVA n.s. p>0.05, ****p<0.0001. (B) Individual burdens of vector and pWSK29 or FliCON from (A). Paired vector and StrainON data from each mouse are connected by a line. Two-way repeated measure ANOVA n.s. p>0.05, *p<0.05, ***p<0.001, ****p<0.0001. (C) Competitive index infection of WT mice infected with either SspH1SS-HA or BIDON. Ratio of vector to either SspH1SS-HA or BIDON is graphed. Data is combined from two independent experiments, line representing mean ± SD, n=10 mice per condition. Two-way repeated measure ANOVA n.s. p>0.05, ****p<0.0001. (D) Individual burdens of vector and SspH1SS-HA or BIDON from (C). Paired vector and StrainON data from each mouse are connected by a line. Two-way repeated measure ANOVA n.s. p>0.05, **p<0.01, ****p<0.0001. (E) Schematic demonstrating the ability of pyroptotic or apoptotic signaling to lead to clearance of engineered S. Typhimurium in either intestinal epithelial cells (IECs) or macrophages.
-
Figure 7—source data 1
Data for Figure 7A–D.
- https://cdn.elifesciences.org/articles/89210/elife-89210-fig7-data1-v1.xlsx
Figure 7—figure supplement 1
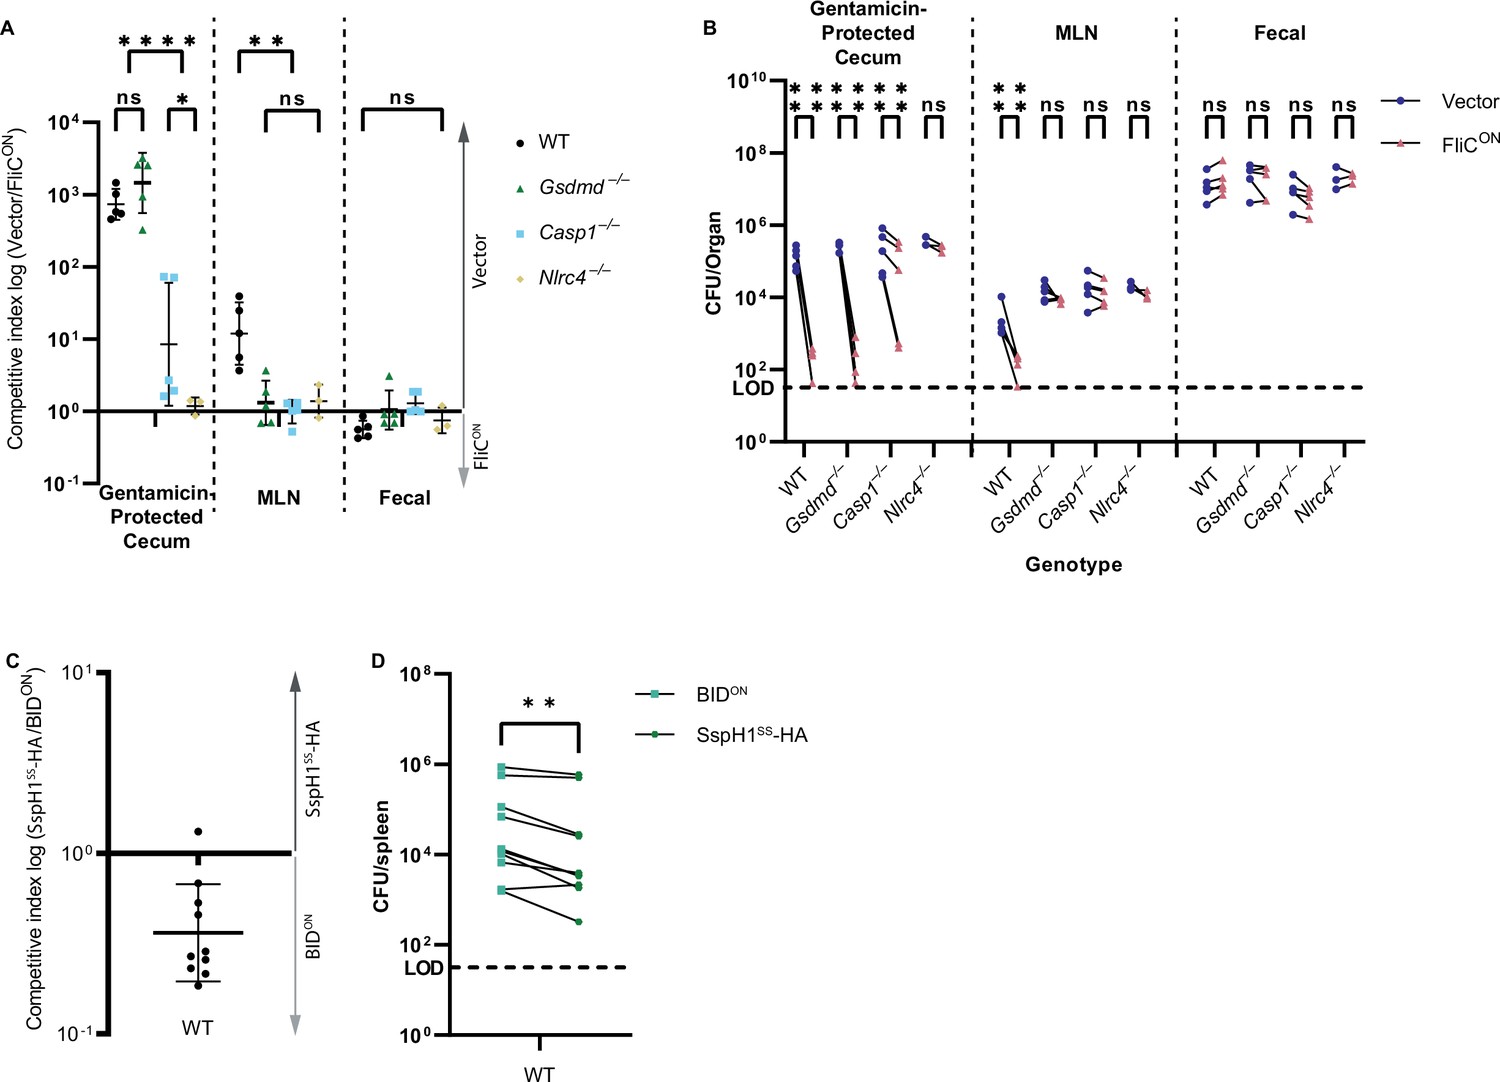
Clearance of FliCON in the cecum is NLRC4-dependent.
(A–B) Mice were orally treated with 20 mg streptomycin, and 24 hr later orally infected with 1 × 10⁷ CFUs total bacteria comprised of a 1:1 ratio of FliCON and vector control S. Typhimurium, all on a flgB mutant background. Bacterial burdens in the cecum, mesenteric lymph nodes (MLN), and fecal samples were determined at 48 hpi. (A) Competitive index is graphed as a ratio of vector to FliCON. Data from one independent experiment, line representing mean ± SD, n=3–5 mice per condition. Two-way repeated measure ANOVA n.s. p>0.05, *p<0.05, **p<0.01, ****p<0.0001. (B) Individual burdens of vector and FliCON from (A). Paired vector and FliCON data from each mouse are connected by a line. Two-way repeated measure ANOVA n.s. p>0.05, ****p<0.0001.(C–D) Mice were infected with a 1:1 ratio of KanR BIDON and SspH1SS-HA vector control S. Typhimurium. Mice were infected with 5 × 10² CFU of each strain. Bacterial burdens in the spleen were determined at 48 hpi. (C) Competitive index infection of WT mice infected with KanR BIDON. Ratio of SspH1SS-HA vector to KanR BIDON is graphed. Data is combined from two independent experiments, line representing mean ± SD, n=10 mice. (D) Individual burdens of SspH1SS-HA vector and KanR BIDON from (C). Paired SspH1SS-HA vector and KanR BIDON data from each mouse are connected by a line. Paired t-test **p<0.01.
-
Figure 7—figure supplement 1—source data 1
Data for Figure 7—figure supplement 1A–D.
- https://cdn.elifesciences.org/articles/89210/elife-89210-fig7-figsupp1-data1-v1.xlsx
Tables
Key resources table
| Reagent type (species) or resource | Designation | Source or reference | Identifiers | Additional information |
|---|---|---|---|---|
| gene (Mus musculus) | Bid | NCBI | NM_007544.4 | AA79-102 (BH3 domain) used for plasmid construction |
| gene (Salmonella enterica serovar Typhimurium) | SspH1 | GenBank | ACY87967.1 | AA1-137 (secretion signal) used for plasmid construction |
| strain, strain background (Salmonella enterica serovar Typhimurium, 14028s) | WT | Gift from Samuel I. Miller | ||
| strain, strain background (Salmonella enterica serovar Typhimurium, SL1344) | flgB | Gift from Kelly T. Hughes | ||
| strain, strain background (Salmonella enterica serovar Typhimurium, CS401) | flgC ΔprgH-K | Gift from Kelly T. Hughes | ||
| strain, strain background (Mus musculus, C57BL/6 J) | WT | Jax and Miao lab colony, Jax stock No. 000664 | Colony bred WT mice were always used in experiments with colony bred knockout mice. Jax-purchased mice were only used in experiments having only WT mice from Jax. | |
| strain, strain background (Mus musculus, C57BL/6 J) | Mrp8-cre | Miao lab colony, Jax stock No. 021614 | ||
| strain, strain background (Mus musculus, C57BL/6 J) | Lyz2tm1(cre)Ifo (common name LysM-cre) | Miao lab colony, Jax stock No. 004781 | ||
| strain, strain background (Mus musculus, C57BL/6 J) | Casp1fl/fl | Miao lab colony, Hu et al., 2016 | ||
| strain, strain background (Mus musculus, C57BL/6 J) | Casp1–/– | Miao lab colony, Rauch et al., 2017 | ||
| strain, strain background (Mus musculus, C57BL/6 J) | Casp1–/– Casp11129mt/129mt (referred to as Casp1/11–/–) | Miao lab colony, Kuida et al., 1995 | ||
| strain, strain background (Mus musculus, C57BL/6 J) | Gsdmd–/– | Miao lab colony, Rauch et al., 2017 | ||
| strain, strain background (Mus musculus, C57BL/6 J) | Nlrc4–/– | Miao lab colony, Mariathasan et al., 2004 | ||
| strain, strain background (Mus musculus, C57BL/6 J) | Bid–/– | Miao lab colony, Yin et al., 1999 | ||
| strain, strain background (Mus musculus, C57BL/6 J) | Il1b/Il18–/– | Miao lab colony, Shornick et al., 1996; Takeda et al., 1998 | ||
| strain, strain background (Mus musculus, C57BL/6 J) | Pycard–/–Gsdmd–/– (referred to as Pycard/Gsdmd–/–) | Miao lab colony, crossed in this paper | Produced by crossing Pycard–/– (also known as Asc–/–) (Mariathasan et al., 2004) and Gsdmd–/– mice | |
| strain, strain background (Mus musculus, C57BL/6 J) | Bid–/–Gsdmd–/– (referred to as Bid/Gsdmd–/–) | Miao lab colony, crossed in this paper | Produced by crossing Bid–/–and Gsdmd–/– mice | |
| antibody | Rabbit anti- cytochrome c monoclonal antibody | Cell Signaling Technology | 11940 | Western blot 1:750 dilution |
| antibody | Rabbit anti-GAPDH polyclonal antibody | Abcam | Ab9485 | Western blot 1:10,000 dilution |
| antibody | Rabbit anti-VDAC monoclonal antibody | Cell Signaling Technology | 4661 | Western blot 1:750 dilution |
| antibody | Rabbit anti-cleaved caspase-8 monoclonal antibody | Cell Signaling Technology | 8592 | Western blot 1:1000 dilution |
| antibody | Rat anti-BID monoclonal antibody | R&D | MAB860 | Western blot 1:500 dilution |
| antibody | Mouse anti-caspase-9 monoclonal antibody | Cell Signaling Technology | 9508 | Western blot 1:750 dilution |
| antibody | Rabbit anti-cleaved caspase-7 polyclonal antibody | Cell Signaling Technology | 9491 | Western blot 1:1000 dilution |
| antibody | Rabbit anti-cleaved caspase-3 polyclonal antibody | Cell Signaling Technology | 9661 | Western blot 1:750 dilution |
| antibody | Rabbit anti-gasdermin D monoclonal antibody | Abcam | Ab209845 | Western blot 1:1000 dilution |
| antibody | Mouse anti-HA.11 monoclonal antibody | Biolegend | MMS-101R | Western blot 1:2000 dilution |
| antibody | Goat anti-rabbit polyclonal antibody | Cell Signaling Technology | 7074 | Western blot secondary 1:2000 dilution |
| antibody | Goat anti-rat polyclonal antibody | Jackson ImmunoResearch | 112-035-062 | Western blot secondary 1:10,000 dilution |
| antibody | Goat anti-mouse polyclonal antibody | Jackson ImmunoResearch | 115-035-062 | Western blot secondary 1:10,000 dilution |
| recombinant DNA reagent | pWSK29 (“Vector”) | Wang and Kushner, 1991 | See “Materials and methods, Table 1” | |
| recombinant DNA reagent | pWSK129 (“Vector”) | Wang and Kushner, 1991 | See “Materials and methods, Table 1” | |
| recombinant DNA reagent | pDM001 (“FliCON”) | Miao et al., 2010a | See “Materials and methods, Table 1” | |
| recombinant DNA reagent | pTA007 (“BIDON”) | This paper | See “Materials and methods, Table 1” | |
| recombinant DNA reagent | pTA021 (“SspH1SS-HA”) | This paper | See “Materials and methods, Table 1” | |
| recombinant DNA reagent | pWSK229 (“CamR Vector”) | This paper | See “Materials and methods, Table 1” | |
| recombinant DNA reagent | pTA015 (“KanR FliCON”) | This paper | See “Materials and methods, Table 1” | |
| recombinant DNA reagent | pTA016 (“KanR BIDON”) | This paper | See “Materials and methods, Table 1” | |
| commercial assay or kit | Pierce ECL | ThermoFisher Scientific | 32106 | |
| commercial assay or kit | SuperSignal West Pico PLUS ECL | ThermoFisher Scientific | 34580 | |
| commercial assay or kit | SuperSignal West Femto ECL | ThermoFisher Scientific | 34095 | |
| commercial assay or kit | CytoTox 96 LDH assay | Promega | G1780 | |
| software, algorithm | Prism 9 | GraphPad | ||
| Other | Hoechst 33342 | ThermoFisher | H3570 | Immuno-flourescence, used at 2 µg/ml |
| Other | Propidium Iodide | Sigma-Aldrich | P4864 | Immuno-flourescence, used at 1 µg/ml |
| Other | NucView-488 | Biotium | 10402 | Immuno-flourescence, used at 5 µM |
Table 1
Plasmids.
| Plasmids | Alias | Resistance | Notes | Reference |
|---|---|---|---|---|
| pWSK29 | Vector | Amp | Low copy vector | Wang and Kushner, 1991 |
| pWSK129 | Vector | Kan | Low copy vector | Wang and Kushner, 1991 |
| pDM1 | FliCON | Amp | pWSK29 expressing fliC fliS from sseJ promotor | Miao et al., 2010a |
| pTA007 | BIDON or AmpR BIDON | Amp | pWSK29 expressing sspH1SS-HA-mBIDBH3 from sseJ promotor | This work |
| pTA021 | SspH1SS-HA | Amp | pWSK29 expressing sspH1SS-HA from sseJ promotor | This work |
| pWSK229 | CamR Vector | Cam | Low copy vector | This work |
| pTA015 | KanR FliCON | Kan | pWSK129 expressing fliC fliS from sseJ promotor | This work |
| pTA016 | KanR BIDON | Kan | pWSK129 expressing sspH1SS-HA-mBIDBH3 from sseJ promotor | This work |
Additional files
Download links
A two-part list of links to download the article, or parts of the article, in various formats.
Downloads (link to download the article as PDF)
Open citations (links to open the citations from this article in various online reference manager services)
Cite this article (links to download the citations from this article in formats compatible with various reference manager tools)
Apoptotic signaling clears engineered Salmonella in an organ-specific manner
eLife 12:RP89210.
https://doi.org/10.7554/eLife.89210.3


